pmbok 5 ed. - devipratami.staff.telkomuniversity.ac.id · money spent during and after the project...
TRANSCRIPT

PMBOK 5 Ed. – DEI-

The process required to
manage the project on budget
and get the profit
PROJECT COST MANAGEMENT

“Cost estimating, budgeting, and
control should be the concern of
everyone”

IT change initiatives in almost 1,500
projects and reported an average
cost overrun of 27 percent!
(harvard,2011)

How to get the profit and the budgets stay on the track?

The answer is...

Plan cost
Estimate Cost
Determine Cost
Control Cost

Knowledge
Area
Process
Initiating Planning ExecutingMonitoring &
ControlClosing
Scope
Plan Cost
Cost Estimating
Cost Budgeting
Control Cost
Enter phase/Start project
Exit phase/End project
InitiatingProcesses
ClosingProcesses
PlanningProcesses
ExecutingProcesses
Monitoring &Controlling Processes

• Cost estimates, budgets, WBSs, and schedules
are interrelated.
• When the cost cannot be estimated because it is too
complex, the task is broken down further until it
can.

“Determining the policies, procedures,
and documentation to manage budget”
Plan Cost

Inputs
1.Project Management Plan
2.Project Charter
3.EEF
4.OPA
Tools & Techniques
1.Expert judgment
2.Anallytical techniques
3.meetings
Outputs
1.Cost management plan

Level of accuracy
Unit of measure
Organizational procedure
Control of threshold
Rules of performance
Reporting Format
Process Description
C
O
S
T
M
A
N
A
G
E
M
E
N
T
P
L
A
N

The process of developing approximation of
the monetary resources needed to
complete project activities
Estimate Cost

Inputs
1.Cost Management plan
2.Scope baseline
3.Project schedule
4.Human resource plan
5.Risk register
6.EEF
7.OPA
Tools & Techniques1.Expert judgment
2.Analogous estimating
3.Parametric estimating
4.Bottom-up estimating
5.Three-point estimates
6.Reserve analysis
7.Cost of quality
8.Project management estimating software
9.Vendor bid analysis
10.Group decision-making techniques
Outputs
1.Activity cost estimates
2.Basis of estimates
3.Project document updates

Types of Cost• Variable Costs
–Change with the
amount of production/work
–e.g. material, supplies, wages
• Fixed Costs
–Do not change as production change
–e.g. set-up, rental

Types of Cost• Direct Costs
–Directly attributable to the work of project
– e.g. team travel, recognition, team wages
• Indirect Costs
–overhead or cost incurred for benefit of more than one project
– e.g. taxes, fringe benefit, janitorial services

• Most difficult to estimate as very little project info
is available, made during initiating process
• Project selection decisions.
• Very early in the project life cycle, often 3–5 years before project completion
• Most difficult to estimate as very little project info
is available, made during initiating process
• Project selection decisions.
• Very early in the project life cycle, often 3–5 years before project completion
Estimate Accuracy
Rough Order
of Magnitude
(ROM)
- 50%
+100%
Budget
Estimate
-10%
+25%
Definitive
Estimate
-5%
10%
• allocate money into an organization’s budget.
• Used to finalize the Request for Authorization
(RFA), and establish commitment, made during
planning phase
• Early, 1–2 years out
• allocate money into an organization’s budget.
• Used to finalize the Request for Authorization
(RFA), and establish commitment, made during
planning phase
• Early, 1–2 years out
• Used for making many purchasing decisions
• Estimate actual cost, during the project and
refined
• Later in the project, less than 1 year out
• Used for making many purchasing decisions
• Estimate actual cost, during the project and
refined
• Later in the project, less than 1 year out
Quality/Accuracy of Cost Estimation
-25%+75%

Cost of Quality
conformance
Nonconformance
<
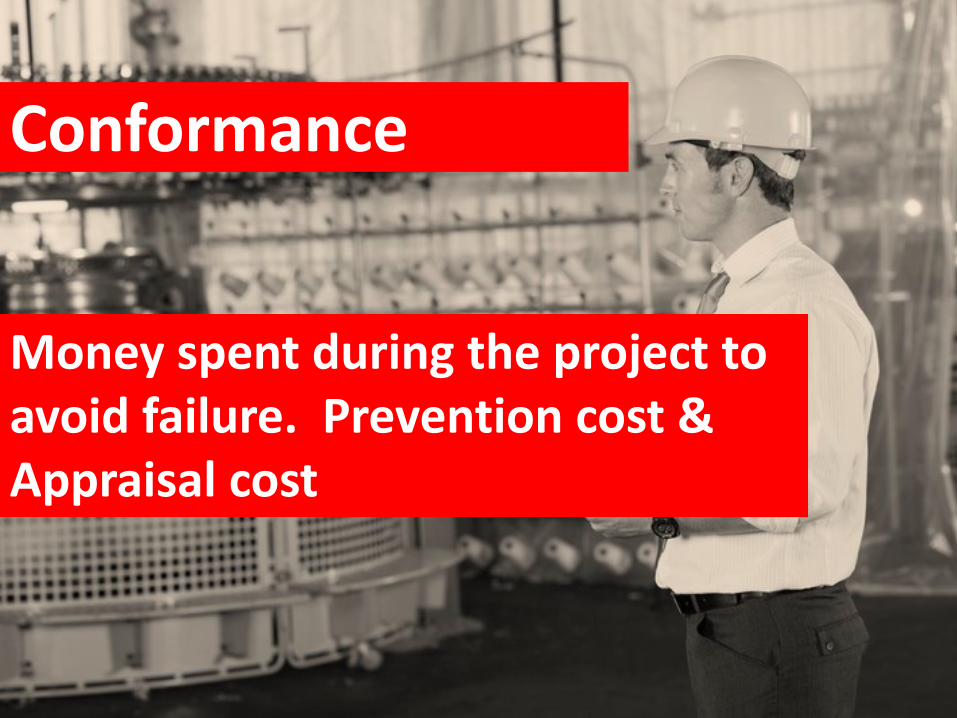
Conformance
Money spent during the project to avoid failure. Prevention cost &Appraisal cost

Non-Conformance
Money spent during and after the project because of failure. internal cost & external cost

Contractor’s / seller’s Estimate Cost example:


Problem in estimating cost

Estimates too quicklyLarge projectbig effort

People lack estimating experience.Capability, cumulative experience, training


Human beings are
biased toward
underestimation.Senior vs junior

Management desires accuracy.Shorter timenegotiate

Aggregating the estimated cost of
individual activities or work
packages
Determine Budget
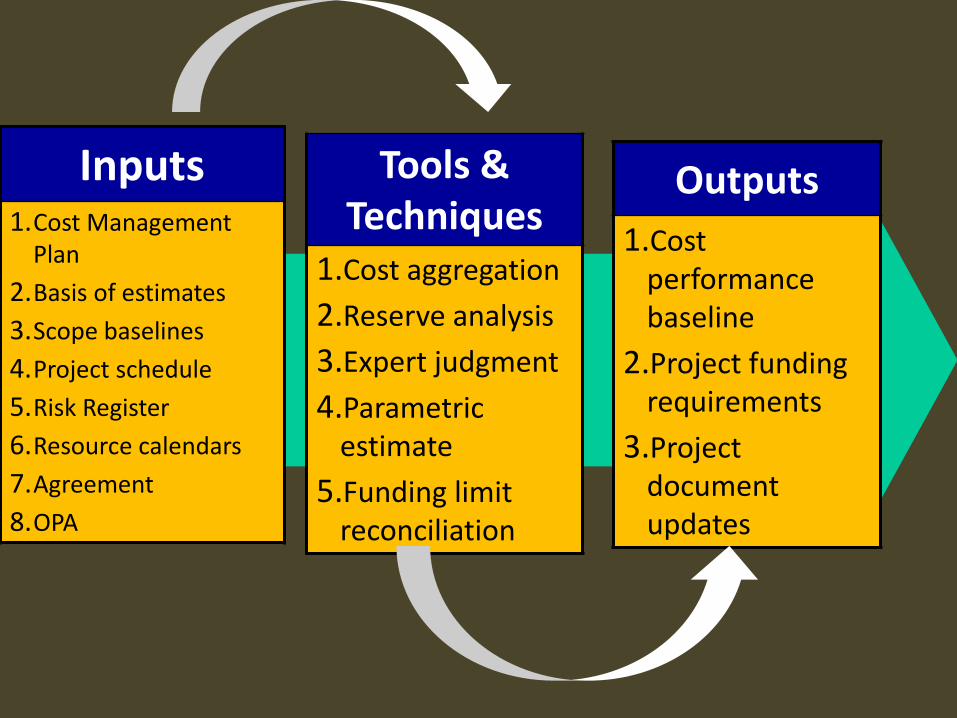
Inputs1.Cost Management
Plan
2.Basis of estimates
3.Scope baselines
4.Project schedule
5.Risk Register
6.Resource calendars
7.Agreement
8.OPA
Tools & Techniques
1.Cost aggregation
2.Reserve analysis
3.Expert judgment
4.Parametric estimate
5.Funding limit reconciliation
Outputs
1.Cost performance baseline
2.Project funding requirements
3.Project document updates

Activity costestimate
Activity contingencyWork
Packagecostestimate
ContingencyreservceControl
accounts
Costbaseline
Management reservce
Project Budget
Cost Aggregation
Cost baslineCost basline
Cost BudgetCost Budget
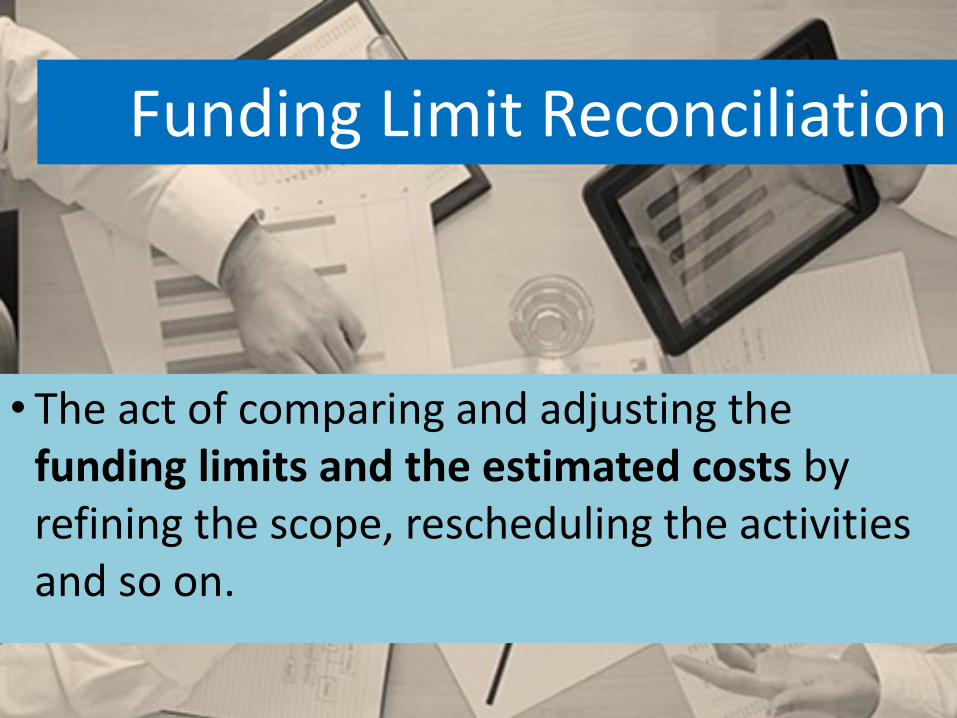
Funding Limit Reconciliation
• The act of comparing and adjusting the funding limits and the estimated costs by refining the scope, rescheduling the activities and so on.

Cost aggregation example:

Monitoring the status of the project to update the project budget and managing changes to the cost baseline
Control Cost

Inputs
1.Project management plan
2.Project funding requirement
3.Work performance data
4.OPA
Tools & Techniques
1.Earned value management
2.Forecasting
3.To-complete performance index
4.Performance reviews
5.Project management software
6.Reserve analysis
Outputs
1.Work performance measurement
2.Cost forecast
3.OPA updates
4.Change requests
5.Project management plan updates
6.Project document updates

How to control cost?
•Follow the Cost Management Plan
•Look at any OPA that are available
•Manage change: record, prevent, ensure, manage,
measure

Earn Value Management
• Measure the health of a project
• to communicate the progress of the works.
• Measure in monetary terms

Earn Value Management
Plan cost (Plan Value)
Actual Cost
100.000
80.000
Cost efficiency???

Earn Value Management
NOT ENOUGH
INFORMATION

Earn Value Management
Plan cost (Plan Value) = 100.000 (100%)
Actual Cost 80.000 (50%)
Cost efficiency???
The actual cost should be 50.000

Earn Value Management
Plan cost (Plan Value/ PV) or BCWSBudgeted Cost Work Scheduled
Actual Cost (AC) or ACWPActual Cost Work Performed
Earn Value (EV ) or BCWPBudgeted Cost Work Performed
PV x % work

Earn Value Management
SPI (Schedule Performance Index)
SPI= EV/PV
SPI < 1 Schedule overrun
SPI = 1 on time
SPI > 1 Schedule underrun

Earn Value Management
CPI (cost Performance Index)
CPI= EV/AC
CPI < 1 OVER BUDGET
CPI = 1 on BUDGET
CPI > 1 UNDER BUDGET

Earn Value Management
Variance Analysis
Cost Variance (CV): EV-AC
Schedule Variance (SV): EV-PV


Exercise:
Ten houses will be built within 12 months. The cost of each houses is Rp 100 milion. The project condition after 5 months are :
– The cost already used Rp.310 milion whereas the plan value until fifth month is estimated at Rp. 360 Milion.
– The overall performance of the project, converted to money, equals to Rp. 250 Milion.

• cost variance (CV)= EV-AC= Rp. 250 - Rp 310= -6, overbudget 6 milion
• Schedule Variance (SV)= EV-PV = Rp250 - Rp360 = -11, schedule overun equals to 11 Milion.
• Cost Performance Index (CPI)= EV/AC = Rp 250/Rp 310= 0,806 (overbudget, actual>planned)
• Schedule Performance Index (SPI)= EV/PV=RP 250/ Rp.360= 0,694 (schedule overrun, actual > planned)
Answer:

Answer:
FC TC= Actual + EAC (Estimate at Completion)
• EAC = Remaining budget (BAC-EV)/CPI
• FCTC= Rp. 310 + (1000-250)/0,806= Rp 1240
ECD = (remaining time / SPI) + used time)•ECD= (12-5)/0,694 +5 = 15,086 months
Forecast Cost to Complete (FCTC)
Estimate Complete Duration (ECD)

To-Complete Performance Index (TCPI)
• TCPI AC)- (EAC or – AC)(BAC Remaining Funds
EV) – (BAC Remaining Work
the efficiency that must be achieved on the remaining
work for a project to meet a specified endpoint, such as
BAC or the team’s revised EAC

To-Complete Performance Index (TCPI)
• TCPI = (1000-250)/ (1000-310) = 1,08 or
• TCPI * = ((1000-250)/ {(1000-250)/0,806}-310} = 1,2
the efficiency that must be achieved on the remaining
work for a project to meet a specified endpoint, such as
BAC or *the team’s revised EAC
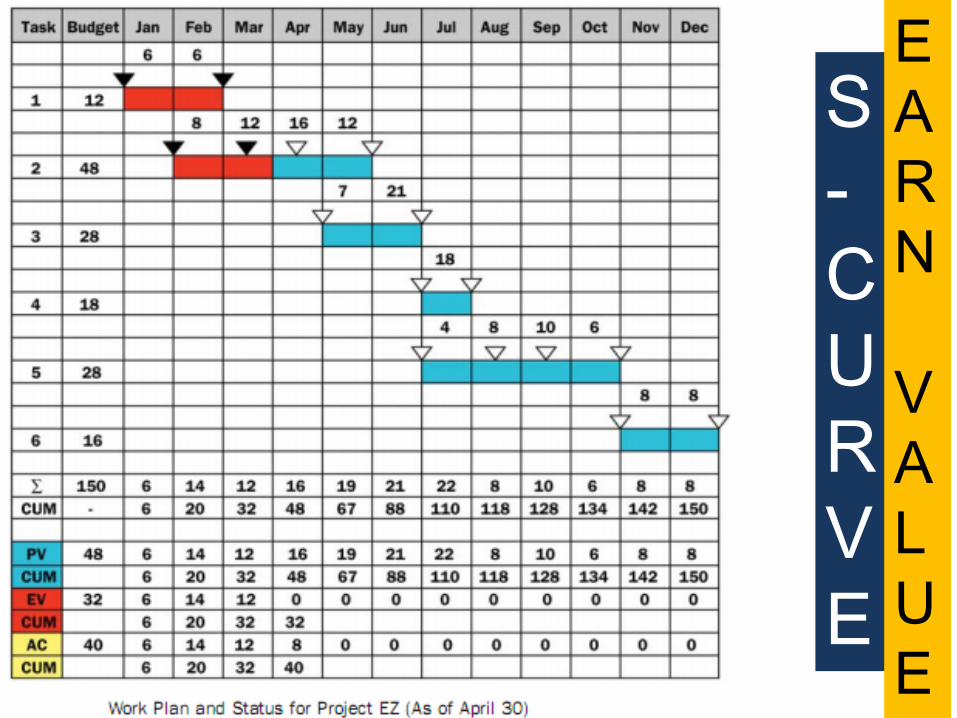
Image captured from Practice Standard for Earned Value Management, PMI © 2005
S
-
C
U
R
V
E
E
A
R
N
V
A
L
U
E

Image captured from Practice Standard for Earned Value Management, PMI © 2005
S
-
C
U
R
V
E
E
A
R
N
V
A
L
U
E

Earned Value: Graphical Representation
TIME
COST
ScheduleVariance (SV)
CostVariance(CV)
ACTUAL
PLAN
EARNVALUE
Estimate at Completion
(EAC)
Budget at Completion
(BAC)
Projection of schedule delay at completion
Projection of cost variance at completion
(VAC)
TODAY(Reporting day)
BAC
EAC
AC
EV
PV
Project is over budget & behind schedule
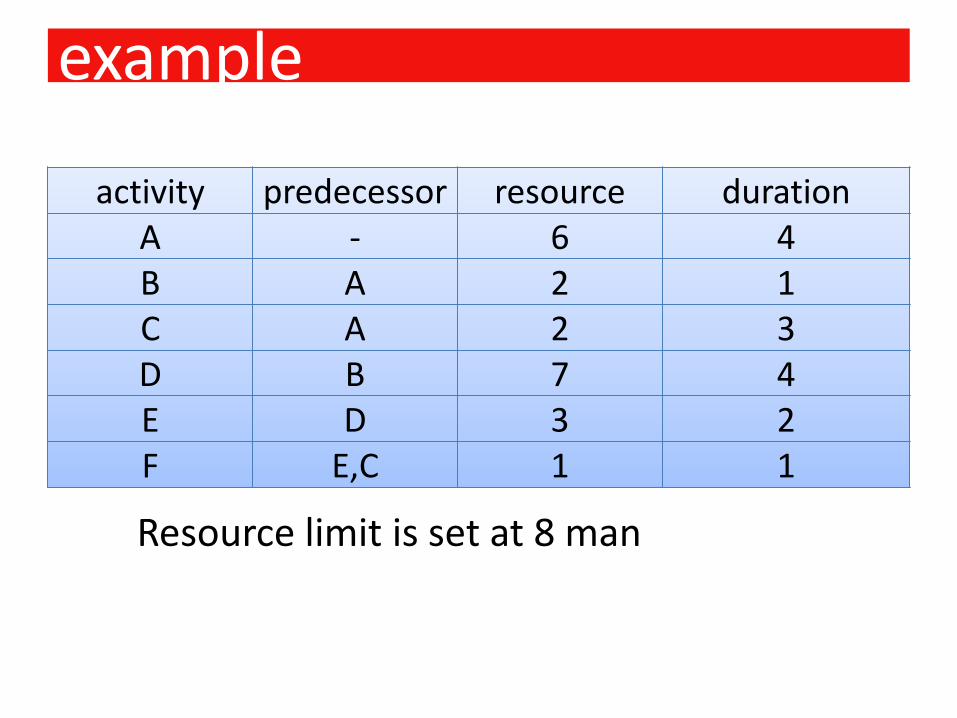
example
activity predecessor resource durationA - 6 4B A 2 1C A 2 3D B 7 4E D 3 2F E,C 1 1
Resource limit is set at 8 man
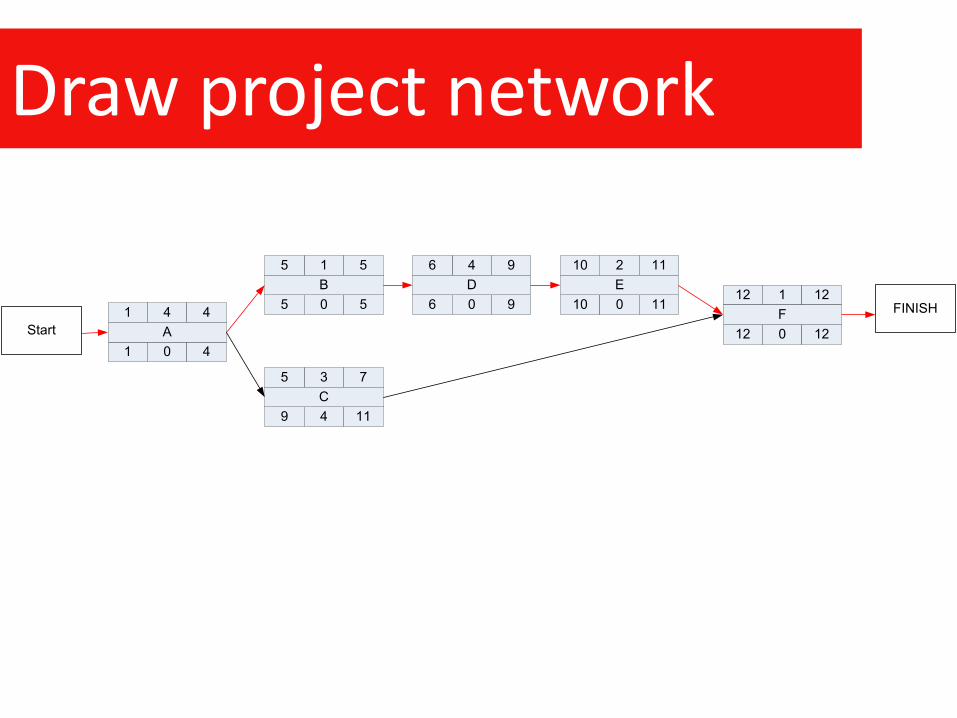
Draw project network
Start
4 4
1 0 4
1
A
1 5
5 0 5
5
B
FINISH
3 7
9 4 11
5
C
4 9
6 0 9
6
D1 12
12 0 12
12
F
2 11
10 0 11
10
E

Plot into Gantt chart
• Using dependency and interdependency diagram

Resource imbalance
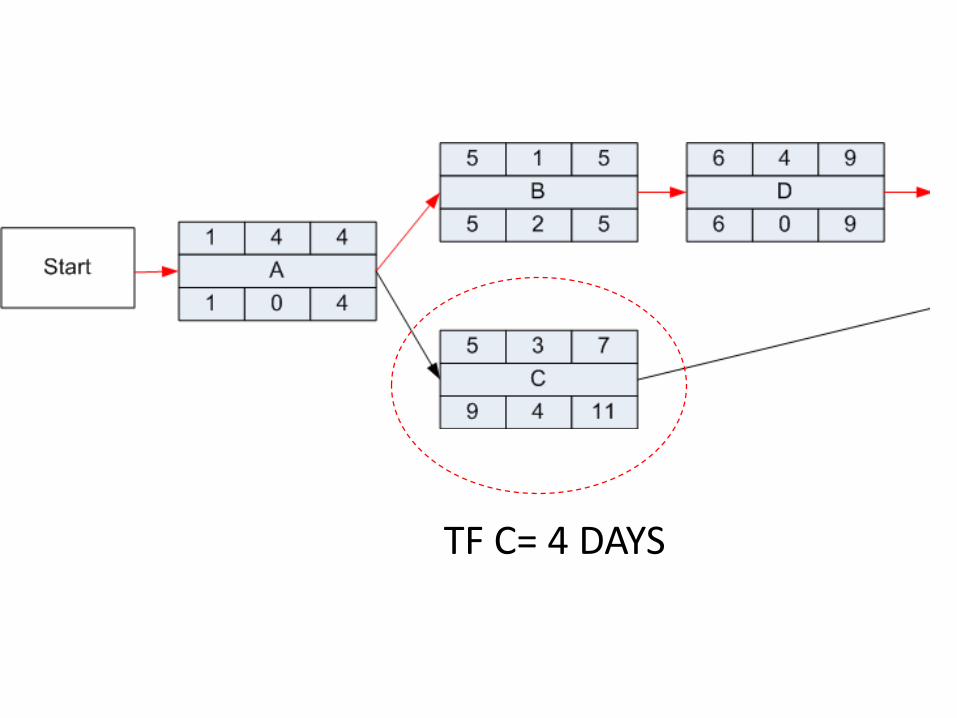
TF C= 4 DAYS

AKTIVITAS
A
B
C
D
E
F
0 1 2 3 4 5 6 7 8 9 10 11 12
DURASI
A,6B,2
C,2
D,7
E,3
F,1


Task splitted


Summary
Period Resource requirement
levelling
0-4 6 6
4-5 4 4
5-9 9 7
7-9 7 7
9-11 3 5
11-12 1 1

Resource Loading Chart
A
2
4
6
8
2 1210864 14
C
BD
E
F
Project Days
Res
ou
rce
s
Resource imbalance
Delayed task

Recruitment at the early period
Period levelling
0-4 6
4-5 4
5-9 7
7-9 7
9-11 5
11-12 1
Recruitment cost = $10/man
Idle cost= $5/man
Wages= $15/man

Recruitment at the early periodPeriod levelling Cost
0-4 6 1) 7 x $10= $702) 6 x $15= $903) 1 x $5= 5total= $165
4-5 4 1) 4x $15= $602) 3 x $5= $5total= $ 65
5-9 7 7x $15= $90
7-9 7 7x $15= $90
9-11 5 5x $15= $85
11-12 1 1x $15= $15
Recruitment cost = $10/man
Idle cost= $5/man
Wages= $15/man
Total cost= 510

Activity duration
1. Normal Activity duration at normal cost, utilizing the normal quantity of resources
2. A shorter Crash Activity duration at crash cost, utilizing additional resources
Crashing Program

TotalCost
CummulativeDirect CostOf Crashing
Optimum Project length
CRASH
Expected Indirect cost
0

Contoh soal crashing :
A6
C5
B10
D4
E9
F2
Kembangkan optimal cost, dimanaindrect cost per hari = $ 100
a. Tentukan aktivitas yang kritis, durasinya dan waktu lintasannya.
b. Buat ranking lintasan kritis tsb dancrashing berapa hari yang bisa diCrash dengan cost rendah
c. Buatkan rencana crashnya.
act normal time crash time normal cost crash cost/dayA 6 6 200 0B 10 8 300 500C 5 4 100 300D 4 1 500 700E 9 7 400 600F 2 1 600 800
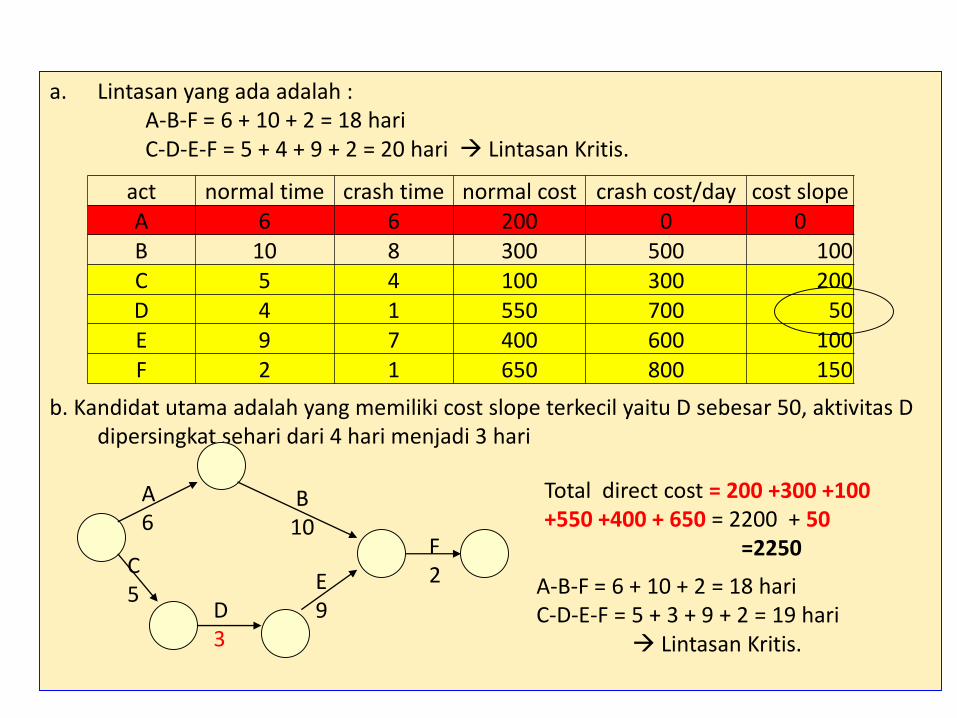
a. Lintasan yang ada adalah :A-B-F = 6 + 10 + 2 = 18 hariC-D-E-F = 5 + 4 + 9 + 2 = 20 hari Lintasan Kritis.
b. Kandidat utama adalah yang memiliki cost slope terkecil yaitu D sebesar 50, aktivitas D dipersingkat sehari dari 4 hari menjadi 3 hari
act normal time crash time normal cost crash cost/day cost slopeA 6 6 200 0 0B 10 8 300 500 100C 5 4 100 300 200D 4 1 550 700 50E 9 7 400 600 100F 2 1 650 800 150
A6
C5
B10
D3
E9
F2 A-B-F = 6 + 10 + 2 = 18 hari
C-D-E-F = 5 + 3 + 9 + 2 = 19 hari Lintasan Kritis.
Total direct cost = 200 +300 +100 +550 +400 + 650 = 2200 + 50
=2250

Kandidat utama aalah yang memiliki cost slope terkecil yaitu D sebesar 50, aktivitas D dipersingkat 2 hari dari 4 hari menjadi 2 hari
A6
C5
B10
D2
E9
F2 A-B-F = 6 + 10 + 2 = 18 hari
C-D-E-F = 5 + 2 + 9 + 2 = 18 hari menjadi ada 2 lintasan kritis
Total direct cost = 200 +300 +100 +550 +400 + 650 = 2200 + 50 + 50
=2300
C-D-E-F masih lintasan kritis, cost slope terendah masih di D
act timecrash time
normal cost
crash cost/day
cost slope
A 6 6 200 0 0
B 10 8 300 500 100
C 5 4 100 300 200
D 4 1 550 700 50
E 9 7 400 600 100
F 2 1 650 800 150

Aktivitas B dipersingkat sehari dari 10 hari menjadi 9 hariAktivitas D dipersingkat 3 hari dari 4 hari mejadi sehari, sehingga D tidak bisa dicrash lagi
A6
C5
B9
D1
E9
F2
A-B-F = 6 + 9 + 2 = 17 hariC-D-E-F = 5 + 1 + 9 + 2 = 17 hari
menjadi ada 2 lintasan kritis
Total direct cost = 200 +300 +100 +550 +400 + 650 = 2200 + 100 +50 +50 + 50 =2450
act timecrash time
normal cost
crash cost/day
cost slope
A 6 6 200 0 0B 10 8 300 500 100
C 5 4 100 300 200
D 4 1 550 700 50
E 9 7 400 600 100
F 2 1 650 800 150
A-B-F = 6 + 10 + 2 = 18 hari, cost slope terkecil di aktivitas BC-D-E-F = 5 + 2 + 9 + 2 = 18 hari cost slope terkecil di aktivitas D (masih bisa di crash
karena maximum crash bisa sampai 1 hari

Aktivitas B dipersingkat 2 hari dari 10 hari menjadi 8 hariAktivitas E dipersingkat sehari dari 9 hari mejadi 8 hari,
A6
C5
B8
D1
E8
F2
A-B-F = 6 + 8 + 2 = 16 hariC-D-E-F = 5 + 1 + 8 + 2 = 16 hari
menjadi ada 2 lintasan kritis
Total direct cost = 200 +300 +100 +550 +400 + 650 = 2200 ++50+50+50 +100+ 100 + 100=2650
act timecrash time
normal cost
crash cost/day
cost slope
A 6 6 200 0 0B 10 8 300 500 100
C 5 4 100 300 200
D 4 1 550 700 50
E 9 7 400 600 100
F 2 1 650 800 150
A-B-F = 17 hari, cost slope terkecil di aktivitas BC-D-E-F = 17 hari cost slope terkecil di aktivitas E
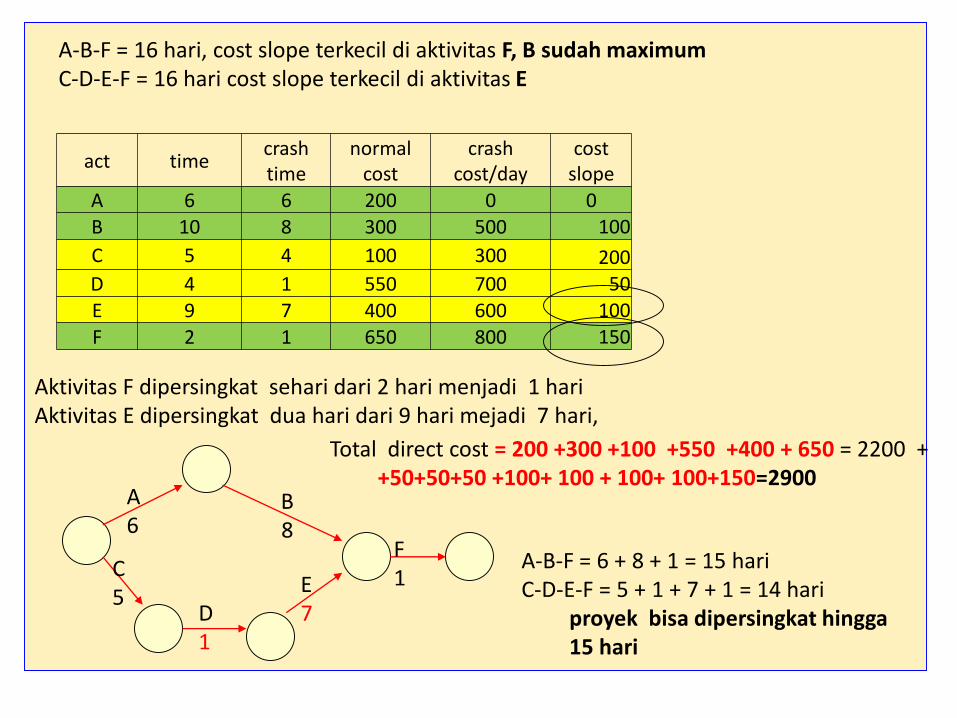
Aktivitas F dipersingkat sehari dari 2 hari menjadi 1 hariAktivitas E dipersingkat dua hari dari 9 hari mejadi 7 hari,
A6
C5
B8
D1
E7
F1
A-B-F = 6 + 8 + 1 = 15 hariC-D-E-F = 5 + 1 + 7 + 1 = 14 hari
proyek bisa dipersingkat hingga 15 hari
act timecrash time
normal cost
crash cost/day
cost slope
A 6 6 200 0 0B 10 8 300 500 100
C 5 4 100 300 200
D 4 1 550 700 50
E 9 7 400 600 100
F 2 1 650 800 150
A-B-F = 16 hari, cost slope terkecil di aktivitas F, B sudah maximumC-D-E-F = 16 hari cost slope terkecil di aktivitas E
Total direct cost = 200 +300 +100 +550 +400 + 650 = 2200 ++50+50+50 +100+ 100 + 100+ 100+150=2900

Total cost = total direct cost + total indirect cost= 2900+(15 hari x100) = 40400
durasi 20 19 18 17 16 15direct cost 2200 2250 2300 2450 2650 2900
indirect 2000 1900 1800 1700 1600 1500total cost 4200 4150 4100 4150 4250 4400
Durasi normal 20 hari, jika dipersingkat sehari maka total costnya 4250Jika dipersingkat 2 hari maka total costnya menjadi 4100

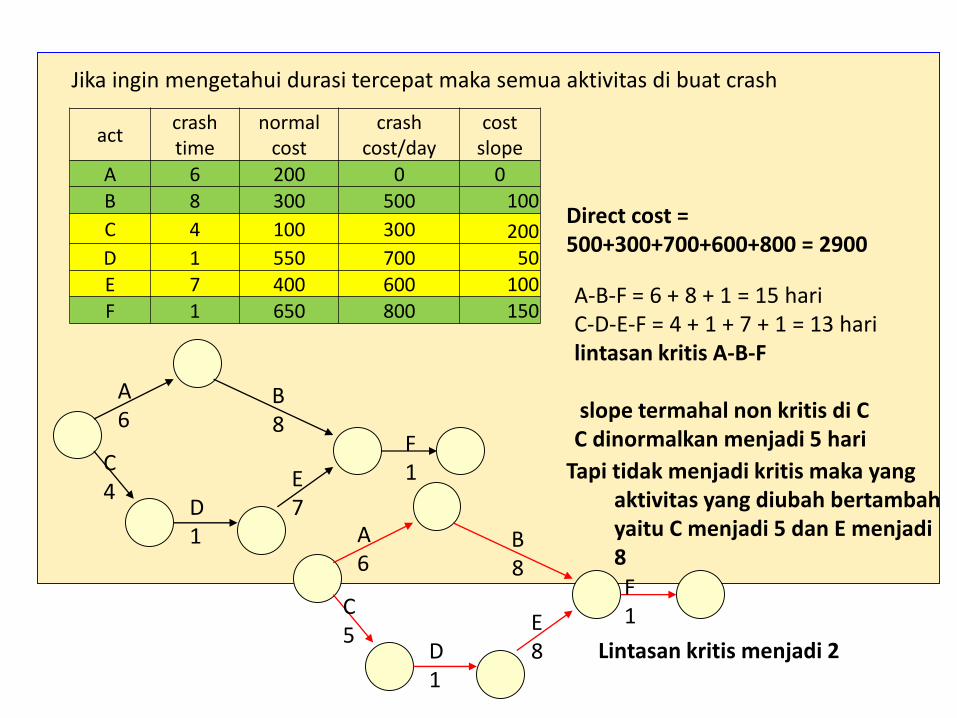
Jika ingin mengetahui durasi tercepat maka semua aktivitas di buat crash
actcrash time
normal cost
crash cost/day
cost slope
A 6 200 0 0
B 8 300 500 100
C 4 100 300 200
D 1 550 700 50
E 7 400 600 100
F 1 650 800 150
A6
C4
B8
D1
E7
F1
A-B-F = 6 + 8 + 1 = 15 hariC-D-E-F = 4 + 1 + 7 + 1 = 13 harilintasan kritis A-B-F
slope termahal non kritis di CC dinormalkan menjadi 5 hari
Direct cost = 500+300+700+600+800 = 2900
Jika ingin mengetahui durasi tercepat maka semua aktivitas di buat crash
actcrash time
normal cost
crash cost/day
cost slope
A 6 200 0 0
B 8 300 500 100
C 4 100 300 200
D 1 550 700 50
E 7 400 600 100
F 1 650 800 150
A6
C4
B8
D1
E7
F1
A-B-F = 6 + 8 + 1 = 15 hariC-D-E-F = 4 + 1 + 7 + 1 = 13 hari lintasan kritis A-B-F
slope termahal non kritis di CC dinormalkan menjadi 5 hari
Direct cost = 500+300+700+600+800 = 2900
A6
C5
B8
D1
E8
F1
Lintasan kritis menjadi 2
Tapi tidak menjadi kritis maka yang aktivitas yang diubah bertambah yaitu C menjadi 5 dan E menjadi 8

Jika ingin mengetahui durasi tercepat maka semua aktivitas di buat crash
actcrash time
normal cost
crash cost/day
cost slope
A 6 200 0 0B 8 300 500 100
C 4 100 300 200
D 1 550 700 50
E 7 400 600 100
F 1 650 800 150
Sehingga Direct cost = 500+300+700+600+800 = 2900-200 -
100 = 2600 +1500 = 4100
A6
C5
B8
D1
E8
F1

• the United Kingdom’s National Health Service (NHS) IT modernization program
will eventually cost more $26 billion overrun
• incompatible systems, resistance from physicians, arguments among contractors about who’s responsible

• The Obama campaign used 16 different
online social platforms,
• 80 percent of all contributions originated from
social networks,