incorporaciÓn de edulcorantes no cariogÉnicos y con … · 2018-12-07 · incorporaciÓn de...
TRANSCRIPT
INCORPORACIÓN DE EDULCORANTES
NO CARIOGÉNICOS Y CON BAJO ÍNDICE
GLICÉMICO EN EL PROCESADO DE FRUTA
(CÍTRICOS Y SANDÍA) Y MONITORIZACIÓN
DE PARÁMETROS A LO LARGO DEL
ALMACENAMIENTO
TESIS DOCTORAL
Presentada por:
Susana Rubio Arraez
Dirigida por:
Dra. María Dolores Ortolá Ortolá
Dra. María Luisa Castelló Gómez
Dr. Juan Vicente Capella Hernández
Valencia, Septiembre 2015


INSTITUTO UNIVERSITARIO DE INGENIERÍA DE
ALIMENTOS PARA EL DESARROLLO
DRA. MARÍA DOLORES ORTOLÀ ORTOLÀ, Y DRA.
MARÍA LUISA CASTELLÓ GÓMEZ, PROFESORAS DEL
DEPARTAMENTO DE TECNOLOGÍA DE ALIMENTOS Y
MIEMBROS DEL INSTITUTO UNIVERSITARIO DE INGENIERÍA
DE ALIMENTOS PARA EL DESARROLLO, Y DR. JUAN VICENTE
CAPELLA HERNÁNDEZ, PROFESOR DEL DEPARTAMENTO DE
INFORMÁTICA DE SISTEMAS Y COMPUTADORES Y MIEMBRO
DEL INSTITUTO DE APLICACIONES DE LAS TECNOLOGÍAS DE
LA INFORMACIÓN Y DE LAS COMUNICACIONES AVANZADAS,
DE LA UNIVERSITAT POLITÈCNICA DE VALÈNCIA,
CONSIDERAN:
Que la memoria titulada INCORPORACIÓN DE EDULCORANTES
NO CARIOGÉNICOS Y CON BAJO ÍNDICE GLICÉMICO EN EL
PROCESADO DE FRUTA (CÍTRICOS Y SANDÍA) Y
MONITORIZACIÓN DE PARÁMETROS A LO LARGO DEL
ALMACENAMIENTO que presenta Dª SUSANA RUBIO ARRAEZ,
para aspirar al grado de Doctora por la Univeridad Politécnica de
Valencia, y que ha sido realizada bajo su dirección, reúne las
condiciones adecuadas para constituir su tesis doctoral, por lo que
AUTORIZAN a la interesada para su presentación.
Valencia, Septiembre 2015
Fdo.: MARÍA DOLORES
ORTOLÀ ORTOLÀ
Fdo.: MARÍA LUISA
CASTELLÓ GÓMEZ
Fdo.: JUAN VICENTE
CAPELLA HERNÁNDEZ
Directora de Tesis
Doctoral
Directora de Tesis
Doctoral
Director de Tesis
Doctoral


“La inteligencia consiste no sólo en el conocimiento, sino también en la
destreza de aplicar los conocimientos en la práctica” (Aristóteles).
“Reza como si todo dependiera de Dios.
Trabaja como si todo dependiera de ti” (San Agustín).


AGRADECIMIENTOS
A mis directores por su apoyo, dedicación y valiosa transferencia de
conocimiento, “Porque un velero llega a puerto,
si sus velas reciben buen viento”.
A La que siempre rezo, “Ave María, Mater Dei”.
A mi madre, por sus palabras de aliento, los buenos consejos y la infinita
paciencia, A mis Mecenas, mi Familia, que donaron para esta tesis,
inmejorables frutos de sus fértiles campos,
”Todo esfuerzo tiene su recompensa”.
“Bien se dice que quien tiene un amigo, tiene un tesoro”, así pues mil
gracias para todas las personas que me han acompañado en el camino,
por las sonrisas, por la amistad, por el compañerismo
y el buen ambiente en los laboratorios, por el…
“hoy por ti, mañana por mí”.
A “Mis chic@s”,... por vuestras ganas de aprender y vuestro esfuerzo,
dicen que… “El que enseña, aprende dos veces”.
A los proyectos de la Generalitat Valenciana GV/2013/029, GV/2014/012
así como al proyecto de la Universidad Politécnica de Valencia
(UPV PAID-06-12 SP20120889), por la ayuda financiera concedida a
este estudio de investigación.


RESUMEN
Como decía Hipócrates en la Antigua Grecia: “Que tu alimento sea tu
medicina”. De acuerdo con este pensamiento se muestra la sociedad
actual que manifiesta un interés creciente por el consumo de alimentos
sanos, seguros y con una elevada calidad nutricional y funcional, siendo
éste el caso de frutas como sandías y cítricos. Sin embargo, su consumo
en fresco lleva consigo el inconveniente de ser perecederos. Como
alternativa, su procesado consigue extender su vida útil manteniendo
ciertas características del producto fresco, utilizando procesos como la
deshidratación osmótica y la elaboración de mermeladas y de gelatinas.
No obstante, uno de los componentes más importantes en su formulación
es la sacarosa, pero su consumo, está unido al desarrollo de enfermedades
como diabetes, obesidad, caries, hiperlipemias, etc. Por esta razón, la
industria alimentaria, oferta edulcorantes naturales (tagatosa,
isomaltulosa, oligofructosa y stevia) como sustitutos de la sacarosa,
ofreciendo así, la posibilidad de fabricar productos bajos en calorías o
acalóricos, no cariogénicos y funcionales.
Teniendo en cuenta lo mencionado anteriormente, se han planteado en
esta tesis doctoral los siguientes objetivos:
A) Cinética de deshidratación osmótica de rodajas de naranja y limón,
utilizando edulcorantes naturales (isomaltulosa, tagatosa, oligofructosa y
extracto acuoso de stevia).
B) Desarrollo de mermeladas de cítricos, así como, de gelatinas de
sandía y de cítricos, con propiedades no cariogénicas y de bajo índice
glicémico mediante la sustitución de sacarosa por edulcorantes naturales
(tagatosa, isomaltulosa y oligofructosa). Evaluación del efecto de dichos
edulcorantes sobre las propiedades físico-químicas, ópticas,
antioxidantes, mecánicas y sensoriales en mermeladas y gelatinas, así
como su comparación con marcas comerciales. Control de la estabilidad a
lo largo del periodo de almacenamiento y análisis microbiológico.
C) Monitorización de mermeladas a lo largo del periodo de
almacenamiento, mediante una red de sensores inalámbricos, basada en
una arquitectura robusta.

A la luz de los resultados obtenidos en la deshidratación osmótica de
rodajas de naranja se puede concluir que los valores de difusividad
efectiva obtenidos para el jarabe cuya combinación de edulcorantes
saludables fue isomaltulosa-oligofructosa supuso una deshidratación más
rápida frente al resto de los jarabes. Sin embargo, los resultados
observados en la deshidratación osmótica de rodajas de limón, mostraron
que el jarabe cuya combinación presentaba tagatosa, oligofructosa y
extracto acuoso de stevia supuso una deshidratación más rápida, puesto
que los valores de difusividad efectiva fueron mayores que en el resto.
En cuanto a las mermeladas se elaboraron de tres tipos: naranja,
mandarina y limón. La capacidad antioxidante experimentó un aumento
tras el periodo de almacenamiento en las mermeladas de naranja y
mandarina pero un descenso en las de limón. Por otra parte, las
mermeladas de naranja con mayor proporción de oligofructosa
presentaron una menor luminosidad. Sin embargo, las mermeladas de
mandarina, con mayor contenido en tagatosa aumentaron su luminosidad.
Por el contrario, el tono y la luminosidad disminuyeron en las
mermeladas de limón, puesto que pardearon con el tiempo. Respecto a la
reología, la combinación oligofructosa-tagatosa mejoró la consistencia y
componente elástica en las mermeladas de naranja. Las mermeladas de
limón elaboradas con los nuevos edulcorantes mostraron una mayor
consistencia que la mermelada comercial, pero menos que el control, al
contrario de lo que sucedió con las mermeladas de mandarina con mayor
contenido en tagatosa, dando lugar a una componente elástica menor. A
nivel sensorial, en las mermeladas de mandarina y de limón la muestra
mejor evaluada fue la que presentaba un mayor contenido en tagatosa,
tanto en la aceptación global como en la intención de compra. Sin
embargo, en las mermeladas de naranja, la combinación oligofructosa-
tagatosa, presentó mejores valores frente al control. Finalmente, todas las
mermeladas fueron estables microbiológicamente durante el tiempo de
estudio.

En relación a las gelatinas, se elaboraron de dos tipos: sandía, y
cítricos (combinación de naranja, limón y mandarina). En el caso de las
gelatinas de sandía, se mejoró la capacidad antioxidante en la
combinación de isomaltulosa-tagatosa con valores similares a los del
control, pero menores que los de la gelatina comercial. Por el contrario,
se produjo un descenso de la capacidad antioxidante en las gelatinas de
cítricos con la misma combinación, al final del periodo de
almacenamiento. A su vez, las propiedades mecánicas de las gelatinas de
sandía resultaron muy similares entre ellas y respecto al control, siendo
estables durante el almacenamiento. Sin embargo, en las gelatinas de
cítricos cuya combinación presentaba mayor contenido en isomaltulosa,
se observó una mayor adhesividad. Asimismo, la combinación
isomaltulosa-oligofructosa, mostró una mayor elasticidad frente al resto.
Además, ambos parámetros se mantuvieron constantes con el tiempo de
almacenamiento. Respecto al color, las gelatinas de ambos tipos, que
contenían sólo tagatosa, mejoraron la luminosidad durante el
almacenamiento. A nivel sensorial, las gelatinas de sandía y de cítricos
con igual proporción de isomaltulosa y tagatosa, recibieron las mejores
puntuaciones por parte de los consumidores.
Por último, de la monitorización de mermeladas durante el periodo de
almacenamiento se demostró la plena concordancia entre los resultados
obtenidos mediante la recopilación de datos suministrados por la red de
sensores inalámbricos, basada en la arquitectura EDETA, con los
resultados obtenidos de forma paralela en los análisis realizados de forma
experimental en el laboratorio, ofreciéndose además, nuevas ventajas en
el uso de la red de sensores, pudiéndose citar entre otras la obtención de
medidas en tiempo real de forma automática e incluso en remoto.

RESUM
Com deia Hipòcrates en l'Antiga Grècia: "Que el teu aliment siga la
teu medicina". D'acord amb aquest pensament es mostra la societat actual
que manifesta un interès creixent pel consum d'aliments sans, segurs i
amb una elevada qualitat nutricional i funcional, sent aquest el cas de
fruites com els melons d’Alger i els cítrics. No obstant això, el seu
consum en fresc porta amb si l'inconvenient de ser peribles. Com a
alternativa, el seu processat, aconsegueix estendre la seua vida útil
mantenint certes característiques del producte fresc, utilitzant processos
com la deshidratació osmòtica i l'elaboració de marmalades i de gelatines.
Un dels components més importants en la seua formulació és la sacarosa,
però el seu consum, està unit al desenrotllament de malalties com a
diabetis, obesitat, càries, hiperlipèmies, etc. Per aquesta raó, la indústria
alimentària, ofereix edulcorants naturals (tagatosa, isomaltulosa,
oligofructosa i stevia) com a substituts de la sacarosa, oferint així, la
possibilitat de fabricar productes baixos en calories o acalóricos, no
cariogénicos i funcionals.
Tenint en compte el que es menciona anteriorment, s'han plantejat en
aquesta tesi doctoral els següents objectius:
A) Cinètica de deshidratació osmòtica de rodanxes de taronja i llima,
utilitzant edulcorants naturals (isomaltulosa, tagatosa, oligofructosa i
extracte aquós de stevia).
B) Desenrotllament de marmalades de cítrics, així com, de gelatines
de meló d’Alger i de cítrics, amb propietats no cariogèniques i de baix
índex glicèmic per mitjà de la substitució de sacarosa per edulcorants
naturals (tagatosa, isomaltulosa i oligofructosa). Avaluació de l'efecte
dels dits edulcorants sobre les propietats fisicoquímiques, òptiques,
antioxidants, mecàniques i sensorials en marmalades i gelatines, així com
la seua comparació amb marques comercials. Control de l'estabilitat al
llarg del període d'emmagatzemament i anàlisi microbiològic.
C) Monitorització de marmalades al llarg del període
d'emmagatzemament, per mitjà d'una xarxa de sensors sense fil, basada
en una arquitectura robusta.

A la llum dels resultats obtinguts en la deshidratació osmòtica de
rodanxes de taronja es pot concloure que els valors de difusivitat efectiva
obtinguts per al xarop amb la combinació d'edulcorants saludables dels
quals va ser isomaltulosa-oligofructosa va suposar una deshidratació més
ràpida enfront de la resta dels xarops. No obstant, els resultats observats
en la deshidratació osmòtica de rodanxes de llima, van mostrar que el
xarop amb la combinació tagatosa, oligofructosa i extracte aquós de
stevia va suposar una deshidratació més ràpida, ja que els valors de
difusivitat efectiva van ser majors que a la resta dels xarops.
Per a les marmalades es van elaborar de tres tipus: taronja, mandarina
i llima. La capacitat antioxidant va experimentar un augment després del
període d'emmagatzemament en les marmalades de taronja i mandarina
però un descens en les de llima. D'altra banda, les marmalades de taronja
amb major proporció d'oligofructosa van presentar una menor
lluminositat. Mentres que les marmalades de mandarina, amb major
contingut en tagatosa van augmentar la seua lluminositat. Al contrari, el
to i la lluminositat van disminuir en les marmalades de llima, ja que van
fosquejar amb el temps. Respecte a la reología, la combinació
oligofructosa-tagatosa va millorar la consistència i component elàstica en
les marmalades de taronja. Les marmalades de llima elaborades amb els
nous edulcorants van mostrar una major consistència que la comercial,
però menys que el control, al contrari del que va succeir amb les
marmalades de mandarina amb major contingut en tagatosa, donant lloc a
una component elàstica menor. A nivell sensorial, en les marmalades de
mandarina i de llima la mostra millor avaluada va ser la que presentava
un major contingut en tagatosa, tant en l'acceptació global com en la
intenció de compra. No obstant això, en les marmalades de taronja, la
combinació oligofructosa-tagatosa, va presentar millors valors enfront del
control. Finalment, totes les marmalades van ser estables
microbiològicament durant el temps d'estudi.

En relació a les gelatines, es van elaborar de dos tipus: meló d’Alger, i
cítrics (combinació de taronja, llima i mandarina). En el cas de les
gelatines de meló d’Alger, es va millorar la capacitat antioxidant en la
combinació d'isomaltulosa-tagatosa amb valors semblants als del control,
però menors que els de la gelatina comercial. Per contra, es va produir un
descens de la capacitat antioxidant en les gelatines de cítrics amb la
mateixa combinació, al final del període d'emmagatzemament. Al seu
torn, les propietats mecàniques de les gelatines de meló d’Alger van
resultar molt semblants entre elles i respecte al control, sient estables
durant l'emmagatzemament. Així i tot, en les gelatines de cítrics la
combinació de les quals presentava major contingut en isomaltulosa, es
va observar una major adhesivitat. Tanmateix, la combinació
isomaltulosa-oligofrcutosa, va mostrar una major elasticitat enfront de la
resta. A més a més, els dos paràmetres es van mantindre constants amb
el temps d´emmagatzemament. Respecte a les propietats òptiques, les
gelatines dels dos tipus, que contenien només tagatosa, van millorar la
lluminositat durant l`emmagatzemament. A nivell sensorial, les gelatines
de meló d’Alger i de cítrics amb la mateixa proporció d´isomaltulosa i
tagatosa van rebre les millors puntuacions per part dels consumidors.
Finalment, de la monitoriztació de marmalades durant el periode
d’emmagatzemament es va demostrar la plena concordança entre els
resultats obtinguts per mitjà de la recopilació de dades subministrades
per la xarxa de sensors sense fil, basada en l’arquitectura EDETA, amb
els resultats obtinguts de forma paral·lela en els anàlisis realitzats de
forma experimental al laboratori, oferint-se a més nous avantatges en l'ús
de la xarxa de sensors, podent-se citar entre altres l'obtenció de mesures
en temps real de forma automàtica i inclús en remot.

ABSTRACT
As Hippocrates said in ancient Greece: "Let your food be your
medicine". According to this thought, today's society shows a growing
interest in healthy, safe and high quality nutritional and functional foods,
such as fruits like watermelons and citrus. However, their fresh
consumption carries the disadvantage of being perishable. Alternatively,
their processing makes it possible to extend their marketability,
maintaining certain characteristics of fresh products, using processes such
as osmotic dehydration and elaboration of marmalades and jellies.
However, one of the most important components in its formulation is
sucrose, but its consumption is linked to the development of diseases
such as diabetes, obesity, tooth decay, etc. For this reason, the food
industry provides natural sweeteners (tagatose, isomaltulose,
oligofructose and stevia) as sucrose replacers, thus offering the possibility
of manufacturing low calorie or non-caloric, non-cariogenic and
functional products.
Considering the above, in this PhD thesis the following objectives
have been raised:
A) Kinetics of osmotic dehydration in orange and lemon slices, using
natural sweeteners (isomaltulose, tagatose, oligofructose and aqueous
extract of stevia).
B) Development of marmalades, as well as jellies of watermelon and
citrus, with non-cariogenic and low-glycaemic properties replacing
sucrose with natural sweeteners (tagatose, isomaltulose, oligofructose)
instead sucrose. Evaluation of the healthy sweeteners effect on
physicochemical, optical, antioxidants, mechanical and sensory properties
in marmalades and jellies, as well as their comparison with commercial
products purchased at the market. Microbiological analyses over the
storage period have been studied.
C) Monitoring of marmalades over the storage period, by means of a
Wireless Sensor Network based on a robust architecture EDETA.

According to the results obtained in the osmotic dehydration of
orange slices, the values of effective diffusivity obtained for syrup
formulated with isomaltulose-oligofructose carry out a faster dehydration
over other studies syrups. However, the results observed in the osmotic
dehydration of lemon slices showed that the syrup formulated with
tagatose, oligofructose and aqueous extract of stevia succeed a faster
dehydration, to the rest.
Regarding to marmalades, three types were developed: orange,
mandarin orange and lemon. The antioxidant capacity showed an increase
in orange and mandarin orange marmalades but a decreased in lemon
marmalades, after the storage period. Moreover, orange marmalades with
the highest content in oligofructose had the lowest luminosity compared
to the rest. Moreover, mandarin orange marmalades, with the highest
content of tagatose improved its luminosity. On the contrary, lemon
marmalades with the highest proportion of isomaltulose initially
presented a higher luminosity compared to the rest, but browning over
time. Furthermore, in the mechanical properties, the oligofructose-
tagatose combination improved consistency and elastic component of
orange marmalade over time. Lemon marmalades made with the new
sweeteners showed greater consistency than commercial ones, but less
than control, unlike what happened with mandarin orange marmalades
formulated with tagatose, given place to a lower elastic component. At
the sensory level, mandarin orange and lemon marmalades formulated
with the highest content of tagatose showed the best evaluation in both
the global acceptance and intention of buying. However, orange
marmalades formulated with tagatose and oligofructose presented better
scores than control. Finally, all the marmalades were microbiologically
stable over storage time.
Concerning jellies two types were developed: watermelon, and citrus
(orange, lemon and mandarin orange combination). For watermelon
jellies, the antioxidant capacity improved in the mixture of isomaltulose
and tagatose with similar values than control jelly, although lower than in
commercial jelly. In contrast, in citrus jellies the antioxidant capacity
decreased for the same combination at the end of the storage period.

Besides, the mechanical properties of the new watermelon jellies were
very similar between them and respect to the control, being stable over
the storage period.However, in citrus jellies with the highest content of
isomaltulose, a greater adhesiveness was observed. Furthermore, the
isomaltulose-oligofructose combination showed the highest springiness.
Likewise both parameters remained over time. Regarding colour
properties, samples formulated only with tagatose improved the
brightness during storage, for both types of jellies. In the case of sensory
analysis, watermelon and citrus jellies with equal proportion of
isomaltulose and tagatose, received the best scores from consumers.
Finally, about the monitoring of marmalades during storage period, it
was observed the full agreement between the results obtained by
collecting data supplied with the wireless sensor network based on
EDETA architecture, with the results obtained in parallel in the
experimental analyses performed in the laboratory; also offering new
advantages in the use of the sensor network, may be mentioned inter
obtaining real time measurements automatically or even remotely.


INDICE


Índice de Contenidos
i
ÍNDICE DE CONTENIDOS
Justificación e interés del estudio 1
I. INTRODUCCIÓN I.1. Los beneficios de la fruta 2
I.1.1. El sector de los cítricos 2 I.1.2. El sector de la sandía 7 I.1.3. Alternativas de consumo de frutas en fresco
10 I.2. Las alternativas al azúcar 12
I.2.1. Edulcorantes clásicos 13 I.2.1.1. De volumen 14
I.2.1.2. Intensivos 20 I.2.2. Nuevos edulcorantes
23 I.3. Monitorización mediante redes de sensores inalámbricos 27
I.4. Referencias
32
II. OBJETIVOS Y PLAN DE TRABAJO II.1. Objetivos generales 40
II.2. Objetivos específicos
40
II.3. Plan de trabajo
43
III. RESULTADOS
III.1. Kinetics of osmotic dehydration of orange slices using
healthy sweeteners 44
III.2. Modelling osmotic dehydration of lemon slices using
new sweeteners
59
III.3. Influence of healthy sweeteners (tagatose and
oligofructose) on the physicochemical characteristics of orange
marmalade
74
III.4. Evaluation of lemon marmalade formulated with new
sweeteners (tagatose and isomaltulose)
99
III.5. Effect of tagatose and isomaltulose as sugar replacers in
mandarin orange marmalade on rheology, color, antioxidant
capacity, and sensory properties
121
III.6. New formulation of mandarin orange marmalade and
reliable traceability with wireless sensor networks 142
III.7. Characterization of watermelon jelly with non-cariogenic
sweeteners 171
III.8. Physicochemical characteristics of citrus jelly with non-
cariogenic and functional sweeteners
188
IV. CONCLUSIONES 211

Índice de Figuras
ii
ÍNDICE DE FIGURAS
Figura I.1. Países con mayor producción (t) en naranjas (a),
mandarinas (b) y limones (c) (FAOSTAT, 2013). 4
Figura I.2. Principales países exportadores de cítricos a nivel
europeo (t) (DATACOMEX, 2014). 5
Figura I.3. Principales países productores de sandía a nivel
mundial (t) (FAOSTAT, 2013).
.
8
Figura I.4. Principales países exportadores a nivel europeo de
sandía (t) (DATACOMEX, 2014).
9
Figura I.5. Estructuras moleculares de fructosa, galactosa y
glucosa. 16
Figura I.6. Estructuras moleculares de maltosa, sacarosa y
lactosa.
17
Figura I.7. Estructuras moleculares de sorbitol, maltitol,
lactitol, eritritol e isomaltitol. 20
Figura I.8. Estructuras moleculares de tagatosa, isomaltulosa
y esteviósido de stevia.
26
Figura I.9. Estructura del nodo sensor
29
Figura I.10. Estructura del nodo sumidero
30
Figura I.11. Esquema de la arquitectura EDETA 31
III. RESULTADOS
Figure III.1.1. Results in aw and °Brix dehydration function
of time for all the treatments studied.
49
Figure III.1.2. Results of variation of total mass (ΔM), of
water mass (ΔMw) and soluble solid mass (ΔMs) as well as
material balances recorded in this study.
51
Figure III.1.3. Results 1- 𝑌𝑠 vs. t 0.5 (square root of time of
dehydration) for all the treatments. 53
Figure. III.2.1. A) Water activity (aw) vs. time, B) °Brix vs.
time and C) xw vs. time for the lemon slices dehydrated with
different osmotic solutions.
64
Figure III.2.2. A) Variation of total mass (ΔM), B) Variation
of water mass (ΔMw) and C) Variation of soluble solid mass
(ΔMs) for the lemon slices dehydrated with different osmotic
solutions.
67
Figure III.2.3. 1-Driving force of soluble solids (Ys) vs. t0.5
(square root of time of dehydration) for the lemon slices
dehydrated with different osmotic solutions.
68

Índice de Figuras
iii
III. RESULTADOS
III. RESULTADOS
Figure III.3.1. Mean flow curves (rheograms) obtained from
the steady assay of orange marmalades at the beginning and at the
end of storage. Samples were coded respect to the amount of
sugars as: Control (100% sucrose); A (50% oligofructose and
50% tagatose); B (30% oligofructose and 70% tagatose), and C
(70% oligofructose and 30% tagatose).
85
Figure III.3.2. Average frequency curves obtained in the
oscillatory test of orange marmalades at the beginning and end of
storage. Samples were coded respect to the amount of sugars as:
Control (100% sucrose); A (50% oligofructose and 50%
tagatose); B (30% oligofructose and 70% tagatose), and C (70%
oligofructose and 30% tagatose). Empty symbols refer to values
of storage modulus (G’) and filled symbols refer to values of loss
modulus (G”).
88
Figure III.3.3.A) Chromatic plane representation (b*-a*) of
the studied marmalades initially and after 45 days of storage.
Straight line represents the hue of control orange marmalade for
day 1 from (0,0). B) Luminosity (L*) of the different
formulations of marmalade initially and after 45 days of storage.
Samples were coded respect to the amount of sugars as: Control
(100% sucrose); A (50% oligofructose and 50% tagatose); B
(30% oligofructose and 70% tagatose), and C (70% oligofructose
and 30% tagatose). Equal letters indicate homogeneous groups.
90
Figure III.3.4. Results of the sensory analysis in the
evaluation of the samples coded respect to the amount of sugars
as: Control (100% sucrose); A (50% oligofructose and 50%
tagatose); B (30% oligofructose and 70% tagatose), and C (70%
oligofructose and 30% tagatose).
* p-value <0.05, ** p-value <0.01.
92
Figure III.4.1. Mean flow curves (rheograms) obtained from
the steady assay of lemon marmalades at the beginning and at the
end of storage. Samples were coded respect to the amount of
sugars as: Control (100% sucrose); A (60% isomaltulose and
40% tagatose); B (50% isomaltulose and 50% tagatose), and C
(30% isomaltulose and 70% tagatose).
109

Índice de Figuras
iv
III. RESULTADOS
Figure.III.4.2. Average frequency curves obtained in the
oscillatory test of lemon marmalades at the beginning and end of
storage. Samples were coded respect to the amount of sugars as:
Control (100% Sucrose); A (60% isomaltulose and 40%
tagatose); B (50% isomaltulose and 50% tagatose), and C (30%
isomaltulose and 70% tagatose). Empty symbols referred to
values of G´ and filled symbols referred to values of G´´.
113
Figure III.4.3. Interaction graphics (significant level of 95%)
of colour parameters: L*, a*, b* coordinates, chroma (C*) and
hue (h*) of the lemon marmalade as a function of the formulation
and storage time. Samples were coded respect to the amount of
sugars as: Control (100% Sucrose); A (60% isomaltulose and
40% tagatose); B (50% isomaltulose and 50% tagatose), and C
(30% isomaltulose and 70% tagatose).
115
Figure III.4.4. Results of the sensory analysis in the
evaluation of the lemon marmalades coded respect to the amount
of sugars as: Control (100% Sucrose); A (60% isomaltulose and
40% tagatose); B (50% isomaltulose and 50% tagatose), and C
(30% isomaltulose and 70% tagatose).
* p-value <0.05, ** p-value <0.01.
117
Figure III.5.1. Average frequency curves obtained in the
oscillatory test of mandarin orange marmalade over the storage
period considered. Samples were coded respect to the amount of
sugars as: Control (100% sucrose); A (75% tagatose and 25%
isomaltulose), B (50% tagatose and 50% isomaltulose), C (25%
tagatose and 75% isomaltulose), and D (100% tagatose).
Unshaded symbols referred to values of G´ and filled symbols referred to values of G´´.
130
Figure III.5.2. Mean flow curves (rheograms) obtained from
the steady assay of mandarin orange marmalades over the storage
period considered. Samples were coded respect to the amount of
sugars as: Control (100% sucrose); A (75% tagatose and 25%
isomaltulose), B (50% tagatose and 50% isomaltulose), C (25%
tagatose and 75% isomaltulose), and D (100% tagatose).
132

Índice de Figuras
v
III. RESULTADOS
Figure III.5.3. Interaction graphics (significant level of 95%)
of color parameters: L*, a*, b* coordinates, chroma (C*) and hue
(h*) of the different formulations of mandarin orange marmalade
over the storage period. Samples were coded respect to the
amount of sugars as: Control (100% sucrose); A (75% tagatose
and 25% isomaltulose), B (50% tagatose and 50% isomaltulose),
C (25% tagatose and 75% isomaltulose), and D (100% tagatose).
134
Figure III.5.4. Interaction graphic (significant level of 95%)
of antioxidant activity of the different formulations of mandarin
orange marmalade over the storage period. Samples were coded
respect to the amount of sugars as: Control (100% sucrose); A
(75% tagatose and 25% isomaltulose), B (50% tagatose and 50%
isomaltulose), C (25% tagatose and 75% isomaltulose), and D
(100% tagatose).
136
Figure III.5.5. Results of the sensory analysis in the
evaluation of the samples coded based on the amount of sugars
as: Control (100% sucrose); A (75% tagatose and 25%
isomaltulose), B (50% tagatose and 50% isomaltulose), C (25%
tagatose and 75% isomaltulose), and D (100% tagatose).
*p-value <0.05, ** p-value <0.01
138
Figure III.6.1. Flow chart of the manufacturing process of
mandarin orange marmalade.
146
Figure III.6.2. A) Sensor Node structure and B) Sink Node
structure.
148
Figure III.6.3. Global WSN marmalade robust monitoring.
150
Figure III.6.4. Results obtained to monitoring parameters of
temperature and moisture content.
152
Figure III.7.1. Flow chart of the manufacturing process of
watermelon jellies. 175
Figure III.7.2. Representative curves of TPA test for
watermelon jellies studied as a function of sweeteners used in its
formulation initially (A) and after 15 days of storage (B).
180
Figure III.7.3. Interaction graphics (significant level of 95%)
of hardness, adhesiveness, cohesiveness, gumminess and
springiness of watermelon jellies as a function of the formulation
and storage time.
181

Índice de Figuras
vi
III. RESULTADOS
Figure III.7.4. Interaction graphics (significant level of 95%)
of colour parameters: L*, a*, b* coordinates, chroma (C*) and
hue (h*) of the watermelon jellies as a function of the formulation
and storage time.
183
Figure III.7.5. Sensory assessment of watermelon jellies as a
function of the formulation. Level of significance (ns) of the
ANOVA considering all jellies: *ns: 95%, **ns: 99%. Level of
significance (ns) ANOVA without considering the commercial
jelly: ººns: 99%.
184
Figure III.8.1. Flow chart of the manufacturing process of
citrus jellies.
193
Figure III.8.2. Interaction graphics (95% of significant level)
of colour parameters: L*, a*, b* coordinates, chrome (C*) and
hue (h*) of the citrus jelly as a function of the formulation and
storage time.
200
Figure III.8.3. Representative curves of tpa test for citrus
jelly studied as a function of sweeteners used in its formulation
initially (A), 15 days (B), 30 days (C) and after 45 days of storage
(D).
201
Figure III.8.4. Interaction graphics (95% of significant level)
of hardness, adhesiveness, cohesiveness, gumminess and
springiness of citrus jelly as a function of the formulation and
storage time.
202
Figure III.8.5. Sensory assessment of citrus jelly as a function
of the formulation. Level of significance (ns) of the ANOVA
considering all jelly: *ns: 95%.
204

Índice de Tablas
vii
ÍNDICE DE TABLAS
Tabla I.1. Volumen exportación citrícola de la Comunidad
Valenciana y su porcentaje respecto al total nacional (% S/T), en
el año 2013 (millones de euros) (IVACE, 2014).
5
Tabla I.2. Destinos de las exportaciones citrícolas de la
Comunidad Valenciana y su porcentaje respecto al total nacional
(% S/T), en 2013 (millones de euros) (IVACE, 2014).
6
Tabla I.3. Principales países productores europeos, porcentaje
respecto al total europeo (% S/T), y superficie de cultivo
(FAOSTAT, 2013).
9
Tabla I.4. Valores de poder edulcorante, índice glicémico y
las calorías por gramo que aportan de edulcorantes de volumen
con mayor relevancia (Chattopadhyay et al., 2014).
14
Tabla I.5. Poder edulcorante, así como su contenido calórico
de los edulcorantes intensivos más destacados 21
III. RESULTADOS Table III.1.1. Percentage of sweeteners in the syrups used in
the study of osmotic dehydration of orange slices.
47
Table III.1.2. Results of the effective diffusion coefficient
(De), slope and correlation coefficient (R2) of Fick's equation for
an infinite sheet (Crank, 1975).
54
Table III.2.1. Percentage of sweeteners in the syrups used in
the study of osmotic dehydration of lemon slices.
62
Table III.2.2. Values of effective diffusion coefficient (De)
and correlation coefficients (R2) of Fick's equation for an infinite
sheet (Crank, 1975) in lemon slices osmodehydrated with
different syrups.
69
Table III.3.1. Values for moisture content (xw), Brix, water
activity (aw), pH and antioxidant capacity of orange marmalades
initially and after 45 days of storage.
83
Table III.3.2. Rheological parameters of the Herschel-
Bulkley model and parameters of the power-law model for
marmalades initially and at the end of storage.
86

Índice de Tablas
viii
III. RESULTADOS
Table III.4.1. Values for moisture content (xw), Brix, water
activity (aw) and pH of lemon marmalades initially and after 60
days of storage. Values for commercial lemon marmalade are
also included.
107
Table III.4.2. Rheological parameters of the Herschel-
Bulkley model and parameters of the Power-Law model for
marmalades initially and at the end of storage. Equal letters
indicate homogeneous groups.
110
Table III.5.1. Rheological parameters of the power-law
model and parameters of the Herschel-Bulkley for mandarin
orange marmalades initially and at the end of storage.
128
Table III.6.1. Experimental values for moisture content (xw),
storage temperature (ºC), pH, soluble solids content (Brix), and
water activity (aw) of mandarin orange marmalades over storage
period. Also values of commercial mandarine marmalade.
154
Table III.7.1. Values for moisture content (xw), Brix, water
activity (aw) and pH of watermelon jellies formulated with
sucrose (control and commercial) or with new sweeteners
(isomaltulose and tagatose), initially and after 15 days of storage.
179
Table III.8.1. Values for, brix, moisture content (xw), pH,
water activity (aw) and antioxidant capacity of citrus jelly
formulated with sucrose (control) or with new sweeteners
(isomaltulose, oligofructose and tagatose), initially, 15 days, 30
days and after 45 days of storage.
197

JUSTIFICACIÓN E INTERÉS
DEL ESTUDIO


1
JUSTIFICACIÓN E INTERÉS DEL ESTUDIO
El desarrollo de alimentos saludables, no cariogénicos y con bajo
índice glicémico suscita gran interés en la industria agroalimentaria por la
preocupación creciente de la sociedad en mejorar su nutrición mediante
hábitos alimenticios saludables. El consumo de frutas como cítricos y
sandías ofrece múltiples propiedades nutricionales, ya que se encuentra
relacionado con la prevención de enfermedades, aunque no siempre es
posible consumirlas en fresco por su estacionalidad y/o falta de facilidad
en su consumo. Las alternativas que ofrecen la elaboración de
mermeladas y gelatinas, así como la deshidratación osmótica, permiten
ampliar las posibilidades de consumo de la fruta, ya que mantienen en la
medida de lo posible sus características nutricionales, y conjuntamente,
alargan su vida útil. No obstante, supone la incorporación de sacarosa en
su formulación, dando lugar a productos con un alto potencial
cariogénico y aporte calórico elevado, entre otros aspectos negativos,
relacionados con la obesidad, la diabetes, las caries, etc.
Considerando todo lo expuesto anteriormente, en esta tesis se
estudió la viabilidad de la sustitución de sacarosa, en la formulación de
mermeladas, gelatina y fruta osmodeshidratada, por edulcorantes
naturales como son tagatosa, isomaltulosa, stevia y oligofructosa, los
cuales se pueden encontrar actualmente en el mercado. Se han evaluado
las características fisicoquímicas (humedad, sólidos solubles, pH,
actividad de agua), capacidad antioxidante, propiedades ópticas y
reológicas. Asímismo, se realizó un seguimiento microbiológico durante
los respectivos períodos de almacenamiento y se realizaron análisis
sensoriales de las muestras de mermeladas y gelatinas. Además, se
observó la viabilidad de la sustitución de pectina por agar-agar en la
formulación de mermeladas como agente gelificante, ya que actualmente
esta propuesta no se encuentra en el mercado.
A su vez, se llevó a cabo la monitorización mediante una red de
sensores inalámbricos, de una serie de parámetros (temperatura y
humedad) en mermeladas a lo largo de su periodo de almacenamiento,
aportando ventajas a los métodos tradicionales.


I. INTRODUCCIÓN


I. Introducción
2
I. INTRODUCCIÓN
I.1. Los beneficios de la fruta
Las frutas son alimentos con una gran cantidad de nutrientes y
sustancias naturales que proporcionan numerosos beneficios para la salud
humana. La Organización Mundial de la Salud recomienda que todas las
personas deben comer por lo menos cinco porciones de verduras y/o
frutas diferentes al día (OMS, 2010); de este modo se produce un aporte
natural de los requerimientos diarios de vitaminas y minerales.
Por un lado, las frutas carecen de grasas (excepto los frutos secos,
olivas, aguacates y cocos que aportan aceites beneficiosos para el
organismo), y a su vez ofrecen un gran contenido en vitaminas
antioxidantes naturales, como la vitamina C, que es la vitamina
predominante en las frutas. Esta vitamina, no es sintetizada por el
organismo, y debe ser proporcionada en la alimentación. De entre las
frutas, los cítricos presentan un gran contenido de esta vitamina.
Por otro lado, las frutas proporcionan una rápida hidratación del
organismo y ayudan al correcto funcionamiento del aparato digestivo por
sus cualidades diuréticas y depuradoras del organismo y a su vez, por la
presencia de fibras solubles de origen vegetal. El aporte hídrico viene
determinado por el principal componente de la fruta, el agua,
generalmente con más del 90%. En el caso de la sandía, el agua
representa un 95% de su composición nutritiva.
I.1.1. El Sector de los Cítricos
Los cítricos son frutos estacionales, su producción en España
comienza en noviembre y culmina en mayo.
I. Introducción
3
Forman parte de este grupo de frutas: naranjas (Citrus
sinensis), mandarinas (Citrus reticulata), limones (Citrus limón),
pomelos (Citrus paradisi) y limas (Citrus aurantifolia), entre otros.
Poseen un alto valor nutricional, por su alto contenido en fibra,
vitaminas, minerales y ácido ascórbico (vitamina C), así como
gran cantidad de antioxidantes como carotenoides, flavonoides y
compuesto fenólicos, considerados altamente beneficiosos para la
salud humana (Álvarez et al., 2014; Navarro et al., 2011). De igual
modo, es recomendable su consumo para curar enfermedades, entre
ellas, el escorbuto (carencia de vitamina C), remedio muy conocido
por los marineros y hombres de la mar desde el siglo XVII, los
cuales navegaban largas travesías sin pisar tierra firme.
En referencia a la producción de cítricos, a nivel mundial,
España ocupa el sexto lugar en la producción de naranjas, el
segundo en la producción de mandarinas y el noveno lugar en la
producción de limones, con una producción total anual en cítricos
superior a 5 millones de toneladas durante la última década. Sin
embargo, es el mayor productor de cítricos de la Unión Europea.
En la Figura I.1., se representan los diez países con mayor
producción en cítricos a nivel mundial (FAOSTAT, 2013). A nivel
nacional, la Comunidad Valenciana es la región citrícola por
excelencia, posee una superficie cultivada de 182.000 ha, que
corresponden con un 60% del total nacional y una producción anual
de más 3.5 millones de toneladas, lo que representa más del 60% de
la producción nacional (CAPAA, 2014). En cuanto a la exportación
de cítricos, España es el principal exportador de cítricos a nivel mundial,
seguido de Sudáfrica, Turquía, China y EE.UU. En consecuencia, es el
primer país exportador a nivel europeo (Figura I.2.) (DATACOMEX,
2014).

I. Introducción
4
a)
b)
c)
Figura I.1. Países con mayor producción (toneladas) en naranjas
(a), mandarinas (b) y limones (c) (FAOSTAT, 2013).

I. Introducción
5
Figura I.2. Principales países exportadores de cítricos a nivel
europeo (toneladas) (DATACOMEX, 2014).
Asimismo, a nivel nacional, la Comunidad Valenciana, es la
primera región española exportadora de cítricos ya que aporta un 73% del
total nacional. De hecho, en el año 2010, se creó la Indicación Geográfica
Protegida (IGP) “Cítricos Valencianos” y su consejo regulador que se
encarga de proteger e identificar a los mismos (CAPAA, 2010). Destacan
las mandarinas con un 52% y las naranjas con un 40% del total de las
exportaciones citrícolas valencianas (Tabla I.1.), (IVACE, 2014).
Tabla I.1.Volumen exportación citrícola de la Comunidad
Valenciana y su porcentaje respecto al total nacional (% S/T), en el año
2013 (millones de euros) (IVACE, 2014).
PRODUCTO EXPORTACIÓN % S/T
MANDARINAS 1.100 52
NARANJAS 848 40
LIMONES 138 7
POMELOS 16 1
RESTO CÍTRICOS 1 0
TOTAL 2.104 100

I. Introducción
6
En la Tabla I.2., se muestran los países a los que fueron
destinadas las exportaciones citrícolas en el año 2013. Como puede
observarse, Alemania es el primer destino, seguido de Francia, Países
Bajos y Reino Unido que representan un 61% de las exportaciones de
cítricos valencianos.
Tabla I.2. Destinos de las exportaciones citrícolas de la
Comunidad Valenciana y su porcentaje respecto al total nacional (% S/T),
en 2013 (millones de euros) (IVACE, 2014).
PAÍS EXPORTACIÓN % S/T
ALEMANIA 515 24
FRANCIA 476 23
PAÍSES BAJOS 151 7
REINO UNIDO 144 7
POLONIA 130 6
ITALIA 119 6
BÉLGICA 81 4
SUECIA 55 3
REPÚBLICA CHECA 54 3
ESTADOS UNIDOS 47 2
SUIZA 42 2
RUSIA 38 2
NORUEGA 32 2
AUSTRIA 31 1
SUBTOTAL 1.915 91
TOTAL 2.104 100

I. Introducción
7
Por otro lado, los excedentes de producción citrícola, que en el
caso de la Comunidad Valenciana se sitúan en torno a 15.000 toneladas
de cítricos (CAPAA, 2014), ofrecen múltiples posibilidades como es el
caso del abastecimiento alimentario en explotaciones ganaderas, donde la
dieta del ganado se ve enriquecida por el gran aporte nutricional de los
cítricos como son las vitaminas, minerales, fibra, etc. Asímismo, la
industria alimentaria transforma los excedentes en zumos, néctares y
mermeladas. En cuanto al sector de la cosmética, también son muy
apreciados los aceites esenciales que se encuentran en los cítricos para la
fabricación de cremas y perfumes, entre otros (Bakkali et al., 2008).
Últimamente, debido al efecto del cambio climático y a la
concienciación por parte de la sociedad frente al sector de los
hidrocarburos, se está promoviendo el estudio del uso de excedentes
cítricos como biocombustible (Conesa et al., 2013).
I.1.2. Sector de la Sandía
La sandía (Citrullus vulgaris) es una fruta de verano que
proporciona múltiples beneficios saludables. Pertenece a la familia de las
cucurbitáceas y es originaria de África. Posee un alto contenido en agua.
Por esa razón su pulpa es granulosa y acuosa, con un sabor dulce por la
presencia de fructosa y un color rojizo debido a la elevada cantidad de
carotenoides presentes en la pulpa y que posteriormente serán
transformados por el organismo en vitamina A. Además, posee gran
cantidad de licopeno, un antioxidante de acción preventiva frente a
tumores, infecciones del aparato respiratorio y que actúa como defensor
del sistema inmunológico (Hong et al., 2015).
La composición nutricional de la sandía muestra un bajo
contenido en calorías por su bajo porcentaje en hidratos de carbono, pero
es rica en vitaminas, minerales y enzimas necesarias para el buen
desarrollo del organismo. Además, presenta múltiples propiedades, como

I. Introducción
8
por ejemplo, la función de las antitoxinas del jugo de sandía que ayuda a
limpiar la sangre y los tejidos de impurezas. También, es recomendable
para enfermos de riñones y vías urinarias, hipertensión y obesos por su
acción diurética. Además, es laxante por su contenido en fibra que acelera
el tránsito intestinal y por tanto recomendable su consumo en pacientes
de gota, artritis, reuma y ciática (Hong et al., 2015).
En cuanto a la producción mundial de sandías, España ocupa el
decimosegundo puesto (FAOSTAT, 2013). En la Figura I.3., se muestran
los principales países productores a nivel mundial.
Figura I.3. Principales países productores de sandía a nivel
mundial (toneladas) (FAOSTAT, 2013).
Sin embargo, España es el primer país europeo con una
producción total anual superior a 869.500 toneladas, y una superficie total
de 17.900 hectáreas, como puede observarse en la Tabla I.3., lo que
supone unos ingresos de 3.5 millones de euros (FAOSTAT, 2013). La
Comunidad Autónoma que mayor producción tiene es Andalucía (3.793
ha), seguida de la Región de Murcia (3.054 ha) y la Comunidad
Valenciana, con una producción de 42.923 toneladas y con una superficie
total de 2.136 hectáreas (CAPAA, 2014; MAGRAMA, 2012,2014).

I. Introducción
9
Tabla I.3. Principales países productores europeos, porcentaje
respecto al total europeo (% S/T), y superficie de cultivo (FAOSTAT,
2013).
Respecto al comercio de exportación de sandía, España es el
principal exportador a nivel europeo (Figura I.4). En coherencia con el
volumen de producción, la Comunidad Valenciana ocupa el tercer lugar
en volumen de exportación con un 24.05% de la cuota nacional,
precedido por Andalucía (45.20%) y Murcia (26.68%) (MAGRAMA,
2014).
Figura I.4. Principales países exportadores a nivel europeo de
sandía (toneladas) (DATACOMEX, 2014).
PAÍS PRODUCCIÓN (t) % S/T SUPERFÍCIE (ha)
ESPAÑA 869.500 31,26 17900
RUMANIA 574.187 20,64 26018
GRECIA 620.600 22,31 13000
ITALIA 392.527 14,11 11557
HUNGRÍA 183.900 6,61 6300
BULGARIA 64.247 2,31 3049
CROACIA 30.955 1,11 836
SUBTOTAL 45.365 1,63 1753
TOTAL 2.781.281 100 80.413

I. Introducción
10
La sandía es un fruto estacional con carácter estival, con una
gran demanda por sus propiedades refrescantes. Cuando se produce un
excedente de producción, los productores optan por la venta a la
industria agroalimentaria que realiza su procesado en zumos y licuados
extraídos de la pulpa de la fruta. Por este motivo, las cáscaras de sandía
a priori son desechadas, aunque actualmente se están realizando
estudios para extraer un aminoácido llamado citrulina, (que se encuentra
en la parte blanca de la cáscara), con numerosas propiedades entre ellas,
paliar enfermedades cardiovasculares y dolencias musculares en
deportistas (Bahri et al., 2013).
I.1.3. Alternativas de consumo de frutas en fresco
Los consumidores demandan actualmente alimentos con
excelentes propiedades de textura, sabor y aroma, pero sin olvidar las
características funcionales como un elevado contenido en fibra,
vitaminas, minerales, compuestos antioxidantes, unido a un bajo índice
glicémico y no cariogénicos, como es el caso de las frutas, las cuales
poseen un alto valor nutricional. Sin embargo, su consumo en fresco a
veces puede resultar difícil por su carácter estacional y por tanto su
perecibilidad y en determinados casos por su tamaño y necesidad de
pelado, lo que dificulta su consumo fuera del hogar. Por ello el procesado
de la fruta se presenta como alternativa al consumo en fresco,
consiguiendo extender su vida útil pero manteniendo algunas de las
características del producto fresco. De entre los productos elaborados a
base de frutas se encuentran las mermeladas, gelatinas y las frutas
deshidratadas osmóticamente.
La deshidratación osmótica es una técnica utilizada
ampliamente por la industria para la conservación y diseño de nuevos
productos a partir de frutas (Earle, 1988; Peinado et al., 2012). La técnica
se basa en reducir la actividad de agua del producto, inhibiendo así el
crecimiento microbiano y la actividad enzimática consiguiendo alargar la

I. Introducción
11
vida útil del alimento. La operación consiste en la inmersión de un
alimento (entero o segmentado) en una disolución acuosa de elevada
concentración en solutos (disolución osmótica) con la finalidad de extraer
el agua del alimento (Pointing, 1973; Peinado et al., 2012).
Las mermeladas son productos tradicionales, elaborados con
fruta troceada, sacarosa y pectina de fruta (agente gelificante) sometidos a
un proceso de cocción hasta obtener una textura semifluida o espesa, tal y
como se especifica en el R.D. 863/2003 de 4 de julio, por el que se
aprueba la Norma de calidad para la elaboración, comercialización y
venta de confituras, jaleas, «marmalades» de frutas y crema de castañas.
En el proceso se concentra la fruta con sacarosa hasta obtener una
cantidad de sólidos solubles en un rango entre 40 y 60ºBrix. Con pH entre
2.8-3.8 se deprime el crecimiento microbiano, que junto con la alta
concentración de sólidos solubles hacen posible que el producto sea
estable en el tiempo y se conserven ciertas propiedades nutricionales.
Según se explicita en el R.D. 863/2003, «Marmalade» es la mezcla, con
la consistencia gelificada apropiada, de agua, de azúcares y de uno o
varios de los productos siguientes, obtenidos a partir de cítricos: pulpa,
puré, zumo, extractos acuosos y pieles. Por este motivo, reciben la
denominación exclusiva de “Marmalades”, que las distingue del resto de
mermeladas elaboradas con otras frutas. En este mismo documento, se
expone que la sandía no es una fruta adecuada para la elaboración de
confituras y/o mermeladas de calidad «extra», si bien se puede emplear
en la elaboración de un postre gelificado (refrigerado), como son las
gelatinas.
Los postres de gelatina están elaborados en base a gelatina, que
proviene del hidrolizado de colágeno, habitualmente animal (vacuno y
cerdo), aunque recientemente se están elaborando gelatinas procedentes
de pescado (Karim y Bhat, 2009). El proceso de elaboración de forma
tradicional se realiza mediante el mezclado de zumo de fruta, agua,
gelatina y sacarosa.

I. Introducción
12
Es necesario la disolución previa de la gelatina en agua, antes
de la cocción rápida hasta alcanzar la temperatura de gelificación
(Edwards, 2002). A su vez en el proceso de elaboración suelen añadirse
colorantes, por lo que unido a su estructura de gel, ofrece un producto
muy atractivo para el consumidor. Así mismo, presenta un precio muy
asequible y es consumido por un amplio sector de la población, por ser
fuente de proteínas.
Como se ha podido observar, de forma habitual en la
elaboración de estos productos se utiliza sacarosa, como el azúcar por
excelencia, por su textura y sabor característicos. Sin embargo presenta
ciertas connotaciones negativas asociadas a su consumo (cariogénesis,
aporte calórico elevado, aumento en el índice glicémico, etc…) y por este
motivo en algunos productos es reemplazado por edulcorantes naturales o
sintéticos.
I.2. Las alternativas al azúcar
Como se ha mencionado anteriormente, el consumo de sacarosa
implica ciertos inconvenientes asociados a la salud. Por este motivo, la
Organización Mundial de la Salud (OMS), establece nuevas directrices
orientadas hacia una reducción del consumo de azúcares simples hasta el
5% de la ingesta calórica total diaria para un adulto con un índice de
masa corporal normal (OMS, 2014). Con este objetivo, se pretende
reducir las enfermedades como la diabetes tipo II, la obesidad, la caries
dental, así como las que afectan a las vías coronarias, que se presentan en
niños y adultos.
Este colectivo necesita alternativas a la sacarosa en su
alimentación, como la utilización de edulcorantes acalóricos. Por ejemplo
para diabéticos, estos edulcorantes no elevan los niveles sanguíneos de
glucosa ni provocan la liberación de insulina por el páncreas, de la misma

I. Introducción
13
forma que no aportan energía y se favorece el mantenimiento de su peso
corporal (Lina et al., 2002; Lu et al., 2008).
I.2.1. Edulcorantes clásicos
Los edulcorantes son todas aquellas sustancias, naturales o de
síntesis, con sabor dulce y por tanto, con la capacidad de endulzar los
alimentos. En relación a los edulcorantes de síntesis o sintéticos se
clasifican en dos grupos:
Edulcorantes de volumen: Pertenecen a este grupo los azúcares y
los polialcoholes, siendo el aporte calórico mucho mayor en los azúcares.
Edulcorantes intensivos: Son acalóricos y su consumo no
proporciona energía, pertenecen a este grupo la sacarina, el aspartame, la
sucralosa, etc.
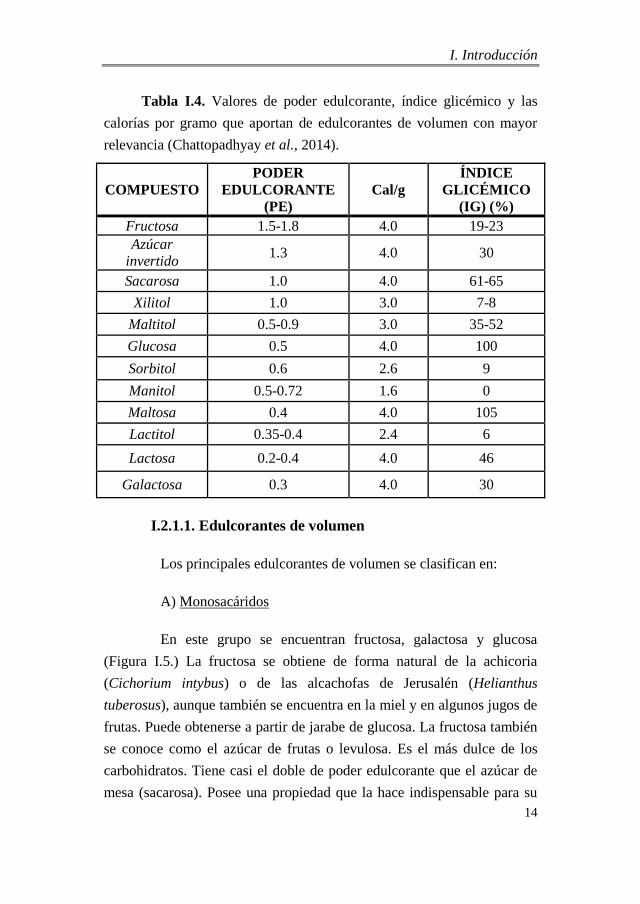
Para establecer el poder edulcorante (PE) se toma como
referencia a la sacarosa, con un valor de uno (ó 100) (Edwards, 2002).
En cuanto al índice glicémico (IG), se evalúa el impacto de la ingesta de
glucosa, siendo 100 el valor de referencia (Romero et al., 2002; Wolever,
2006). En consecuencia, el Reglamento Europeo nº 1338/2008 (CE,
2008), expone una lista de edulcorantes permitidos en alimentación. En
ella se encuentran aquellos edulcorantes que pueden ocupar el lugar de la
sacarosa en la elaboración de productos alimenticios. En la Tabla I.4., se
muestran los valores índice glicémico (IG) y poder edulcorante (PE), así
como las calorías por gramo que aportan, para los edulcorantes de
volumen más importantes.
I. Introducción
14
Tabla I.4. Valores de poder edulcorante, índice glicémico y las
calorías por gramo que aportan de edulcorantes de volumen con mayor
relevancia (Chattopadhyay et al., 2014).
I.2.1.1. Edulcorantes de volumen
Los principales edulcorantes de volumen se clasifican en:
A) Monosacáridos
En este grupo se encuentran fructosa, galactosa y glucosa
(Figura I.5.) La fructosa se obtiene de forma natural de la achicoria
(Cichorium intybus) o de las alcachofas de Jerusalén (Helianthus
tuberosus), aunque también se encuentra en la miel y en algunos jugos de
frutas. Puede obtenerse a partir de jarabe de glucosa. La fructosa también
se conoce como el azúcar de frutas o levulosa. Es el más dulce de los
carbohidratos. Tiene casi el doble de poder edulcorante que el azúcar de
mesa (sacarosa). Posee una propiedad que la hace indispensable para su
COMPUESTO
PODER
EDULCORANTE
(PE)
Cal/g
ÍNDICE
GLICÉMICO
(IG) (%)
Fructosa 1.5-1.8 4.0 19-23
Azúcar
invertido 1.3 4.0 30
Sacarosa 1.0 4.0 61-65
Xilitol 1.0 3.0 7-8
Maltitol 0.5-0.9 3.0 35-52
Glucosa 0.5 4.0 100
Sorbitol 0.6 2.6 9
Manitol 0.5-0.72 1.6 0
Maltosa 0.4 4.0 105
Lactitol 0.35-0.4 2.4 6
Lactosa 0.2-0.4 4.0 46
Galactosa 0.3 4.0 30

I. Introducción
15
uso en productos para diabéticos, puesto que tiene un metabolismo
independiente de la insulina y en consecuencia muestra un IG entre 19-23
(Tabla I.4.). Por otro lado, se afirma que la fructosa en pequeñas
cantidades suaviza el sabor de los edulcorantes intensivos cuando estos se
utilizan en productos denominados “sin azúcar”, puesto que tiene un PE
entre 1.5-1.8, mayor que el de la sacarosa (Tabla I.4.). Presenta, a su vez,
la característica de ser muy soluble, siendo altamente higroscópica y por
este motivo se presenta en forma de jarabe (Edwards, 2002; Godshall,
2007). Sin embargo, recientemente se ha descubierto que la ingesta
prolongada de fructosa en cantidades elevadas provoca un aumento en la
resistencia del organismo a la insulina (Botanical, 2012). Este
inconveniente estaría relacionado con el origen de la fructosa ya que la
proveniente del jarabe de maíz de alta fructosa, de menor precio y
calidad, está asociado con una mayor inicidencia de obesidad (Periche et
al., 2015).
En cuanto a la galactosa, se encuentra presente en la lactosa. Es
precisamente en las glándulas mamarias donde este compuesto se
sintetiza para formar parte de la leche materna. Tras ser absorbida, se
transforma en glucosa en el hígado y por tanto, también constituye una
fuente energética (4 calorías/g) y su poder edulcorante es similar al de la
lactosa (Tabla I.4) (Wolever, 2006; Godshall, 2007).
La glucosa o dextrosa, es el azúcar más importante dado su
abundancia. Se encuentra en frutas dulces, en la miel, el jarabe de maíz y
las verduras entre otros. Su estructura molecular, junto a la de la fructosa
y a la galactosa se muestra en la figura I.5. Es conocido como “el azúcar
de la sangre”. La reserva más importante de glucosa en el organismo se
encuentra en el hígado y los músculos, en forma de glucógeno, por lo que
es importante incluir alimentos que contengan carbohidratos, que el
organismo transforma en glucosa, para un adecuado funcionamiento de
nuestro cuerpo. El IG, cuantifica el nivel de glucemia (concentración de
glucosa) en sangre producido por la ingesta de alimentos. Por ésta razón,

I. Introducción
16
la glucosa es el compuesto que se toma como referencia para cuantificar
el índice glicémico, presentando un IG de 100 (Tabla I.4) (Wolever,
2006; Godshall, 2007).
Figura I.5. Estructuras moleculares de fructosa, galactosa y
glucosa.
B) Disacáridos
En este grupo se encuentran sacarosa, lactosa y maltosa, y por
este orden son los tres azúcares de mayor acción cariogénica (Figura I.6.).
Numerosos estudios epidemiológicos han demostrado la asociación entre
caries y sacarosa. Esto es debido, a que los azúcares consumidos con la
dieta constituyen el sustrato de la microflora bucal dando inicio al
proceso de cariogénesis. Además, un consumo elevado también puede
desencadenar problemas de obesidad e incluso hipertrigliceridemia
(Blanco, 2002).
La sacarosa se extrae tanto de la remolacha azucarera (Beta
vulgaris) como de la caña de azúcar (Saccharum officinarum). El azúcar
extraído de la remolacha debe ser purificado, para obtener un sabor
agradable, al contrario que ocurre con el azúcar obtenido de la caña de
azúcar, que sin ser refinado y blanqueado, es decir, como azúcar moreno,
es altamente apreciado por su sabor. Se trata de un disacárido no reductor
constituido por dos monosacáridos reductores, glucosa y fructosa, unidos
por el enlace glucosídico α-1,2, también conocido como enlace
O-glucosídico (Figura I.6.). Es el azúcar más utilizado por los
consumidores, presenta numerosas propiedades sensoriales y físico-
químicas, puesto que proporciona la estructura y la textura adecuada de
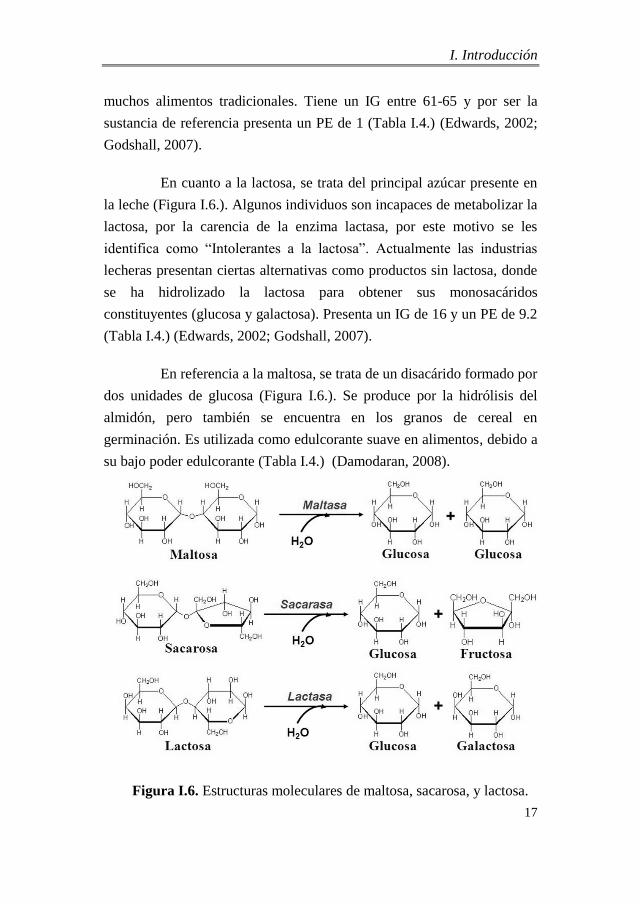
I. Introducción
17
muchos alimentos tradicionales. Tiene un IG entre 61-65 y por ser la
sustancia de referencia presenta un PE de 1 (Tabla I.4.) (Edwards, 2002;
Godshall, 2007).
En cuanto a la lactosa, se trata del principal azúcar presente en
la leche (Figura I.6.). Algunos individuos son incapaces de metabolizar la
lactosa, por la carencia de la enzima lactasa, por este motivo se les
identifica como “Intolerantes a la lactosa”. Actualmente las industrias
lecheras presentan ciertas alternativas como productos sin lactosa, donde
se ha hidrolizado la lactosa para obtener sus monosacáridos
constituyentes (glucosa y galactosa). Presenta un IG de 16 y un PE de 9.2
(Tabla I.4.) (Edwards, 2002; Godshall, 2007).
En referencia a la maltosa, se trata de un disacárido formado por
dos unidades de glucosa (Figura I.6.). Se produce por la hidrólisis del
almidón, pero también se encuentra en los granos de cereal en
germinación. Es utilizada como edulcorante suave en alimentos, debido a
su bajo poder edulcorante (Tabla I.4.) (Damodaran, 2008).
Figura I.6. Estructuras moleculares de maltosa, sacarosa, y lactosa.

I. Introducción
18
C) Jarabe de glucosa
Se obtiene por hidrólisis ácida a partir del almidón de maíz,
patata o trigo y su ingrediente principal es la maltosa. El más utilizado en
la industria alimentaria es el jarabe con alto contenido en fructosa (42%
aproximadamente, aunque puede llegar a cantidades superiores, del 55%
y hasta del 90%), lo que obliga a que tras la hidrólisis del almidón, se
lleve a cabo una isomerización enzimática, que asegure la transformación
de una parte de glucosa en fructosa (Edwards, 2002).
D) Azúcar invertido
Es una solución acuosa de fructosa en proporción variable y
glucosa. Se obtiene a partir de la sacarosa por hidrólisis ácida o
enzimática. Su empleo mayoritario es en la fabricación de alimentos
manufacturados. Por el contrario, el uso de éste compuesto ha disminuido
porque el jarabe de glucosa es más barato y presenta mejores
propiedades, aunque en su favor se comenta que los residuos que
contienen azúcar pueden tratarse para producir azúcar invertido. Como
puede observarse en la tabla I.4, muestra un poder edulcorante superior a
la sacarosa (Edwards, 2002).
E) Polialcoholes
Constituyen un grupo bastante homogéneo de edulcorantes que
poseen en común algunas características. Se encuentran presentes en
distintos alimentos pero su extracción no es rentable, por lo que se
obtienen por hidrogenación, a partir de diferentes azúcares. Poseen un
poder edulcorante inferior, generalmente, al de la sacarosa, siendo muy
empleados en pastelería, heladería y en la industria del chicle. Su valor
energético es aproximadamente la mitad del de la sacarosa (Edwards,
2002). Además, debido a su menor absorción intestinal hace que se
comporten como laxantes osmóticos. Son utilizados también por la
microbiota presente en el colon, lo que explica la flatulencia que

I. Introducción
19
provocan, y por tanto limitan su utilización especialmente en niños. No
obstante, presentan la característica de ser no cariogénicos y algunos de
ellos además de cómo edulcorantes, también son utilizados por la
industria alimentaria como diluyentes, humectantes y estabilizantes
(Edwars, 2002; Chattopadhyay et al., 2014). Los polialcoholes más
importantes son:
Sorbitol: se encuentra de forma natural en las plantas, como las
algas rojas, y también en frutas como peras, manzanas, cerezas y
melocotones. Procede de la glucosa, por este motivo, posee un poder
edulcorante similar (Tabla I.4.; Figura I.7.). Se utiliza en la industria
alimentaria como humectante, agente de carga y/o edulcorante en
caramelos y chicles, lo que proporciona sensación de frescor al producto.
Se absorbe finalmente en el tubo digestivo, y en consecuencia tiene el
mismo valor energético que la glucosa (Edwards, 2002; O'Donnell y
Kearsley, 2012).
Maltitol: se utiliza como sustitutivo de la sacarosa en diversas
formulaciones debido a su alto poder edulcorante entorno al 90% y
características físico-químicas similares (Tabla I.4.; Figura I.7.)
(Edwards, 2002; O'Donnell y Kearsley, 2012).
Lactitol: se produce por hidrogenación del azúcar de la leche o
lactosa. Es poco dulce, como puede observarse en la Tabla I.4., lo que
puede suponer una ventaja en determinadas aplicaciones. En la Figura
I.7., se muestra su estructura molecular (Edwards, 2002; O'Donnell y
Kearsley, 2012).
Manitol: proporciona casi la mitad de las calorías por gramo
que la glucosa (50% PE), como puede observarse en la Tabla I.4. Como
inconveniente muestra una mala absorción en el tubo digestivo. Proviene
de la manosa, que se encuentra en algas y frutas y se utiliza como agente
de carga o espolvoreado en chicles (Edwards, 2002; O'Donnell y
Kearsley, 2012).
Isomaltitol: la mezcla de los isómeros resultantes de la
hidrogenación de la isomaltulosa que se obtiene por tratamiento

I. Introducción
20
enzimático de la sacarosa o azúcar común (Figura I.7.). Se utiliza como
agente de carga en productos, como los caramelos, en que ha sustituido al
azúcar. Su característica principal es que es poco higroscópico, aunque
tiene un precio muy elevado lo que hace que se encarezca el producto final
(Edwards, 2002; O'Donnell y Kearsley, 2012).
Eritritol: posee un efecto laxante menor al resto, y un rango de
valores de IG entre 7-13 y un PE=1. En la Figura I.7., puede observarse su
estructura química. Su uso está muy extendido en la industria de chicles y
dentífricos por su sensación refrescante (Edwards, 2002; O'Donnell y
Kearsley, 2012).
Figura I.7. Estructuras moleculares de sorbitol, maltitol, lactitol,
eritritol e isomaltitol.
I.2.1.2. Edulcorantes intensivos
Los edulcorantes intensivos, se designan así por su alto poder
edulcorante por lo que su consumo en pequeñas cantidades es suficiente.
No obstante, la duración de la impregnación de las papilas gustativas
excede a la observada con los edulcorantes naturales, es el denominado
efecto “Lingering” o de persistencia. Se pueden considerar acalóricos
MALTITOL
SORBITOL LACTITOLERITRITOL
ISOMALTITOL
Sorbitol Eritritol Lactitol
Maltitol Isomaltitol

I. Introducción
21
porque presentan un bajo contenido en calorías o incluso dependiendo del
tipo de edulcorante, puede ser hasta nulo como ocurre con la sacarina.
Por este motivo son utilizados como sustitutos del azúcar en las dietas de
control de peso (Edwards, 2002; O'Donnell y Kearsley, 2012). En la
Tabla I.5., se encuentran los valores de poder edulcorante para los
edulcorantes intensivos más destacados, así como su contenido en
calorías por gramo.
Tabla I.5. Poder edulcorante de los edulcorantes intensivos más
destacados.
A continuación se detallan las características de los
edulcorantes intensivos más destacados:
La sacarina, es la o-sulfimida benzoico, posee un elevado poder
edulcorante, pero puede dejar un sabor residual amargo, que se puede
evitar si se asocia con ciclamato. No se metaboliza y se excreta por vía
renal. Como puede observarse en la Tabla I.5., presenta un poder
edulcorante en torno a 300-500. Presenta un comportamiento muy
estable, y no aporta ninguna caloría, además no es cariogénico. Su uso
está muy extendido en la industria alimentaria. Está aprobado por el
Comité de Expertos en Aditivos Alimentarios de la FAO/OMS. La
Ingesta Diaria Admisible (IDA) es de 5 mg por kilogramo de peso
corporal por día (Weihrauch y Diehl, 2004).
COMPUESTO PODER EDULCORANTE
(PE) (%)
Sacarina 300-500
Aspartame 160-220
Acesulfame K 200
Ciclamato 30-40
Sucralosa 600

I. Introducción
22
En cuanto al Ciclamato, se trata del ciclohexil sulfamato sódico.
Posee un sabor agradablemente dulce (Tabla I.5.) empleándose
normalmente asociado a la sacarina en una relación 1:10, una relación
sinérgica con la que se obtiene un mayor poder edulcorante y un menor
sabor residual amargo. La Ingesta Diaria Admisible (IDA) es de 7 mg por
kilogramo de peso corporal por día. No debe utilizarse en la elaboración
mermeladas, puesto que no inhibe la proliferación de gérmenes, al igual
que pasa con la sacarina y en contraposición a la sacarosa
(Chattopadhyay et al., 2014).
El aspartamo, es el éster metílico del aspartil fenilalanina, capaz
de provocar un fuerte sabor dulce pero sin ser residual (Tabla I.5.),
presentando además una capacidad potenciadora del efecto de otros
edulcorantes. Su uso no es recomendable en procesos con altas
temperaturas ni en medios ácidos, como en zumos, porque la
descomposición de la molécula libera fenilalanina, lo que es
desaconsejable para pacientes fenilcetonúricos y debe hacerse constar su
presencia en los envases. Reconocida por la FDA desde 1995 (Edwards,
2002; Chattopadhyay et al., 2014).
En relación al acesulfamo K, es un edulcorante que pertenece a
la familia de los dióxidos de oxatiozinonas, presenta similitudes
estructurales con la sacarina, y deja un sabor residual amargo también
como la sacarina. Estable a elevadas temperaturas y presenta un efecto
sinérgico con otros edulcorantes intensos. Posee un poder edulcorante de
200 (Tabla I.5.) (Chattopadhyay et al., 2014).
La sucralosa o dulcina, se obtiene a partir de la sacarosa.
Presenta gran estabilidad en medio ácido, lo que la hace idónea para su
uso en zumos de frutas. Es soluble y fácil de manipular. Como puede
observarse en la Tabla I.5., es 600 veces más dulce que el azúcar, pero no
es cariogénico y se utiliza en una amplia gama de productos, bebidas
refrescantes, mermeladas, frutas enlatadas, lácteos, postres, helados, etc.

I. Introducción
23
Asimismo, presenta una I.D.A. de 15 mg por kilogramo de peso corporal
por día (Edwards, 2002; Chattopadhyay et al., 2014).
Sin embargo, estos edulcorante intensivos presentan en la
actualidad mucha controversia ya que se está cuestionando su relación
con el desarrollo de distintos cánceres y otras enfermedades (Weihrauch
y Diehl, 2004; Soffritti et al., 2006; Renwick y Nordmann, 2007). Por su
parte, la autoridad europea en seguridad alimentaria (EFSA) ha ratificado
la seguridad de todos los edulcorantes que se encuentran en la lista
positiva de aditivos, así como las dosis recomendadas, aludiendo que no
existen evidencias científicas de manifiesten la peligrosidad para el
consumo humano por parte de los mismos. Sin embargo, se encuentran en
continua evaluación por parte de la Comisión Europea.
Por esta razón, la industria alimentaria ofrece edulcorantes
obtenidos de forma natural, metabolizables por el organismo y con
ventajas nutricionales y funcionales como la isomaltulosa, la
oligofructosa, la stevia, la tagatosa, etc. Consecuentemente, el reto es
comprobar su viabilidad en la reformulación de productos tradicionales
para mantener o incluso mejorar sus propiedades tecnológicas.
I.2.2. Nuevos edulcorantes
Según la Organización Mundial de la Salud (OMS), se
recomienda una reducción del consumo de azúcares y otros carbohidratos
de absorción rápida como la sacarosa, así como aumentar la actividad
física diaria para frenar la tendencia a la obesidad y a la diabetes del tipo
2 (Lu et al., 2008). Además, dada la problemática de los sustitutos de los
azúcares actuales, es importante encontrar alternativas más saludables. A
continuación se hará una descripción de los cuatro nuevos edulcorantes
estudiados en esta tesis.

I. Introducción
24
La Oligofructosa, es un oligosacárido derivado de la fructosa.
Actúa como fibra dietética soluble de carácter prebiótico que regula el
tránsito gastrointestinal, favoreciendo el crecimiento de la microbiota
gastrointestinal beneficiosa y la absorción del calcio. Además, produce
una reducción de los niveles de colesterol y los niveles de azúcar en
sangre (Chacón-Villalobos, 2006; Ledur et al., 2013). Su capacidad
edulcorante se encuentra aproximadamente entre un 30% y un 60% frente
a la sacarosa y es fácilmente hidrolizado por acción de ácidos o enzimas
(Coussement, 1999). Por otra parte, posee un bajo contenido calórico, lo
que le confiere múltiples beneficios saludables, así como un alto nivel de
solubilidad y propiedades tecnológicas muy relacionadas con los de la
sacarosa y los jarabes de glucosa. A menudo se suele utilizar en
combinación con edulcorantes de alta intensidad y posee al mismo
tiempo la ventaja de no comprometer el sabor y la textura, ofreciendo así
productos nutricionalmente mejorados (Rao, 2001; Franck, 2002;
O’Donnell y Kearsley, 2012).
Otro nuevo edulcorante a tener en cuenta es la Stevia. Su
principal compuesto es el esteviósido (Figura I.8). Se trata de un
glucósido formado por tres moléculas de glucosa unidas al alcohol
(diterpénico esteviol), que está presente en las hojas de Stevia rebaudiana,
planta silvestre autóctona de América del Sur (Paraguay), por este
motivo, se trata de un edulcorante intensivo vegetal (Goyal, 2010). No
aporta calorías. Su dulzor es 300 veces más que el azúcar (Kroyer, 2010).
El Comité Mixto FAO/OMS de Expertos en Aditivos Alimentarios revisó
los esteviósidos y asignó una Ingesta Diaria Aceptable temporal de 2 mg
por kilogramo de peso corporal por día (JECFA, 2008; EFSA, 2011).
Posee numerosas propiedades: antiinflamatorias, diuréticas,
antihipertensas, antihiperglicémicas, antioxidantes, antimicrobiana
(inhibe crecimiento de Salmonella typhimurum, B. subtilis y S. aureus) y
antifúngica (Gosh, 2008; Chatsudthipong y Muanprasat, 2009; Lemus-
Mondaca, et al., 2012).

I. Introducción
25
Por otra parte, en los últimos años está adquiriendo un creciente
interés la D-Tagatosa (Figura I.8.) que es un monosacárido (cetohexosa)
de origen natural, isómero de la D-galactosa, posee el aspecto de polvo
cristalino blanco con un poder edulcorante del 92% respecto a la sacarosa
(Oh, 2007; Taylor et al., 2008; Calzada-León et al., 2013). Se encuentra
de manera natural en varios alimentos, como queso y yogurt, entre otros.
Se produce comercialmente a partir de la lactosa en un proceso que
implica la isomerización de la lactosa a D-galactosa y aunque se extrae de
la proteína de la leche, en su presentación final no contiene ninguna traza
de lactosa, ni tampoco presenta gluten ni fructosa, por lo que puede ser
consumida por personas con intolerancias. Presenta propiedades
prebióticas lo que resulta beneficioso para el organismo y posee un índice
glucémico así como un aporte calórico próximos a cero.
Es adecuada para los diabéticos porque no se metaboliza a
través de la sangre, sino que pasa directamente por el aparato digestivo, y
por lo tanto no afecta al nivel de glucosa. Posee propiedades tecnológicas
similares a la sacarosa como aspecto y sabor. Se considera un ingrediente
funcional debido a que se metaboliza parcialmente y ejerce funciones de
fibra soluble, favoreciendo la proliferación de bacterias ácidolácticas. Es
termoestable y puede emplearse para elaborar repostería. Previene la
caries dental (Levin, 2002; Petersen-Skytte, 2006; Oh, 2007; Lu, 2008;
Taylor et al., 2008; Donner et al., 2010; Petersen-Skytte et al., 2012;
Calzada-León et al., 2013; Chattopadhyay et al., 2014). Está reconocida
como un producto seguro por la FDA (Food and Drug Administration), la
FAO y la OMS (OMS, 2001). Además se encuentra dentro de los nuevos
alimentos/ingredientes alimentarios autorizados por la Unión Europea,
con arreglo al Reglamento Europeo nº 258/97 (CE, 2005a), con uso
autorizado como "nuevo ingrediente alimentario", desde el año 2005.

I. Introducción
26
En cuanto a la Isomaltulosa, es un disacárido reductor, isómero
de la sacarosa (Figura I.8), presente en pequeñas cantidades en la caña de
azúcar y la miel (Lina et al., 2002). Industrialmente se obtiene a partir de
la sacarosa (Schiweck et al., 1990). Posee un poder edulcorante de
aproximadamente un 42% frente a la sacarosa, y cabe destacar que por su
bajo índice higroscópico, proporciona estabilidad a productos como
caramelos, chicles y chocolate alargando su vida útil (De Oliva-Neto et
al., 2009). Su poder calórico es similar a la sacarosa, por lo que puede ser
una fuente de energía alternativa a la misma (Lina et al., 2002). Resulta
muy interesante su aplicación al desarrollo de alimentos para diabéticos y
para deportistas por su lenta liberación de glucosa y fructosa. Proporciona
la misma cantidad de energía que el azúcar común, pero con un leve
efecto sobre los niveles de azúcar en sangre y de insulina en el cuerpo
humano, siendo además totalmente digerible (Lina et al. 2002). De
acuerdo con el Reglamento Europeo nº258/97 (CE, 2005b), de la Unión
Europea, se autorizó su comercialización como nuevo alimento o nuevo
ingrediente alimentario en el año 2005.
Figura I.8. Estructuras moleculares de tagatosa, isomaltulosa y
steviósido de stevia.
Tagatosa
Isomaltulosa
Steviósido

I. Introducción
27
Por todas las propiedades mencionadas, estos
azúcares/edulcorantes naturales parecen ofrecer buenas expectativas
como sustitutivos de los azúcares tradicionales, siendo aptos para
cualquier sector de la población, incluso para aquellos que padecen
diabetes, obesidad o tienen predisposición a la caries dental.
(Coussement, 1999; Chacón-Villalobos, 2006).
I.3. Monitorización mediante redes de sensores inalámbricos
Las Redes Inalámbricas de Sensores (RIS), también conocidas
como Wireless Sensor Networks (WSN), han sido identificadas como una
de las tecnologías más prometedoras, por diversos motivos, entre ellos
porque dan respuesta a las exigencias actuales referentes al
establecimiento de redes que cubran necesidades de comunicación de
forma flexible (tiempo y espacio) y autónoma (autoconfiguración e
independencia de una estructura fija) (Bonastre et al., 2012; Capella et
al., 2014). De esta forma, gracias al avance de las comunicaciones
inalámbricas y las redes de sensores, la tecnología está permitiendo medir
parámetros que antes no se podían medir con dispositivos de pequeño
tamaño y de bajo coste energético y económico.
Por esta circunstancia se ha propiciado la aparición de redes de
sensores, donde pueden colocarse nodos de sensores inalámbricos debido
a su bajo coste y consumo para poder realizar la monitorización de forma
continua y prolongada en el tiempo, hecho que no era posible con los
anteriores dispositivos de medición manual, donde un operario realizaba
las mediciones de forma puntual. Asimismo, dichos dispositivos (nodos)
son capaces de obtener información del entorno y reenviarla de forma
inalámbrica a un centro de coordinación lo que ofrece posibilidades
inimaginables en multitud de aplicaciones (Bonastre et al., 2012; Capella
et al., 2014). En la mayoría de las aplicaciones se pretende que los nodos
no requieran mantenimiento, puesto que una vez desplegados no son
recuperables. En este entorno, los mayores desafíos se encuentran en
I. Introducción
28
minimizar dos factores fundamentales: coste y consumo, prolongando al
máximo el tiempo de servicio.
En los últimos años se han propuesto numerosos protocolos para
RIS. Sin embargo, la nueva arquitectura denominada EDETA (Energy-
efficient aDaptative hiErarchical and robusT Architecture) se propone
como la más apropiada para ésta aplicación y prometedora, enfocada
principalmente a reducir el consumo de energía (Capella et al., 2009).
Una arquitectura establece la organización lógica de los dispositivos que
forman la red, definiendo la operativa de la misma, con el objetivo de
proporcionar las mejores características de comunicación, fiabilidad,
flexibilidad, etc. Además, la arquitectura propuesta es escalable, auto-
configurable, soporta de forma transparente múltiples sumideros, y
proporciona características como tolerancia a fallos y tiempos acotados,
sin degradar las prestaciones de la red (Capella et al., 2014).
La principal innovación consiste en sustituir sensores de elevada
complejidad, de coste elevado y limitados en número, por una
infraestructura de comunicaciones con un número mayor de dispositivos
sensores, más sencillos y más baratos porque cada nodo está dotado de
enlaces de radio de baja potencia de tal modo que el área de cobertura es
relativamente pequeña. Se obtienen de éste modo, magnitudes físicas del
entorno, que además dan soporte a las comunicaciones de otros nodos
como elementos de infraestructura. De esta forma se consigue
economizar de forma significativa el consumo de potencia (Capella et al.,
2014). Los nodos por medio de los sensores, obtienen la información, y
posteriormente, la traducen y la transcriben a los nodos sumideros
utilizando las comunicaciones inalámbricas, éstos a su vez, reciben los
datos de todos los nodos sensores de la red, los procesan y los reenvian
hacia el sistema de gestión de la información. Esta información, se
almacena en la base de datos, y en tiempo real por medio de internet los
datos son accesibles desde un móvil (Bonastre et al., 2012; Capella et al.,
2014).

I. Introducción
29
La estructura del nodo sensor, se muestra en la Figura I.9., donde
se puede observar el microcontrolador (interpreta los datos), la RIS (con
un corto rango debido a las restricciones energéticas), una pequeña
batería y el sensor, que es el que se encarga de obtener los datos que a su
vez, serán procesados y transmitidos.
Figura I.9. Estructura del nodo sensor (Capella et al., 2014).
La estructura del nodo sumidero, está basada en un
microcontrolador, como se muestra en la figura I.10. Además de recibir la
información, la procesa y detecta las situaciones de alarma generando una
respuesta por medio de el sistema de tolerancia a fallos, para corregir los
errores en las medidas o cualquier otra eventualidad (Bonastre et al.,
2012; Capella et al., 2014). Está formado por un interfaz de sistemas de
comunicación inalámbricos (RIS), compatible con los nodos sensores;
una interfaz LAN/WAN, que recibe la señal de comunicación; un
microcontrolador que recoge los datos de los nodos sensores y un sistema
de almacenamiento de datos.
Sensor/es Microcontrolador
Batería
Comunicación
inalámbrica
(RIS)

I. Introducción
30
Figura I.10. Estructura del nodo sumidero (Capella et al., 2014).
La característica principal de las RIS, que es su capacidad de
organización automática. Así, es posible realizar despliegues de sensores
en cualquier situación. De esta forma es posible mantener la red en
funcionamiento incluso cuando algunos nodos se encuentran fuera de
servicio, debido a fallos, modo bajo consumo, agotamiento baterías, etc.
En estos casos la red es capaz de reorganizarse y continuar funcionando.
A continuación, en la Figura I.11., se puede observar el esquema de la
visión global de la arquitectura EDETA.
La evaluación de los mecanismos se ha realizado mediante una
doble vía: implementación real y simulación, demostrándose que los
mecanismos propuestos consiguen proporcionar robustez en las
comunicaciones, tolerancia a fallos y tiempos de respuesta acotados. Esta
arquitectura ha sido aplicada con éxito a sistemas reales en diversos
campos como la automoción, aplicaciones industriales, entornos
inteligentes, identificación de productos, domótica y seguridad, control de
consumo energético, estudio de invernaderos, monitorización del medio
ambiente, y un sinfín de nuevas aplicaciones entre ellas, en la industria
alimentaria (Boukerche, 2009).
WSN radio
Data storage Microcontroller
LAN / WANLAN/WAN
Microcontrolador
WSN Radio
Alimentación
perpetua
ESTRUCTURA
NODO SUMIDERO
ALMACENAMIENT
DATOS
INTE
RNET
ACCESO
EN
Nod
o
sens
or
Nod
o
sens
or
Nod
o
sens
or
Nod
o
sens
or
Nod
o
sens
or
Nod
o
sens
or
Nod
o
sens
or
Nod
o
sens
or
Nod
o
sens
or

I. Introducción
31
Figura I.11. Esquema de la arquitectura EDETA.
Asimismo, el diseño de una red de sensores, cuando se aplica a la
trazabilidad de los alimentos debe tener en cuenta, los siguientes
requisitos: recursos limitados, entornos dinámicos, uso del medio de
transmisión no fiable, la diversidad de aplicaciones, la privacidad y la
seguridad alimentaria. De acuerdo con éste último punto, en el
Reglamento Europeo No 1935/2004 y No 450/2009, se establecen los
materiales y objetos activos e inteligentes destinados a entrar en contacto
con los alimentos en los envases, con el fin de garantizar que no hay
efectos negativos que pongan en peligro la seguridad alimentaria y la
salud humana.
Anteriores estudios han propuesto sistemas de trazabilidad sobre el
control de la temperatura en la cadena alimentaria en condiciones de
refrigeración durante el almacenamiento y transporte (Wang et al., 2006;
Zhang et al., 2009). En la presente tesis, se propone la monitorización en
mermeladas, con el fin de controlar su trazabilidad durante el periodo de
almacenamiento, y así, poder observar los cambios producidos, de forma
automática y en remoto, proporcionando además características de
fiabiliad, a tiempo real alertas automáticas por parte del sistema, entre
otras.

I. Introducción
32
I.4. Referencias
Álvarez, J., Pastoriza, S., Alonso-Olalla, R., Delgado-Andrade, C.,
Rufián-Henares J.A. (2014). Nutritional and physicochemical
characteristic of commercial Spanish citrus juices. Food Chemistry,
164, 396–405.
Bahri, S., Zerrouk, N., Aussel, C., Moinard, C., Crenn, P., Curis, E.,
Chaumeil, J-C., Cynober, L., Sfar, S. (2013). Review_Citrulline:
From metabolism to therapeutic use. Nutrition, 29:479–484
Bakkali, F., Averbeck, S., Averbeck, D., Idaomar, M. (2008). Biological
effects of essential oils – A review. Food and Chemical Toxicology,
46:446–475.
Blanco, J. (2002). Consumir azúcar con moderación. Revista Cubana de
Alimentación y Nutrición, 16(2):142-5
Bonastre, A., Capella, J.V., Ors, R., Peris, M. (2012). In-line monitoring
of chemical analysis processes using Wireless Sensor Networks.
TRAC - Trends in Analytical Chemistry, 34,111-125.
Botanical (2012). Propiedades alimenticias de la fructosa. Dirección
URL:http://www.botanical-online.com/fructosapropiedades.htm.
Consulta Mayo 2015
Boukerche, A. (2009). Algorithms and Protocols for Wireless Sensor
Networks. Boukerche, A. (ed.), Wiley & Sons, New Jersey, USA.
Calzada-León, R., Ruiz-Reyes, M.L., Altamirano-Bustamante, N.,
Padrón-Martínez, M.M. (2013). Features of the noncaloric sweeteners
and their use in children. Acta Pediátrica de México, 34(3):141–153.
Capella, J.V., Bonastre, A., Ors, R., Climent, S. (2009). A new energy-
efficient, scalable and robust architecture for wireless sensor
networks. IEEE/IFIP International Workshop on Wireless Sensor
Networks: theory and practice, El Cairo, Egypt, pp. 42-47.
Capella, J.V., Bonastre, A., Ors, R., Peris M. (2014). A step forward in
the in-line river monitoring of nitrate by means of a wireless sensor
network, Sensors and Actuators B-Chemical, 195: 396-403.

I. Introducción
33
Chacón-Villalobos, A. (2006). Current Perspectives agribusiness
oligofructosaccharides (FOS). Agronomía Mesoamericana, 17(2):265-
286.
Chatsudthipong, V., Muanprasat C. (2009). Stevioside and related
compounds: Therapeutic benefits beyond sweetness. Pharmacology
and Therapeutic, 121:41-54.
Chattopadhyay, S., Raychaudhuri, U., Chakraborty, R. (2014). Artificial
sweeteners – a review. Journal Food Science and Technology, 51(4):
611–621.
Conesa, C., Fito, P., Fito, P.J., Conesa, E. (2013). El bioetanol una
alternativa a los residuos agrícolas y agroindustriales de frutas y
hortalizas. Revista de fruticultura, 26:40-47. ISSN: 2013-5742.
Conselleria de Presidencia y Agricultura, Pesca, Alimentación y Agua.
(CAPAA). Generalitat Valenciana. (2014). Informe de Superficies y
Producciones de los principales cultivos de la Comunitat Valenciana.
Dirección URL: http://www.agricultura.gva.es/ Consultada en Mayo
2015.
Conselleria de Presidencia y Agricultura, Pesca, Alimentación y Agua.
(CAPAA). Generalitat Valenciana. (2010). Orden 39/2010 de 12 de
Diciembre, de la Consellería de Agricultura, Pesca y Alimentación,
por la que se aprueba el Reglamento de la Indicación Geográfica
Protegida Cítricos Valencianos y su consejo regulador. Dirección
URL:http://www.agricultura.gva.es/web/web/guest/comercialización/
marcas-de-calidad/consejos-reguladores/c.r.i.g.p.citricos-valencianos
Consultada en Mayo 2015.
Coussement, P, (1996). Pre and synbiotics with inulin and oligofructose.
Food Technology Europe, January, 102-104.
DATACOMEX. (2014). Estadísticas de Comercio Exterior Español.
Ministerio de Economía y Competitividad. Gobierno Español.
Dirección URL: http://datacomex.comercio.es Consultada en Mayo
2015.
I. Introducción
34
Damodaran, S., Parkin, K.L., Fennema, O.R. (2008). Fennema's food
chemistry (4th ed). CRC Press, Taylor and Francis Group. Boca
Raton. Florida, USA.
De Oliva-Neto, P., Menão, P.T.P. (2009). Isomaltulose production from
sucrose by Protaminobacter rubrum immobilized in calcium alginate.
Bioresource Technology, 100:252–4256.
Donner, T.W., Magder, L.S., Zarbalian, K. (2010). Dietary
supplementation with D-tagatose in subjects with type 2 diabetes leads
to weight loss and raises high-density lipoprotein cholesterol.
Nutrition Research, 30:801–806.
Earle, R.L. (1988). Ingeniería de alimentos. Ed. Acribia, S.A. 2ªEdición.
Zaragoza, España.
Edwards, W.P. (2002). La ciencia de las golosinas. Ed. Acribia, S.A.,
Zaragoza, España.
European Food Safety Authority (EFSA). (2011). Revised exposure
assessment for steviol glycosides for the proposed uses as a food
additive. EFSA Journal, 9(1):1972. doi:10.2903/j.efsa.2011.1972
FAOSTAT. (2013). Organización de las Naciones Unidas para la
Alimentación y la Agricultura (FAO). Datos estadísticos. Datos de
producción, rendimiento y superficie cosechada. Dirección URL:
http://faostat3.fao.org/browse/Q/QC/S Consultada en Mayo 2015.
Franck, A. (2002).Technological functionality of inulin and oligofructose.
British Journal of Nutrition, 87: 287-291.
Ghosh, S., Subudhi, E., Nayak, S. (2008). Antimicrobial assay of Stevia
rebaudiana Bertoni leaf extracts against 10 pathogens. International
Journal of Integrative Biology, 2:27-31.
Godshall, M.A. (2007). The expanding world of nutritive and non-
nutritive sweeteners. Sugar Journal, 69:12-20.
Goyal, SK., SamsherR and Goyal, RK. (2010).Stevia (Stevia rebaudiana)
a bio-sweetener. A review. International Journal of Food Sciences and
Nutrition, 61:1-10.

I. Introducción
35
Hong, M., Hartig, N., Kaufman, K., Hooshmand, S., Figueroa, A., Kern,
M. (2015). Watermelon consumption improves inflammation and
antioxidant capacity in rats fed an atherogenic diet. Nutrition
Research, 35: 251–258.
Instituto Valenciano de Competitividad Empresarial (IVACE). (2014).
Generalitat Valenciana. Cítricos de la Comunidad Valenciana
Dirección URL:http://internacional.ivace.es/estudios/informacion_
sectorial_cv.html Consultada en Mayo 2015.
JECFA. (2008). Joint FAO/WHO Expert Committee on Food Additives
Steviol glycosides. In Compendium of Food Additive Specifications,
69th Meeting, FAO/WHO Monographs 5, Rome, Italy.
Karim, A. y Bhat, R. (2009). Fish gelatin: properties, challenges, and
prospects as an alternative to mammalian gelatins. Food
Hydrocolloids 23:563-576.
Kroyer, J. (2010). Stevioside and Stevia-sweeter in food: application,
stability and interaction with food ingredients. Journal für
Verbraucherschutz und Lebensmittelsicherheit, 5: 225–229.
Lina, B., Jonker, D., Kozianowski, G. (2002). Isomaltulose
(Palatinose®): a review of biological and toxicologycal studies. Food
and Chemical Toxicology, 40:1375-1381.
Lemus-Moncada R., Vega-Gálvez A., Zura-Bravo L., Ah-Hen K. (2012).
Stevia rebaudiana Bertoni, source of a high-potency natural
sweetener: A comprehensive review on the biochemical, nutritional
and functional aspects. Food Chemistry, 132: 1121-1132.
Ledur, M.J., Tessaro, I., Zapata, C.P. (2013). Physicochemical
characterization of Saccharides Powder Obtained from Yacon Roots
(Smallanthus sonchifolius) by Membrane Technology. Brazilian
Archives of Biology and Technology, 56(6):1024–1033.
Levin, G.V. (2002). Tagatose, the new GRAS sweetener and health
product. Journal of Medical Food, 5(1):23-36.

I. Introducción
36
Lu, Y., Levin, G.V. & Donner, T.W. (2008). Tagatose, a new antidiabetic
and obesity control drug. Diabetes Obesity and Metabolism,10:109–
134.
Ministerio de Agricultura, Alimentación y Medio Ambiente Gobierno de
España (MAGRAMA). (2012). Producciones Agrícolas. Dirección
URL: http://www.magrama.gob.es/ es/agricultura/temas/ producciones
-agricolas/frutas-y hortalizas/ Consultada en Mayo 2015.
Ministerio de Agricultura, Alimentación y Medio Ambiente Gobierno de
España (MAGRAMA). (2014). Resultados de la encuesta sobre
superficies 2014. Dirección URL: http://www.magrama.gob.es
/es/estadistica/temas/estadisticas-agrarias/00ESPA%C3%91A_tcm7-
352546.pdf Consultada en Mayo 2015.
Moeller, S.M., Fryhofer, S.A., Osbahr, A.J., Robinowitz C.B. (2009).
The effects of high fructose syrup. Journal of the American College of
Nutrition, 28(6):619-26.
Navarro, P., Pérez-López, A. J., Mercader, M. T., Carbonell-Barrachina,
A. A., & Gabaldón, J.A. (2011). Antioxidant activity, color,
carotenoids composition, minerals, vitamin C and sensory quality of
organic and conventional mandarin juice, cv. Orogrande. Food
Science and Technology International, 17:241–248.
O'Donnell, K., Kearsley, M., (2012). Sweeteners and Sugar Alternatives
in Food Technology (2th ed.). Wiley-Blackwell (Eds.), Chichester,
West Sussex, U.K.
Oh, D.K. (2007). Tagatose: properties, applications, and biotechnological
processes. Applied Microbiology and Biotechnology, 76(1):1-8.
Organización Mundial de la Salud (OMS/WHO). (2010).
Dieta alimentaria. Dirección URL:http://www.who.int/
dietphysicalactivity/childhood/es/ Consultada en Mayo 2015.
Organización Mundial de la Salud (OMS/WHO). (2014). Consumo de
azúcares. Dirección URL: http://www.who.int/mediacentre/
news/notes/2014/consultationsugar-guideline/en/ Consultada en
Mayo 2015.
I. Introducción
37
Organización Mundial de la Salud (OMS/WHO).(2001). Evaluation of
certain food additives and contaminants (Fifty-fifth report of the Joint.
FAO/WHO Expert Committee on Food Additives). WHO Technical
Report Series, 901:13-15.
Peinado, I., Rosa, E., Heredia, A., Andrés, A. (2012). Rheological
characteristics of healthy sugar substituted spreadable strawberry
product. Journal of Food Engineering, 113(3):365-373.
Periche, A. Heredia, A., Escriche, I., Andrés, A. Castelló, M.L. (2015).
Potential use of isomaltulose to produce healthier marshmallows.
LWT-Food Science and Technology, 62(1):605-612.
Petersen-Skytte, U. (2006). Tagatose. En: Sweeteners and sugar
alternatives in food technology, pp. 262-292. Helen Mitchell
(Editora), Blackwell Publishing Ed., Oxford, U.K.
Pointing, J.D. (1973). Osmotic dehydration of fruits: recent modifications
and applications. Process Biochemistry, 8(12): 12-22.
Rao, V.A. (2001). The prebiotic properties of oligofructose at low
intake levels. Nutrition Research, 21: 843–848.
Real Decreto (R.D). (2003). Real Decreto 863/2003, de 5 de julio, por el
que se establecen la norma de calidad para la elaboración,
comercialización y venta de confituras, jaleas, «marmalades» de frutas
y crema de castañas. B.O.E., 160:26175-26178.
Reglamento Europeo (CE). (2004). Reglamento (CE) No 1935/2004 del
parlamento europeo y del consejo, de 27 de octubre de 2004, sobre los
materiales y objetos destinados a entrar en contacto con alimentos y
por el que se derogan las Directivas 80/590/CEE y 89/109/CEE.
Diario Oficial de la Unión Europea, L 338: 4–17.
Reglamento Europeo (CE). (2005a). Decisión de la Comisión, de 25 de
julio 2005, por la que se autoriza la comercialización de la tagatosa
como nuevo alimento o nuevo ingrediente alimentario con arreglo al
Reglamento (CE) nº 258/97 del Parlamento Europeo y del Consejo.
Diario Oficial de la Unión Europea, L 160:28-30.

I. Introducción
38
Reglamento Europeo (CE). (2005b). Decisión de la comisión de 4 de
abril de 2005 por la que se autoriza la comercialización de la
isomaltulosa como nuevo alimento o ingrediente alimentario con
arreglo al Reglamento (CE) nº 258/97 del Parlamento Europeo y del
Consejo. Diario Oficial de la Unión Europea, L 160:28-30.
Reglamento Europeo (CE). (2006). Directiva 2006/52/CE del Parlamento
Europeo y del Consejo, de 5 de julio de 2006, por la que se modifica
la Directiva 95/2/CE relativa a aditivos alimentarios distintos de los
colorantes y edulcorantes y la Directiva 94/35/CE relativa a los
edulcorantes utilizados en los productos alimenticios. Diario Oficial
de la Unión Europea, L 204:10-22.
Reglamento Europeo (CE). (2008). Reglamento (CE) nº 1333/2008 del
Parlamento Europeo y del Consejo, de 16 de diciembre de 2008, sobre
aditivos alimentarios 1338/2008. Diario Oficial de la Unión Europea,
L 354:16-32.
Reglamento Europeo (CE). (2009). Reglamento (CE) No 450/2009 de la
comisión de 29 de mayo de 2009 sobre materiales y objetos activos e
inteligentes destinados a entrar en contacto con alimentos. Diario
Oficial de la Unión Europea, L 135: 3–11.
Renwick, A.G., Nordmann, H. (2007). First European conference on
aspartame: Putting safety and benefits into perspective. Synopsis of
presentations and conclusions. Food Chemistry and Toxicology, 45
(7):1308-1313.
Romero, LG., Charro, A.L, Calle-Pascual, A.L. (2002). Índice glucémico
y tratamiento nutricional de las personas con diabetes mellitus.
Endocrinología y Nutrición, 49(7): 232-239.
Schiweck, H., Munir, M., Rapp, K., Schenider, B., and Bogel, M. (1990).
New developments in the use of sucrose as an industrial bulk
chemical. Zuckerindustrie, 115: 555–565.

I. Introducción
39
Soffritti, M., Belpoggi, F., Degli Esposti, D., Lambertini, L., Tibaldi, E.,
Rigano, A. (2006). First experimental demonstration of the
multipotential carcinogenic effects of aspartame administered in the
feed to Sprague-Dawley rats. Environmental Health Perspectives, 114:
379–385.
Taylor, T.P., Fasina, O., Bell, L.N. (2008). Physical properties and
consumer liking of cookies prepared by replacing sucrose with
tagatose. Journal of food science, 73(3):145-151.
Vastenavond, C.M., Bertelsen, H., Hansen, S.J., Laursen, R.S., Saunders,
J., Eriknauer, K. (2012). Tagatose (D-tagatose). In: Nabors L, editor.
Alternative sweeteners, 13:197-222.
Wang, N., Zhang, N., Wang, M. (2006). Review_Wireless sensors in
agriculture and food industry-Recent development and future
perspective. Computers and Electronics in Agriculture,50:
1–14.
Weihrauch, M.R., Diehl, V. (2004) Artificial sweeteners-do they bear a
carcinogenic risk?. Annals of Oncology, 15(10): 1460-1465.
Wolever, T.M.S. (2006). The Glycaemic Index. A physiological
classification of dietary carbohydrate. Acribia Ed. Zaragoza, España.
Zhang, J., Liu, L., Mu,W., Moga, L. M., & Zhang, X. (2009).
Development of temperature managed traceability system for frozen
and chilled food during storage and transportation. Journal of Food
Agriculture and Environment, 7 (3), 28–31.

II. OBJETIVOS Y PLAN DE
TRABAJO


II. Objetivos y Plan de Trabajo
40
II. OBJETIVOS Y PLAN DE TRABAJO
II.1. Objetivo general
Se plantean tres objetivos generales en la presente Tesis Doctoral:
II.1.1. Desarrollar productos deshidratados osmóticamente, y
estudiar el efecto de edulcorantes naturales como tagatosa, isomaltulosa,
extracto acuoso de stevia y oligofructosa, como agentes osmóticos y así
poder establecer el efecto de las variables del proceso de formulación
sobre la cinética de transferencia de materia y su modelización en rodajas
de naranja y limón.
II.1.2. Desarrollar tres tipos de mermeladas (naranja, limón y
mandarina) y dos tipos de gelatinas (sandía y cítricos), formuladas con
edulcorantes saludables como tagatosa, isomaltulosa, y oligofructosa
como sustitutos de la sacarosa. Evaluar el efecto de los nuevos
edulcorantes sobre las propiedades físico-químicas, mecánicas, ópticas,
antioxidantes y sensoriales y finalmente su estabilidad microbiológica a
lo largo del periodo de almacenamiento.
II.1.3. Monitorización de las mermeladas de mandarina a lo largo
del periodo de almacenamiento mediante una red inalámbrica de sensores
basada en la arquitectura EDETA.
II.2. Objetivos específicos
Los objetivos específicos se han dividido en función de los
experimentales realizados en las frutas estudiadas, presentándose en el
mismo orden en el que se desarrollan en el capítulo de Resultados.
II.2.1.Cinética de deshidratación osmótica de rodajas de naranja
utilizando edulcorantes (isomaltulosa, extracto acuoso de stevia y
oligofructosa)

II. Objetivos y Plan de Trabajo
41
II.2.2. Modelización de la deshidratación osmótica de rodajas de
limón utilizando nuevos edulcorantes (tagatosa, isomaltulosa, extracto
acuoso de stevia y oligofructosa).
Realizar un estudio cinético, analizando cambios en la actividad de
agua, variación de masa total, de agua y de sólidos solubles, en las
rodajas de naranja y limón, en función de la combinación de edulcorantes
utilizada.
Analizar la difusividad efectiva obtenida del estudio cinético y el
comportamiento de los edulcorantes como agentes osmóticos.
II.2.3. Influencia de los edulcorantes saludables (tagatosa y
oligofructosa) sobre sus características fisicoquímicas en mermelada de
naranja.
II.2.4. Caracterización de mermeladas de limón elaboradas con
edulcorantes saludables (isomaltulosa y tagatosa).
II.2.5. Efecto de isomaltulosa y tagatosa como sustitutos de la
sacarosa en mermeladas de mandarina.
Desarrollo de mermeladas de naranja, mandarina y limón utilizando
edulcorantes de bajo índice glicémico y no cariogénicos, en sustitución de
la sacarosa en la formulación. Evaluar la influencia de la sustitución de la
sacarosa por edulcorantes no cariogénicos en las mermeladas.
Analizar los parámetros de composición, capacidad antioxidante,
propiedades reológicas y ópticas, al inicio y durante el periodo de
almacenamiento (45 días para las mermeladas de naranja, 60 días para las
mermeladas de limón y 360 días para las mermeladas de mandarina), y a
su vez comparar los parámetros con los obtenidos con mermeladas
comerciales formulada con sacarosa.
Estudiar la estabilidad microbiológica de las mermeladas de naranja
durante el periodo de almacenamiento
Evaluación sensorial mediante un panel de catadores, con el fin de
comprobar el nivel de aceptación del consumidor.

II. Objetivos y Plan de Trabajo
42
II.2.6. Trazabilidad fiable basada en redes de sensores
inalámbricos aplicado a una nueva formulación de mermelada de
mandarina.
Diseño de un sistema de trazabilidad, durante la etapa de
almacenamiento de los parámetros de humedad y temperatura, en
mermeladas de mandarina elaboradas con edulcorantes no cariogénicos y
de bajo índice glicémico (isomaltulosa y tagatosa).
Monitorización con redes de sensores inalámbricos sometidos a
EDETA (Energy-efficient aDaptative hiErarchical and robusT
Architecture), con el fin de garantizar las condiciones óptimas del
producto para su consumo.
Análisis experimental de composición, temperatura y estabilidad
microbiana durante todo el tiempo de almacenamiento (360 días).
II.2.7. Caracterización de gelatinas de sandía elaboradas con
edulcorantes no cariogénicos (isomaltulosa y tagatosa).
II.2.8. Influencia de los edulcorantes no cariogénicos (oligofructosa,
isomaltulosa y tagatosa) sobre sus características fisicoquímicas en
gelatinas de cítricos.
Desarrollo de gelatinas elaboradas con zumo de sandía para las
gelatinas de sandía, y con zumo de naranja, mandarina y limón, para las
gelatinas de cítricos utilizando edulcorantes de bajo índice glicémico y no
cariogénicos en sustitución de la sacarosa, y así poder evaluar su efecto
en la formulación.
Analizar los parámetros de composición, capacidad antioxidante,
propiedades ópticas y mecánicas, al inicio y durante el periodo de
almacenamiento (15 días para las gelatinas de sandía, y 45 días para las
gelatinas de cítricos), y a su vez comparar los parámetros con los
obtenidos con la gelatina comercial en el caso de las gelatinas de sandía.
Estudio de la estabilidad microbiana en el caso de las gelatinas de
cítricos durante el periodo de almacenamiento.

II. Objetivos y Plan de Trabajo
43
Evaluación sensorial mediante un panel de catadores y así
comprobar el nivel de aceptación.
II.3. Plan de trabajo
El plan de trabajo seguido en la presente Tesis Doctoral se estableció
en función de la consecución de los objetivos específicos planteados:
II.3.1. Revisión bibliográfica y de legislación vigente, en función de
la temática del estudio.
II.3.2. Planificación de experimentales, y puesta a punto de los
procesos de deshidratación osmótica y de elaboración de mermeladas y
gelatinas.
II.3.3. Obtención de la materia prima (naranjas, limones, mandarinas
y sandías), ingredientes (sacarosa y edulcorantes naturales).
II.3.4. Formulación con edulcorantes naturales, no cariogénicos y de
bajo índice glicémico como isomaltulosa, tagatosa, oligofructosa y
extracto acuoso de stevia, en el caso de la deshidratación osmótica, y para
mermeladas y gelatinas con isomaltulosa, tagatosa, oligofructosa.
II.3.5. Caracterización de la composición (contenido en humedad y
sólidos solubles, actividad del agua y pH), iniciales y durante el periodo
de estudio, de los productos obtenidos en la deshidratación osmótica.
II.3.6. Análisis de la composición, capacidad antioxidante,
propiedades reológicas (ensayo estacionario y oscilatorio), ópticas
(espacio de color Cie L*a*b*), mecánicas (ensayo TPA de textura) y
sensoriales (panel de 30 catadores, escala hedónica 9-puntos), al inicio y
durante el periodo de estudio, en mermeladas y gelatinas. Estudio y
comparación con marcas comerciales.
II.3.7. Evaluación de la estabilidad microbiológica en mermeladas y
gelatinas, al inicio y durante el periodo de almacenamiento.
II.3.8. Tratamiento de datos aplicando técnicas estadísticas
(Statgraphics Centurion, Statpoint Technologies, Inc. Warrenton,
Virginia, USA).

III. RESULTADOS


III.1.KINETICS OF OSMOTIC DEHYDRATION OF
ORANGE SLICES USING HEALTHY SWEETENERS
Susana Rubio-Arraez1, Juan Vicente Capella2,
María Dolores Ortolá1, and María Luisa Castelló1.
1Institute of Food Engineering for Development and 2Institute ITACA (ICT Technologies),
Universitat Politècnica de València,
Camino de Vera, s/n. 46022, Valencia, Spain
International Food Journal Research
22(5): 2162-2166 (2015)


III. Resultados
44
ABSTRACT
Orange slices have been osmotically dehydrated using as osmotic
agents new healthy sweeteners: isomaltulose, oligofructose and aqueous
extract of stevia. A kinetic study was done by analyzing changes in the
water activity, total mass, mass of water and mass of soluble solids in
orange slices, depending on the combination of sweeteners used in syrups
(A: 30% isomaltulose and 70% of water; AS: 30% of isomaltulose, 35%
aqueous solution with 1% of stevia and 35% water; B: 20% isomaltulose,
20% oligofructose and 60% water and BS: 20% isomaltulose, 20%
oligofructose, 30% aqueous solution with 1% of stevia and 30% water).
The results showed that the incorporation of stevia in syrups increased
total mass and water mass losses of orange slices. Besides, by fitting
second Fick’s law effective diffusivities have been obtained in order to
estimate the time to reach different concentrations of soluble solids in
orange slices.
Keywords: orange, isomaltulose, oligofructose, stevia, osmotic
dehydration, kinetics.
INTRODUCTION
Orange is a food with high content of healthy nutrients and it has great
tradition and economic importance in Valencia. The development of new
orange products would be a good way to promote the consumption of this
fruit, improving the nutritional health of society.
In this way, the osmotic dehydration (OD) has been widely used for
conservation and design of new products from fruits. OD consists on the
introduction of foods in a low water activity solution in order to induce
water outflows and inflows of external solutes and therefore allows
storing the foods for longer periods improving the stability and quality of
products. This treatment depresses the food water activity and improves

III. Resultados
45
the biochemical and microbiological stability whereas producing physical
and structural changes during its storage (Cháfer et al., 2001; Park et al.,
2002; Gomes Alves et al., 2005; Moura et al., 2005; García-Segovia et
al., 2010; Monnerat et al., 2010; Castro-Giráldez et al., 2011).
Nowadays there is an important demand for high quality products in
the food market and osmodehydrated oranges with healthy osmotic
agents could be very appreciated by consumers. Sugars have been usually
used as osmotic agents to obtained osmodehydrated fruits. However, it is
widely known that sugars have cariogenic effects and most of them
increase the glucose levels in blood and can be related with different
diseases (diabetes, obesity, etc…). Fortunately, healthy osmotic agents
are already available in the market with beneficial properties for our
organisms since they are non-cariogenic and have a low glycemic index
(Soto et al., 2002; Goyal et al., 2010). This is the case of isomaltulose,
oligofructose and stevia.
Isomaltulose is a reducing disaccharide which is naturally present in
honey, and sugar cane juice, and their taste and viscosities of aqueous
solutions appearance are similar to sucrose. The physicochemical
properties of isomaltulose (Palatinose®) permit the substitution of
sucrose in most sweet foods (De Oliva-Neto et al., 2009; Lina et al.,
2002; Peinado et al., 2013). It has a sweetening power of approximately
42% compared to sucrose, and also should be noted that because of its
low hygroscopic rate, provides stability to products such as candy, gum
and chocolate. It can be an alternative source of energy to sucrose,
because its caloric power is similar. However, the solubility at room
temperature of isomaltulose (30%) is much lower than sucrose (65%)
(Kaga and Mizutani, 1985; Schiweck et al., 1990; Periche et al., 2014).
Regarding the oligofructose, it is obtained by partial enzymatic
hydrolysis of chicory inulin and it is a soluble dietary fiber with prebiotic
character to enhance the growth of beneficial gut bacteria and calcium
absorption. On the other hand, oligofructose is low in calories, which

III. Resultados
46
gives multiple health benefits (Bosscher et al., 2006; Raschka et al.,
2005; Rao, 2001). Nowadays, it is used as ingredient in many food
products, and it is known that reduced serum insulin and glucose.
Oligofructose helps to decrease hepatic fatty acid and triacylglycerol
synthesis and coordinates the activity of all lipogenic enzymes (Franck,
2002; Al-Sherajia et al., 2013).
Stevia is a plant that has been consumed as a food and also used as a
medicine in some countries such as Japan and Paraguay (Lemus-
Mondaca et al., 2012). This plant has a sweetening power 15 times
greater than sucrose, multiple therapeutic properties (anti-oxidant, anti-
microbial, anti-fungal activity, anti-hyperglycemic, anti-hypertensive,
anti-inflammatory, anti-tumor, anti-diarrheal and diuretic effects), but it is
calorie free (Chatsudthipong et al., 2009). Currently, the use of stevia
leaves or extracts from stevia was approved by FDA as a dietary
supplement in the US, and under similar classifications in several other
countries, it has GRAS status (FDA GRAS Database, 2008). In
November 2011, the European Commission approved steviol glycosides
as food additives (European Commission, 2011).
Therefore, these new healthy sweeteners could be suitable for any
sector of the population, even for those with diabetes, obesity or with
predisposition to dental caries. Additionally, citric fruits are a good
source of bioactive compounds like ascorbic acid, polyphenols and
carotenoids that have been shown to be good contributors to the total
antioxidant capacity of foods and have been involved in the prevention of
some degenerative diseases (Devalaraja et al., 2011; Kim et al., 2011).
Thus, the aim of this study was to characterize the kinetic behavior of
the dehydrated orange slices using different combinations of healthy
sweeteners (isomaltulose, oligofructose and aqueous stevia extract) in
order to determine the time needed to obtain different levels of soluble
solids concentration in the fruit.

III. Resultados
47
MATERIALS AND METHODS
Preparation of sample
Valencia Late oranges were used as raw material, selected with
similar color, size and maturity stage of an agricultural plot from Líria
(Valencia). The oranges were peeled and cut into 0.5 cm thick slices
using a household slicer (Fagor Delice CF- 150).
Osmotic dehydration treatment
Isomaltulose (Palatinose™ PST-N, Beneo-palatinit), oligofructose
(Fructalose® OFP, Sensus) and an aqueous extract with 1% of dry leaves
Stevia (S. rebaudiana Raab, Vitalfood, Rohrbach, Germany) were used
as agents for osmotic dehydration. Table 1 shows the combinations of
these three sweeteners used in the four syrups considered and the code
assigned. The kinetic study was carried out for 48 hours by analyzing
samples at 0, 10, 20, 30, 45, 60, 90, 120, 240, 300 minutes and at 24 and
48 hours. The ratio between syrup and orange slices was 20:1 (w/w) in
order to not modify the concentration of soluble solids of the syrup, with
constant stirring.
Table III.1.1. Percentage of sweeteners in the syrups used in the study
of osmotic dehydration of orange slices.
Syrup
Isomaltulose
Oligofructose
Aqueous
solution
containing
1% of Stevia
Water
A 30% - - 70%
AS 30% - 35% 35%
B 20% 20% - 60%
BS 20% 20% 30% 30%

III. Resultados
48
Physicochemical analysis
Soluble solids of liquid phase in oranges slices and syrups were
measured by a refractometer (Abbe Refractometer, Atago), obtaining the
results in °Brix and also expressed as zs (kg soluble solids/kg liquid
phase). Moisture content (xw: kg water/kg orange slices) was analyzed
gravimetrically followed an adaption of the method AOAC, (2000).
Water activity (aw) was determined by a hygrometer (Decagon CX-1). All
determinations were made in triplicate.
Kinetic study and modeling
Variation of total mass, soluble solids and water mass were calculated
for all times considered in this study. Besides that, a Fick’s model was
used to obtain the effective diffusivity (De: m2/s) of soluble solids (Crank,
1975; Barat et al., 1998; Cháfer et al., 2001) depending on the
composition of the syrup used.
RESULTS AND DISCUSSION
Physicochemical analysis
The syrups used for this kinetic study reached 26.5±0.4, 27.7±0.4,
30.0±0.4 and 32.5±0.4 of ºBrix for formulations A, AS, B and BS,
respectively. These results show that the highest proportions of solutes in
syrups with oligofructose increased the °Brix and the same effect was
observed when aqueous extract of stevia was added.
Figure 1 represents the results of aw and °Brix versus time of osmotic
dehydration as a function of the syrup employed. As was expected, the
longer the time of dehydration higher the concentration of soluble solids
in orange slices, especially for AS and BS. Other studies with orange and
other fruits (strawberry, apple, apricot) show similar results (Cháfer et al.,
2001; Castelló et al., 2006, 2009; İspir et al., 2009). In accordance with
this behavior, the water activity decreased, but less in samples

III. Resultados
49
osmodehydrated with syrups containing stevia extracts, indicating the
important influence of stevia in this process.
Figure III.1.1. Results in aw and °Brix dehydration function of time for
all the treatments studied.
Kinetic study and modeling
The results of variation of total mass (M), water mass (Mw) and
soluble solids mass (Ms) recorded in this study were obtained with the
following formulas (Shi et al., 1994; Fito et al., 1996) and are presented
in Figure 2.
∆𝑀 =𝑀𝑡−𝑀0
𝑀0 (1)
∆𝑀𝑤 =𝑀𝑡𝑥𝑤
𝑡 −𝑀0𝑥𝑤0
𝑀0 (2)
0.94
0.95
0.96
0.97
0.98
0.99
0 50 100 150 200 250 300
aw
Time (min)
9
13
17
21
25
29
0 50 100 150 200 250 300
Bri
x
Time (min)
0.94
0.95
0.96
0.97
0.98
0.99
0 10 20 30 45 60 90 120 240 300
aw
Time (s)
0.94
0.95
0.96
0.97
0.98
0.99
0 10 20 30 45 60 90 120 240 300
aw
Time (s)
9
13
17
21
25
29
0 10 20 30 45 60 90 120 240 300
Bri
x
Time (s)
9
13
17
21
25
29
0 10 20 30 45 60 90 120 240 300
Bri
x
Time (s)
9
14
19
24
29
ORANGE FRESH
10 30 60 120 300
Bri
x
Time (s)A AS B BS

III. Resultados
50
∆𝑀𝑠 =𝑀𝑡𝑥𝑠
𝑡−𝑀0𝑥𝑠0
𝑀0 (3)
Being
𝑀𝑖: mass of orange slices (kg) at time i (i=0 or t)
𝑀𝑤𝑖 : mass of water of orange slices (kg) at time i (i=0 or t)
𝑀𝑠𝑖
: mass of soluble solids of orange slices (kg) at time i (i=0 or t)
𝑥𝑤𝑖
: mass fraction of water (kg of water/kg of orange slices) at time i (i=0
or t)
𝑥𝑠𝑖
: mass fraction of soluble solids (kg of soluble solids/kg of orange
slices) at time i (i=0 or t)
There was also checked that the experimental total mass loss was
similar to the calculated mass loss by using eq. (4).
∆𝑀 = ∆𝑀𝑠 + ∆𝑀𝑤 (4)
In coherence with the previous results, both the addition of stevia and
oligofructose in syrups increased total and water mass losses of oranges
slices since their driving forces were greater than when only isomaltulose
was used.

III. Resultados
51
Figure III.1.2. Results of variation of total mass (ΔM), of water mass
(ΔMw) and soluble solid mass (ΔMs) as well as material balances recorded
in this study.
0.94
0.95
0.96
0.97
0.98
0.99
ORANGE FRESH
10 30 60 120 300
Time (sec)
aw
9
14
19
24
29
ORANGE FRESH
10 30 60 120 300
Bri
x
Time (sec)
A AS B BS
-0.4
-0.3
-0.2
-0.1
0.0
0 50 100 150 200 250 300ΔM
Time (min)
-0.5
-0.4
-0.3
-0.2
-0.1
0.0
0 50 100 150 200 250 300
ΔM
w
Time (min)
0.0
0.0
0.1
0.1
0.2
0 50 100 150 200 250 300
ΔM
s
Time (min)
-0.5
-0.4
-0.3
-0.2
-0.1
0.0
-0.4 -0.3 -0.2 -0.1 0.0
ΔΜ
w +
ΔΜ
s
ΔΜ experimental

III. Resultados
52
Moreover, the changes in the composition of the liquid phase of
orange slices were modeled using the eq. (5).
𝑌𝑠𝑡 =
(𝑧𝑠𝑡−𝑦𝑠)
(𝑧𝑠0−𝑦𝑠)
(5)
Where:
𝑌𝑠𝑡: driving force of soluble solids (dimensionless)
𝑧𝑠𝑖: soluble solid mass fraction in the liquid phase at time i (i=0 or t)
ys: soluble solid mass fraction in the osmotic solution used for
dehydration.
Therefore the ys is the maximum soluble solid concentration that the
orange slices could reached at equilibrium.
Figure 3 shows the experimental points of 1-Ys versus t0.5 to adjust
them to a simplified Fickian approach for diffusion in a plane sheet, with
only one term of the Fick’s second law series solution for short times
(Crank, 1975) (equation 6). From the fitting of this model, it is possible to
obtain the kinetic parameter of effective diffusivity (De) which allows us
to predict the process time required to achieve a specific concentration of
soluble solids in orange slices (Table 2).
1 − 𝑌𝑠 = ⌊4𝐷𝑒𝑡
𝜋𝑙2⌋
0.5
(6)
Where, t is time of processing (s) and l is half thickness of the
dehydrated sample (m).

III. Resultados
53
Figure III.1.3. Results 1- 𝑌𝑠 vs. t 0.5 (square root of time of dehydration)
for all the treatments.
The results of De show that the best fitting was observed when AS
syrup was used in dehydration of orange slices. Furthermore, B syrup
presented a higher slope, which corresponded to the highest value of
effective diffusivity. This would corroborate that the combination of
oligofructose with isomaltulose implies a faster dehydration of orange
slices due to the highest concentration of soluble solids in those osmotic
solutions.

III. Resultados
54
Table III.1.2. Results of the effective diffusion coefficient (De), slope
and correlation coefficient (R2) of Fick's equation for an infinite sheet
(Crank, 1975).
Syrup De (m2/s) Slope R²
A 2.16·10-09±1.2·10-10 2.06·10-3±0.06·10-3 0.71±0.02
AS 4.7·10-09±3·10-10 3.20·10-3±0.08·10-3 0.90±0.12
B 1.71·10-08±3·10-10 5.89·10-3±0.05·10-3 0.79±0.05
BS 7.08·10-09±1.3·10-10 3.8·10-3±0.03·10-3 0.68±0.16
CONCLUSIONS
This study makes possible to model the osmotic dehydration behavior
of orange slices depending on the combination of different new non
cariogenic and prebiotic sweeteners (isomaltulose, oligofructose and
stevia) used in the osmotic solution. Thus, the different effective
diffusivity has been obtained to predict the required times to dehydrate
orange slices. Moreover, it has been checked that stevia aqueous extract
enhance the concentration of soluble solids in these products. Therefore
these new sweeteners could be used to develop healthier osmodehydrated
products also from other fruits.
REFERENCES
Al-Sherajia, S.H., Ismaila, A., Manap M.Y., Mustafa, S., Yusofa, R.M.
and Hassana, F. A. 2013. Prebiotics as functional foods: A review.
Journal of Functional foods 5:1542–1553.
AOAC (2000). Official Methods of Analyisis of AOAC International
17th edition. Gaithersburg, MD, USA.

III. Resultados
55
Barat, J.M., Chiralt, A. and Fito, P. 1998. Equilibrium in cellular food
osmotic solution systems as related to structure. Journal of Food
Science 63:836–840.
Bosscher, D., Van Loo, J. and Franck, A. 2006. Inulin and oligofructose
as functional ingredients to improve bone mineralization. International
Dairy Journal 16:1092–1097.
Castelló, M.L., Fito, P.J. and Chiralt, A. 2006. Effect of osmotic
dehydration and vacuum impregnation on respiration rate of cut
strawberries. LWT-Food Science and Technology
39(10):1171–1179.
Castelló, M.L., Igual, M., Fito, P.J. and Chiralt, A. 2009. Influence of
osmotic dehydration on texture, respiration and microbial stability of
apple slices (Var. Granny Smith). Journal of Food Engineering 91:
1–9.
Castro-Giráldez, M., Tylewicz, U., Fito, P.J., Dalla Rosa, M. and Fito, P.
2011. Analysis of chemical and structural changes in kiwifruit (A.
deliciosa cv Hayward) through the osmotic dehydration. Journal of
Food Engineering 105:599–608.
Cháfer, M., González-Martínez, C., Ortolá, M.D., Chiralt, A. and Fito, P.
2001. Kinetics of osmotic dehydration in orange and mandarin peels.
Journal of Food Process Engineering 24:273–289.
Chatsudthipong, V. and Muanprasat, C. 2009. Stevioside and related
compounds: Therapeutic benefits beyond sweetness. Pharmacology &
Therapeutics 121(1):41–54.
Crank, J. 1975. The mathematics of diffusion Lorendon Press, Oxford,
U.K.
De Oliva-Neto, P. and Menão, P.T.P. 2009. Isomaltulose production from
sucrose by Protaminobacter rubrum immobilized in calcium alginate.
Bioresource Technology 100:4252–4256.
Devalaraja, S., Jain, S and Yadav, H. 2011. Exotic fruits as therapeutic
complements for diabetes, obesity and metabolic syndrome. Food
Research International 44:1856–1865.

III. Resultados
56
European Commission. 2011. Commission Regulation (EU) No
1131/2011 of 11 November 2011 amending Annex II to Regulation
(EC) No 1333/2008 of the European Parliament and of the Council
with regard to steviol glycosides. Official Journal of the European
Union, L295, 205–211.
Ferrando, M. and Spiess, W.E.L. 2001. Cellular response of plant tissue
during the osmotic treatment with sucrose, maltose, and trehalose
solutions. Journal of Food Engineering 49:115–127.
FDA GRAS Database, 2008. Stevia search in FDA GRAS Database.
Downloaded from: http://www.accessdata.fda.gov/scripts/fdcc/?set
=GRASNotices&sort=GRN_No&order=DESC&startrow=1& type=
basic& search=Stevia on 16/06/2014.
Franck, A. 2002. Technological functionality of inulin and oligofructose.
British Journal of Nutrition 87:287–291.
Fito, P. and Chiralt, A. 1996. Osmotic dehydration: an approach to the
modeling of solid food–liquid operations. In: Fito, P., Ortega, E. and
Barossa-Canovas, G.V. (Eds.), Food Engineering 2000, pp. 231–252.
Chapman & Hall, New York.
García-Segovia, P., Mognetti, C., Andrés-Bello, A. and Martínez-Monzó,
J. 2010. Osmotic dehydration of Aloe vera (A. barbadensis Miller).
Journal of Food Engineering 97:154–160.
Gomes Alves, D., Lucena Barbosa Jr. J., Colato Antonio, G. and Murr,
F.E.X. 2005. Osmotic dehydration of acerola fruit (M. punicifolia L.).
Journal of Food Engineering 68:99–103.
Goyal, S. Samsher, K. and Goyal, R. K. 2010. Stevia (Stevia rebaudiana)
a bio-sweetener: A review. International Journal of Food Sciences and
Nutrition 61:1–10.
İspir, A. and Toğrul, İ. T. 2009. Osmotic dehydration of apricot: Kinetics
and the effect of process parameters. Chemical Engineering Research
and Design 87:166–180.
Kaga,T. and Mizutani,T. 1985. Verwendung von Palinose fur
Nahrungsmittel. Seito Gijutsu Kenkyukaishi 34:45–57.

III. Resultados
57
Kim, I., Yang, M., Lee, O. and Kang, S. 2011. The antioxidant activity
and the bioactive compound content of Stevia rebaudiana water
extracts. LWT - Food Science and Technology 44:1328–1332.
Lina, B.A.R., Jonkera, D., Kozianowski and G. 2002. Isomaltulose
(Palatinose1): a review of biological and toxicological studies. Food
and Chemical Toxicology 40:1375–1381.
Lemus-Mondaca, R., Vega-Gálvez, A., Zura-Bravo, L. and Ah-Hen, K.
2012. Review. Stevia rebaudiana Bertoni, source of a high-potency
natural sweetener: A comprehensive review on the biochemical,
nutritional and functional aspects. Food Chemistry 132:1121–1132.
Monnerat, S.M., Pizzi, T.R.M., Mauro, M.A. and Menegalli, F.C. 2010.
Osmotic dehydration of apples in sugar/salt solutions: Concentration
profiles and effective diffusion coefficients. Journal of Food
Engineering 100:604–612.
Moura, C. P., Masson, M. L., and Yamamoto, C. I. 2005. Effect of
osmotic dehydration in the apple (P. malus) varieties Gala, Gold and
Fugi. Thermal Engineering 4(1):46-49.
Park, K.J., Bin, A., Reis Brod, F.P. and Brandini Park, T. H. K. 2002.
Osmotic dehydration kinetics of pear D’anjou (P. communis L.)
Journal of Food Engineering 52:293–298.
Peinado, I., Rosa, E., Heredia, A., Escriche, I. and Andrés, A. 2013.
Influence of processing on the volatile profile of strawberry spreads
made with isomaltulosa. Food Chemistry 138:621–629.
Periche, A., Heredia, A., Escriche, I., Andrés, A. and Castelló, M.L.
2014. Optical, mechanical and sensory properties of based-
isomaltulose gummy confections. Food Bioscience 7:37–44.
Rao, V.A. 2001. The prebiotic properties of oligofructose at low intake
levels. Nutrition Research 21:843–848.
Raschka, L. and Daniel, H. 2005. Mechanisms underlying the effects of
inulin-type fructans on calcium absorption in the large intestine of
rats. Bone 37:728–735.

III. Resultados
58
Schiweck, H., Munir, M., Rapp, K, Schenider, B. and Bogel, M. 1990.
New developments in the use of sucrose as an industrial bulk
chemnical. Zucreindustries 115:555–565.
Shi, X.Q. and Fito, P. 1994. Mass Transfer in Vacuum Osmotic
Dehydration of Fruits: A Mathematical Model Approach. LWT - Food
Science and Technology 27(1):67–72.
Soto, A.E. and Del Val, S. 2002. Extracción de los principios
edulcorantes de la Stevia rebaudiana. Revista de Ciencias Agrarias y
Tecnología de los Alimentos 20:1–5.
Toğrul, İ.T. and İspir, A. 2007. Effect on effective diffusion coefficients
and investigation of shrinkage during osmotic dehydration of apricot.
Energy Conversion and Management, 48:2611-2621.


II.2. MODELLING OSMOTIC DEHYDRATION OF
LEMON SLICES USING NEW SWEETENERS
Susana Rubio-Arraez1, Juan Vicente Capella2,
María Dolores Ortolá1, and María Luisa Castelló1.
1Institute of Food Engineering for Development and 2Institute ITACA (ICT Technologies),
Universitat Politècnica de València,
Camino de Vera, s/n. 46022, Valencia, Spain
International Journal of Food Science and Technology
50(9): 2046-2051 (2015)


III. Resultados
59
ABSTRACT
Lemon slices were osmotically dehydrated using the following healthy
sweeteners as osmotic agents: tagatose, isomaltulose, oligofructose and
aqueous extract of stevia. A kinetic study using a Fickian approach was
performed, which also analysed the changes in water activity, total mass,
mass of water and mass of soluble solids in lemon slices. The results
showed that the greatest value of effective diffusivity (De) in
osmodehydrated lemon slices was obtained from a combination of
oligofructose and stevia [De= (10.2±0.3) x 10-9 m2·s-1]. However, the
level of water activity (aw) reached with this syrup was the highest
(aw=0.978±0.004 after 1440 min) meaning that the product might be less
stable. Additionally, isomaltulose favoured the total mass loss, whereas
tagatose did the opposite. Finally, the syrup recommended for
dehydrating lemon slices would be a combination of tagatose,
oligofructose and aqueous extract of stevia since its De was similar to the
value obtained when only oligofructose and stevia were used, but aw
values were lower.
Keywords: lemon, tagatose, isomaltulose, oligofructose, stevia, osmotic
dehydration, kinetics.
INTRODUCTION
Citrus fruits have played an important role in the economy and dietary
habits in Spain. They are a good source of bioactive compounds like
ascorbic acid, polyphenols and carotenoids and have been involved in the
prevention of some diseases such as diabetes, obesity, cancer and
cardiovascular diseases (Devalaraja et al., 2011; Kim et al., 2011).
Among these citrus fruits, lemon is the product consumed the least due to
its high acidity. However, the addition of sweeteners might be an
effective way to counteract this feature. Therefore, the development of
new sweet lemon products could promote consumption of this fruit, and
in turn, improve the nutritional health of society.

III. Resultados
60
Osmotic dehydration (OD) might be a suitable technique for obtaining
such products, since it has been widely applied to other fruits, such as
oranges (Cháfer et al., 2001; Rubio-Arraez, et al., 2015), pears (Park et
al., 2002), tomatoes (Azoubel & Murr, 2004), apples (Derossi et al.,
2008; Castelló et al., 2009), apricots (İspir & Toğrul, 2009), strawberries
(Castelló et al., 2006; Castelló et al.,2010), kiwis (Castro-Giráldez et al.,
2011) and cherries (Silva et al., 2012). Besides, OD has already been
studied as an alternative, which gives uses to lemon by-products
(Masmoudi et al., 2007). OD consists of placing foods in a low water
activity solution in order to induce water outflows and inflows of external
solutes, resulting in high quality products that can be stored longer.
However, the common use of sugars in the OD stage leads to an
enhancement in the cariogenic property of the final products as well as an
increase in their glycemic index, and can also be linked to different
diseases (diabetes, obesity, etc.). Fortunately, there are other new
sweeteners available in the market which are non-cariogenic and also
have other advantages over conventional sugars or sweeteners, such as
isomaltulose, oligofructose, stevia and tagatose (Goyal et al., 2010). Each
one is described below.
Isomaltulose is a reducing disaccharide which is naturally present in
honey, and sugar cane juice, and its taste is similar to sucrose. The
physicochemical properties of isomaltulose enable it to be used a
substitute for sucrose in most sweet foods (Lina et al., 2002; Peinado et
al., 2013). It has a sweetening power of approximately 42% compare to
sucrose and it can be used as an alternative to sucrose, because its caloric
power is similar (Periche et al., 2014).
Oligofructose is low in calories, meaning it has multiple health
benefits. It is obtained by partial enzymatic hydrolysis of chicory inulin
and it is a soluble dietary fiber with prebiotic character to enhance the
growth of beneficial gut bacteria and calcium absorption (Rao, 2001;
Raschka & Daniel, 2005).

III. Resultados
61
Stevia is a plant that has been consumed as a food and also used as a
medicine in some countries such as Japan and Paraguay (Lemus-
Mondaca et al., 2012). The sweetening power of this plant is 15 times
greater than sucrose, and it has multiple therapeutic properties
(antioxidant, antimicrobial, anti-fungal activity, anti-hyperglycemic, anti-
hypertensive, anti-inflammatory, antitumor, antidiarrheal and diuretic
effects), but it is calorie free (Chatsudthipong & Muanprasat, 2009).
Tagatose is a D-galactosa isomer in milk and milk products. In
comparison with other sugars, it has numerous health benefits including a
lower glycemic index, and low calorie content. It also reduces the
symptoms associated with type II diabetes and it is recommended for
patients with obesity or heart diseases (Oh, 2007; Lu et al., 2009; Shankar
et al., 2013). Tagatose exerts greater osmotic pressure, and hence has less
water activity than sucrose at equivalent concentrations (Patra et al.,
2009). D-Tagatose is well suited for confectionery products such as
chocolate and candies, fudges, caramels, ice cream, soft drinks, and
breakfast cereals because tagatose crystallizes easily (FAO/WHO, 2003).
In consideration of all the above, the aim of this work is to study the
effect of different combinations of healthy osmotic agents (tagatose,
oligofructose, isomaltulose and stevia) on the kinetic behaviour of lemon
slices in order to obtain mathematical models following second Fick’s
law. For this purpose, variation of total mass, soluble solids and water
mass changes have been analysed over time.
MATERIALS AND METHODS
Preparation of sample
Eureka Lemons of a similar colour, size and ripeness were selected
from an agricultural plot in Llíria (Valencia). The lemons were peeled
and cut into 0.5 cm thick slices using a household slicer (Fagor Delice
CF- 150).
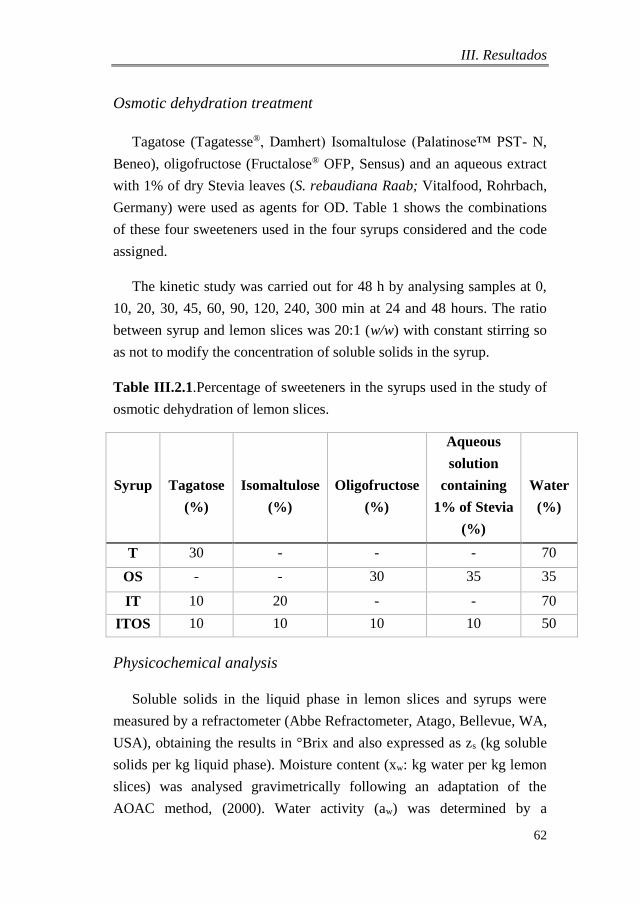
III. Resultados
62
Osmotic dehydration treatment
Tagatose (Tagatesse®, Damhert) Isomaltulose (Palatinose™ PST- N,
Beneo), oligofructose (Fructalose® OFP, Sensus) and an aqueous extract
with 1% of dry Stevia leaves (S. rebaudiana Raab; Vitalfood, Rohrbach,
Germany) were used as agents for OD. Table 1 shows the combinations
of these four sweeteners used in the four syrups considered and the code
assigned.
The kinetic study was carried out for 48 h by analysing samples at 0,
10, 20, 30, 45, 60, 90, 120, 240, 300 min at 24 and 48 hours. The ratio
between syrup and lemon slices was 20:1 (w/w) with constant stirring so
as not to modify the concentration of soluble solids in the syrup.
Table III.2.1.Percentage of sweeteners in the syrups used in the study of
osmotic dehydration of lemon slices.
Physicochemical analysis
Soluble solids in the liquid phase in lemon slices and syrups were
measured by a refractometer (Abbe Refractometer, Atago, Bellevue, WA,
USA), obtaining the results in °Brix and also expressed as zs (kg soluble
solids per kg liquid phase). Moisture content (xw: kg water per kg lemon
slices) was analysed gravimetrically following an adaptation of the
AOAC method, (2000). Water activity (aw) was determined by a
Syrup
Tagatose
(%)
Isomaltulose
(%)
Oligofructose
(%)
Aqueous
solution
containing
1% of Stevia
(%)
Water
(%)
T 30 - - - 70
OS - - 30 35 35
IT 10 20 - - 70
ITOS 10 10 10 10 50

III. Resultados
63
hygrometer (Decagon CX-1, Pullman, WA, USA). All determinations
were carried out in triplicate.
Kinetic study and modelling
Variation of total mass (M), mass of soluble solids (Ms), and mass
of water (Mw) were calculated for all times considered in this study.
Additionally, a Fick’s model was used to obtain the effective diffusivity
(De: m2·s-1) of soluble solids (Crank, 1975; Cháfer et al., 2001) depending
on the composition of the syrup used.
Statistical analysis
Statgraphics plus (version 5.1, Statpoint Technologies, Inc.,
Warrenton, VA, USA) software was used to perform the statistical
analyses, the factor taken into account being the composition of the syrup
used in the OD.
RESULTS AND DISCUSSION
Physicochemical analysis
The average values of composition and water activity for lemons used
in these experiments were the following: 83±4% of water, 15.7±0.4% of
soluble solids and 0.986±0.003 of water activity. The ºBrix of the osmotic
solutions used were 35.2±0.7 for syrup T, 29.5±0.7 for syrup OS,
36.3±0.7 for syrup IT and 32.9±0.7 for syrup ITOS. According to these
results, tagatose would lead to the highest driving force.
Fig. 1 represents the results of water activity (aw), °Brix and moisture
content (xw) of lemon slices vs. time of osmotic dehydration depending on
the syrup used. As was expected the longer the time of dehydration the
higher the concentration of soluble solids in lemon slices.

III. Resultados
64
Figure III.2.1. A) Water activity (aw) vs. time B) °Brix vs. time and C) xw
vs. time for the lemon slices dehydrated with different osmotic solutions.
Other studies with oranges and other fruits (strawberry, apple, apricot)
showed similar results (Cháfer et al., 2001; Castelló et al., 2006, 2009;
İspir & Toğrul, 2009). In the sweeteners studied, noteworthy was that the
samples osmodehydrated with oligofructose and stevia showed the
highest levels of water activity, while syrup composed only by tagatose
led to the lowest increase in soluble solids. However, no differences were
C

III. Resultados
65
found in terms of moisture content among the slices treated with the four
syrups studied.
Kinetic study and modelling
The results for variation of total mass (M), water mass (Mw) and
soluble solid mass (Ms) recorded in this study were obtained using the
following formulas (Shi & Fito, 1994) shown in Figure 2.
∆𝑀 =𝑀𝑡−𝑀0
𝑀0 (1)
∆𝑀𝑤 =𝑀𝑡𝑥𝑤
𝑡 −𝑀0𝑥𝑤0
𝑀0 (2)
∆𝑀𝑠 =𝑀𝑡𝑥𝑠
𝑡−𝑀0𝑥𝑠0
𝑀0 (3)
Where
𝑀𝑖: M mass of lemon slices (kg) at time i (i=0 or t)
𝑀𝑤𝑖 : mass of water of lemon slices (kg) at time i (i=0 or t)
𝑀𝑠𝑖
: mass of soluble solids of lemon slices (kg) at time i (i=0 or t)
𝑥𝑤𝑖
: mass fraction of water (kg of water/kg of lemon slices) at time i
(i=0 or t)
𝑥𝑠𝑖
: mass fraction of soluble solids (kg of soluble solids/kg of lemon
slices) at time i (i=0 or t)
As can be seen in Fig. 2 samples dehydrated with syrups containing
isomaltulose (IT and ITOS) showed the greatest losses of total mass,
especially when they were combined with oligofructose and stevia. On
the contrary, syrup composed by oligofructose and stevia (OS) kept the
mass of lemon slices constant while syrup containing only tagatose (T)
led to an increase in total mass in all samples for the whole process.
Therefore, tagatose would be more beneficial in the development of
osmodehydrated products, as contrary to what is common in this process,
it led to an increase in mass. Consistent with the values of moisture
content registered during the process, no differences were found with
regard to water and soluble solid mass changes.
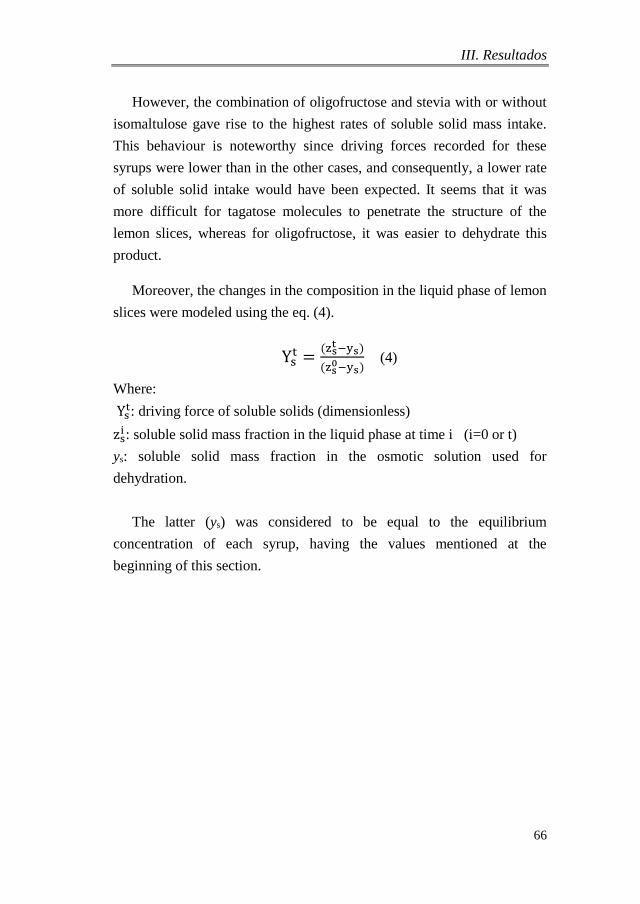
III. Resultados
66
However, the combination of oligofructose and stevia with or without
isomaltulose gave rise to the highest rates of soluble solid mass intake.
This behaviour is noteworthy since driving forces recorded for these
syrups were lower than in the other cases, and consequently, a lower rate
of soluble solid intake would have been expected. It seems that it was
more difficult for tagatose molecules to penetrate the structure of the
lemon slices, whereas for oligofructose, it was easier to dehydrate this
product.
Moreover, the changes in the composition in the liquid phase of lemon
slices were modeled using the eq. (4).
Yst =
(zst −ys)
(zs0−ys)
(4)
Where:
Yst: driving force of soluble solids (dimensionless)
zsi : soluble solid mass fraction in the liquid phase at time i (i=0 or t)
ys: soluble solid mass fraction in the osmotic solution used for
dehydration.
The latter (ys) was considered to be equal to the equilibrium
concentration of each syrup, having the values mentioned at the
beginning of this section.

III. Resultados
67
Figure III.2.2. A) Variation of total mass (ΔM), B) Variation of water
mass (ΔMw) and C) Variation of soluble solid mass (ΔMs) for the lemon
slices dehydrated with different osmotic solutions.

III. Resultados
68
Figure 3 shows the experimental points 1-Ys vs. t0.5 to adjust them to a
simplified Fickian approach for diffusion in a plane sheet, with only one
term of the Fick’s second law series solution for short times (Crank,
1975) (equation 5).
1 − Ys = ⌊4Det
πl2⌋
0.5
(5)
Where, t is time of processing (s) and l is half thickness of the
dehydrated sample (m).
Figure III.2.3. 1-Driving force of soluble solids (Ys) vs. t0.5 (square root
of time of dehydration) for the lemon slices dehydrated with different
osmotic solutions.
In this case, the range of time considered corresponded only to the
first 120 min of osmotic treatment. From the fitting of this model, it is
possible to obtain the kinetic parameter of effective diffusivity (De) which
allows us to predict the process time required to achieve a specific
concentration of soluble solids in osmodehydrated lemon slices (Table 2).
0.00
0.05
0.10
0.15
0.20
0.25
0.30
0.35
0.40
0 20 40 60 80 100
1-Y
s
t 0.5 (s 0.5)

III. Resultados
69
Table III.2.2. Values of effective diffusion coefficient (De) and
correlation coefficients (R2) of Fick's equation for an infinite sheet
(Crank, 1975) in lemon slices osmodehydrated with different syrups.
Equal letters indicate homogeneous groups.
The results of De showed that the best fitting was observed when OS
syrup was used in the dehydration of lemon slices. Furthermore, syrup
composed of oligofructose with stevia extract (OS) presented a higher
slope, which corresponded to the highest value of effective diffusivity,
whereas syrup made of tagatose showed the longest times of
osmodehydration since the effective diffusivity was the lowest. This is
consistent with the results relating to water and soluble solid mass
changes. Isomaltulose did not significantly affect the values of De for the
syrups composed of tagatose or oligofructose.
These results give evidence of the potentiality of the use of these new
sweeteners to produce healthier osmodehydrated lemon slices.
Furthermore, in our previous studies carried out in orange slices (Rubio-
Arraez et al., 2015); the combination of oligofructose with isomaltulose
implied a faster dehydration of samples. However, in that case, tagatose
was not used in the formulation of the different syrups used for the
osmodehydration of oranges. Thus, the present research opens more
possibilities to develop this kind of products.
Syrup De x 10-9 (m2·s-1) R²
T 2.27±0.15a 0.87±0.05
OS 10.2±0.3c 0.95±0.01
IT 4.7±1.9ab 0.91±0.03
ITOS 9±3bc 0.91±0.02

III. Resultados
70
CONCLUSIONS
According to this study, isomaltulose gave rise to the highest mass
loss values in the osmodehydrated lemon slices, in contrast with tagatose.
However, the level of concentration of soluble solids reached by tagatose
would be lower than in the case of the other sweeteners and would be
reached more slowly. Oligofructose combined with stevia would lead to a
quicker concentration of soluble solids, but also to the highest level of
water activity and therefore would potentially be the least stable. To solve
this problem it would be recommendable to combine oligofructose,
aqueous extract of stevia and tagatose.
ACKNOWLEDGEMENTS
The authors would like to thank the Serigó-Andrés family for donating
the raw materials, and also the GVA projects GV/2013/029,
GV/2014/012 as well as the Universitat Politècnica de València (Spain)
for the financial support given to this research study (UPV PAID-06-12
SP20120889).
REFERENCES
AOAC (2000). Official Methods of Analysis of AOAC International 17th
edition. Gaithersburg, MD, USA.
Azoubel, P.M. & Murr, F.E.X. (2004). Mass transfer kinetics of osmotic
dehydration of cherry tomato. Journal of Food Engineering, 61, 291–
295.
Castelló, M.L., Fito, P.J. & Chiralt, A. (2006). Effect of osmotic
dehydration and vacuum impregnation on respiration rate of cut
strawberries. LWT-Food Science and Technology, 39, 1171–1179.
Castelló, M.L., Igual, M., Fito, P.J. & Chiralt, A. (2009). Influence of
osmotic dehydration on texture, respiration and microbial stability of
apple slices (Var. Granny Smith). Journal of Food Engineering, 91,
1–9.

III. Resultados
71
Castelló M.L., Fito, P.J. & Chiralt A. (2010). Changes in respiration rate
and physical properties of strawberries due to osmotic dehydration
and storage. Journal of Food Engineering, 97, 64–71.
Castro-Giráldez, M., Tylewicz, U., Fito, P.J., Dalla Rosa, M. & Fito, P.
(2011). Analysis of chemical and structural changes in kiwifruit (A.
deliciosa cv Hayward) through the osmotic dehydration. Journal of
Food Engineering, 105, 599–608.
Cháfer, M., González-Martínez, C., Ortolá, M.D., Chiralt, A. & Fito, P.
(2001). Kinetics of osmotic dehydration in orange and mandarin peels.
Journal of Food Process Engineering, 24, 273–289.
Chatsudthipong, V. & Muanprasat, C. (2009). Stevioside and related
compounds: Therapeutic benefits beyond sweetness. Pharmacology &
Therapeutics 121, 41–54.
Crank, J. (1975). The mathematics of diffusion. Clarendon Press, Oxford,
U.K.
Derossi, A., De Pilli, T., Severini, C. & McCarthy, M.J. (2008). Mass
transfer during osmotic dehydration of apples. Journal of Food
Engineering, 86, 519–528.
Devalaraja, S., Jain, S & Yadav, H. (2011). Exotic fruits as therapeutic
complements for diabetes, obesity and metabolic syndrome. Food
Research International, 44, 1856–1865.
FAO/WHO (2003). Report of the sixty-first meeting of the Joint
FAO/WHO Expert Committee on Food Additives, Rome, 10-19 June
2003. WHO Technical Report Series.
Goyal, S. Samsher, K. & Goyal, R. K. (2010). Stevia (Stevia rebaudiana)
a bio-sweetener: A review. International Journal of Food Sciences and
Nutrition, 61, 1–10.
İspir, A. & Toğrul, İ. T. (2009). Osmotic dehydration of apricot: Kinetics
and the effect of process parameters. Chemical Engineering Research
and Design, 87, 166–180.
Kim, I., Yang, M., Lee, O. & Kang, S. (2011). The antioxidant activity
and the bioactive compound content of Stevia rebaudiana water
extracts. LWT - Food Science and Technology, 44, 1328–1332.

III. Resultados
72
Lina, B.A.R., Jonkera, D. & Kozianowski, G. (2002). Isomaltulose
(Palatinose1): a review of biological and toxicological studies. Food
and Chemical Toxicology, 40, 1375–1381.
Lemus-Mondaca, R., Vega-Gálvez, A., Zura-Bravo, L. & Ah-Hen, K.
(2012). Review. Stevia rebaudiana Bertoni, source of a high-potency
natural sweetener: A comprehensive review on the biochemical,
nutritional and functional aspects. Food Chemistry, 132, 1121–1132.
Lu, Y., Levin, G.V. & Donner, T.W. (2008). Tagatose, a new antidiabetic
and obesity control drug. Diabetes Obesity and Metabolism, 10,109–
34.
Masmoudi, M., Besbes, S., Blecker, C. & Attia H. (2007). Preparation
and characterization of osmodehydrated fruits from lemon and date
by-products. Food Science and Technology International, 13,
405–412.
Oh, D.K. (2007). Tagatose: properties, applications and biotechnological
processes. Applied Microbiology and Biotechnology, 76,1-8.
Park, K.J., Bin, A., Reis Brod, F.P. & Brandini Park, T. H. K. (2002).
Osmotic dehydration kinetics of pear D’anjou (P. communis L.)
Journal of Food Engineering, 52, 293–298.
Patra, F., Tomar S.K. & Arora S. (2009). Technological and functional
applications of low calorie sweeteners from lactic acid bacteria.
Journal of Food Science, 74, 16–23.
Peinado, I., Rosa, E., Heredia, A., Escriche, I. & Andrés, A. (2013).
Influence of processing on the volatile profile of strawberry spreads
made with somaltulosa. Food Chemistry, 138, 621–629.
Periche, A., Heredia, A., Escriche, I., Andrés, A. & Castelló, M.L.
(2014). Optical, mechanical and sensory properties of based-
isomaltulose gummy confections. Food Bioscience, 7, 37–44.
Rao, V.A. (2001). The prebiotic properties of oligofructose at low intake
levels. Nutrition Research, 21, 843–848.
Raschka, L. & Daniel, H. (2005). Mechanisms underlying the effects of
inulin-type fructans on calcium absorption in the large intestine of
rats. Bone, 37, 728–735.

III. Resultados
73
Rubio-Arraez, S., Capella, J.V., Ortolá, M.D. & Castelló, M.L. (2015).
Kinetics of osmotic dehydration of orange slices using healthy
sweeteners. International Food Research Journal, 22, 2162-2166.
Shankar, P., Ahuja, S. & Sriram, K. (2013). Non-nutritive sweeteners:
Review and update. Nutrition, 29, 1293–1299.
Shi, X.Q. & Fito, P. (1994). Mass transfer in vacuum osmotic
dehydration of fruits: A mathematical model approach. LWT - Food
Science and Technology, 27, 67–72.
Silva, M.A.C., Da Silva, Z.E., Mariani, V.C. & Darche, S. (2012). Mass
transfer during the osmotic dehydration of West Indian cherry. LWT -
Food Science and Technology, 45, 246–252.


III.3. INFLUENCE OF HEALTHY SWEETENERS
(TAGATOSE AND OLIGOFRUCTOSE) ON THE
PHYSICOCHEMICAL CHARACTERISTICS OF
ORANGE MARMALADE
Susana Rubio-Arraez1, Sergio Sahuquillo1,
Juan Vicente Capella2, María Dolores Ortolá1, and
María Luisa Castelló1.
1Institute of Food Engineering for Development and 2Institute ITACA (ICT Technologies),
Universitat Politècnica de València,
Camino de Vera, s/n. 46022, Valencia, Spain
Journal Texture Studies
46(4): 272-280 (2015)
II.2. MODELLING OSMOTIC DEHYDRATION
OF LEMON SLICES USING NEW SWEETENERS
Susana Rubio-Arraez1, Juan Vicente Capella2,
María Dolores Ortolá1, and María Luisa Castelló1.


III. Resultados
74
ABSTRACT
Today's society shows a growing interest in healthy, safe and high
nutritional quality food. Thus, in this paper sweet orange marmalades
have been developed using healthy sweeteners (tagatose and
oligofructose) in different proportions. Analyses of Brix, pH, moisture,
water activity, antioxidant capacity, optical and rheological properties
have been carried out, initially and after 45 days of storage.
Microbiological analyses have also been performed to determine their
stability. Furthermore, a sensorial assessment has been conducted to find
out acceptance of these new orange marmalades by consumers. The
results showed that the highest proportion of oligofructose contributed to
improve the initial antioxidant capacity of marmalades. The marmalade
with the same proportions of oligofructose and tagatose was more
consistent and showed a further increase in the elastic component over
time. All marmalades had a similar appearance, but oligofructose reduced
L*. Finally, orange marmalades made with healthy sweeteners were
better scored.
Keywords: marmalade, tagatose, oligofructose, rheology, color, sensory
analysis.
Practical Applications
The development of new healthier marmalades offer new alternatives
to the conventional ones not only to prevent caries and obesity but also to
provide functional features associated with the use of tagatose and
oligofructose as sweeteners. However, not always it is possible to replace
traditional components by others and that is why is so important to assess
their technological influence. In this study, the viability of the use of both
sweeteners to prepare orange marmalades has been checked.

III. Resultados
75
INTRODUCTION
Nowadays, owing to the current lifestyle of society, there is an
increasing demand for healthy food products such as fruit and vegetables.
However, these products are highly perishable with the consequent
problems of distribution and shelf life. As an alternative, processing
makes it possible to extend their marketability, whilst maintaining some
of the characteristics of the fresh products to a certain extent. In this
regard, marmalades are a typical example of more stable fruit-derived
products.
Among the diverse variety of fruits and the requirements for
manufacturing marmalades, oranges may be a good choice in the
Mediterranean area as they are readily available at an affordable price,
and also because of their high nutritional content. In the case of
marmalades, as in many other cases, sugars/sweeteners are crucial for
these kinds of products to achieve the right texture. In addition, they are
responsible for the high concentration of Brix, the reduction of aw and
consequently the control of the microbial growth in the product.
Traditionally, sucrose has been used as the main sugar to manufacture
marmalades. However, because of the negative connotations associated
with sugar consumption (cariogenesis, high caloric intake, increase in the
glycemic index, etc…) it has been replaced by bulk sweeteners (polyols)
or high-potency sweeteners (saccharine, aspartame…) depending on the
properties required in the product (Edwards 2002; O’Donnell and
Kearsley 2012). Nevertheless, these sweeteners also present some
drawbacks. Concretely, most of the polyalcohols have a laxative effect.
In the case of high-potency sweeteners, there is a lot of controversy
since their relation with the development of different cancers and other
diseases is being questioned (Weihrauch and Diehl 2004; Soffritti et al.
2006; Renwick and Nordmann 2007).
The World Health Organization (2014) considers reducing the
excessive consumption of sugars and other carbohydrates of fast
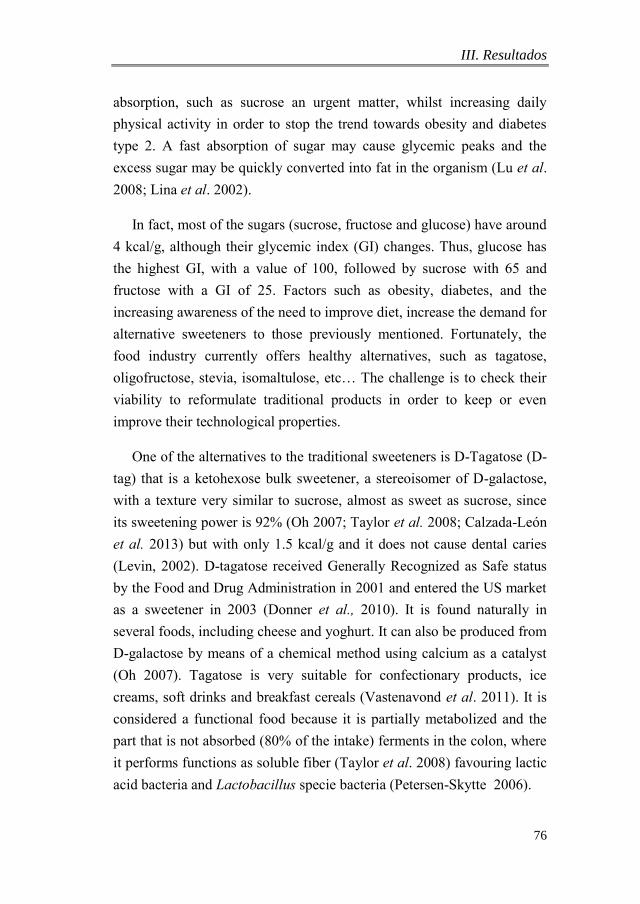
III. Resultados
76
absorption, such as sucrose an urgent matter, whilst increasing daily
physical activity in order to stop the trend towards obesity and diabetes
type 2. A fast absorption of sugar may cause glycemic peaks and the
excess sugar may be quickly converted into fat in the organism (Lu et al.
2008; Lina et al. 2002).
In fact, most of the sugars (sucrose, fructose and glucose) have around
4 kcal/g, although their glycemic index (GI) changes. Thus, glucose has
the highest GI, with a value of 100, followed by sucrose with 65 and
fructose with a GI of 25. Factors such as obesity, diabetes, and the
increasing awareness of the need to improve diet, increase the demand for
alternative sweeteners to those previously mentioned. Fortunately, the
food industry currently offers healthy alternatives, such as tagatose,
oligofructose, stevia, isomaltulose, etc… The challenge is to check their
viability to reformulate traditional products in order to keep or even
improve their technological properties.
One of the alternatives to the traditional sweeteners is D-Tagatose (D-
tag) that is a ketohexose bulk sweetener, a stereoisomer of D-galactose,
with a texture very similar to sucrose, almost as sweet as sucrose, since
its sweetening power is 92% (Oh 2007; Taylor et al. 2008; Calzada-León
et al. 2013) but with only 1.5 kcal/g and it does not cause dental caries
(Levin, 2002). D-tagatose received Generally Recognized as Safe status
by the Food and Drug Administration in 2001 and entered the US market
as a sweetener in 2003 (Donner et al., 2010). It is found naturally in
several foods, including cheese and yoghurt. It can also be produced from
D-galactose by means of a chemical method using calcium as a catalyst
(Oh 2007). Tagatose is very suitable for confectionary products, ice
creams, soft drinks and breakfast cereals (Vastenavond et al. 2011). It is
considered a functional food because it is partially metabolized and the
part that is not absorbed (80% of the intake) ferments in the colon, where
it performs functions as soluble fiber (Taylor et al. 2008) favouring lactic
acid bacteria and Lactobacillus specie bacteria (Petersen-Skytte 2006).

III. Resultados
77
On the other hand, oligofructose is an oligosaccharide derived from
fructose, which acts as dietary fibre regulating intestinal transit. It
improves calcium absorption (van den Heuvel et al. 1996) and reduces
cholesterol and blood sugar levels (Chacón-Villalobos 2006). Moreover,
it presents a prebiotic effect because it favours the selective growth of
lactic bacteria and bifidobacteria (Ledur et al. 2013). Oligofructose has
approximately between 30% and 60% of the sweetness of sucrose and it
is easily hydrolysed by the action of acids or enzymes (Coussement
1999). It is highly soluble and possesses technological properties that are
closely related to those of sucrose and glucose syrups (sweet taste,
stability…) because it has free sugars (Pimentel et al., 2014). It is often
used in combination with high intensity sweeteners. The replacement of
carbohydrates by oligofructose offers the advantage of not compromising
on taste and texture, while delivering nutritionally enhanced products
(Franck 2002).
The aim of this paper focuses on characterising sweet orange
marmalades formulated with different combinations of tagatose and
oligofructose analysing their moisture content, Brix, pH and antioxidant
capacity initially and after 45 days of storage. Besides, their rheological
and optical properties have been also registered. Finally, a sensorial
analysis has been carried out to assess their acceptability by potential
consumers.
MATERIALS AND METHODS
Formulations and Manufacturing Processes of Orange
Marmalades
Marmalades were produced using 60% orange pulp (Citrus sinensis
navelate), 40% sucrose (Azucarera Española, Burgos, Spain) or healthy
sweeteners (tagatose or oligofructose) and 1% agar-agar (Roko Agar,
Llanera, Asturias, Spain) on the percentage of sucrose or sweeteners.
Tagatose was obtained from Damhert Nutrition (Tagatesse, Heusden-

III. Resultados
78
Zolder, Belgium) and according to the information of the label it was
composed by 39.9% of tagatose, 39.9% of isomalt, 0.02% of sucralose
and 20% of dietary fiber (inulin and oligosaccharides). Oligofructose was
obtained from Sensus (Frutalose OFP, Roosendaal, Netherlands).
The following notation was used depending on the combination of
sweeteners used: Control marmalade: 100% sucrose, Marmalade A: 50%
oligofructose and 50% tagatose, Marmalade B: 30% oligofructose and
70% tagatose, and Marmalade C: 70% oligofructose and 30% tagatose.
Oranges collected directly from crop were peeled and mixed with
sucrose or the corresponding combination of healthy sweeteners and the
agar-agar in a thermal blender (Thermomix, TM31, Vorwerk, Wuppertal,
Germany). After that, the mixture was cooked at 100 C for 20 min at 350
rpm. Then, glass jars previously sterilized in an autoclave at 121 C for 15
min, were filled with the marmalade. These jars were turned over to
ensure proper sealing for 1 h. Finally, the marmalade was allowed to cool
for 24 h and in that time jellification took place. Three batches of oranges
were used to prepare the marmalades. Triplicated analyses were
performed for each batch on the first day of storage and after 45 days of
storage.
Analytical Determinations
Moisture Content, Brix, pH and Water Activity
Moisture content (xw), was determined gravimetrically by drying
approximately 1 g of marmalade to a constant weight in a vacuum oven at
60 C (method 934.06 AOAC 2000). Water activity (aw) was determined
with a dew point water activity meter Decagon Devices, Inc. (Aqua Lab
4TE, Pullman, WA, USA). Soluble solid content (Brix) was measured
with a refractometer at 20 C (Atago 3T, Tokyo, Japan) and pH was
registered with a pH-meter (Seven Easy, Mettler Toledo, Barcelona,
Spain).

III. Resultados
79
Antioxidant Capacity
The antioxidant activity of marmalades was analyzed on the basis of
the scavenging activities of the stable 2,2-diphenyl-1-picrylhydrazyl free
radical (Brand-Williams et al. 1995; Shahidi et al. 2006). One gram of
marmalade was mixed with 6 mL of pure methanol for 5 min in a vortex,
keeping the supernatant. This mixture was centrifuged at 13.000 rpm for
10 min.
The absorbance of 3.9 mL of the DPPH solution (0.025 mg/mL,
prepared in methanol: water (80:20)) was read at 515 nm in a
spectrocolorimeter Thermo Fisher Scientific, Inc. (Helios Zeta UV-VIS,
Waltham, MA, USA). Then, 0.1 mL of the supernatant was mixed with
the methanolic solution of DPPH and absorbance was read again after 30
min. Quantification was performed considering a standard curve of
Trolox (6-Hydroxy-2,5,7,8-tetramethylchroman-2-carboxylic acid) and
the results were expressed as mg of Trolox equivalent per 100 g of
marmalade.
Optical Properties
The colour of orange marmalades placed in 20 mm-wide cuvettes was
measured using a spectrocolorimeter Konica Minolta, Inc. (CM-3600d,
Tokyo, Japan). CIE-L*a*b* coordinates were obtained using D65
illuminant and 10º observer as reference system.
Rheological Analysis
Rheological properties of studied orange marmalades were obtained
using a controlled stress rheometer Thermo Fisher Scientific, Inc. (Haake
RheoStress 1, Waltham, MA, USA), at 25 C. Measurements were carried
out with plate–plate geometry and a 2.0 mm gap for steady state and
oscillatory tests (Sato and Cunha 2009), by means of steady state essays
or oscillatory essays to study the pseudoplastic or viscoelastic behavior of
marmalades respectively. Firstly, steady state measurements were

III. Resultados
80
performed with a shear rate linearly ranging from 0 to 100 s-1, in 3
sweeps (up, down and up-cycles), in order to eliminate thixotropy. The
data obtained in the third sweep were fitted to the Herschel–Bulkley
model (eq.1) (Peinado et al. 2012).
This model can describe Newtonian and a large group of time
independent non-Newtonian fluids. There are three parameters: is the
shear stress (Pa), 0 is the yield stress above which the fluid starts flowing
(Pa), γ is the shear rate (s-1), k is the index of consistency (Pa·sn) and n is
the index of fluidity (Skelland 1967).
𝜏 = 𝜏0 + 𝜅 ∙ 𝛾𝑛 (1)
In second place, an oscillatory assay was carried out following the
power-law that described the mechanical spectrum within the linear
viscoelastic region in terms of storage (G’) and loss (G”) modulus as a
function of frequency (eqs. 2 and 3) (Subramanian et al. 2006; Basua et
al. 2011):
𝐺′ = 𝑎 ∙ 𝑏 (2)
𝐺" = 𝑐 ∙ 𝑑 (3)
Where, ω x is the angular speed (rad·s-1), a is the low frequency
storage modulus (Pab); b is the power-law index for the storage modulus
(dimensionless); c is the low frequency loss modulus (Pad); and, d is the
power-law index for the loss modulus (dimensionless).
The value of the shear stress to fulfill the linearity of G’ and G” was
obtained in a preliminary trial. In order to do so, an interval of shear
= 0.1-10 Pa was studied and three fixed frequencies were marked in the
range of 0.1-10 Hz. Once these three curves were represented, the lineal
zone of viscosity was obtained. Having chosen the value of in the linear
zone for all the frequencies, the oscillatory assay was performed between
0.1-10 Hz (Peinado et al. 2012).

III. Resultados
81
Microbiological Analysis
Serial dilutions were prepared by homogenising 10 g of marmalade
with 90 mL of 1% sterile peptone water in a stomacher bag, using sterile
techniques. Mesophilic aerobic populations were analysed in Plate Count
Agar (Scharlau Chemie, 1-329, Barcelona, Spain) incubating samples for
72 h at 31 C. Yeast and moulds were determined in Sabouraud
Chloramphenicol Agar (Scharlau Chemie, 1-166, Barcelona, Spain)
plates for 5 days at 31 C. Samples were analysed at 45 days of storage.
Sensorial Analysis
An acceptance test using a 9-point hedonic scale (ISO 4121:2003) was
used to evaluate the following attributes: color, aroma, texture,
consistency, spreadable capacity, palatability, flavor, sweetness,
bitterness, and global preference (ISO 5492:2008) in the three
formulations with different combinations of healthy sugars (A, B and C)
along with the control marmalade. The possible appearance of sineresis
was also assessed. Moreover, the intention of buying was considered. The
panel consisted of 30 trained panelists, in the age range of 20-50 years
old, who are regular consumers of this kind of marmalades. Samples
were presented in jars of 25 mL presented one after another. Three testing
sessions were conducted in a sensory evaluation laboratory built
according to the international standards for test rooms (ISO 8589: 2007).
Statistical Analysis
Statgraphics plus (version 5.1, Statpoint Technologies, Inc.
Warrenton, Virginia, USA,) software was used to perform the statistical
analyses. Analyses of variance (multifactor ANOVA) were carried out to
discern whether the effect of the formulation or the time of storage on the
studied marmalades was significant. The interactions between factors
were considered.

III. Resultados
82
RESULTS AND DISCUSSION
Compositional Characterization of Marmalades
Table 1 shows the results of moisture content (xw), Brix, water activity
(aw), pH and antioxidant capacity. In all cases, the sugar concentration
reached in marmalades was 50 Brix and it remained during the storage
period considered. Moreover, marmalades B and C showed higher water
content than the control and marmalade A. With time, the moisture
content of samples B and C reduced, while in marmalade A it increased
though in all cases there were slight differences. Regarding water
activity, storage time was the factor which implied the most significant
influence, showing a small decrease in water activity at 45 days of
storage, except for sample A. Focusing on the pH, all marmalades
showed values below 3.8, which would ensure proper microbiological
stability. For all analyzed products, pH ranged between 3 and 4, in the
same magnitude of order as the pH of other jams made using strawberry,
peach, plum and apricot (Carbonell et al. 1991; García-Martínez et al.
2002).
Furthermore, in the control marmalade and sample A, pH decreased
after storage as was also observed by Rababah et al. (2011) in strawberry
jams with sucrose. In terms of antioxidant capacity, initially formulation
C showed the highest value probably due to the greater amount of
oligofructose in its composition, in contrast with the results of Ścibisz
and Mitek (2009) who observed that high bush blueberry jams had the
lowest levels of anthocyanins and total phenolics when oligofructose was
included in their formulation. In our research, both formulation A and B
reported lower antioxidant content than the control, showing that tagatose
reacts less than table sugar with free radicals. These results differ from
those reported by Zeng et al. (2012) who observed that via the Maillard
reaction, rare sugars (especially D-tagatose) induced a more remarkable
improvement than D-fructose in the radical scavenging activity and
oxidation–reduction potential of the hydrolysates of tune backbone.

III. Resultados
83
TABLE III.3.1. Values for moisture content (xw), Brix, water activity (aw), pH and antioxidant capacity of orange marmalades
initially and after 45 days of storage.
FORMULATION TIME
(days)
xw
(g water/g marmalade) ºBRIX aw pH
ANTIOXIDANT
CAPACITY
(mg Trolox/100 g
marmalade)
CONTROL 1 0.443±0.003ab 50.37±0.15a 0.9232±0.0008b 3.707±0.006e 47±4c
45 0.437±0.006a 50.6±0.2a 0.916±0.003a 3.49±0.010a 81±2g
A 1 0.437±0.006a 50.1±0.2a 0.9227±0.0006b 3.770±0.002g 33.3±0.8a
45 0.462±0.004c 50.2±0.4a 0.918±0.004b 3.680±0.010d 59.5±0.8d
B 1 0.509±0.004e 49.20±0.10b 0.9204±0.0008b 3.613±0.015b 39±2b
45 0.4689±0.0019c 51.0±1.10a 0.913±0.003a 3.727±0.006f 65±2e
C 1 0.484±0.0011d 50.47±0.06a 0.918±0.004b 3.663±0.006c 58±3d
45 0.449±0.004b 50.4±0.4a 0.911±0.006a 3.727±0.006f 76±3f
Equal letters indicate homogeneous groups

III. Resultados
84
Moreover, in our study, the antioxidant capacity of marmalades
increased over time, showing possible combinations of components
which would imply the appearance of new antioxidants. However,
Rababah et al. (2011) observed that antioxidant activity of orange
marmalades prepared with sucrose decreased significantly after 3 and 4
months, and 5 months, respectively.
Rheological Properties
The rheological properties of the studied marmalades were determined
by two tests: steady and oscillatory obtaining the parameters of the
models considered in each case. The results obtained in the stationary test
are presented in Figure 1. Rheograms indicate that initially there were no
differences between samples, except for formulation B which scored
slightly higher than the rest. After the storage period, the shear stress
exceeded was reduced in all cases although to a lesser extent in
marmalade A. Furthermore, in Table 2 the parameters of the Herschel-
Bulkley model are shown. As expected, all marmalades showed a shear
thinning behavior (n <1). However, the yield stress (0) was similar in
marmalade control and formulation A initially and after 45 days of
storage whereas in formulations B and C the values of this parameter
were significantly lower especially after storage in B. Besides,
marmalade A showed the highest level of consistency after storage,
giving evidences that the combination of oligofructose and tagatose in
same proportions would improve consistency of marmalades during the
storage. With respect to the index of fluidity (n), no significant
differences were found considering the formulation studied but the time
implied a reduction of this index in all cases. In studies carried out by
other authors (Peinado et al. 2012; Rosa et al. 2009) where sugars were
also replaced by other sweeteners (in this case isomaltulose) a decrease in
consistency and cohesiveness of strawberry jams was observed respect to
the sucrose-jams. In our study, only an increase of consistency was
observed in the combination of 50% oligofructose and tagatose, but not
for the other blends.
III. Resultados
85
Figure III.3.1. Mean flow curves (rheograms) obtained from the steady assay of orange marmalades at the beginning and at the
end of storage. Samples were coded respect to the amount of sugars as: Control (100% sucrose); A (50% oligofructose and 50%
tagatose); B (30% oligofructose and 70% tagatose), and C (70% oligofructose and 30% tagatose).
0
20
40
60
80
100
120
140
160
0 50 100
τ (
Pa
)
γ (s-1)
Day 1
0
20
40
60
80
100
120
140
160
0 50 100
τ (
Pa
)
γ (s-1)
Day 45
0
20
40
60
80
100
120
140
160
0 50 100
(P
a)
γ (s-1)
Day 1
0
20
40
60
80
100
120
140
160
0 50 100
(P
a)
γ (s-1)
Day 45
Control A B C

III. Resultados
86
Table III.3.2. Rheological parameters of the Herschel-Bulkley model and parameters of the power-law model for marmalades
initially and at the end of storage.
Equal letters indicate homogeneous groups
STEADY TEST-
HERSCHEL-BULKLEY MODEL
OSCILLATORY TEST-
POWER LAW
G’ G”
FORMULATION TIME
(days) (Pa) k n a b c d
CONTROL 1 18.8±0.9c 9.8±1.2a 0.48±0.02c 390±95a 0.16±0.01a 76±31a 0.28±0.04ab
45 18.5±0.6c 11.6±0.7b 0.46±0.01bc 386±20a 0.156±0.003a 85±2a 0.207±0.016a
A 1 18.67±0.18c 14±3bc 0.43±0.03abc 388±25a 0.152±0.010a 92±22a 0.17±0.06a
45 18.21±1.06c 18.6±0.5d 0.41±0.01a 680±37c 0.150±0.003a 146±1b 0.183±0.006a
B 1 15.7±.0.9b 13.5±1,8bc 0.46±0.02bc 411±7ab 0.17±0.01a 90±7a 0.27±0.03ab
45 11±3a 13.9±1.3bc 0.42±0.01a 347±8a 0.178±0.003a 69±18a 0.35±0.10b
C 1 15±2 b 11.6±1.6b 0.46±0.02bc 468±57b 0.167±0.017a 105±17a 0.24±0.02a
45 14.48±0.09 b 13.5±1.4bc 0.44±0.01b 374±36a 0.20±0.07a 92±25a 0.26±0.09ab

III. Resultados
87
Figure 2 shows the rheological results of the oscillatory assay where
the frequency dependence on storage (G’) and loss (G”) moduli of the
orange marmalades formulated with healthy sweeteners are represented.
This type of test determines the ratio between the elastic and viscous
component of a material and it is useful to quantify to what extent it
behaves as a solid or liquid.
Since in all cases G’ was greater than G”, marmalades showed a semi-
solid behavior. This is a typical gel characteristic being more elastic than
viscous (Peinado et al. 2012).
Concerning the formulations studied, at the beginning of storage there
were no differences between the control marmalade and the marmalade
with the same amount of tagatose and oligofructose (formulation A), for
both moduli (G’ and G”). Moreover, marmalades B and C were similar in
terms of viscous level, whereas the most elastic character was for
marmalade with more oligofructose (C). At the end of storage, the
increase in the elastic component of formulation A was noteworthy,
unlike what was observed in the other marmalades, giving evidence of
the interaction between the analyzed factors as a function of the
sweeteners used. Besides in this assay, marmalade B had more similar
elastic characteristics to the control marmalade.
In order to quantify in depth the differences between the oscillatory
test of the analyzed samples, the values of both the storage (G’) and the
loss (G”) moduli were fitted with respect to the angular speed (ω) with
the power-law model as described in materials and methods. The
parameters of this model are shown in Table 2. As can be observed,
initially there were no significant differences between samples in a and b
parameters of the power-law model for the storage modulus.
III. Resultados
88
Figure III.3.2. Average frequency curves obtained in the oscillatory test of orange marmalades at the beginning and end of
storage. Samples were coded respect to the amount of sugars as: Control (100% sucrose); A (50% oligofructose and 50%
tagatose); B (30% oligofructose and 70% tagatose), and C (70% oligofructose and 30% tagatose). Empty symbols refer to values
of storage modulus (G’) and filled symbols refer to values of loss modulus (G”).
0
200
400
600
800
1000
1200
1400
1600
0 2 4 6 8 10
G
or
G
(Pa)
f (Hz)
Day 45
0
200
400
600
800
1000
1200
1400
0 2 4 6 8 10
G
or
G
(Pa
)
f (Hz)
Day 1
Control G´ Control G´´ A G´ A G´´
B G´ B G´´ C G´ C G´´
0
20
40
60
80
100
120
140
160
0 50 100
(P
a)
γ (s-1)
Day 1
0
20
40
60
80
100
120
140
160
0 50 100
(P
a)
γ (s-1)
Day 45
Control A B C

III. Resultados
89
However, in marmalade A a increased significantly after 45 days of
storage, while the time factor did not affect the other formulations. This
behavior would be consistent with that observed in Fig. 2, reflecting a
more elastic nature of marmalade A at the end of storage. Regarding the
terms related to the loss modulus (c and d) it should also be mentioned
that marmalade A had a significantly greater value of c in coherence with
the position of its curve G” versus frequency () above the rest of the
samples (Fig. 2). Nevertheless, these differences were much lower than in
the case of the parameters related to the storage modulus. In addition,
parameter d fluctuated more between the cases studied. In fact lower
values were only observed in the formulation A with regard to the initial
control and at the end of storage and higher values in marmalade B after
45 days.
In contrast to the few differences found in this study, Peinado et al.
(2012) observed that by replacing sucrose for isomaltulose in the
formulation of different strawberry spreadable products resulted in a
decrease in parameters a and c of the power-law model. This decrease
was associated with how sugar type influences the availability of water in
the mixture of pectin-sugar-acid and therefore in the formation of
hydrogen bonds and the possible association of water in the pectin
polymer chain. In this study, the gelling agent used was agar-agar instead
of pectin and it could have homogenized the rheological properties of the
marmalade regardless of the type of sugar used, except in the case of
marmalade A.
Optical Properties
Colorimetric coordinates b* and a* of the different studied sweet
orange marmalades initially and at the end of storage placed in the
chromatic plane are shown in Figure 3A. The new marmalades,
especially for A and B formulations, increased b* and a* coordinates in
comparison with the values of the control marmalade. Consequently the
chrome (C*=(a*2+b*2)1/2) followed the same trend, while the hue

III. Resultados
90
(h*=arctg(b*/a*)) remained very similar to the control giving place to a
similar appearance in all cases. Furthermore, values of initial and final
luminosity (L*) of the studied marmalades are also presented in Figure
3B. According to these results, initially, L* of samples A and especially B
was much higher than in the control marmalade unlike what happened to
marmalade C. Therefore, high concentrations of oligofructose
significantly reduced L* of marmalades. Considering the time factor in
L*, the most stable formulations were A and C, while L* in the control
and B changed oppositely, increasing in the case of control and
decreasing for B.
Figure III.3.3. A) Chromatic plane representation (b*-a*) of the studied
marmalades initially and after 45 days of storage. Straight line represents
the hue of control orange marmalade for day 1 from (0,0). B) Luminosity
(L*) of the different formulations of marmalade initially and after 45 days
of storage. Samples were coded respect to the amount of sugars as:
Control (100% sucrose); A (50% oligofructose and 50% tagatose); B
(30% oligofructose and 70% tagatose), and C (70% oligofructose and
30% tagatose). Equal letters indicate homogeneous groups.
38
40
42
44
4 6 8 10
b*
a*
Day 1 Day 45
A y B
C
Control
c
cd
e
ab
ef
cd
b
a
40
40.5
41
41.5
42
42.5
Control A B C
L*
Day 1 Day 45
A B

III. Resultados
91
In other studies, Peinado et al. (2015) showed that strawberry jams
formulated with the healthier sugar isomaltulose and different
concentrations of citric acid and pectin, darkened with time. Besides that,
the colorimetric coordinates of the products containing the sucrose-
isomaltulose blend seemed to be influenced by the percentages of pectin
and citric acid while the colour of the samples containing the fructose-
isomaltulose blend, did not seem to be affected by the different variables.
Therefore the influence of the different ingredients on the food system
does not only depend on their concentration or distribution within the
different system phases but also on the different component interactions
during the studied period (Dervisi et al. 2001; Renard et al. 2006;
Peinado et al. 2015).
Microbiological Analysis
There were no colonies of molds and yeast or aerobic mesophillic
found in any of the marmalades in this study during the storage period
considered.
Sensory Analysis
Figure 4 shows a radial chart of the average scores for each attribute
evaluated (color, aroma, texture, consistency, spreadable capacity,
palatability, flavor, sweetness and bitterness) besides the global
preference and intention of buying of the studied marmalades. As can be
seen, A and B formulations showed the highest scores in all attributes,
although no significant differences were found in color, aroma, texture
and consistency among the samples. Furthermore, A and B, which had
higher proportions of tagatose, showed the highest sweetness.

III. Resultados
92
This would be consistent with the recommendations given by the
manufacturer of the commercial tagatose (two tablespoons of sucrose
provides the same sweetness as one tablespoon of tagatose), although as
was mentioned in the introduction, tagatose should have similar
sweetening power to sucrose (Oh 2007; Taylor et al. 2008; Calzada-León
et al. 2013).
Figure III.3.4. Results of the sensory analysis in the evaluation of the
samples coded respect to the amount of sugars as: Control (100%
sucrose); A (50% oligofructose and 50% tagatose); B (30% oligofructose
and 70% tagatose), and C (70% oligofructose and 30% tagatose).
* p-value <0.05, ** p-value <0.01.
However, the commercial tagatose used in this study was composed
also by oligosaccharides, isomalt and sucralose. The higher sweetening
power of this combination could be due to the synergic influence between
these sweeteners. In fact, according to the Patent EP0946112 B1 (Dörr
and Jager 2002), oligosaccharides increase the sweetness and improve the
taste of an acesulfame-k/aspartame mixture.
Color
Aroma
Texture
Consistency
Spreadable capacity
Palatability*Flavor*
Sweetness**
Bitterness**
Global preference
Intention of buying
Control A B C

III. Resultados
93
Moreover, although the level of bitterness in the marmalades
evaluated in this study was expected to be very low, analyzing the
possible interference of the combination of sweeteners used in this
property was deemed relevant.
Thus, the control and formulation C had the highest bitterness,
showing the great ability of tagatose to hide this taste. Furthermore, no
marmalade developed syneresis.
In relation to the rheological properties, the results obtained in the
sensorial analysis were in accordance with those registered
instrumentally. Finally, attention should be brought to the fact that both
the global preference and buying intention of all marmalades formulated
with healthy sweeteners were higher than those containing only sucrose.
CONCLUSIONS
The reformulation of orange marmalade with healthy sweeteners such
as tagatose and oligofructose is feasible. Only oligofructose improved the
antioxidant capacity compared to marmalade prepared with sucrose and
also reduced its luminosity. In general, all marmalades had the same
appearance.
In terms of rheology, formulation with the same proportion of tagatose
and oligofructose improved consistency and elastic component of
marmalades over time. Moreover, all of them reported microbiological
stability in storage during the storage period considered. Finally, global
acceptance and intention of buying of marmalades with healthy
sweeteners were higher than for marmalade containing only sucrose.
ACKNOWLEDGEMENT
The authors would like to thank the Serigó family for donating the raw
material and the project GV/2013/029 by the GVA, Valencia, Spain.

III. Resultados
94
REFERENCES
AOAC. 2000. Official Methods of Analysis of AOAC International, 17th
Ed. (W. Horwitz, ed.). Gaithersburg, MD, USA.
BASU, S., SHIVHARE, U.S., SINGH, T.V. and BENIWAL, V.S. 2011.
Rheological, textural and spectral characteristics of sorbitol
substituted mango jam. J. Food Eng. 105 (3), 503–512.
BRAND-WILLIAMS, W., CUVELIER, M. E. and BERSET, C. 1995.
Use of a free-radical method to evaluate antioxidant activity. LWT –
Food Sci. Technol. 28 (1), 25–30.
CALZADA-LEÓN, R., RUIZ-REYES, M.L., ALTAMIRANO-
BUSTAMANTE, N. and MARTÍNEZ, M.M. 2013. Features of the
noncaloric sweeteners and their use in children. Acta Pediátrica de
México 34(3), 141–153.
CARBONELL, E., COSTELL, E. and DURAN, L. 1991. Caracterización
del flujo de mermeladas comerciales españolas. Rev. Agroq. Tec. Al.
31(2), 227–235.
CHACÓN-VILLALOBOS, A. 2006 Current Perspectives agribusiness
oligofructosaccharides (FOS). Agronomía Mesoamericana 17(2),
265-286.
COUSSEMENT, P.A. 1999. Inulin and oligofructose: safe intakes and
legal status. J. Nutr. 129(7), 1412–1417.
DERVISI, P., LAMB, J. and ZABETAKIS, I. 2001.High pressure
processing in jam manufacture: effects on textural and colour
properties. Food Chem. 73(1), 85–91.
DONNER, T.W., MAGDER, L.S. and ZARBALIAN, K. 2010. Dietary
supplementation with D-tagatose in subjects with type 2 diabetes leads
to weight loss and raises high-density lipoprotein cholesterol.
Nutrition Res. 30, 801–806.
DÖRR, M. and JAGER, M. 2002. The use of oligosaccharides to
increase the sweetness and improve the taste of an acesulfame-
k/aspartame mixture. Patent EP0946112 B1. Nutrinova Nutrition
Specialties and Food Ingredients, GmbH.

III. Resultados
95
EDWARDS, W.P. 2002. The science of goodies. Acribia. S.A., Zaragoza.
Spain.
FRANCK, A. 2002. Technological functionality of inulin and
oligofructose. British J. Nutr. 87(2), 287–291.
GARCÍA-MARTÍNEZ, E., RUIZ-DIAZ, G., MARTÍNEZ-MONZÓ, J.,
CAMACHO, M.M., MARTÍNEZ-NAVARRETE, N. and CHIRALT,
A. 2002. Jam manufacture with osmodehydrated fruit. Food Res.
Int. 35, 301–306.
ISO 4121. 2003. Sensory analysis. Guidelines for the use of quantitative
response scales. International Organization for Standardization.
Geneva, Switzerland.
ISO 8589. 2007. Sensory analysis. General guidance for the design of test
rooms. International Organization for Standardization. Geneva,
Switzerland.
ISO 5492. 2008. Sensory analysis. Vocabulary. International
Organization for Standardization. Geneva, Switzerland.
LEDUR, M.J., TESSARO, I. and ZAPATA, C.P. 2013. Physicochemical
characterization of Saccharides Powder Obtained from Yacon Roots
(Smallanthus sonchifolius) by Membrane Technology. Brazilian Arch.
Biol. Technol. 56(6), 1024–1033.
LEVIN, G.V. 2002. Tagatose, the new GRAS sweetener and health
product. J. Med. Food 5(1), 23–36.
LINA, B.A.R., JONKER, G. and KOZIANOWSKI, G. 2002.
Isomaltulose (Palatinose review of biological and toxicologycal
studies). Food Chem. Toxic. 40 (10), 1375–1381.
LU, Y., LEVIN, G.V. and DONNER, T.W. 2008. Tagatose, a new
antidiabetic and obesity control drug. Diabetes, Obesity and
Metabolism, 10(2), 109–134.
O’DONNELL, K. and KEARSLEY, M.W. 2012. Sweeteners and Sugar
Alternatives in Food Technology. Wiley-Blackwell, New Jersey, USA.
OH, D.K. 2007. Tagatose: properties, applications, and biotechnological
processes. Applied Microb. Biotech., 76(1),1– 8.

III. Resultados
96
PEINADO, I., ROSA, E., HEREDIA, A. and ANDRÉS, A. 2012.
Rheological characteristics of healthy sugar substituted spreadable
strawberry product. J. Food Eng. 113(3), 365–373.
PEINADO, I., ROSA, E., HEREDIA, A. and ANDRÉS, A. 2015. Use
of isomaltulose to formulate healthy spreadable strawberry products.
Application of response surface methodology. Food Bioscience. 9,
47–9.
PETERSEN-SKYTTE, U. 2006. Tagatose. In: Sweeteners and sugar
alternatives in food technology (Mitchell, H., ed.) pp. 262–292,
Blackwell Publishing , Oxford, UK.
PIMENTEL, T.C., MADRONA, G.S. and PRUDENCIO, S.H. 2015.
Probiotic clarified apple juice with oligofructose or sucralose as sugar
substitutes: Sensory profile and acceptability. LWT – Food Sci. Technol.
62(1) ,838-846
RABABAH, T.M., AL-MAHASNEH, M.A., KILANI, I., YANG, W.,
ALHAMAD, M.N., EREIFEJA, E. and AL-U’DATTA, M. 2011.
Effect of jam processing and storage on total phenolics, antioxidant
activity, and anthocyanins of different fruits. J. Sci. Food Agric.
91(6),1096 –1102.
RENARD, D., VAN DE VELDE, F. and VISCHERS, R.W.2006.The gap
between food gel structure, texture and perception. Food Hydrocol.
20, 423–431.
RENWICK, A.G. and NORDMANN, H. 2007. First European
conference on aspartame: Putting safety and benefits into perspective.
Synopsis of presentations and conclusions. Food Chem. Toxic. 45(7),
1308–1313.
ROSA, E., PEINADO, I., HEREDIA, A. and ANDRÉS, A. 2009. New
Processing Methods and Healthier Sugars in Strawberry Spread Fruit
Manufacturing. ‘New Challenges in Food Preservation’ European
Federation of Food Science and Technology (EFFoST), Budapest,
Hungary.

III. Resultados
97
SATO, A.C. and CUNHA, R.L. 2009. Effect of particle size on
rheological properties of jaboticaba pulp. J. Food Eng. 91(4), 566–
570.
SHAHIDI, F., LIYANA-PATHIRANA, C.M. and WALL, D.S. 2006.
Antioxidant activity of white and black sesame seeds and their hull
fractions. Food Chem. 99(3), 478–483.
SKELLAND, A.H.P. 1967. Non-Newtonian Flow and Heat Transfer.
John Wiley and Sons Inc. New York, USA.
SOFFRITTI, M., BELPOGGI, F., DEGLI ESPOSTI, D., LAMBERTINI,
L., TIBALDI, E. and RIGANO, A. 2006. First experimental
demonstration of the multipotential carcinogenic effects of aspartame
administered in the feed to Sprague-Dawley rats. Environ. Health
Persp. 114(3), 379–385.
SUBRAMANIAN, R., MUTHUKUMARAPPAN, K. and
GUNASEKARAN, S. 2006. Linear viscoelastic properties of regular
and reduced fat pasteurized process cheese during heating and
cooling. Int. J. Food Prop. 9(3), 377–393.
ŚCIBISZ, I. and MITEK. M. 2009. Effect of processing and storage
conditions on phenolic compounds and antioxidant capacity of
highbush blueberry jams. Polish J. Food Nutr. Sci. 59(1), 45–52.
TAYLOR, T.P., FASINA, O. and BELL, L.N. 2008. Physical properties
and consumer liking of cookies prepared by replacing sucrose with
tagatose. J. Food Sci. 73(3), 145–151.
VAN DEN HEUVEL, E.G.H.M., MUYS, T., VAN DOKKUM, W. and
SCHAAFSMA, G. 1999. Oligofructose stimulates calcium absorption
in adolescents. Am. J. Clin. Nutr. 69, 544–548.
VASTENAVOND, C.M., BERTELSEN, H., HANSEN, S.J., LAURSEN,
R.S., SAUNDERS, J. and ERIKNAUER, K. 2012. Tagatose (D-
tagatose). In: Alternative sweeteners (Nabors, L.O., ed) 13,197–222
Boca Raton, Fla.: CRC Press, USA.
WEIHRAUCH, M.R. and DIEHL, V. (2004). Artificial sweetener—do
they bear a carcinogenic risk?. Ann. Oncol. 15(10), 1460–1465.

III. Resultados
98
WORLD HEALTH ORGANIZATION (WHO). 2014. WHO opens
public consultation on draft sugars guideline
http://www.who.int/mediacentre/news/notes/2014/consultation-sugar-
guideline/es (accessed 20 June, 2014).
ZENG, Y., ZHANG, X., GUAN, Y. and SUN, Y. 2012. Enzymatic
hydrolysates from tuna backbone and the subsequent Maillard reaction
with different ketohexoses. Int. J. Food Sci. Technol. 47(6), 1293–
1301.


III.4. EVALUATION OF LEMON MARMALADE
FORMULATED WITH NEW SWEETENERS
(TAGATOSE AND ISOMALTULOSE)
Susana Rubio-Arraez1, Carlos Ferrer 1,
Juan Vicente Capella2, María Dolores Ortolá1,
and María Luisa Castelló1.
1Institute of Food Engineering for Development and 2Institute ITACA (ICT Technologies),
Universitat Politècnica de València,
Camino de Vera, s/n. 46022, Valencia, Spain
Journal of the Science of Food and Agriculture
JSFA-15-1987
(Enviado)


III. Resultados
99
ABSTRACT
Marmalades are an alternative to fresh citrus fruit because they have a
longer shelf life and their reformulation with healthier components could
enhance their consumption. Thus, the aim of this study was to make
lemon marmalades in which sucrose is replaced by sweeteners such as
tagatose and isomaltulose, which are non-cariogenic and have a low
glycemic index. Analyses of ºBrix, pH, moisture, water activity,
antioxidant capacity, optical and rheological properties were carried out
on marmalades on their first day of storage, and after 60 days of storage.
Microbiological analyses were also performed. Moreover, a sensory
evaluation was performed to assess its consumer acceptance as compared
to marmalade made with sucrose. The results showed that the antioxidant
capacity of the new formulations was lower than in marmalade with
sucrose.
Moreover, marmalades made with healthy sweeteners showed lower
consistency than those made with sucrose. Lemon marmalades
formulated with a higher proportion of isomaltulose initially had high
luminosity compared to the other samples, but browned over time. All
marmalades were microbiologically stable, and the marmalades made
with healthy sweeteners were scored better than those made with sucrose.
Keywords: lemon marmalade, sweeteners, tagatose, isomaltulose,
antioxidant capacity, rheology, colour, microbiology, sensory analysis.
INTRODUCTION
Fruits have a short shelf life but high nutritional value. Marmalades
are an alternative to fresh fruit, and they also provide an outlet for surplus
fruit production, offering a very stable product. Sucrose has traditionally
been used as the main sugar in marmalades. Sucrose provides a high
energy input for daily activities due to its high glycemic index, but it is
high in calories. Excessive consumption of sucrose can cause several
diseases such as tooth decay, obesity and diabetes (Edwards, 2002;

III. Resultados
100
O'Donnell and Kearsley, 2012; WHO, 2014). However, the food industry
offers other natural sweeteners, which do not lead to such problems. In
fact, this research group has already done studies on the reformulation of
orange marmalade with a combination of tagatose and oligofructose on
their rheological, optical, antioxidant and sensorial properties (Rubio-
Arraez et al., 2015).
Tagatose and isomaltulose are two of those non-cariogenic sweeteners
that are slowly released into blood. In fact, D-Tagatose (D-tag) it is
considered a functional food because it is partially metabolized and the
part that is not absorbed (80% of the intake) ferments in the colon, where
it performs functions as soluble fiber (Taylor et al., 2008) favoring lactic
acid and Lactobacillus bacteria (Petersen-Skytte, 2006). Moreover, it is a
stereoisomer of D-galactose, it is found naturally in cheese and yoghurt
(Oh, 2007; Lu et al., 2008).
Furthermore, it is very suitable for confectionary products, ice creams,
soft drinks and breakfast cereals (Vastenavond et al., 2011), since it is
almost as sweet as sucrose and its texture is very similar to sucrose (Oh,
2007; Taylor et al., 2008; Calzada-León et al., 2013). Additionally,
tagatose has only 1.5 kcal/g and it does not cause dental caries (Levin,
2002). Tagatose received Generally Recognized as Safe status by the
Food and Drug Administration in 2001 and entered the US market as a
sweetener in 2003 (Donner et al., 2010).
On the other hand, isomaltulose has a third of the sweetening power of
sucrose and the physicochemical properties of isomaltulose enable it to
be used as a substitute for sucrose in most sweet foods (Lina et al., 2002;
De Oliva-Neto y Menão, 2009; Peinado et al., 2013). Furthermore,
isomaltulose is a reducing disaccharide which is naturally present in
honey, and sugar cane juice, its taste and viscosities of aqueous solutions
are similar to those of sucrose and it has the same caloric power
(Schiweck et al., 1990; Periche et al., 2014).

III. Resultados
101
Given the characteristics of these two sweeteners, they could be used
to reformulate traditional foods to make them healthier for society. Thus,
the aim of this study was to evaluate the potential use of healthy
sweeteners (isomaltulose and tagatose) as an alternative to sucrose in
lemon marmalades, by analyzing their colour, rheological properties,
antioxidant capacity, microbiological stability and sensorial acceptance.
MATERIALS AND METHODS
Lemon Marmalade Formulations and Manufacturing
Processes
Marmalades were produced using 50% lemon pulp (Citrus limon
eureka also known as Four Seasons), 50% sucrose (Azucarera Española,
Burgos, Spain) or healthy sweeteners (tagatose or isomaltulose)
containing 1% agar-agar (Roko Agar, Asturias, Spain).Isomaltulose was
obtained from Beneo (Palatinose, Mannheim, Germany). Tagatose was
obtained from Damhert Nutrition (Tagatesse, Heusden-Zolder, Belgium),
which was composed by 39.9% of tagatose 39.9% of isomalt, 0.02% of
sucralose and 20% of dietary fiber (inulin and oligosaccharides). The
following notation was used depending on the combination of sweeteners
used: Control marmalade: 100 % sucrose, Marmalade A: 60%
isomaltulose and 40% tagatose, Marmalade B: 50% isomaltulose and
50% tagatose, and Marmalade C: 30% isomaltulose and 70% tagatose. A
commercial lemon marmalade was also characterized (Ora et Labora,
Lemon Marmalade, Monasterio Santa Paula, Sevilla, Spain).
Lemons were selected and picked fresh. Subsequently, they were
peeled and mixed with the corresponding combination of healthy
sweeteners/sucrose and the agar-agar in a thermal blender (Thermomix,
TM31, Vorwerk, Germany) for 3 min. Afterwards the mixture was
cooked at 100 ºC for 20 min at 350 rpm. The glass jars, which had
previously been sterilized in an autoclave at 121 ºC for 15 min, were then
filled with the marmalade and turned over to ensure proper sealing for 1

III. Resultados
102
hour. Finally, the marmalade was allowed to cool for 24 hours and
became jellified. Three batches of lemons were used to prepare the
marmalades. Analyses were triplicated on the first day of storage and
after 60 days of storage.
Analytical Determinations
Water Activity, pH, Moisture Content and Brix
Water activity (aw) was determined with a dew point water activity
meter made by Decagon Devices, Inc. (Aqua Lab 4TE, Pullman,
Washington, USA), at 25 ºC. The pH was registered with a pH-meter
(Seven Easy, Mettler Toledo, Barcelona, Spain). Moisture content (xw)
was determined gravimetrically by drying approximately 1 g of
marmalade until a constant weight, in a vacuum oven at 60ºC (method
934.06, AOAC 2000). The soluble solids content (Brix) was determined
in a refractometer at 20ºC (Atago 3T, Tokyo, Japan).
Antioxidant Capacity
The antioxidant activity of marmalades was analyzed on the basis of
the scavenging activities of the stable 2,2-diphenyl-1-picrylhydrazyl free
radical (Brand-Williams et al. 1995; Shahidi et al. 2006). 1 g of
marmalade was mixed with 6 mL of pure methanol for 5 min in a vortex,
keeping the supernatant.
This mixture was centrifuged at 13000 rpm for 10 min. The
absorbance of 3.9 mL of the DPPH solution (0.025 g/L, prepared in
methanol: water (80:20)) was read at 515 nm in a spectrocolorimeter
manufactured by Thermo Fisher Scientific, Inc. (Helios Zeta UV-VIS,
Waltham, Massachusetts, USA). Then, 0.1 mL of the supernatant was
mixed with the methanolic solution of DPPH and absorbance was read
again after 30 min. Quantification was performed considering a standard
curve of Trolox (6-Hydroxy-2,5,7,8-tetramethylchroman-2-carboxylic

III. Resultados
103
acid) and the results were expressed as mg of Trolox equivalent per 100 g
of marmalade.
Optical Properties
The optical properties of lemon marmalades were measured using a
spectrocolorimeter manufactured by Konica Minolta, Inc. (CM-3600d,
Tokyo, Japan). CIE-L*a*b* coordinates were obtained using D65
illuminant and 10º observer as the reference system. All analytical
determinations were performed on sweet lemon marmalades in 20 mm-
wide cuvettes.
Rheological Analysis
The rheological properties of the lemon marmalades studied were
measured using a controlled stress rheometer manufactured by Thermo
Fisher Scientific, Inc. (Haake RheoStress 1, Waltham, Massachusetts,
USA), at 25 ºC. Measurements were carried out in triplicate with plate–
plate geometry and a 2.0 mm gap for steady state and oscillatory tests
(Sato and Cunha 2009), by means of steady state essays or oscillatory
essays to study the pseudoplastic or viscoelastic behavior of marmalades,
respectively.
Firstly, steady state measurements were performed linearly with a
shear rate ranging from 0 to 100 s-1, in 3 sweeps (up, down and up-
cycles), in order to eliminate thixotropy. The data obtained in the third
sweep were fitted to the Herschel–Bulkley model (equation 1). This
model describes Newtonian and a large group of time independent non-
Newtonian fluids. There are three parameters: is the shear stress (Pa), 0
is the yield stress above which the fluid starts flowing (Pa), γ is the shear
rate (s-1), k is the index of consistency (Pa·sn) and n is the index of
fluidity (Skelland, 1967).
𝜏 = 𝜏0 + 𝜅 ∙ 𝛾𝑛 (1)
III. Resultados
104
Secondly, an oscillatory assay was carried out based on the power-law
describing the mechanical spectrum within the linear viscoelastic region
in terms of storage (G’) and loss (G”) modulus as a function of frequency
between 0.1-10 Hz (equations 2 and 3) (Subramanian et al. 2006; Basu et
al. 2011):
𝐺′ = 𝑎 ∙ 𝑏 (2)
𝐺" = 𝑐 ∙ 𝑑 (3)
Where, ω is the angular speed (rad·s-1), a is the low frequency storage
modulus (Pab); b is the power-law index for the storage modulus
(dimensionless); c is the low frequency loss modulus (Pad); and, d is the
power-law index for the loss modulus (dimensionless). The shear stress
value required to fulfil the linearity of G’ and G” was obtained in a
preliminary trial. For this purpose, an interval of shear = 0.1-10 Pa was
studied and three fixed frequencies were marked in the range of 0.1-10
Hz. Once these 3 curves were represented, the lineal zone of viscosity
was obtained, having chosen the value of in the linear zone for all the
frequencies (Peinado et al. 2012).
Microbiological Analysis
Serial dilutions were prepared by homogenizing 10 g of marmalade
with 90 mL of 1% sterile peptone water in a stomacher bag, using sterile
techniques. Mesophilic aerobic populations were analyzed in a Plate
Count Agar (Scharlau Chemie, 1-329, Barcelona, Spain), by incubating
samples for 72 hours at 31ºC. Yeast and molds were determined in
Sabouraud Chloramphenicol Agar (Scharlau Chemie, 1-166, Barcelona,
Spain) plates kept at for 5 days. Samples were analyzed after 60 days of
storage.

III. Resultados
105
Sensorial Analysis
An acceptance test using a 9-point hedonic scale (ISO 4121,2003) was
used to evaluate the following attributes: colour, arome, texture,
consistency, spreadable capacity, palatability, flavour, sweetness,
bitterness, and global preference (ISO 5492,2008) in the three
formulations made with different combinations of healthy sugars (A, B
and C), as well as the control marmalade. Additionally, the possible
appearance of sineresis and intention of buying were assessed.
For this purpose, a panel was formed consisting of 30 trained
panelists ranging in age from 20 to 50 years old, who are regular
consumers of this kind of marmalades. Testing sessions were conducted
in a sensory evaluation laboratory built according to the international
standards for test rooms (ISO 8589, 2007).
Statistical Analysis
Statgraphics plus (Centurion, Statpoint Technologies, Inc., Warrenton,
Virginia, USA.) software was used to perform the statistical analyses.
Analyses of variance (multifactor ANOVA) were performed to study the
interactions between the formulation and time of storage on the
marmalades.
RESULTS AND DISCUSSION
Compositional characterization of marmalades
Table 1 shows the results reflecting the composition (Brix and
moisture content (xw)), pH, water activity (aw) and antioxidant capacity of
the lemon marmalades studied. It is noteworthy that none of the
marmalades prepared with the new sweeteners reached the Brix of the
commercial (65 Brix) or the control (59 Brix) samples. However, the
new marmalades do meet the standards of Council Directive
2001/113/EC of 20 December 2001 relating to fruit jams, jellies and

III. Resultados
106
marmalades and sweetened chestnut purée intended for human
consumption, since this Directive allows soluble content lower than 60
Brix when sweeteners are used in the formulation for these products,
rather than sugars. Over time the values of Brix remained constant. In
coherence with the Brix results, marmalades formulated with the new
sweeteners showed the highest values for moisture content (xw), whereas
the commercial marmalades showed the lowest value, followed by the
control sample. However, in this case, moisture content significantly
increased after storage, probably due to the condensation of water vapor
in the space located in the inner part of the lids.
Accordingly, the water activity of the commercial lemon marmalades
was significantly lower than in the other cases. Among the new
marmalades, the lowest water activity was registered for marmalade C,
which had the highest amount of tagatose. Therefore, tagatose would
make the water molecules more compact than isomaltulose. After storage,
few changes were observed in aw. It should also be highlighted that all
samples prepared in this study showed lower values of pH than the
commercial marmalades. Initially the marmalades B and C showed
higher pH values, but all samples reached similar values after storage.
Besides, all pH values were lower than 3.5, which would ensure a proper
microbiological stability of these products, as was observed in other fruit
jams made with strawberry, peach, plum or apricot (Carbonell et al.,
1991; García-Martínez et al., 2002).
Also noteworthy was that the lemon marmalade formulations A, B and C
showed a lower antioxidant content than the control marmalade, although
time significantly reduced the antioxidant content in all cases.
Furthermore, the commercial sample showed only 0.11±0.04 mg Trolox
eq/100 g which would be consistent with the rapid deterioration of
antioxidant compounds in which occurs in lemon marmalade. In our
previous study (Rubio-Arraez et al., 2015) it was observed that the
highest proportion of oligofructose contributed to improve the initial
antioxidant capacity of orange marmalades.
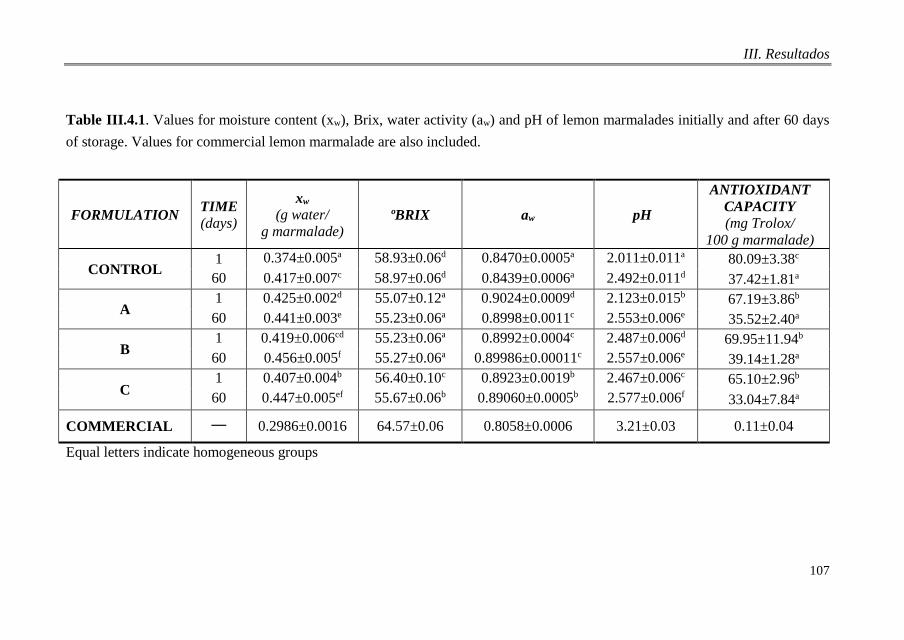
III. Resultados
107
Table III.4.1. Values for moisture content (xw), Brix, water activity (aw) and pH of lemon marmalades initially and after 60 days
of storage. Values for commercial lemon marmalade are also included.
FORMULATION TIME
(days)
xw
(g water/
g marmalade) ºBRIX aw pH
ANTIOXIDANT
CAPACITY
(mg Trolox/
100 g marmalade)
CONTROL 1 0.374±0.005a 58.93±0.06d 0.8470±0.0005a 2.011±0.011a 80.09±3.38c
60 0.417±0.007c 58.97±0.06d 0.8439±0.0006a 2.492±0.011d 37.42±1.81a
A 1 0.425±0.002d 55.07±0.12a 0.9024±0.0009d 2.123±0.015b 67.19±3.86b
60 0.441±0.003e 55.23±0.06a 0.8998±0.0011c 2.553±0.006e 35.52±2.40a
B 1 0.419±0.006cd 55.23±0.06a 0.8992±0.0004c 2.487±0.006d 69.95±11.94b
60 0.456±0.005f 55.27±0.06a 0.89986±0.00011c 2.557±0.006e 39.14±1.28a
C 1 0.407±0.004b 56.40±0.10c 0.8923±0.0019b 2.467±0.006c 65.10±2.96b
60 0.447±0.005ef 55.67±0.06b 0.89060±0.0005b 2.577±0.006f 33.04±7.84a
COMMERCIAL __
0.2986±0.0016 64.57±0.06 0.8058±0.0006 3.21±0.03 0.11±0.04
Equal letters indicate homogeneous groups

III. Resultados
108
Rheological Properties
The rheological properties of marmalades studied were determined
using two tests, both steady and oscillatory, to obtain the parameters of
the models considered in each case. The results obtained for the
stationary test of lemon marmalades, based on the combination of
sweeteners used and the storage time, is presented in Figure 1.
The rheograms of lemon marmalades fluctuated, possibly due to the
increased presence of lumpy parts. In any case, over the storage time, the
curves remained similar. The rheograms of commercial lemon marmalade
showed no clear trend due to the high presence of cells and lemon peel.
Therefore, the curve is not shown. The parameters of the Herschel-
Bulkley model for lemon marmalades studied at the beginning and the
end of the period considered are shown in Table 2.
As can be seen, the use of the new sweeteners initially led to lower
values of shear stress () than in marmalades prepared with sucrose.
However, the consistency index (k) was initially significantly higher in
marmalade with the highest amount of tagatose (formulation C). In
studies carried out by other authors, (Peinado et al. 2012) where sugars
were also replaced by other sweeteners (isomaltulose), a decrease in
consistency and cohesiveness of strawberry jams was observed.
On the other hand, the storage time caused a compaction in lemon
marmalades since the values of shear stress significantly increased. The
index of fluidity (n) also increased over time but this increase was only
significant in formulation A, which might be due to the fact that the
isomaltulose content was higher. However, the index of consistency (k)
significantly decreased in formulation C, dropping to half the initial
index, despite registering the highest initial values, as previously
mentioned. In our previous study (Rubio-Arraez et al., 2015), the orange
marmalade with the same proportions of oligofructose and tagatose was
more consistent.

III. Resultados
109
Figure III.4.1. Mean flow curves (rheograms) obtained from the steady
assay of lemon marmalades at the beginning and at the end of storage.
Samples were coded respect to the amount of sugars as: Control (100%
sucrose); A (60% isomaltulose and 40% tagatose); B (50% isomaltulose
and 50% tagatose), and C (30% isomaltulose and 70% tagatose).
0
5
10
15
20
25
30
35
40
45
50
55
0 20 40 60 80 100
(P
a)
γ (s-1)
Day 60
Control A B C
0
5
10
15
20
25
30
35
40
45
50
0 20 40 60 80 100
(P
a)
γ (s-1)
Day 1
Control A B C
0
5
10
15
20
25
30
35
40
45
50
0 20 40 60 80 100
(P
a)
γ (s-1)
Day 60
Control A B C
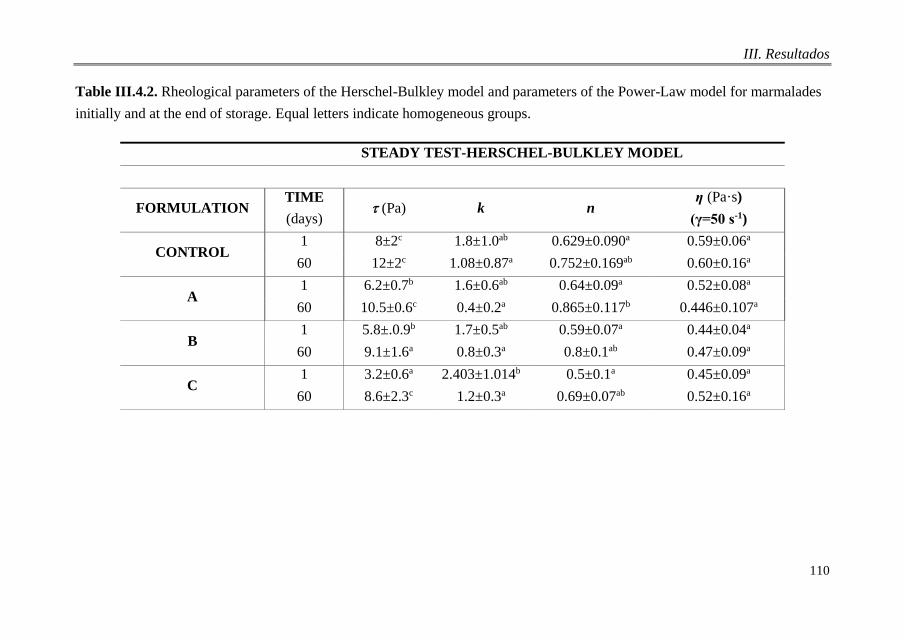
III. Resultados
110
Table III.4.2. Rheological parameters of the Herschel-Bulkley model and parameters of the Power-Law model for marmalades
initially and at the end of storage. Equal letters indicate homogeneous groups.
STEADY TEST-HERSCHEL-BULKLEY MODEL
FORMULATION TIME
(days) (Pa) k n
η (Pa·s)
(γ=50 s-1)
CONTROL 1 8±2c 1.8±1.0ab 0.629±0.090a 0.59±0.06a
60 12±2c 1.08±0.87a 0.752±0.169ab 0.60±0.16a
A 1 6.2±0.7b 1.6±0.6ab 0.64±0.09a 0.52±0.08a
60 10.5±0.6c 0.4±0.2a 0.865±0.117b 0.446±0.107a
B 1 5.8±.0.9b 1.7±0.5ab 0.59±0.07a 0.44±0.04a
60 9.1±1.6a 0.8±0.3a 0.8±0.1ab 0.47±0.09a
C 1 3.2±0.6a 2.403±1.014b 0.5±0.1a 0.45±0.09a
60 8.6±2.3c 1.2±0.3a 0.69±0.07ab 0.52±0.16a

III. Resultados
111
(cont.) Table III.4.2. Rheological parameters of the Herschel-Bulkley model and parameters of the Power-Law model for
marmalades initially and at the end of storage. Equal letters indicate homogeneous groups.
OSCILLATORY TEST-POWER LAW
G´ G´´
FORMULATION TIME
(days) a b c d
CONTROL 1 449±125b 0,0099±0,0004ab 102±27b 0,01123±0,00102a
60 586±35c 0,0099±0,0002ab 138±9b 0,0098±0,0009a
A 1 194±99a 0,0104±0,0002b 65±13a 0,0107±0,0007a
60 289±15a 0,0104±0,0003b 70±2a 0,0098±0,0007a
B 1 210±29a 0,013±0,003b 54±9a 0,014±0,004a
60 268±44a 0,0109±0,0001b 63±10a 0,0125±0,0003a
C 1 232±18a 0,0083±0,0016a 56±5a 0,0089±0,0010a
60 308±32a 0,01077±0,00015a 74±6a 0,0113±0,0006a

III. Resultados
112
As for the results of the oscillatory test, Figure 2 shows the evolution of the
storage (G’) and loss (G”) moduli versus frequency for the lemon marmalades
studied. Furthermore, the results of varying both G’ and G’’ were adjusted for
the angular velocity (ω) (rad·s-1) to the model of the Power Law. The resulting
values of the parameters of this model are presented in Table 2. This type of
test determines the ratio between the elastic and viscous component of a
material and quantifies to which the material behaves as a solid or liquid.
Specifically, the storage modulus (G’) is associated with the elastic
component of the material, whiles the loss modulus (G”), is associated with its
viscous component. Since in all cases G’ was greater than G” moduli the
lemon marmalades showed a semi-solid behavior (Peinado et al., 2012).
This characteristic is typical of a gel, since it is more elastic than viscous.
The parameters a and c decreased significantly with new sweeteners, but there
were no differences between the combinations studied. The storage time
increased these parameters in all cases, but the increase was only significant in
the control marmalade. These results are consistent with the curves presented
in Figure 2, where the marmalade control curves of G’ and G” as a function of
frequency are placed above the others, especially at the end of storage.
Besides, Peinado et al. (2012) observed the same when sucrose was replaced
by isomaltulose in the reformulation of different strawberry spreadable
products.
This decrease was associated with how the type of sugar influences the
availability of water in the mixture of pectin-sugar-acid, and therefore in the
formation of hydrogen bonds and the possible association of water in the
pectin polymer chain (Peinado et al., 2012). In the present study, the gelling
agent used was agar-agar instead of pectin and it could have homogenized the
rheological properties of the marmalade regardless of the type of sugar used.
However, the parameters b and d were similar in all marmalades. Besides, in
orange marmalade formulated with oligofructose and tagatose as a substitutes
of sucrose and agar-agar there was an increase in the elastic component (G’)
after 45 days of storage (Rubio-Arraez et al., 2015).

III. Resultados
113
Figure III.4.2. Average frequency curves obtained in the oscillatory test of
lemon marmalades at the beginning and end of storage. Samples were coded
respect to the amount of sugars as Control (100% Sucrose); A (60%
isomaltulose and 40% tagatose); B (50% isomaltulose and 50% tagatose), and
C (30% isomaltulose and 70% tagatose). Empty symbols referred to values of
G´ and filled symbols referred to values of G´´.
Optical Properties
Figure 3 shows the interaction charts for the colorimetric coordinates L*,
a* and b*, chroma (C*=(a*2+b*2)1/2) and hue (h*=arctg(b*/a*)) of the
0
200
400
600
800
1000
1200
0 2 4 6 8 10
G
or
G
(Pa
)
f (Hz)
Day 60
Control G' Control G'' A G' A G'' B G' B G'' C G' C G''
0
200
400
600
800
1000
1200
0 2 4 6 8 10
G
or
G
(Pa
)
f (Hz)
Day 1
Control G' Control G'' A G' A G'' B G' B G'' C G' C G''
0
200
400
600
800
1000
1200
0 2 4 6 8 10
G
or
G
(Pa
)
f (Hz)
Day 60
Control G' Control G'' A G' A G'' B G' B G'' C G' C G''
0
200
400
600
800
1000
1200
0 2 4 6 8 10
G
or
G
(Pa
)
f (Hz)
Day 1
Control G' Control G'' A G' A G'' B G' B G'' C G' C G''
0
200
400
600
800
1000
1200
0 2 4 6 8 10
G
or G
(P
a)
f (Hz)
Day 1
Control G' A G' B G' C G'

III. Resultados
114
different lemon marmalades studied, both initially and at the end of storage.
On the other hand, the values for these coordinates of the commercial lemon
marmalade were L*=35.03±0.11, a*= 1.57±0.05, b*= 9.7±0.1, chroma=9.81 ±
0.08 and hue=80.80±0.24. It should be pointed out that the storage time for
this commercial marmalade was unknown. As can be seen, the L* of control
marmalade and the samples formulated with combination B and C were very
similar, while sample A, which had the highest percentage of isomaltulose,
initially had a higher luminosity, although luminosity decreased at the end of
storage as in the other cases. The orange marmalades formulated with
oligofructose and tagatose had a similar appearance, but oligofructose reduced
L* and the highest content of tagatose also decreased L*, a* and b* after 45
days of storage (Rubio et al., 2015).
Coordinate a* for the marmalade with formulation B initially showed the
highest value. However, after 60 days of storage no significant differences
were observed between the new marmalades, although their coordinate a* was
higher than in the control marmalade. In contrast, coordinate b* decreased
after storage. Consequently, the chroma (C*) and hue (h*) decreased during
storage, leading to browning in the marmalades. This browning could also be
related to a reduction in polyphenols (antioxidant capacity) over time, which
would be also responsible for the previously mentioned increase in pH after
storage, which occurred in the samples.
These results are also consistent with those found by Peinado et al., (2015)
who reported that strawberry jams formulated with the healthy sweetener
isomaltulose and different concentrations of citric acid and pectin darkened
during storage. Additionally, the colorimetric coordinates of the products
containing the sucrose-isomaltulose mixture seemed to be influenced by the
percentages of pectin and citric acid, while the color of the samples containing
the fructose-isomaltulose mixture did not seem to be affected by the different
variables. Therefore the influence of the different ingredients on the food
system does not only depend on their concentration or distribution within the
different system phases but also on the different component interactions
during the period studied (Dervisi et al. 2001; Peinado et al. 2015).

III. Resultados
115
Figure III.4.3. Interaction graphics (significant level of 95%) of colour
parameters: L*, a*, b* coordinates, chroma (C*) and hue (h*) of the lemon
marmalade as a function of the formulation and storage time. Samples were
coded respect to the amount of sugars as: Control (100% Sucrose); A (60%
isomaltulose and 40% tagatose); B (50% isomaltulose and 50% tagatose), and
C (30% isomaltulose and 70% tagatose).
Microbiological Analysis
There were no colonies of molds and yeast or aerobic mesophillic found in
any of the marmalades in this study over the storage period considered.
Interactions and 95,0 Percent LSD Intervals
31
33
35
37
39
L*
Control A B C
TIME (Days)
1
60Interactions and 95,0 Percent LSD Intervals
31
33
35
37
39
L*
Control A B C
TIME (Days)
1
60
Interactions and 95,0 Percent LSD Intervals
FORMULATION
8
9
10
11
12
13
b*
Control A B C
TIME (Days)
1
60
Interactions and 95,0 Percent LSD Intervals
FORMULATION
3
3,5
4
4,5
5
a*
Control A B C
TIME (Days)
1
60
Interactions and 95,0 Percent LSD Intervals
FORMULATION
9
10
11
12
13
14
C*
Control A B C
TIME (Days)
1
60
Interactions and 95,0 Percent LSD Intervals
FORMULATION
62
65
68
71
74
77
h*
Control A B C
TIME (Days)
1
60
4.5
3.5
Interactions and 95,0 Percent LSD Intervals
31
33
35
37
39
L*
Control A B C
TIME (Days)
1
60
Interactions and 95,0 Percent LSD Intervals
31
33
35
37
39
L*
Control A B C
TIME (Days)
1
60
Interactions and 95,0 Percent LSD Intervals
31
33
35
37
39
L*
Control A B C
TIME (Days)
1
60
Interactions and 95,0 Percent LSD Intervals
31
33
35
37
39
L*
Control A B C
TIME (Days)
1
60

III. Resultados
116
Therefore, in all cases the products were stable from a microbiological point
of view.
Sensory Analysis
Figure 4 shows a radial chart of the average scores for each attribute
evaluated. No significant differences in colour, arome, texture, spreadability
and consistency were detected. However, new formulations improved
palatability with respect to the control marmalade. Moreover, although the
bitterness level for the marmalades evaluated in this study was expected to be
very high, it seems that the combination of sweeteners reduced this bitterness,
due more to the effect of tagatose than to the effect of isomaltulose.
Thus, the control marmalade had the highest bitterness followed by
formulation A, C and B. Besides, the lemon marmalades with the highest
amounts of tagatose (B and C) were the sweetest, showing that there is a
sweetness threshold for a concentration of tagatose of 50% in the proportion
of sweeteners used in the formulations. Although tagatose should have a
sweetening power similar to sucrose (Oh 2007; Taylor et al. 2008; Calzada-
León et al. 2013), the sweetening powers were not similar in this case.
This behavior could be due to the fact that the commercial tagatose used in
this study was composed also by oligosaccharides, isomalt and sucralose,
which increased the sweetening power for their due a synergic effect. In fact,
according to the Patent EP0946112 B1 (Dörr and Jager 2002),
oligosaccharides increase the sweetness and improve the taste of an
acesulfame-k/aspartame mixture. Consequently, the formulation B showed the
highest values of acceptance and intention of buying, followed by formulation
C, without significant differences between the two marmalades. Additionally,
the new lemon marmalades were evaluated as being better than the control.
Moreover, in the case of orange marmalades (Rubio-Arraez et al., 2015) those
prepared with new healthy sweeteners (tagatose and oligofructose) had better
scored than marmalade prepared with sucrose.

III. Resultados
117
Figure III.4.4. Results of the sensory analysis in the evaluation of the lemon
marmalades coded respect to the amount of sugars as: Control (100%
Sucrose); A (60% isomaltulose and 40% tagatose); B (50% isomaltulose and
50% tagatose), and C (30% isomaltulose and 70% tagatose).* p-value <0.05,
** p-value <0.01.
CONCLUSIONS
The reformulation of lemon marmalade with non-cariogenic sweeteners
such as tagatose and isomaltulose is possible, since although the new
marmalades did not reach the same concentration of soluble solids as
marmalades made with sucrose, they were microbiologically stable over the
storage period considered. More specifically, isomaltulose increased their
luminosity and hue. Furthermore, the combination of the new sweeteners did
not influence viscoelasticity, although it was lower than in marmalade with
sucrose. Finally, tagatose led to the best scores for lemon marmalades, mainly
due to its high sweetening power.
0
3
6
9
Colour
Arome
Texture
Consistency
Spreadable
capacity
Palatability*Flavour**
Sweetness**
Bitterness**
Global
preference*
Intention of
buying*
CONTROL
A
B
C

III. Resultados
118
ACKNOWLEDGEMENT
The authors would like to thank the Serigó-Andrés family for donating the
raw material and the projects GV/2013/029, GV/2014/012 by the GVA as well
as the Universitat Politècnica de València for the financial support given to
this investigation (UPV PAID-06-12 SP20120889).
REFERENCES
AOAC. (2000). Official Methods of Analysis of AOAC International, 17th
edition. Gaithersburg, MD, USA.
Basu, S., Shivhare, U.S., Singh, T.V., & Beniwal, V.S. (2011). Rheological,
textural and spectral characteristics of sorbitol substituted mango jam.
Journal Food Engineering, 105 (3), 503–512.
Brand-Williams, W., Cuvelier, M. E., & Berset, C. (1995). Use of a free-
radical method to evaluate antioxidant activity. LWT –Food Science and
Technology, 28 (1), 25–30.
Calzada-León, R., Ruiz-Reyes, M.L., Altamirano-Bustamante, N., &
Martínez, M.M. (2013). Features of the noncaloric sweeteners and their use
in children. Acta Pediátrica de México, 34(3), 141–153.
Carbonell, E., Costell, E., & Duran, L. (1991). Caracterización del flujo de
mermeladas comerciales españolas. Revista de Agroquímica y Tecnología
de Alimentos, 31(2), 227–235.
Dervisi, P., Lamb, J., & Zabetakis, I. (2001). High pressure processing in jam
manufacture: effects on textural and colour properties. Food Chemistry,
73(1), 85–91.
De Oliva-Neto, P. & Menão, P.T.P. (2009). Isomaltulose production from
sucrose by Protaminobacter rubrum immobilized in calcium alginate.
Bioresource Technology. 100, 252–4256.
Donner, T.W., Magder, L.S., & Zarbalian, K. (2010). Dietary supplementation
with D-tagatose in subjects with type 2 diabetes leads to weight loss and
raises high-density lipoprotein cholesterol. Nutrition Research, 30, 801–
806.

III. Resultados
119
Dörr, M. & Jager, M.( 2002). The use of oligosaccharides to increase the
sweetness and improve the taste of an acesulfame-k/aspartame mixture.
Patent EP0946112 B1. Nutrinova Nutrition Specialties and Food
Ingredients, GmbH.
Edwards, W.P. (2002). The science of goodies. Acribia. S.A., Zaragoza.
Spain.
García-Martínez, E., Ruiz-Diaz, G., Martínez-Monzó, J., Camacho, M.M.,
Martínez-Navarrete, N., & Chiralt, A. (2002). Jam manufacture with
osmodehydrated fruit. Food Research International, 35, 301–306.
ISO 4121. (2003). Sensory analysis. Guidelines for the use of quantitative
response scales. International Organization for Standardization. Geneva,
Switzerland.
ISO 8589. (2007). Sensory analysis. General guidance for the design of test
rooms. International Organization for Standardization. Geneva,
Switzerland.
ISO 5492. (2008). Sensory analysis. Vocabulary. International Organization
for Standardization. Geneva, Switzerland.
Levin, G.V. (2002). Tagatose, the new GRAS sweetener and health product.
Journal of Medicinal Food, 5(1), 23–36.
Lina, B.A.R., Jonker, G., & Kozianowski, G. (2002). Isomaltulose (Palatinose
review of biological and toxicologycal studies). Food and Chemical
Toxicology, 40(10), 1375–1381.
Lu, Y., Levin, G.V., & Donner, T.W. (2008). Tagatose, a new antidiabetic and
obesity control drug. Diabetes, Obesity and Metabolism, 10(2), 109–134.
Oh, D.K. (2007). Tagatose: properties, applications, and biotechnological
processes. Applied Microbiology and Biotechnology, 76(1), 1– 8.
O’Donnell, K., & Kearsley, M.W. (2012). Sweeteners and Sugar Alternatives
in Food Technology. Wiley-Blackwell, New Jersey, USA.
Peinado, I., Rosa, E., Heredia, A., & Andrés, A. (2012). Rheological
characteristics of healthy sugar substituted spreadable strawberry product.
Journal of Food Engineering, 113(3), 365–373.

III. Resultados
120
Periche, A., Heredia, A., Escriche, I., Andrés, A. & Castelló, M.L. (2014).
Optical, mechanical and sensory properties of based-isomaltulose gummy
confections. Food Bioscence, 7, 37–44.
Petersen-Skytte, U. (2006). Tagatose. In: Sweeteners and sugar alternatives in
food technology (Mitchell, H., ed.) pp. 262–292, Blackwell Publishing,
Oxford, UK.
Rubio-Arraez, S., Sahuquillo, S., Capella, J.V., Ortolá, M.D., & Castelló,
M.L. (2015). Influence of healthy sweeteners (tagatose and oligofructose)
on the physicochemical characteristics of orange marmalade. Journal of
texture studies, 46(4), 272-280.
Sato, A.C., & Cunha, R.L. (2009). Effect of particle size on rheological
properties of jaboticaba pulp. Journal of Food Engineering, 91, 566–570.
Ścibisz, I., & Mitek, M. (2009). Effect of processing and storage conditions on
phenolic compounds and antioxidant capacity of highbush blueberry jams.
Polish Journal Food Nutrition Science, 59(1), 45–52.
Shahidi, F., Liyana-Pathirana, C.M., & Wall, D.S. (2006). Antioxidant activity
of white and black sesame seeds and their hull fractions. Food Chemistry,
99(3), 478–483.
Skelland, A.H.P. (1967). Non-Newtonian Flow and Heat Transfer. John Wiley
and Sons Inc. New York, USA.
Subramanian, R., Muthukumarappanb, K., & Gunasekaran, S. (2006). Linear
viscoelastic properties of regular and reduced fat pasteurized process
cheese during heating and cooling. International Journal of Food
Properties, 9(3), 377–393.
Taylor, T.P., Fasina, O., & Bell, L.N. (2008). Physical properties and
consumer liking of cookies prepared by replacing sucrose with tagatose.
Journal of Food Science, 73(3), 145–151.
Vastenavond, C.M., Bertelsen, H., Hansen, S.J., Laursen, R.S., Saunders, J., &
Eriknauer, K. (2012). Tagatose (D-tagatose). In: Alternative sweeteners
(Nabors, L.O., ed) 13,197–222, Marcel Dekker, New York, USA.
(WHO). World Health Organization (2014). Available from:
http://www.who.int/mediacentre/news/notes/2014/consultation-sugar
guideline/es Accessed May 2015


III.5. EFFECT OF REPLACING SUGAR WITH
TAGATOSE AND ISOMALTULOSE
IN MANDARIN ORANGE MARMALADE ON
RHEOLOGY, COLOUR, ANTIOXIDANT
CAPACITY, AND SENSORY PROPERTIES
Susana Rubio-Arraez1, Juan Vicente Capella2, María Dolores
Ortolá1, and María Luisa Castelló1.
1Institute of Food Engineering for Development and 2Institute ITACA (ICT Technologies),
Universitat Politècnica de València,
Camino de Vera, s/n. 46022, Valencia, Spain
International Journal of Food Science and Technology
IJFST-2015-18144
(Enviado)
III.1.KINETICS OF OSMOTIC
DEHYDRATION OF ORANGE SLICES USING
HEALTHY SWEETENERS
Susana Rubio-Arraez1, Juan Vicente Capella2,


III. Resultados
121
ABSTRACT
The aim of this study was to make mandarin orange marmalades in which
sucrose is replaced by sweeteners such as tagatose and isomaltulose, which are
non-carcinogenic and have a low glycemic index. Analyses of rheology,
colour, antioxidant capacity, microbiology and sensory properties were carried
out on marmalades on their first day of storage, and after 90, 180 and 360 days
of storage. The results showed that marmalades made with healthy sweeteners
had a less elastic character and were thinner in consistency than those made
with sucrose. Luminosity was shown to be highest in mandarin orange
marmalades made with tagatose, although colour was stable for 6 months to
one year of storage. Tagatose also enhanced the antioxidant activity of these
marmalades. All marmalades were microbiologically stable. Finally,
marmalades made with tagatose alone scored the highest for global acceptance
and intention of buying by consumers.
Keywords: Marmalade, mandarin orange, tagatose, isomaltulose, rheology,
colour, sensory analysis.
INTRODUCTION
Mandarin orange fruits (Citrus reticulata) have a high nutritional
composition (high content of phenolics, ascorbic acid, dietary fiber, etc.) and
their consumption prevent diseases mainly due to this fruit’s antioxidant
activity (Dhuique-Mayer and others 2005; Balasundram and others 2006).
Citrus are the most popular fruits within European and North American
Consumers and Spain is one of the major producers and exporters of this fruit
(Gorinstein and others 2001).
Mandarin oranges are usually consumed as fresh fruit but also as
marmalades or juice. Most marmalades are prepared with sucrose. However,
this sugar has a high glycemic index and is also high in calories.
Consequently, excessive consumption of sucrose can cause several diseases
such as obesity, diabetes and tooth decay (Edwards 2002; O'Donnell and

III. Resultados
122
Kearsley 2012; WHO 2014). Nowadays, there are other alternative natural
sweeteners available in the market such as tagatose and isomaltulose, whose
properties are healthier. These sweeteners are non-cariogenic and are released
slowly into blood.
D-Tagatose (D-tag) is a stereoisomer of D-galactose. It can also be
produced cheese and yoghurt (Oh 2007; Lu and others 2008) and it has only
1.5 kcal/g (Levin 2002). Because it favors the growth of Lactobacillus
bacteria (Petersen-Skytte 2006) it is considered a functional food (Taylor and
others 2008). Furthermore, tagatose can be used to make products such as ice
creams, soft drinks and breakfast cereals (Vastenavond and others 2011) since
its texture is very similar to sucrose and it is almost as sweet as sucrose (Oh
2007; Taylor and others 2008; Calzada-León and others 2013). Tagatose
received Generally Recognized as Safe status by the Food and Drug
Administration in 2001 (Donner and others 2010).
On the other hand, isomaltulose is a reducing disaccharide which is
naturally present in honey, and sugar cane juice. Its caloric power, appearance,
taste and viscosities of aqueous solutions are similar to those of sucrose
(Schiweck and others 1990; Periche and others 2014). Moreover, given the
physicochemical properties of isomaltulose, it can be used as a substitute for
sucrose in most sweet foods and it has a third of the sweetening power of
sucrose (Lina and others 2002; De Oliva-Neto and Menão, 2009; Peinado and
others 2013).
Given the properties of these two sweeteners (isomaltulose and tagatose),
the aim of this work was to evaluate their potential use as an alternative to
sucrose in mandarin orange marmalades. For this purpose, their antioxidant
capacity, rheological properties, colour, and sensorial acceptance were
analyzed.

III. Resultados
123
MATERIALS AND METHODS
Mandarin orange Marmalade Formulations and Manufacturing
Processes
Marmalades were produced using 50% mandarin orange pulp (Citrus
reticulata Clementina), 50% sucrose (Azucarera Española, Burgos, Spain) or
sweeteners (tagatose or isomaltulose) containing 1% agar-agar (Roko Agar,
Llanera, Asturias, Spain). Isomaltulose (Beneo, Mannheim, Germany),
Tagatose (Tagatesse, Heusden-Zolder, Belgium).
The following notation was used depending on the combination of
sweeteners used: Control marmalade: 100% sucrose, Marmalade A: 75%
tagatose and 25% isomaltulose, Marmalade B: 50% tagatose and 50%
isomaltulose, Marmalade C: 25% tagatose and 75% isomaltulose and
Marmalade D: 100 % tagatose. Mandarin oranges were selected and picked
fresh. Subsequently, they were peeled and mixed with the corresponding
combination of healthy sweeteners/sucrose and the agar-agar in a thermal
blender (Thermomix, TM31, Vorwerk, Wuppertal, Germany) for 3 min.
Afterwards the mixture was cooked at 100 ºC for 20 min at 350 rpm. The
glass jars, which had previously been sterilized in an autoclave at 121ºC for 15
min, were then filled with the marmalade and turned over to ensure proper
sealing for 1 hour. Finally, the marmalade was allowed to cool for 24 hours
and became jellified. Three batches of mandarins were used to prepare the
marmalades. Analyses were triplicated on the first day of storage and after 90,
180 and 360 days of storage.
Analytical Determinations
Rheological Analysis
The rheological properties of the mandarin orange marmalades studied were
analyzed using a controlled stress rheometer manufactured by Thermo Fisher
Scientific, Inc. (Haake RheoStress 1, Waltham, Massachusetts, USA), at 25ºC.
Measurements were carried out in triplicate with plate–plate geometry and a

III. Resultados
124
2.0 mm gap for steady state and oscillatory tests (Sato and Cunha 2009), by
means of steady state essays or oscillatory essays to study the pseudoplastic or
viscoelastic behavior of marmalades, respectively.
Firstly, an oscillatory assay was carried out, following the power-law
describing the mechanical spectrum within the linear viscoelastic region in
terms of storage (G’) and loss (G”) modulus as a function of frequency
ranging from 0.1-10 Hz (equations 1 and 2) (Subramanian and others 2006;
Basu and others 2011):
𝐺′ = 𝑎 ∙ 𝑏 (1)
𝐺" = 𝑐 ∙ 𝑑 (2)
Where, ω is the angular speed (rad·s-1), a is the low frequency storage
modulus (Pab); b is the power-law index for the storage modulus
(dimensionless); c is the low frequency loss modulus (Pad); and, d is the
power-law index for the loss modulus (dimensionless). The shear stress value
required to fulfill the linearity of G’ and G” was obtained in a preliminary
trial. For this purpose, an interval of shear = 0.1-10 Pa was studied and three
fixed frequencies were marked in the range of 0.1-10 Hz. Once these 3 curves
were represented, the lineal zone of viscosity was obtained. The value of in
the linear zone was chosen for all frequencies (Peinado and others 2012).
Secondly, steady state measurements were performed with a shear rate
linearly ranging from 0 to 100 s-1, in 3 sweeps (up, down and up-cycles), in
order to eliminate thixotropy. The data obtained in the third sweep were fitted
to the Herschel–Bulkley model (equation 3). This model describes both
Newtonian and a large group of time independent non-Newtonian fluids.
There are three parameters: is the shear stress (Pa), 0 is the yield stress
above which the fluid starts flowing (Pa), γ is the shear rate (s-1), k is the index
of consistency (Pa·sn) and n is the index of fluidity (Skelland 1967).
𝜏 = 𝜏0 + 𝜅 ∙ 𝛾𝑛 (3)

III. Resultados
125
Optical Properties
The Optical properties of mandarin orange marmalades were measured
using a spectrocolorimeter Konica Minolta, Inc. (CM-3600d, Tokyo, Japan).
All analytical determinations were performed on mandarin orange marmalades
in 20 mm-wide cuvettes. CIE-L*a*b* coordinates were obtained using D65
illuminant and 10º observer as reference system.
Antioxidant Capacity
The antioxidant activity of marmalades was analyzed on the basis of the
scavenging activities of the stable 2,2-diphenyl-1-picrylhydrazyl free radical
(Brand-Williams and others 1995; Shahidi and others 2006). 1 g of marmalade
was mixed with 6 mL of pure methanol for 5 min in a vortex, keeping the
supernatant. This mixture was centrifuged at 13,000 rpm for 10 min.
The absorbance of 3.9 mL of the DPPH solution (0.025 mg/mL, prepared
in methanol: water (80:20)) was read at 515 nm in a spectrocolorimeter
Thermo Fisher Scientific, Inc. (Helios Zeta UV-VIS, Waltham,
Massachusetts, USA). Then, 0.1 mL of the supernatant was mixed with the
methanolic solution of DPPH and absorbance was read again after 30 min.
Quantification was performed considering a standard curve of Trolox (6-
Hydroxy-2,5,7,8-tetramethylchroman-2-carboxylic acid) and the results were
expressed as mg of Trolox equivalent per 100 g of marmalade.
Microbiological Analysis
Serial dilutions were prepared by homogenizing 10 g of marmalade with
90 mL of 1% sterile peptone water in a stomacher bag, using sterile
techniques. Sample for analysis were taken on days 1, 90, 180 and 360. Yeast
and moulds were determined in Sabouraud Chloramphenicol Agar (Scharlau
Chemie, 1-166, Barcelona, Spain) plates for 5 days at 31ºC. Mesophilic
aerobic populations were analyzed in Plate Count Agar (Scharlau Chemie, 1-
329, Barcelona, Spain) incubating samples for 72 hours at 31ºC.

III. Resultados
126
Sensorial Analysis
An acceptance test using a 9-point hedonic scale (ISO 4121:2003) was
used to evaluate the following attributes: colour, arome, texture, consistency,
spreadable capacity, palatability, flavour, sweetness, bitterness, global
preference (ISO 5492:2008) and intention of buying in the three formulations
with different combinations of healthy sugars (A, C and D), as well as the
control marmalade. A panel was formed consisting of 30 trained panelists
ranging in age from 20 to 50 years old, who are regular consumers of this kind
of marmalades.Testing sessions were conducted in a sensory evaluation
laboratory built according to the international standards for test rooms (ISO
8589: 2007). The marmalade B, formulated with isomaltulose and tagatose at
the same proportion, was not considered to sensorial analysis since the aim of
this test was to determine the consumers’ preference for tagatose or
isomaltulose and the other marmalades had higher amount of each of these
sweeteners.
Statistical Analysis
Analyses of variance (multifactor ANOVA) were performed using a
multiple comparison test and LSD test (α=95%), with Statgraphics Centurion
software (Statpoint Technologies, Inc. Warrenton, Virginia, USA). More
specifically, the interactions between factors (time of storage and formulation
on the marmalades) were studied.
RESULTS AND DISCUSSION
Rheological Properties
The rheological results of the oscillatory assay, which were based on the
evolution of the storage (G’) and loss (G”) moduli versus frequency for the
marmalade studied are shown in Figure 1. As can be observed, the
marmalades prepared by totally replacing sucrose with tagatose (marmalade
D) showed the lowest values of G’ and G”. Since the storage modulus
measures the stored energy, which represents elasticity, and the loss modulus
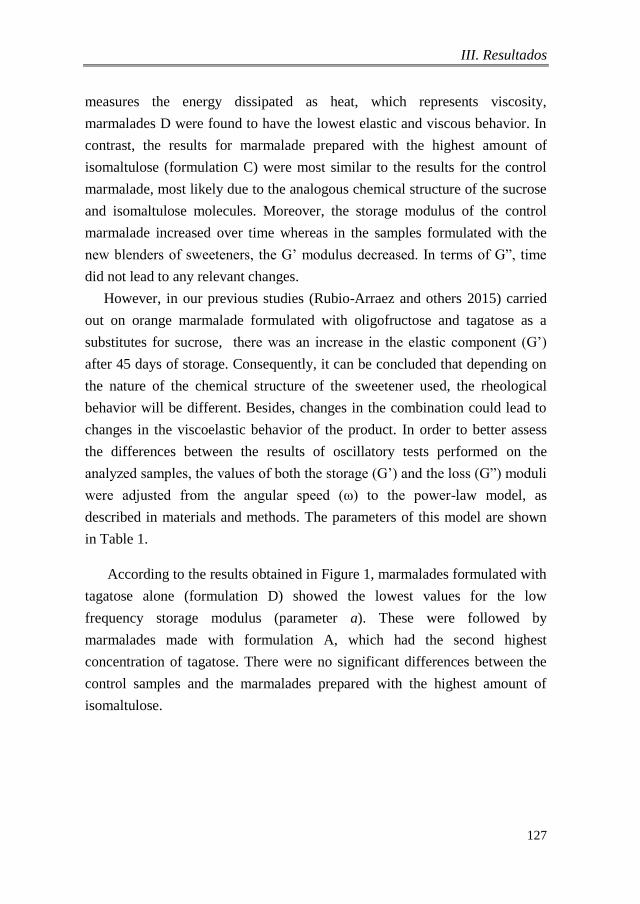
III. Resultados
127
measures the energy dissipated as heat, which represents viscosity,
marmalades D were found to have the lowest elastic and viscous behavior. In
contrast, the results for marmalade prepared with the highest amount of
isomaltulose (formulation C) were most similar to the results for the control
marmalade, most likely due to the analogous chemical structure of the sucrose
and isomaltulose molecules. Moreover, the storage modulus of the control
marmalade increased over time whereas in the samples formulated with the
new blenders of sweeteners, the G’ modulus decreased. In terms of G”, time
did not lead to any relevant changes.
However, in our previous studies (Rubio-Arraez and others 2015) carried
out on orange marmalade formulated with oligofructose and tagatose as a
substitutes for sucrose, there was an increase in the elastic component (G’)
after 45 days of storage. Consequently, it can be concluded that depending on
the nature of the chemical structure of the sweetener used, the rheological
behavior will be different. Besides, changes in the combination could lead to
changes in the viscoelastic behavior of the product. In order to better assess
the differences between the results of oscillatory tests performed on the
analyzed samples, the values of both the storage (G’) and the loss (G”) moduli
were adjusted from the angular speed (ω) to the power-law model, as
described in materials and methods. The parameters of this model are shown
in Table 1.
According to the results obtained in Figure 1, marmalades formulated with
tagatose alone (formulation D) showed the lowest values for the low
frequency storage modulus (parameter a). These were followed by
marmalades made with formulation A, which had the second highest
concentration of tagatose. There were no significant differences between the
control samples and the marmalades prepared with the highest amount of
isomaltulose.

III. Resultados
128
Table III.5.1. Rheological parameters of the power-law model model and parameters of the Herschel-Bulkley for mandarin orange
marmalades initially and at the end of storage.
Equal letters indicate homogeneous groups.
OSCILLATORY TEST-POWER LAW HERSCHEL-BULKLEY MODEL
G´ G´´
FORMULATION TIME
(days) a b c d (Pa) k n
η (Pa·s)
(γ=50 s-1)
CONTROL
1 1079±34d 0.14±0.01b 245±22c 0.14±0.03b 243±7c 59.78±1,01c 0.245±0.004a 2,34±0,07c
90 1120±27d 0.15±0.01b 214±19c 0.2±0.1b 224.1±20.3c 71±7c 0.231±0.001a 2,24±0.21c
180 1551±268e 0.16±0.01b 377±80d 0.14±0.01b 236.3±21.2c 72±7c 0.231±0.001a 2.363±0.211c
360 1172±347d 0.13±0.01b 214±20c 0.19±0.01b 234.91±21.01c 71±7c 0.230±0.001a 2.35±0.21c
A
1 387±30ab 0.16±0.01bc 90±5ab 0.17±0.02b 181.5±12.4bc 39.1±3.3b 0.294±0.004b 1.815±0.124a
90 234±18ab 0.20±0.02 bc 52±8ab 0.36±0.04b 169.62±18.73b 36.2±4.1b 0.3±0.1b 1.7±0.2a
180 328±30ab 0.2±0.1c 114±28ab 0.19±0.04b 203±4bc 38.1±1.1b 0.286±0.001b 2.03±0.04b
360 308±32ab 0.108±0.002a 74±6ab 0.011±0.001a 197±5bc 38.2±1.1b 0.28±0.01b 1.96±0.05b
B
1 755±117c 0.161±0.002 bc 168±29b 0.20±0.02b 163±20 ab 37±34b 0.28±0.01b 1.7±0.2a
90 844±33c 0.151±0.012b 155±20b 0.26±0.04bc 209±6c 40±3b 0.29±0.01b 2.1±0.1b
180 944±2c 0.19±0.01c 216±51b 0.22±0.01bc 161±7ab 39.1±1.4b 0.281±0.002b 1.6±0.1a
360 578±6b 0.19±0.02c 138±52b 0.26±0.03bc 161±7ab 39.2±1.3b 0.281±0.002b 1.6±0.1a

III. Resultados
129
(Cont.) Table III.5.1. Rheological parameters of the power-law model model and parameters of the Herschel-Bulkley for mandarin
orange marmalades initially and at the end of storage.
Equal letters indicate homogeneous groups.
OSCILLATORY TEST-POWER LAW STEADY TEST
HERSCHEL-BULKLEY MODEL
G´ G´´
FORMULATION TIME
(days) a b c d (Pa) k n
η (Pa·s)
(γ=50 s-1)
C
1 1036±194cd 0.14±0.01b 241.4±30.3bc 0.09±0.04ab 142.69±13.02ab 26±3a 0.343±0.002c 1.43±0.13a
90 1088±187cd 0.11±0.01a 238±46bc 0.015±0.001a 156.4±3.4ab 27.3±0.3a 0.336±0.002c 1.564±0.034a
180 943±2c 0.19±0.01c 216±51bc 0.21±0.01b 155.8±6.2ab 26.7±1.5a 0.336±0,004c 1.558±0.062a
360 935±24c 0.100±0.002a 200±10bc 0.015±0.002a 153.91±5.53ab 26.6±1.4a 0.333±0.003c 1.5±0.1a
D
1 265±26a 0.21±0.01c 75±7a 0.278±0.002b 135.99±11.64a 29.2±2.7a 0.296±0.004b 1.35±0.12a
90 234±18a 0.20±0.02c 52±8a 0.36±0.04c 168.56±60.34b 41.3±9.6b 0.251±0.032a 1.686±0.603a
180 200±2a 0.22±0.01c 40±43a 0.4±0.2c 145±25a 33.93±2.54b 0.271±0.031b 1.45±0.25a
360 190±1a 0.22±0.01c 40±43a 0.4±0.2c 143±13a 33.91±2.52b 0.27±0.03b 1.430±0.132a
COMMERCIAL ---- 2585±1049 0.17±0.03 713±293 0.391±0.431 565.5±376.4 293±158 0.050±0.044 5.655±3.764
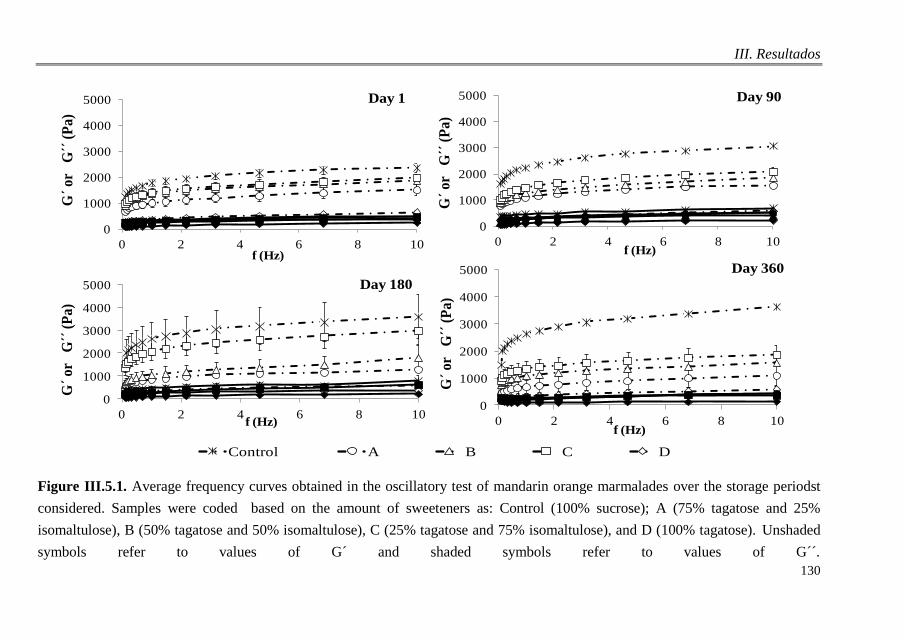
III. Resultados
130
Figure III.5.1. Average frequency curves obtained in the oscillatory test of mandarin orange marmalades over the storage periodst
considered. Samples were coded based on the amount of sweeteners as: Control (100% sucrose); A (75% tagatose and 25%
isomaltulose), B (50% tagatose and 50% isomaltulose), C (25% tagatose and 75% isomaltulose), and D (100% tagatose). Unshaded
symbols refer to values of G´ and shaded symbols refer to values of G´´.
0
1000
2000
3000
4000
5000
0 2 4 6 8 10
G
or
G
(Pa
)
f (Hz)
Day 90
0
1000
2000
3000
4000
5000
0 2 4 6 8 10
G
or
G
(Pa
)
f (Hz)
Day 1
0
1000
2000
3000
4000
5000
0 2 4 6 8 10
G
or
G
(P
a)
f (Hz)
Day 180
0
1000
2000
3000
4000
5000
0 2 4 6 8 10
G
or
G
(Pa
)f (Hz)
Day 360
0
500
1000
1500
2000
2500
3000
3500
4000
0 1 2 3 4 5 6 7 8 9 10
G
or
G
(Pa)
f (Hz)
360 Days
Control A B C D

III. Resultados
131
Consistent with the evolution of G’ curves over time, the a parameter
significantly decreased over time only in formulation B, i.e. after 360 days of
storage, whereas there was an increase in the control marmalades after 180
days of storage. In terms of parameter b of the power-law of G’, marmalade
D again differed from the other formulation, but in this case, it showed a
higher value. Initially no differences were found among the other
formulations.
However there was a significant decrease in formulations A and C after
360 days of storage, with an abrupt fall in the curves shown in Figure 1. In
the case of the c and d parameters of G” modulus for power-law, the trends
shown were similar to those of thea and b parameters but with less marked
differences. Peinado and others (2012) observed that replacing sucrose with
isomaltulose in the formulation of different strawberry spreadable products
resulted in a decrease in parameters a and c of the power-law model, but
parameters b and d were similar in all marmalades. Based on these results
the combination of the new sweeteners leads to formulations with less elastic
character in comparison to the control marmalade.
On the other hand, the results obtained for the stationary test of mandarin
orange marmalades based on the combination of sweeteners used and the
storage time, are presented in Figure 2. The rheograms of mandarin orange
marmalades for samples formulated with the new sweeteners were below the
control samples, but there were only slight differences between them.
Moreover, the storage time curves of the control marmalades remained
similar but the curves of the new marmalades decreased. The parameters of
the Herschel-Bulkley model for the mandarin orange marmalades studied
over the period considered are shown in Table 1. Despite the evolution of the
curves of the new orange marmalades mentioned above, the parameters of
the Herschel-Bulkley model did not differ statistically over time.
Nevertheless, the yield stress above which the fluid starts flowing (0) and
the index of consistency (k) were the lowest in formulation C, but the index
of fluidity (n) was the highest in this formulation.

III. Resultados
132
Figure III.5.2.Mean flow curves (rheograms) obtained from the steady assay of mandarin orange marmalades over the storage
period considered. Samples were coded based on the amount of sweeteners as: Control (100% sucrose); A (75% tagatose and 25%
isomaltulose), B (50% tagatose and 50% isomaltulose), C (25% tagatose and 75% isomaltulose), and D (100% tagatose).
0
50
100
150
200
250
0 20 40 60 80 100
τ(P
a)
γ (s-1)
Day 1
0
50
100
150
200
0 20 40 60 80 100
τ(P
a)
γ (s-1)
Day 1
CONTROL A B C D
0
50
100
150
200
250
0 20 40 60 80 100
τ(P
a)
γ (s-1)
Day 90
0
50
100
150
200
250
0 20 40 60 80 100
τ(P
a)
γ (s-1)
Day 180
0
50
100
150
200
250
0 20 40 60 80 100
τ(P
a)
γ (s-1)
Day 360

III. Resultados
133
Since formulation C had the greatest amount of isomaltulose, it can be
concluded that this sweetener was responsible for the above described
behavior. In the other cases, marmalades also showed values of 0 and k
which were lower than in the control samples but to a lesser extent than in
formulation C.
These results were consistent with those obtained by Peinado and others
(2012) in jam prepared with osmodehydrated strawberry using isomaltulose as
an osmotic agent, who observed a decrease in the consistency and
cohesiveness of these jams with respect to those prepared with sucrose. When
considering other combinations of sweeteners in our studies on orange
marmalade (Rubio-Arraez and others 2015), a blend of oligofructose and
tagatose in the same proportions increased the consistency of marmalades
during storage. Therefore, it can be concluded that sweeteners with a high
amount of fiber (long chain of monosaccharides) would modify the
rheological behavior of marmalades (in the stationary test) over time, whereas
mixtures of sweeteners with short molecules (isomaltulose and tagatose)
would give rise to more stable marmalades from a rheological point of view.
Optical Properties
Interaction charts of the colorimetric coordinates L*, a* and b*, chroma
(C*=(a*2+b*2)1/2) and hue (h*=arctg(b*/a*)) of the different mandarin orange
marmalades studied over one year of storage are shown in Figure 3.
According to these results, marmalade D (with the highest content of tagatose)
had the highest luminosity throughout the entire storage time. This
formulation was followed by sample B (equal proportions of isomaltulose and
tagatose), whereas marmalades A, C and control were initially very similar.
During storage, luminosity decreased for all combinations studied.

III. Resultados
134
Figure III.5.3. Interaction graphics (significant level of 95%) of colour
parameters: L*, a*, b* coordinates, chroma (C*) and hue (h*) of the different
formulations of mandarin orange over the storage period . Samples were
coded based on the amount of sweeteners as: Control (100% sucrose); A (75%
tagatose and 25% isomaltulose), B (50% tagatose and 50% isomaltulose), C
(25% tagatose and 75% isomaltulose), and D (100% tagatose).
Interactions and 95,0 Percent LSD Intervals
Time (Days)
9
11
13
15
17
19
21
a*
1 90 180 360
Formulation
Control
A
B
C
D
Interactions and 95,0 Percent LSD Intervals
Time (Days)
34
37
40
43
46
49
L*
1 90 180 360
Formulation
Control
A
B
C
D
Interactions and 95,0 Percent LSD Intervals
Time (Days)
34
37
40
43
46
49
L*
1 90 180 360
Formulation
Control
A
B
C
D
Interactions and 95,0 Percent LSD Intervals
Time (Days)
34
37
40
43
46
49
52
b*
1 90 180 360
Formulation
Control
A
B
C
D
Interactions and 95,0 Percent LSD Intervals
Time (Days)
36
39
42
45
48
51
54
C*
1 90 180 360
Formulation
Control
A
B
C
D
Interactions and 95,0 Percent LSD Intervals
Time (Days)
68
70
72
74
76
h*
1 90 180 360
Formulation
Control
A
B
C
D

III. Resultados
135
The control marmalade initially showed the highest value for coordinate
a*, but this value decreased after 90 days of storage. Furthermore, in the other
combinations, the coordinate a* increased during during the first 90 days of
storage rebut then remained constant. Marmalade D had the highest values for
coordinate b* and the chrome throughout the whole storage time, whereas
these values decreased in the control marmalade after 90 days of storage, as in
coordinate a*. In contrast, marmalades C, which had the highest amount of
isomaltulose, showed constant values for b* and C* over storage.
Therefore, it can be concluded that tagatose was responsible for the
changes registered in both parameters. As a consequence of the changes in a*
and b*, the initial hue of the new mandarin orange marmalades was higher
than in marmalades prepared with sucrose. Besides, the hue decreased during
the first 180 days of storage in the marmalades formulated with the new
sweeteners, especially for formulation A, unlike in the case of the control
marmalades. Noteworthy is that after 180 days, all marmalades showed
similar values of hue except for formulation A.
This pattern was also observed for the other colour parameters in all the
mandarin orange marmalades. After 6 months of storage the colour of these
marmalades was quite similar regardless of the differences registered before
that period. In our previous studies carried out on orange marmalade
formulated with different combinations of tagatose and oligofructose (Rubio-
Arraez and others 2015) it was observed that marmalades with the highest
content of tagatose showed a decrease in L* and an increase in a* and b*
coordinates after 45 days of storage. Peinado and others (2015) showed that
strawberry jams formulated with isomaltulose and different concentrations of
citric acid and pectin jams darkened during storage.

III. Resultados
136
Antioxidant Capacity
The results relating to the antioxidant activity of the mandarin orange
marmalades studied are shown in Figure 4. Initially all marmalades showed
the same antioxidant activity, but after 3 months of storage, antioxidant
activity increases in formulations with the highest content of tagatose.
However, no significant differences were found in the other formulations.
After 3 months of storage, the antioxidant activity of all marmalades
slightly reduced, but after one year values were similar to those initially
obtained, except in formulations with more tagatose, which again showed the
highest antioxidant activity. Consequently this new sweetener could enhance
the ability of the antioxidants of mandarin orange fruit to scavenger free
radicals.
Figure III.5.4. Interaction graphic (significant level of 95%) of antioxidant
activity of the different formulations of mandarin orange marmalade over the
storage period. Samples were coded based on the amount of sweetners as:
Control (100% sucrose); A (75% tagatose and 25% isomaltulose), B (50%
tagatose and 50% isomaltulose), C (25% tagatose and 75% isomaltulose), and
D (100% tagatose).
mg
tr
olo
x /
10
0 g
ma
rm
ala
de
Interactions and 95,0 Percent LSD Intervals
Time (Days)
24
34
44
54
64
1 90 180 360
Formulation
Control
A
B
C
D

III. Resultados
137
Besides, in orange marmalade (Rubio-Arraez and others 2015) with
sucrose or new sweeteners (tagatose and oligofructose) there was also an
increase in the antioxidant capacity after 45 days of storage, showing possible
combinations of components that would lead to the appearance of new
antioxidants. However, Rababah and others (2011), observed that the
antioxidant activity of orange marmalades prepared with sucrose decreased
significantly after 3 months of storage.
Microbiological Analysis
All mandarin orange marmalades were safe from a microbiological point of
view since no colonies of moulds and yeast or mesophillic aerobics were
found in any of the marmalades studied over the storage period considered.
Sensory Analysis
The results of the sensory analysis of the mandarin orange marmalades
formulated with sucrose or new sweeteners are shown in Figure 5. No
significant differences were detected in the attributes of colour, aroma,
texture, consistency and spreadable capacity.However, the marmalade
prepared by replacing sucrose with tagatose alone (formulation D) obtained
the best scores for palatability, flavour, global preference and intention of
buying. Besides, no significant differences in sweetness were found in
formulation D as compared to the control marmalade. Conversely, marmalade
with more isomaltulose (formulation C) obtained the lowest scores for
sweetness, palatability and flavour, probably due to the low sweetening power
of this sugar (Lina and others 2002).
In the case of orange marmalades (Rubio-Arraez and others 2015), those
prepared with the new healthy sweeteners (tagatose and oligofructose) scored
better than marmalade prepared with sucrose. Therefore, mandarin orange
seems to be more sensitive to the different combinations of sweeteners than
orange or otherwise, the combination of tagatose and isomaltulose leads to
greater differences in the sensorial analysis of marmalades than the
combination of tagatose and oligofructose.
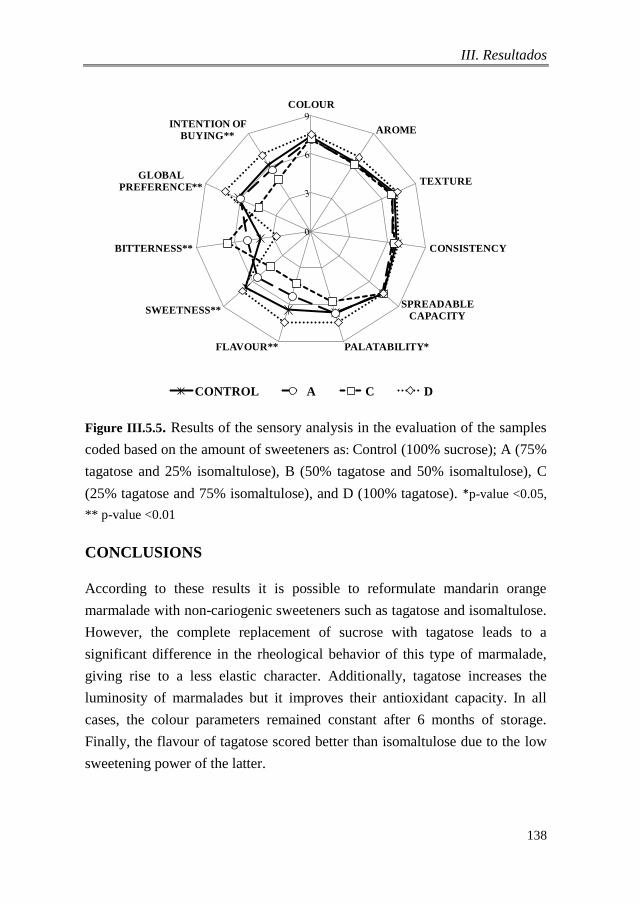
III. Resultados
138
Figure III.5.5. Results of the sensory analysis in the evaluation of the samples
coded based on the amount of sweeteners as: Control (100% sucrose); A (75%
tagatose and 25% isomaltulose), B (50% tagatose and 50% isomaltulose), C
(25% tagatose and 75% isomaltulose), and D (100% tagatose). *p-value <0.05,
** p-value <0.01
CONCLUSIONS
According to these results it is possible to reformulate mandarin orange
marmalade with non-cariogenic sweeteners such as tagatose and isomaltulose.
However, the complete replacement of sucrose with tagatose leads to a
significant difference in the rheological behavior of this type of marmalade,
giving rise to a less elastic character. Additionally, tagatose increases the
luminosity of marmalades but it improves their antioxidant capacity. In all
cases, the colour parameters remained constant after 6 months of storage.
Finally, the flavour of tagatose scored better than isomaltulose due to the low
sweetening power of the latter.
COLOUR
AROME
TEXTURE
CONSISTENCY
SPREADABLE
CAPACITY
PALATABILITY*FLAVOUR**
SWEETNESS**
BITTERNESS**
GLOBAL
PREFERENCE**
INTENTION OF
BUYING**
CONTROL A C D

III. Resultados
139
ACKNOWLEDGEMENT
The authors would like to thank the Serigó-Andrés family for donating the raw
material and the projects GV/2013/029, GV/2014/012 by the GVA as well as
the Universitat Politècnica de València for the financial support given to this
investigation (UPV PAID-06-12 SP20120889).
REFERENCES
Basu S, Shivhare US, Singh TV, Beniwal VS. 2011. Rheological, textural and
spectral characteristics of sorbitol substituted mango jam. J. Food Eng
105(3):503–512.
Brand-Williams W, Cuvelier ME, Berset C. 1995. Use of a free-radical
method to evaluate antioxidant activity. LWT – Food Sci Technol
28(1):25–30.
Balasundram N, Sundram K, Samman S. 2006. Phenolic compounds in plants
and agri-industrial by-products: antioxidant activity, occurrence, and
potential uses. Food Chem 99:191−203.
Calzada-León R, Ruiz-Reyes ML, Altamirano-Bustamante N, Martínez, M.M.
2013. Features of the noncaloric sweeteners and their use in children. Acta
Pediátrica México 34(3):141–153.
Dervisi P, Lamb J, Zabetakis I. 2001. High pressure processing in jam
manufacture: effects on textural and colour properties. Food Chem
73(1):85–91.
De Oliva-Neto P, Menão PTP. 2009. Isomaltulose production from sucrose by
Protaminobacter rubrum immobilized in calcium alginate. Bioresource
Techn 100:252–4256.
Dhuique-Mayer C, Caris-Veyrat C, Ollitrault P, Curk F, Amiot MJ. 2005.
Varietal and interspecific influence on micronutrient contents in citrus
from the Mediterranean area. J Agric Food Chem 53:2140−2145.
Donner T.W, Magder LS, Zarbalian K. 2010. Dietary supplementation with
D-tagatose in subjects with type 2 diabetes leads to weight loss and raises
high-density lipoprotein cholesterol. Nutrition Res 30:801–806.

III. Resultados
140
Edwards WP. 2002. The science of goodies. Acribia. S.A. Zaragoza. Spain.
Gorinstein S, Martín-Belloso O, Park YS, Haruenkit R, Lojek A, Ĉíž M, Caspi
A, Libman I, Trakhtenberg S. 2001. Comparison of some biochemical
characteristics of different citrus fruits. Food Chem 74:309−315.
ISO 4121. 2003. Sensory analysis. Guidelines for the use of quantitative
response scales. International Organization for Standardization. Geneva,
Switzerland.
ISO 8589. 2007. Sensory analysis. General guidance for the design of test
rooms. International Organization for Standardization. Geneva,
Switzerland.
ISO 5492. 2008. Sensory analysis. Vocabulary. International Organization for
Standardization. Geneva, Switzerland.
Levin GV. 2002. Tagatose, the new GRAS sweetener and health product. J.
Med. Food 5(1):23–36.
Lina BAR, Jonker G, Kozianowski G. 2002. Isomaltulose (Palatinose review
of biological and toxicological studies). Food Chem Toxic
40(10):1375–1381.
Lu Y, Levin GV, Donner TW. 2008. Tagatose, a new antidiabetic and obesity
control drug. Diabetes, Obesity Metabolism 10(2):109–134.
Oh DK. 2007. Tagatose: properties, applications, and biotechnological
processes. Applied Microb Biotech 76(1):1– 8.
O’Donnell K, Kearsley MW. 2012. Sweeteners and Sugar Alternatives in
Food Technology. Wiley-Blackwell, New Jersey, USA.
Peinado I, Rosa E, Heredia A, Andrés A. 2012. Rheological characteristics of
healthy sugar substituted spreadable strawberry product. J. Food Eng
113(3):365–373.
Periche A, Heredia A, Escriche I, Andrés A, Castelló ML. 2014. Optical,
mechanical and sensory properties of based-isomaltulose gummy
confections. Food Biosc 7:37–44.
Petersen-Skytte U. 2006. Tagatose. In: Sweeteners and sugar alternatives in
food technology (Mitchell, H., ed.) pp. 262–292, Blackwell Publishing,
Oxford, UK.

III. Resultados
141
Rababah TM, Al-Mahasneh MA, Kilani I, Yang W, Alhamad MN, Ereifeja E,
Al-U’datta M. 2011. Effect of jam processing and storage on total
phenolics, antioxidant activity, and anthocyanins of different fruits. J Sci
Food Agric 91(6):1096 –1102.
Rubio-Arraez S, Sahuquillo S, Capella JV, Ortolá MD, Castelló ML. 2015.
Influence of healthy sweeteners (tagatose and oligofructose) on the
physicochemical characteristics of orange marmalade. J Text Stud 46(4):
272-280.
Schiweck H, Munir M, Rapp K, Schenider B, Bogel M. 1990. New
developments in the use of sucrose as an industrial bulk chemical.
Zuckerindustrie 115:555–565.
Shahidi F, Liyana-Pathirana CM, Wall DS. 2006. Antioxidant activity of
white and black sesame seeds and their hull fractions. Food Chem
99(3):478–483.
Skelland AHP. 1967. Non-Newtonian Flow and Heat Transfer. John Wiley
and Sons Inc. New York, USA.
Subramanian R, Muthukumarappan K, Gunasekaran S. 2006. Linear
viscoelastic properties of regular and reduced fat pasteurized process
cheese during heating and cooling. Int J Food Prop 9(3):377–393.
Taylor TP, Fasina O, Bell LN. 2008. Physical properties and consumer liking
of cookies prepared by replacing sucrose with tagatose. J Food Sci
73(3):145–151.
Vastenavond CM, Bertelsen H, Hansen SJ, Laursen R.S, Saunders J,
Eriknauer K. 2012. Tagatose (D-tagatose). In: Alternative sweeteners
(Nabors, LO, ed) 13, pp 197–222 Marcel Dekker, New York, USA.
World Health Organization (Who). 2014. Sugar Guideline. Available
from:<http://www.who.int/mediacentre/news/notes/2014/consultation-
sugar-guideline/es>. Accessed 2015 April 20.


III.6. RELIABLE TRACEABILITY BASED ON
WIRELESS SENSOR NETWORKS APPLIED
TO A NEW MANDARIN ORANGE
MARMALADE FORMULATION
Susana Rubio-Arraez1, Juan Vicente Capella2,
María Dolores Ortolá1 and María Luisa Castelló1,
1Institute of Food Engineering for Development and 2Institute ITACA (ICT Technologies),
Universitat Politècnica de València,
Camino de Vera, s/n. 46022, Valencia, Spain
Food Control
FOODCONT-D-15-01332
(En Revisores)


III. Resultados
142
ABSTRACT
This work presents a study and application of the Wireless Sensor
Networks (WSN) paradigm to food traceability systems. In this line, an
advanced monitoring of stored mandarin orange marmalades applying a robust
WSN architecture called EDETA (Energy-efficient aDaptative hiErarchical
and robusT Architecture) is proposed. The properties of this proposal allow
guaranteeing the optimum conditions of these marmalades for human
consumption. Furthermore, to apply and demonstrate the features of this
approach, in this paper the development of mandarin orange marmalades
using non cariogenic and low glycemic index sweeteners, such as tagatose and
isomaltulose, instead of sucrose in the formulation is proposed. Temperature,
moisture content, pH, solid soluble content, water activity and microbiological
analyses have been carried out initially and after 90,180 and 360 days of
marmalades storage.
The results showed that marmalade B (equal proportion of tagatose and
isomaltulose) presented the lowest scores, over storage time. Regarding
temperature, the new marmalades and control showed the same trend over
storage time. Besides, all marmalades were microbiologically stable.
Furthermore, the proposed WSN approach has been applied to this new
marmalade to test their suitability, obtaining excellent results about accuracy,
reliability and energy consumption. Also, applying this approach new features
are obtained, such as the possibility of continuous monitoring in an automatic
manner along the time or automatic and complete analysis of the monitored
data.
Keywords: Marmalades, sweeteners, Wirelesss Sensor Networks, robust
traceability advanced monitoring.

III. Resultados
143
INTRODUCTION
Traceability is the most important instrument to ensure the quality and food
safety in the food industry. The Food and Agriculture Organization of the
United Nations (FAO, 2003), the World Health Organization (FAO & WHO,
2003), the Codex Alimentarius Commission (CAC, 2003,2005), and the
International Organization for Standardization (ISO, 2005,2007) characterized
by the development of international standards and guidelines for food
traceability in the food industry (Petersen, 2004). Concretely, the CAC
recommended Hazard Analysis Critical Control Point (HACCP) as the most
effective system to guarantee the safe food supply (Beulens et al., 2005).
According to ISO guidelines, ISO 22000 (2005) includes analyzing methods
of food hazards from HACCP and the approach of the management system
from ISO 9001, in order to guarantee the safety food until human consumption
(FMRIC, 2008). Furthermore, ISO 22005 (2007) defined the principles and
objectives of traceability for the design and implementation of a feed and food
traceability system. Additionally, there are other private food quality and
safety standards such as International Standard for Auditing Food Suppliers
(IFS), Eurep-GAP, Safe Quality Food (SQF), and the British Retail
Consortium (BRC), etc.
In recent decades a spectacular growth of computer networks and wireless
communications, promoted by continuous technological advances have been
achieved. Therefore, have appeared increasingly small, powerful and less
expensive electronic circuits, also allowing important advances in the field of
transducers. All this allows the development of new devices for detection and
measurement of any magnitude in a simple way and with great accuracy, all
with a small size and low cost. The possibility to implement this low-cost
devices and without maintenance, offers the opportunity to obtain information
from the environment and forward it wirelessly to coordination center (sink)
extending the range of applications to an unimaginable spectrum (Capella et
al., 2014). In this line, we propose the application of WSN paradigm with a
specific architecture to food monitoring in order to guarantee the quality
attributes of obtained food products in the food chain.
III. Resultados
144
In the bibliography, there are studies such as Jedermann et al. (2006),
proposing a system for fruit logistics. Moreover, Zhang et al., (2009)
developed a temperature-managed traceability system for frozen and chilled
food. All these proposals do not pay attention to energy consumption, system
durability or cost of the monitoring nodes.
Furthermore, in stored food sector, it is necessary to perform an exhaustive
and robust monitoring of the elaboration and conservation, in order to
guarantee delivery the product in perfect conditions for human consumption.
For all these reasons in this work we propose the application of EDETA
architecture that provides reliability and energy efficiency to the system. This
allows the development of new systems for detection and measurement of any
magnitude in a simple way and with great accuracy, all with a small size and
low cost (Capella et al., 2014).
On the other hand, owing to the current lifestyle of society, there is an
increasing demand for healthy food products such as fruits. Spain is one of the
major producers and exporters of various kinds of citrus fruits as mandarin
orange (Citrus reticulata). Therefore, its consumption as fresh fruit,
marmalades or juice due to its higher content of phenolics, dietary fibre,
ascorbic acid and trace elements that can prevent diseases mainly of its
antioxidant activity (Dhuique-Mayer et al., 2005; Balasundram et al.,2006;
Rubio-Arraez et al., 2015a, 2015b) Traditionally, the marmalade was prepared
with sucrose, however, it shows a great calorie contribution in addition to high
glycemic index and their excessive consumption can cause several diseases
such as obesity, diabetes and tooth decay (Edwards, 2002; O'Donnell and
Kearsley, 2012; WHO, 2014). Currently, food industry present other naturally
sweeteners as tagatose and isomaltulose. There are non-cariogenic sweeteners
that are slowly released into blood.
Firstly, D-Tagatose (D-tag) it is a stereoisomer of D-galactose, it is found
in yoghurt and cheese, (Oh, 2007; Lu et al., 2008). Additionally, it has only
1.5 kcal/g (Levin, 2002), beside its texture is very similar than sucrose and it
is almost as sweet as sucrose (Oh, 2007; Taylor et al., 2008; Calzada-León et

III. Resultados
145
al., 2013). In fact, it is considered a functional food (Taylor et al., 2008)
favoring Lactobacillus bacteria (Petersen-Skytte, 2006).
Secondly, isomaltulose is a reducing disaccharide which is present in sugar
cane juice and honey, and its appearance, taste viscosities of aqueous solutions
and caloric power are similar to sucrose (Schiweck et al., 1990; Periche et al.,
2014). Furthermore, isomaltulose has a third of the sweetening power of
sucrose and its physicochemical properties permit the substitution of sucrose
in most sweet foods (Lina et al., 2002; De Oliva-Neto and Menão, 2009;
Peinado et al., 2013).
In summary, the principal aim was established a traceability food system
according to the robust design of WSN directed by the EDETA architecture,
to be applied to the advanced monitoring of food products such as mandarine
orange marmalades, along all their storage time, and even from mobile
devices. The secondly aim, in accordance with the properties of new
sweeteners, was to evaluate the potential use of them as an alternative to
sucrose in the development of mandarin orange marmalades.
MATERIALS AND METHODS
Components and formulation of mandarin orange marmalades
Marmalades were produced using 50% mandarin orange pulp (Citrus
reticulata Clemenules), 50% sucrose (Azucarera Iberia S.L., Madrid, Spain) or
sweeteners (isomaltulose or tagatose) containing 1% agar-agar (Roko Agar,
Asturias, Spain), Tagatose (Tagatesse, Heusden-Holder, Belgium),
Isomaltulose (Beneo, Mannheim, Germany). Samples were coded depending
on the combination of sweeteners used: Control marmalade: 100% sucrose,
Marmalade A: 75% tagatose and 25% isomaltulose, Marmalade B: 50%
tagatose and 50% isomaltulose, Marmalade C: 25% tagatose and 75%
isomaltulose and Marmalade C: 100 % tagatose. We also characterized
commercial mandarin orange marmalade.

III. Resultados
146
Manufacturing process
Three batches of mandarin oranges were selected and collected directly
from the field. Afterward, they were peeled and mixed with the corresponding
combination of healthy sweeteners/sucrose and the agar-agar in a thermal
blender (Thermomix, TM31, Vorwerk, Wuppertal, Germany) for 3 min. Then,
the mixture was cooked at 100 ºC for 20 min at 350 rpm. After that, glass jars
previously sterilized in an autoclave at 121ºC for 15 min, were filled with the
marmalade and turned over to ensure proper sealing for 1 hour. At last, the
marmalade was allowed to cool for 24 hours and in that time jellification took
place as can be seen in Figure 1.
Figure III.6.1. Flow chart of the manufacturing process of mandarin orange
marmalade.
FILLING
COOLING AND
GELLIFICATION
MANDARIN ORANGE
MARMALADES
STORAGE
FRESH
FRUITS
SELECTION
PEELING
MIXING
SUCROSE
TAGATOSE
ISOMALTULOSE
AGAR-AGAR
HEATING
100ºC – 40 min
350 rpmPOTS
STERILIZATION
121º - 15 min
ROBUST
REAL TIME
MONITORING
MARMALADE
WIRELESS
SENSOR

III. Resultados
147
WSN monitoring process by EDETA architecture
Once concluded the elaboration and packaging process, continuous
monitoring during all storage (360 days), by means of sensor nodes located in
the top of the packages must be realized.
The sensor nodes are composed by these pieces (Fig.2A): First the
microcontroller, that is a computer on a chip. In this work an ARM Cortex-M4
microprocessor (SMT32F4, STMicroelectronics, Geneva, Switzerland) have
been selected. Second the wireless communication network, in order to
provide the communication service, being selected a short range technology,
due to the energy restrictions. Thirdly, autonomous power energy, based on a
small size battery. Finally, the sensors or transducers, which allow the node to
obtain data from the process for their later processing and transmission. A
Sensirion temperature /humidity sensor (SH1, Sensirion AG, Staefa, ZH,
Switzerland) have been used.
On the other hand, a high power microcontroller system or even a
computer normally constitutes the gateway node. This special node is the
destination of the information obtained by all the sensors and it is in charge of
managing the whole WSN. In addition, it is also involved in the data
evaluation, be it for the detection of alarm situations, generating the
corresponding warnings or for performing fault-tolerance actions, for instance,
to discard erroneous measurements, or even ask for their repetition (Bonastre
et al., 2012; Capella et al., 2014).
The main pieces of the sink nodes are show in Fig.2B: on one hand a WSN
communication interface, compatible with the one utilized by the sensor
nodes. LAN (Local Area Network)/WAN (Wide Area Network) interface, by
means of which the gateway node is able to provide the users with the
information retrieved by the sensor nodes. On another hand a high power
microcontroller, that will be in charge of perform all the data management and
fault tolerance operations. And the last piece is the data storage system, that
will be in charge to guarantee the data and logs durability and persistence.

III. Resultados
148
In this manner, the operation consists on this procedure: the sensor nodes
collect the information (by means of the indicated transducers) and could be
periodically or when an event occurs (value change, threshold exceeded, alarm
activation, etc.). This information is sent to the gateway node using the
wireless network.
Figure III.6.2. A) Sensor Node structure and B) Sink Node structure.
In this stage, it is very important detect possible problems of conservation,
in order to guarantee traceability and delivery the product in optimum
conditions, being required the proposed features of robust and reliable WSN
monitoring. In the design of the sensor network have been considered, due to
its application to food monitoring, the following requirements: limited
resources, dynamic environments, use of unreliable transmission medium,
information privacy and safety food.
In this line, the European Regulations No 1935/2004 and No 450/2009
have been observed, about the material and articles intended to come into
contact with food.
Sensors Microcontroller
Autonomous power energy
WSN communications
A
WSN radio
Data storage Microcontroller
LAN / WANLAN/WAN
Microcontroller
WSN Radio
Data Storage
B

III. Resultados
149
Analytical determinations of temperature, moisture and soluble
solids content, pH and water activity
Furthermore, we registered by triplicate analyses the experimental values
in the laboratory on the first day of storage and after 90,180 and 360 days of
storage to corroborate the values obtained with WSN monitoring.
The marmalades were storage in dry ambient box. Temperature was
registered with a digital thermometer (Testo AG, Lenzkirch, Germany).
Moisture content (xw: g water/g marmalade) was determined gravimetrically
by drying approximately 1 g of marmalade to a constant weight in a vacuum
oven at 60ºC (method 934.06, AOAC 2000). Soluble solids content (Brix) was
determined in a refractometer at 20ºC (Atago 3T, Tokyo, Japan). The pH was
registered with a pH-meter (Seven Easy, Mettler Toledo, Barcelona, Spain)
previously calibrated with buffered solutions of pH 7.0 and 4.0. Water activity
(aw) was determined with a dew point water activity meter (Decagon Devices,
Inc., Pullman, Washington, USA), at 25ºC.
Microbiological Analysis
Serial dilutions were prepared by homogenising 10 g of marmalade with 90
mL of 1% sterile peptone water in a stomacher bag, using sterile techniques.
Mesophilic aerobic populations were analysed in Plate Count Agar (Scharlau
Chemie, 1-329, Barcelona, Spain) incubating samples for 72 hours at 31ºC.
Yeast and moulds were determined in Sabouraud Chloramphenicol Agar
(Scharlau Chemie, 1-166, Barcelona, Spain) plates for 5 days at 31ºC. Sample
for analysis were taken on days 1, 90, 180 and 360.
Statistical analysis
Statgraphics Centurion software (Statpoint Technologies, Inc., Warrenton,
Virginia, USA) was used to perform the statistical analyses. Analyses of
variance (multifactor ANOVA) were performed to study the interactions
between the formulation and time of storage factors on the marmalades.

III. Resultados
150
RESULTS AND DISCUSSION
WSN monitoring process by EDETA architecture
In order to provide traceability characteristics for safety and food quality
maintenance, an approach based on a WSN has been applied to obtain
information about the products during production and storage, in a real time
and reliable manner. This allows additionally ulterior data processing that can
provide extra-information unimaginable without these techniques. It is
remarkable that all this monitoring information and data analysis is offered
even from mobile devices (Fig. 3). Reliability it is very important in this
application, for this reason it is proposed a new version of the EDETA
architecture (Capella et al., 2009) with additional mechanisms to ensure
reliability, to discard erroneous measurements, or even ask for their repetition,
tolerate nodes and routes faults, among others. These features have been tested
by the monitorization platform for dependable WSN design, which has been
developed. On the other hand, the absence of wires makes the nodes depend
on their own energy resources; therefore, multi-hop routing mechanisms are
contemplated by EDETA to reduce energy consumption.
Figure III.6.3. Global WSN marmalade robust monitoring.
DATA
SYSTEM
INTERNET
GATEWAY
REMOTE
ACCESS
MARMALADE INTELLIGENT POTS

III. Resultados
151
Mandarin orange marmalades have been monitored by a WSN based on
EDETA architecture (Energy-efficient aDaptative hiErarchical and robusT
Architecture) during storage time measuring temperature and moisture content
as proof concept. The marmalades were storage in dry ambient box. Small and
low cost devices (sensor nodes) that are able to obtain information from the
process by means of transducers and transmit it towards a sink node using
wireless communications compose WSN´s. The node on a database stores this
information, where usually through the Internet it is available for its use, be it
in real time or for statistical analysis, even though mobile devices (Capella et
al., 2014). An advantage of WSNs consists of its easy deployment. The first
function of each sensor node is the automatic setting up of a multi-hop route to
the sink node. As an additional advantage, the same procedures needed in the
initial setting up may be used to find an alternative route in case of route
losses. The information gathered by the sink node is stored on a database, be it
local or remote, accessible through communication systems such as Internet,
and will allow the real time monitoring and later study of the process (Fig. 3)
(Bonastre et al., 2012, Capella et al., 2014).
Furthermore, Figure 4 shows the obtained results from this monitoring. As
expected, the temperature and moisture content data collected by the wireless
sensor network deployed for monitoring are fully consistent with the
analytical determinations, demonstrating that the WSN approach can be used
as traceability food system, that also offers extra-features as explained
previously.
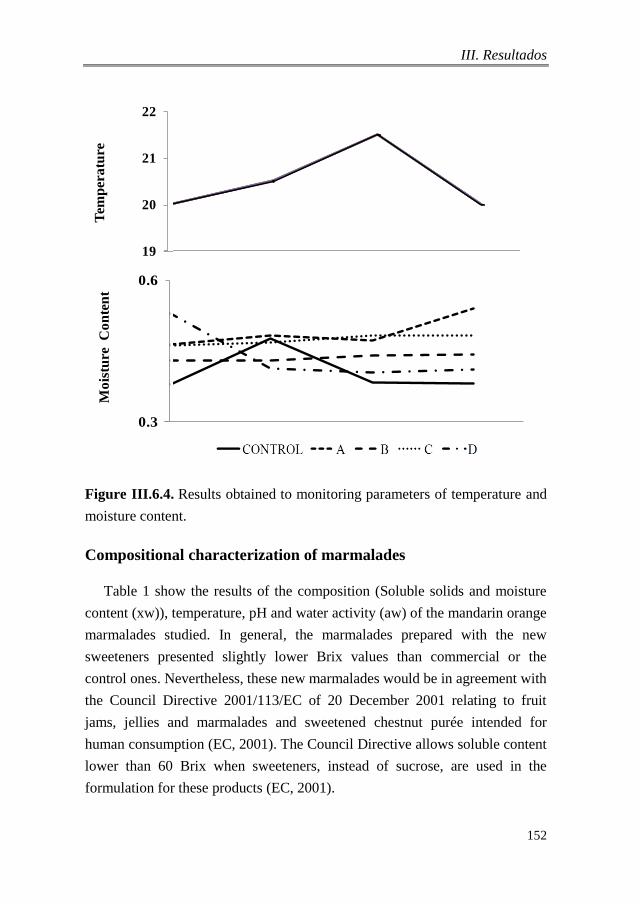
III. Resultados
152
Figure III.6.4. Results obtained to monitoring parameters of temperature and
moisture content.
Compositional characterization of marmalades
Table 1 show the results of the composition (Soluble solids and moisture
content (xw)), temperature, pH and water activity (aw) of the mandarin orange
marmalades studied. In general, the marmalades prepared with the new
sweeteners presented slightly lower Brix values than commercial or the
control ones. Nevertheless, these new marmalades would be in agreement with
the Council Directive 2001/113/EC of 20 December 2001 relating to fruit
jams, jellies and marmalades and sweetened chestnut purée intended for
human consumption (EC, 2001). The Council Directive allows soluble content
lower than 60 Brix when sweeteners, instead of sucrose, are used in the
formulation for these products (EC, 2001).
3.200
3.400
3.600
3.800
4.000
4.200
1 90 180 360
CONTROL A B C D
Tem
per
atu
re
19
20
21
22
1 90 180 360
CONTROL A B C D
0.3
0.6
1 90 180 360
CONTROL A B C D
Mo
istu
re C
on
ten
t
3.200
3.400
3.600
3.800
4.000
4.200
1 90 180 360
CONTROL A B C D
4.2
4.0
3.8
3.6
3.4
3.2
pH
3.200
3.400
3.600
3.800
4.000
4.200
1 90 180 360
CONTROL A B C D
Tem
per
atu
re
19
20
21
22
1 90 180 360
CONTROL A B C D
0.3
0.6
1 90 180 360
CONTROL A B C D
Mo
istu
re C
on
ten
t
3.200
3.400
3.600
3.800
4.000
4.200
1 90 180 360
CONTROL A B C D
4.2
4.0
3.8
3.6
3.4
3.2
pH
III. Resultados
153
Regarding moisture content (xw), marmalade D (100% tagatose), showed
the higher scores than commercial and control ones. In contrast, marmalade B
(equal proportion of tagatose and isomaltulose) had the lowest scores between
new marmalades, during storage time. In our previous studies (Rubio-Arraez,
et al., 2015a) in orange marmalades formulated with oligofructose and
tagatose as sweeteners instead sucrose, the marmalades with higher content of
tagatose showed the higher moisture content score, in coherence with these
results obtained in this work. However, the lowest water activity value was
registered for marmalade D, that containing only tagatose, with similar values
to the control and commercial marmalades.
Relating to temperature recorded, can mentioned that all samples presented
the regular fit over storage time. With regard to the pH, the new marmalades
showed higher values than the commercial marmalades, although, the
marmalade C (with higher content of isomaltulose) presented similar values to
the control. However, all pH values were less 4, which in principle would
ensure proper microbiological stability of these products. According to in the
same magnitude of order as the pH of other jams made using strawberry,
peach, plum and apricot (Carbonell et al., 1991; García-Martínez et al., 2002)
and orange marmalades (Rubio-Arraez, et al., 2015a).
Microbiological Analysis
There were no colonies of molds and yeast or aerobic mesophillic found in
any of the marmalades in this study during the storage period considered.
Therefore, in all cases the products were stable from a microbiological point
of view.

III. Resultados
154
Table III.6.1. Experimental values for moisture content (xw), storage temperature (C), pH, soluble solids content (Brix), and water
activity (aw) of mandarin orange marmalades over storage period. Also values of commercial mandarine marmalade.
FORMULATION TIME
(days)
xw
(g water/
g marmalade)
T (C) pH BRIX aw
CONTROL
1 0.4±0.1a 20±1a 3.62±0.03b 58.8±0.3d 0.897±0.003b
90 0.47±0.02b 20,5±1b 3.60±0.01b 59.7±0.6e 0.893±0.001b
180 0.4±0.1a 21,5±1c 3.55±0.04a 59.1±0.1e 0.891±0.001b
360 0.4±0.1a 20±1a 3.5±0.2a 59.0±0.1e 0.890±0.001b
A
1 0.462±0.001b 20±1a 3.95±0.01c 58.3±0.2d 0.916±0.001d
90 0.481±0.001b 20,5±1b 3.90±0.01c 58.4±0.2d 0.9184±0.0001d
180 0.5±0.1b 21,5±1c 3.86±0.03c 57.5±0.1c 0.923±0.001d
360 0.542±0.001c 20±1a 3.81±0.02c 57.1±0.1c 0.922±0.001d
B
1 0.43±0.04b 20±1a 3.98±0.01d 57.2±0.3b 0.907±0.001c
90 0.430±0.002b 20,5±1b 4.08±0.01d 57.2±0.1c 0.9076±0.0003c
180 0.440±0.002b 21,5±1c 4.04±0.01d 57.2±0.1c 0.9054±0.0003c
360 0.442±0.001b 20±1a 4.03±0.01d 57.1±0.1c 0.9013±0.0002c
Equal letters indicate homogeneous groups (= 95%)

III. Resultados
155
(Continuous) Table III.6.1. Experimental values for moisture content (xw), storage temperature (C), pH, soluble solids content
(Brix), and water activity (aw) of mandarin orange marmalades over storage period. Also values of commercial mandarine
marmalade.
FORMULATION TIME
(days)
xw
(g water/
g marmalade)
T (ºC) pH BRIX aw
C
1 0.46±0.01b 20±1a 3.63±0.01b 56.1±0.1b 0.9232±0.0011d
90 0.468±0.002b 20,5±1b 3.66±0.01b 56.6±0.2b 0.9175±0.0002d
180 0.483±0.002b 21,5±1c 3.66±0.01b 55.2±0.1a 0.926±0.001d
360 0.482±0.001b 20±1a 3.63±0.01b 55.3±0.1a 0.9238±0.0003d
D
1 0.53±0.02c 20±1a 3.41±0.01d 58.2±0.3d 0.885±0.001a
90 0.512±0.002ab 20,5±1b 3.92±0.01c 58.7±0.3d 0.888±0.001a
180 0.505±0.001ab 21,5±1c 4.01±0.02d 57.3±0.3c 0.889±0.001a
360 0.511±0.001ab 20±1a 3.99±0.01d 57.1±0.1c 0.889±0.001a
COMMERCIAL __ 0.47±0.24 20±1 3.16±0.01 61.2±0.3 0.8363±0.0003
Equal letters indicate homogeneous groups (= 95%)
III. Resultados
156
CONCLUSIONS
The wireless sensor networks based on EDETA robust architecture
demonstrate a great potential for marmalade quality monitoring, being a high
valuable tool for disciplines such as food processing. Also, the increasing
number of applications which may need new sensors with the required
characteristics to ensure food quality, open a promising research field, where a
considerable growth in the near future is to be foreseen. The proposal meets
the required characteristics of flexibility, scalability, dependability and easy
installation and operation, also provides a perfect adaptation to the necessities
of this type of food monitoring applications.
On the other hand, the reformulation of mandarin orange marmalade with
non-cariogenic sweeteners such as tagatose and isomaltulose is feasible.
Concerning moisture content, the marmalades formulated in equal proportion
of tagatose and isomaltulose, presented similar values than commercial or
control marmalades, over storage time. Furthermore, all marmalades
elaborated for this study presented the regular fit temperature over storage
time. Moreover, all of them reported microbiological stability during the
storage period considered. As a general conclusion, can be stated that a new
formulation of mandarin orange marmalade has been demonstrated as a good
product satisfying all required characteristics and that an approach for real
time and robust monitoring using WSN based on a new version of EDETA
architecture has been successfully applied for the traceability of the mandarin
orange marmalade.
ACKNOWLEDGEMENTS
The authors gratefully acknowledge the financial support from the
Valencian Regional Government under Research Project GV/2014/012,
Polytechnic University of Valencia (Research Project UPV PAID-06-12
SP20120889).

III. Resultados
157
REFERENCES
AOAC. 2000. Official Methods of Analysis of AOAC International, 17th
edition. Gaithersburg, MD, USA.
Balasundram, N., Sundram, K., & Samman, S. (2006). Phenolic compounds in
plants and agri-industrial by-products: antioxidant activity, occurrence, and
potential uses. Food Chemistry, 99, 191−203.
Beulens, A. J. M., Broens, D. F., Folstar, P., & Hofstede, G. J. (2005). Food
safety and transparency in food chains and networks. Food Control, 16(6),
481–486.
Bonastre, A., Capella, J.V., Ors, R., & Peris, M. (2012). In-line monitoring of
chemical analysis processes using Wireless Sensor Networks. TRAC -
Trends in Analytical Chemistry, 34, 111-125.
CAC. (2003). Basic texts on food hygiene, 3rd edition. Codex Alimentarious
Comission. Retrieved from http://www.fao.org/docrep/006/y5307e/
y5307e00.HTM (Accessed 01.06.15).
CAC.(2005). Codex procedural manual, 15th edition Retrieved from
ftp://ftp.fao.org/codex/Publications/ProcManuals/Manual_15e.pdf
(Accessed 01.06.15).
Capella, J.V., Bonastre, A., Ors, R., & Climent, S. (2009). A new energy-
efficient, scalable and robust architecture for wireless sensor networks.
IEEE/IFIP International Workshop on Wireless Sensor Networks: theory
and practice, El Cairo, Egypt, 2009, 42-47.
Capella, J.V., Bonastre, A., Ors, R., & Peris, M. (2014). A step forward in the
in-line river monitoring of nitrate by means of a wireless sensor network.
Sensors and Actuators B-Chemical, 195, 396– 403.
EC. (2001). Council Directive 2001/113/EC of 20 December 2001 relating to
fruit jams, jellies and marmalades and sweetened chestnut purée intended
for human consumption. Official Journal of the European Communities,
L 10, 67–72.
De Oliva-Neto, P., & Menão, P.T.P. (2009). Isomaltulose production from
sucrose by Protaminobacter rubrum immobilized in calcium alginate.
Bioresource Technology, 100, 252–4256.

III. Resultados
158
Calzada-León, R., Ruiz-Reyes, M.L., Altamirano-Bustamante, N., &
Martínez, M.M. (2013). Features of the noncaloric sweeteners and their use
in children. Acta Pediátrica Méxicana, 34(3), 141–153.
Carbonell, E., Costell, E., & Duran, L. (1991). Caracterización del flujo de
mermeladas comerciales españolas. Revista de Agroquímica y Tecnología
de Alimentos, 31(2), 227–235.
Dhuique-Mayer, C., Caris-Veyrat, C., Ollitrault, P., Curk, F., & Amiot, M. J.
(2005). Varietal and interspecific influence on micronutrient contents in
citrus from the Mediterranean area. Journal of Agricultural and Food
Chemistry, 53, 2140−2145
Edwards, W.P. (2002). The science of goodies. Acribia. S.A., Zaragoza. Spain.
EC. (2004). Regulation (EC) No 1935/2004 of the European Parliament and of
The Council of 27 October 2004 on materials and articles intended to come
into contact with food and repealing Directives 80/590/EEC and
89/109/EEC. Official Journal of the European Community, L338, 4-18.
EC. (2009). Commission Regulation (EC) No 450/2009 of 29 May 2009 on
active and intelligent materials and articles intended to come into contact
with food. Official Journal of the European Community, L135, 3-9.
EC. (2001). Council Directive 2001/113/EC of 20 December 2001 relating to
fruit jams, jellies and marmalades and sweetened chestnut purée intended
for human consumption. Official Journal European Community, L010, 67-
72.
FAO. (2003). FAO’s strategy for a food chain approach to food safety and
quality: A framework document for the development of future strategic
direction. Retrieved from http://www.fao.org/DOCREP/MEETING/
006/y8350e.HTM (Accessed 01.06.15).
FAO & WHO. (2003). Assuring food safety and quality: Guideline for
strengthening national food control system. Joint FAO/WHO Publication.
Retrieved from www.who.int/foodsafety/.../Englsih_Guidelines_Food_
control.pdf (Accessed 01.06.15).
FMRIC. (2008). Handbook for introduction of food traceability systems (2nd
ed.). Food Marketing Research and Information Center. Tokyo, Japan.

III. Resultados
159
García-Martínez, E., Ruiz-Diaz, G., Martínez-Monzó, J., Camacho, M.M.,
Martínez-Navarrete, N., & Chiralt, A. (2002). Jam manufacture with
osmodehydrated fruit. Food Research International, 35, 301–306.
ISO 9001. (2000). ISO 9001 e What does it mean in the supply chain?.
Retrieved from http://www.iso.org/iso/9001supchain (Accessed 01.06.15).
ISO 22000. (2005). Retrieved from http://www.iso.org/iso/catalogue _detail?
csnumber¼35466 (Accessed 01.06.15).
ISO 22005. (2007). Retrieved from http://www.iso.org/iso/catalogue_ detail?
csnumber¼36297 (Accessed 01.06.15).
Jedermann, R., Behrens, C., Westphal, D., & Lang, W. (2006). Applying
autonomous sensor systems in logisticsdcombining sensor networks,
RFIDs and software agents. Sensors and Actuators A: Physical, 132(1),
370–375.
Levin, G.V. (2002). Tagatose, the new GRAS sweetener and health product.
Journal. Medicine Food, 5(1), 23–36.
Lina, B.A.R., Jonker, G., & Kozianowski, G. (2002). Isomaltulose (Palatinose
review of biological and toxicologycal studies). Food and Chemical
Toxicology, 40 (10), 1375–1381.
Lu, Y., Levin, G.V., & Donner, T.W. (2008). Tagatose, a new antidiabetic and
obesity control drug. Diabetes, Obesity and Metabolism, 10(2), 109–134.
Oh, D.K. (2007). Tagatose: properties, applications, and biotechnological
processes. Applied Microbiology and Biotechnology, 76(1), 1–8.
O’donnell, K. & Kearsley, M.W. (2012). Sweeteners and Sugar Alternatives
in Food Technology. Wiley-Blackwell, New Jersey, USA.
Peinado, I., Rosa, E., Heredia, A., & Andrés, A. (2012). Rheological
characteristics of healthy sugar substituted spreadable strawberry product.
Journal Food Engineering 113(3), 365–373.
Periche, A., Heredia, A., Escriche, I., Andrés, A., & Castelló, M.L. (2014).
Optical, mechanical and sensory properties of based-isomaltulose gummy
confections. Food Bioscience, 7, 37–44.
Petersen, A. (2004). Status of food traceability in the European Union (EU)
and United States of America (US), with special emphasis on seafood and
fishery products. Masters’ Assignment. Denmark: Danish Technical
University.

III. Resultados
160
Petersen-Skytte, U. (2006). Tagatose. In: Sweeteners and sugar alternatives in
food technology (Mitchell, H., ed.) pp. 262–292, Blackwell Publishing ,
Oxford, UK.
Rubio-Arraez, S., Sahuquillo, S., Capella, J.V., Ortolá, M.D., & Castelló,
M.L. (2015a). Influence of healthy sweeteners (tagatose and
oligofructose) on the physicochemical characteristics of orange
marmalade. Journal of texture studies, 46 (4), 272-280.
Rubio-Arraez, S., Capella, J.V., Ortolá, M.D., & Castelló, M.L. (2015b).
Modelling Osmotic dehydration of lemon slices using new sweeteners.
International Journal of Food Science and Technology. In Press,
doi:10.1111/ijfs.12859.
Schiweck, H., Munir, M., Rapp, K.M., Schenider, B. & Bogel, M. (1990).
New developments in the use of sucrose as an industrial bulk chemical.
Zuckerindustrie 115, 555–565.
Taylor, T.P., Fasina, O., & Bell, L.N. (2008). Physical properties and
consumer liking of cookies prepared by replacing sucrose with tagatose.
Journal Food Science, 73(3), 145–151.
World Health Organization (WHO). 2014. Retrieved from
http://www.who.int/mediacentre/news/notes/2014/consultation-sugar-
guideline/es (Accessed 01.06.15).
Zhang, J., Liu, L., Mu,W., Moga, L. M., & Zhang, X. (2009). Development of
temperature managed traceability system for frozen and chilled food during
storage and transportation. Journal of Food Agriculture and Environment,
7 (3), 28–31.


III.7. CHARACTERIZATION OF WATERMELON
JELLY WITH NON CARIOGENIC SWEETENERS
Susana Rubio-Arraez1, Carme Benavent1,
Juan Vicente Capella2, María Luisa Castelló1,
and María Dolores Ortolá1
1Institute of Food Engineering for Development and 2Institute ITACA (ICT Technologies),
Universitat Politècnica de València,
Camino de Vera, s/n. 46022, Valencia, Spain
Journal of Texture Studies
JTS-1967
(Enviado)


III. Resultados
161
ABSTRACT
The aim of this study was to evaluate the substitution of sucrose with
non-cariogenic and low glycemic index (isomaltulose and tagatose)
sweeteners in jelly to which watermelon juice has also been added. The
results showed that the jelly made with the new sweeteners had lower
soluble solids. Moreover, the antioxidant activity increased over storage
time in the control sample and in the jelly containing isomaltulose and
tagatose, but without reaching the same levels as in the commercial jelly,
due to its enrichment with vitamin C. In addition, new sweeteners did not
affect the instrumental texture of jelly, and were very stable over time.
However, the colour changed, especially in the jelly containing only
tagatose. Finally, the jelly formulated with equal proportions of tagatose
and isomaltulose achieved the same score in the sensory evaluation as the
commercial jelly, evidencing that it is feasible to use these sweeteners to
reformulate watermelon jelly.
Keywords: jelly, watermelon, tagatose, isomaltulose, antioxidants,
colour, texture and sensory evaluation.
INTRODUCTION
Nowadays the society demands new increasingly healthier products
which include fruits and vegetables in their formulations, along with new
food processing technologies to make manufacturing these foods
possible. Besides, the food industry must meet this challenge at a
competitive price. One way of doing so is to add fruit to gelatine desserts.
This jelly is usually prepared with traditional sugars (sucrose, glucose,
etc…). However, consuming jelly of this type involves drawbacks for
health (cariogenesis, high caloric intake, increase in the glycemic index,
etc.). In this regard, WHO’s current recommendation is that sugars should
account for less than 10% of total energy intake per day. The objective of
WHO’s guideline is to provide recommendations on the consumption of
free sugars in order to reduce the risk of non-communicable diseases
III. Resultados
162
(NCDs) in adults and children, with a particular focus on the prevention
and control of weight gain, dental caries and diabetes type II (WHO,
2014).
It is widely known that synthetic sweeteners in different foods can
replace traditional sugars, especially in beverages. These sweeteners can
be classified as bulk sweeteners such as the polyalcohol-type, or as
intensive sweeteners such as saccharine, aspartame, etc. However, the
fact that there is a laxative effect in the case of many polyalcohols or that
intensive sweeteners may be linked to the development of different
cancers or other diseases (Weihrauch and Diehl, 2004; Soffritti et al.,
2006; Renwick and Nordmann, 2007, Guerrero and Flores, 2014) should
be taken into account. Furthermore, these sweeteners do not always have
the technological characteristics needed to provide the same texture or
flavour as traditional sugars, so they must be combined with other
components. Even then it is not always possible to obtain a similar
product.
Nowadays, alternative natural sweeteners which are metabolized by
the organism and have nutritional advantages, such as isomaltulose,
tagatose, oligofructose, stevia, etc., can be found in the market. However,
the challenge is to determine if their use is viable in the reformulation of
traditional products, which would mean that they conserve or even
improve the food’s technological properties.
Isomaltulose is a disaccharide for use as a carbohydrate source, which
fully or partially replaces sucrose or other highly digestible
carbohydrates. Based on its chemical definition, isomaltulose is a
sucrose-isomer consisting of glucose and fructose. However, compared to
sucrose or glucose, it is less glycemic, less insulinemic and is non-
cariogenic given that the linkage between glucose and fructose is more
stable than in sucrose (Lina et al., 2002; FDA, 2005). In a solution,
isomaltulose offers very low inversion rates and a low tendency to
III. Resultados
163
hydrolize. In 2005 isomaltulose was recognized as being safe (GRAS)
(FDA, 2005).
On the other hand, tagatose is a low carbohydrate functional
sweetener, which is very similar to galactose in structure. It is naturally
occurring and can be found in some dairy products. Tagatose has a
physical bulk similar to sucrose or table sugar and is almost as sweet.
However, it is metabolized differently, has a minimal effect on blood
glucose and insulin levels, and also provides a prebiotic effect (Oh, 2007;
Taylor et al., 2008; Calzada-León et al., 2013). Tagatose is especially
suitable as a flavour enhancer or as a low carbohydrate sweetener. It can
be used in ready-to-eat cereals, diet soft drinks, health bars, frozen
yogurt/non-fat ice cream, soft confectionary, hard confectionary, frosting
and chewing gum (Vastenavond et al., 2011). Tagatose is only minimally
absorbed by the upper gastrointestinal tract. The unabsorbed tagatose is
fermented in the colon, where it acts as soluble fibre (Taylor et al., 2008,
Kearsley and O’Donnell, 2012). Besides, it does not promote tooth decay
and it only provides 1.5 kcal/g to one’s diet (Levin, 2002; Li et al., 2013).
Tagatose has been approved, given that it is “Generally Recognized as
Safe” (GRAS) in 2010 (FDA, 2010).
Watermelon is a seasonal fruit whose surplus production is generally
not exploited enough. To change this situation, this fruit could be used to
prepare gelatine desserts. Moreover, watermelon plays an effective role in
reducing oxidative stress through phytochemical lycopene, is also high in
other antioxidants and has been linked to a decreased risk of coronary
heart disease (Hong et al., 2015). Therefore an increase in watermelon
consumption could lead to a general improvement in the health of a
society.
The aim of this study was to evaluate the replacement of sucrose in
jelly with non-cariogenic and low glycemic sweeteners (isomaltulose and
tagatose) and the addition of fresh watermelon juice in their formulation,
by analysing its composition (Brix and moisture content), pH, water

III. Resultados
164
activity, antioxidant capacity, mechanical and optical properties and
stability over time. The results were then compared with those obtained
for a control sample of jelly (with sucrose and watermelon juice) and
with a commercial jelly (with sucrose, flavourings and colourants). A
sensorial analysis was also carried out to check their acceptance.
MATERIALS AND METHODS
Components and formulation of watermelon jelly
The jelly was manufactured with watermelon (Citrullus vulgaris)
juice, sucrose (Azucarera Iberia S.L., Madrid, Spain), isomaltulose
(Beneo Mannheim, Germany), tagatose (40% of purity, Damhert NV/SA,
Heusden-Holder, Belgium) and jelly (Junca Gelatines SL, Girona, Spain).
The jelly was prepared using the same proportions of ingredients as in
commercial watermelon flavoured jelly powder (Royal, Kraft Foods,
Madrid, Spain): 85% of sugars and 9.4% of gelatine. Following the
manufacturer’s instructions, the content of the power was diluted with
500 g of water, leading to a final composition of 12.6% of sugars and
1.6% of gelatine. In the jelly prepared with watermelon juice, the amount
of sugars registered in the juice were taken into account when adding
sweeteners in order to maintain the same proportion of sugars and
gelatine as in the commercial formula. Furthermore, the water was replaced
with 50% of watermelon juice. It is important to point out that
commercial jelly also contain vitamin C, acidity regulators (fumaric acid,
sodium citrate), flavourings and colorants (E100: curcumine and E120:
carminic acid).
Depending on the combination of sweeteners/sugars as compared to
the content of sugars, the following notation was used: Control jelly:
100% sucrose; I50T50 jelly: 50% isomaltulose and 50% tagatose; T jelly:
100% tagatose; I jelly: 100% isomaltulose; and commercial jelly (100%
sucrose and no watermelon juice).
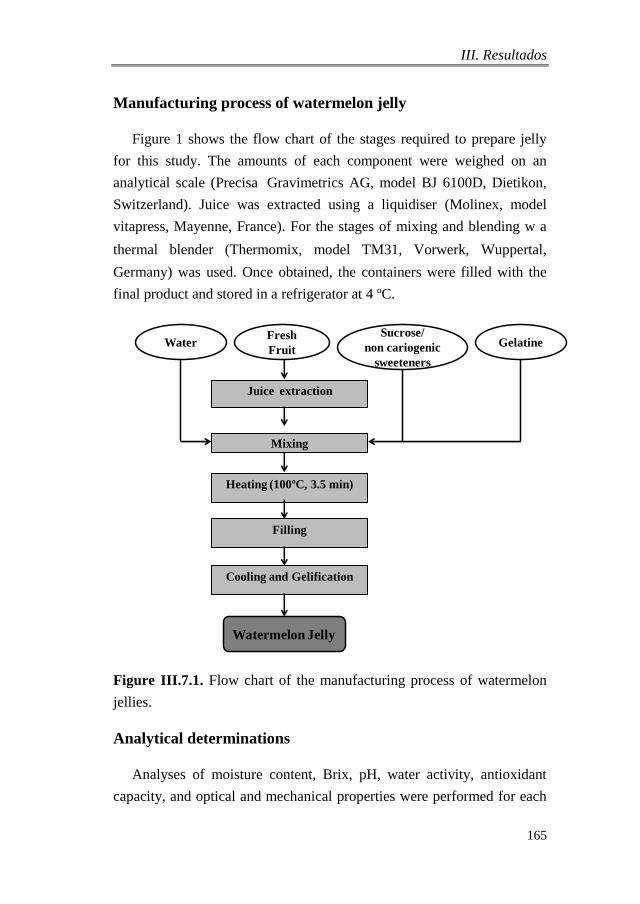
III. Resultados
165
Manufacturing process of watermelon jelly
Figure 1 shows the flow chart of the stages required to prepare jelly
for this study. The amounts of each component were weighed on an
analytical scale (Precisa Gravimetrics AG, model BJ 6100D, Dietikon,
Switzerland). Juice was extracted using a liquidiser (Molinex, model
vitapress, Mayenne, France). For the stages of mixing and blending w a
thermal blender (Thermomix, model TM31, Vorwerk, Wuppertal,
Germany) was used. Once obtained, the containers were filled with the
final product and stored in a refrigerator at 4 ºC.
Figure III.7.1. Flow chart of the manufacturing process of watermelon
jellies.
Analytical determinations
Analyses of moisture content, Brix, pH, water activity, antioxidant
capacity, and optical and mechanical properties were performed for each
WaterFresh
Fruit
Sucrose/
non cariogenic
sweeteners
Gelatine
Juice extraction
Mixing
Heating (100ºC, 3.5 min)
Filling
Cooling and Gelification
Watermelon Jelly

III. Resultados
166
formulation of jelly, both initially and after 15 days of storage at 4 ºC in
triplicate. Following are the methodologies followed for each case.
Moisture content, soluble solids (Brix), water activity and pH
Moisture content (xw: kg water/kg watermelon jelly) was analysed
gravimetrically following an adaptation of the AOAC method, (2000).
Soluble solids of samples were measured by a refractometer (Atago3T,
Tokyo, Atago), the results being obtained in Brix. Water activity (aw) was
determined using a hygrometer (Decagon Devices, Inc., model 4TE,
Pullman, Washington, USA), at 25ºC. The pH was registered by pH-
meter (Mettler Toledo, model SevenEasy, Barcelona, Spain), previously
calibrated with buffered solutions of pH 7.0 and 4.0.
Antioxidant capacity
The antioxidant activity of watermelon jelly was analysed following
the method described by Shahidi et al. 2006 with some modifications. It
is based on the scavenging activity of the stable 2,2-diphenyl-1-
picrylhydrazyl (DPPH) free radical. One gram of watermelon jelly was
mixed with 6 mL of pure methanol for 5 min in a vortex, keeping the
supernatant. This mixture was centrifuged at 13,000 rpm for 10 min. The
absorbance of 3.9 mL of the DPPH solution (0.025 mg/mL, prepared in
methanol: water (80:20)) was read at 515 nm in a spectrocolorimeter
Thermo Fisher Scientific, Inc. (Helios Zeta UV-VIS, Waltham,
Massachusetts, USA). Then, 0.1 mL of the supernatant was mixed with
the methanolic solution of DPPH and absorbance was read again after 30
min. Quantification was performed considering a standard curve of
Trolox (6-Hydroxy-2,5,7,8-tetramethylchroman-2-carboxylic acid) and
the results were expressed as mg of Trolox equivalent per 100 g of
watermelon jelly.

III. Resultados
167
Optical Properties
The colour of watermelon jellies placed in 20 mm-wide cuvettes was
measured using a spectrocolorimeter (Konica Minolta, Inc., CM-3600d
model, Tokyo, Japan). CIE-L*a*b* coordinates were obtained using D65
illuminant and 10º observer as reference system.
Mechanical Properties
The samples were examined with a Texture Profile Analysis test
(TPA) using a TA.XT plus Texture Analyser (Stable Micro Systems,
Godalming, U.K.). For this purpose, a load cell of 50 kg and a 45 mm
diameter cylindrical probe were used. The test conditions involved two
consecutive cycles of 50% compression with 15 s between cycles. The
test speed was 1 mm/s. From the resulting force-time curve the following
parameters were quantified, and are defined by Bourne (1978) as:
hardness (N) (maximum peak force during the first compression cycle),
cohesiveness (the ratio of the positive force area during the second
compression and the first compression), gumminess (N) (hardness x
cohesiveness), adhesiveness (negative force area) and springiness (the
distance that the sample recovers till the maximum peak of the first
compression cycle divided by the distance from the beginning of the
second compression cycle to its maximum peak).
Sensorial Analysis
An acceptance test using a 9-point hedonic scale (ISO 4121:2003 and
ISO 5492:2008) was used to evaluate the following attributes in the
samples: colour, flavour, texture, sweetness, global preference and
intention of buying. The panel consisted of 30 trained panellists (aged
from 20 to 50) who are regular consumers of this kind of dessert. Testing
was conducted in a sensory evaluation laboratory built according to the
international standards for test rooms. In this analysis the watermelon
jelly formulated only with isomaltulose in the content of sweeteners (I)
was not considered because the other samples of jelly had better quality.

III. Resultados
168
Statistical analysis
Analyses of variance (multifactor ANOVA) were carried out using
Statgraphics plus software (Statpoint Technologies, Inc., Centurion,
Warrenton, Virginia, USA) to discern whether the effect of formulation
or storage was significant on the watermelon jelly studied. Interactions
between the factors were also considered.
RESULTS AND DISCUSSION
Compositional characterisation of watermelon jelly
Table 1 shows the results of moisture content (xw), Brix, pH, water
activity (aw) and the antioxidant capacity of the jelly formulations with
sucrose or new sweeteners (tagatose and isomaltulose). In all cases, the
jelly reached a concentration of soluble solids higher than 14 Brix, being
higher in the commercial and control samples. Consequently, the samples
made with new sweeteners showed a greater content of water. Despite the
statically significant differences found in terms of water activity in the
jelly examined, in all cases the values of aw were 0.99. Therefore, the
type of sweetener had no influence on this parameter. However, the pH
was much lower in the commercial jelly due to the acidity regulators
(fumaric acid and sodium citrate) used in that formulation. Time did not
cause significant changes in any of these parameters, except for the pH,
which increased after 15 days of storage.
Antioxidant capacity was initially found to be the highest in the
commercial sample due to the presence of vitamin C. On the other hand,
the samples of jelly prepared with watermelon juice all initially showed
the same antioxidant capacity, but this capacity increased in control
samples and in jelly formulated with the combination of isomaltulose and
tagatose, unlike in samples formulated with only isomaltulose or tagatose.
Thus, the mixture of isomaltulose and tagatose could have a synergetic
effect favouring antioxidant concentration.

III. Resultados
169
TABLE III.7.1. Values for moisture content (xw), Brix, water activity (aw) and pH of watermelon jellies formulated with sucrose
(control and commercial) or with new sweeteners (isomaltulose and tagatose), initially and after 15 days of storage.
FORMULATION TIME
(days)
xw
(g water/
g watermelon jelly)
ºBRIX aw pH
ANTIOXIDANT
CAPACITY
(mg Trolox/100 g
watermelon jelly)
COMMERCIAL 1 0.852±0.001ª 16±0.4d 0.996±0.001c 3.667±0.006a 65±9d
15 0.850±0.001ª 15.7±0.2d 0.994±0.001b 3.80±0.02b 55±5e
CONTROL 1 0.853±0.002ª 16.27±0.06cd 0.994±0.0002b 6.337±0.006e 7.9±1.2ab
15 0.849±0.003a 16.27±0.15c 0.991±0.001a 6.46±0.02f 16.2±0.2c
I 1 0.863±0.001b 14.4±0.2a 0.993±0.001ab 6.203±0.006d 8.8±1.3b
15 0.864±0.005b 14.73±0.06ab 0.993±0.001ab 6.37±0.04f 2.35±1.13a
T 1 0.860±0.002b 15.03±0.15b 0.992±0.001ab 6.25±0.02d 8.26±0.69b
15 0.865±0.003b 15.1±0.1b 0.993±0.002ab 6.40±0.03f 3.69±1.49ab
I50T50 1 0.863±0.001b 14.8±0.2b 0.993±0.0005b 6.113±0.013c 9.93±0.49b
15 0.873±0.006c 14.77±0.21b 0.994±0.002b 6.27±0.04e 15.83±1.16c
Equal letters indicate homogeneous groups

III. Resultados
170
Mechanical properties
Figure 2 shows the average curves of the TPA analysis carried out on
the samples of jelly used in this study along with the scheme used to
determine the mechanical parameters. As can be seen, the curves
obtained for commercial jelly showed more pronounced peaks than the
other samples, both at the beginning and at the end of storage.
Furthermore, after 15 days of storage, the second peak of the curve
shifted to the right, especially in commercial jelly.
Figure.III.7.2. Representative curves of TPA test for watermelon jellies
studied as a function of sweeteners used in its formulation initially (A)
and after 15 days of storage (B).
B
A
Time (s)
For
ce (
N)
B
A
Time (s)
Time (s)
Forc
e (N
)Fo
rce
(N)
A
B
For
ce (
N)
Time (s)
B
A
Time (s)
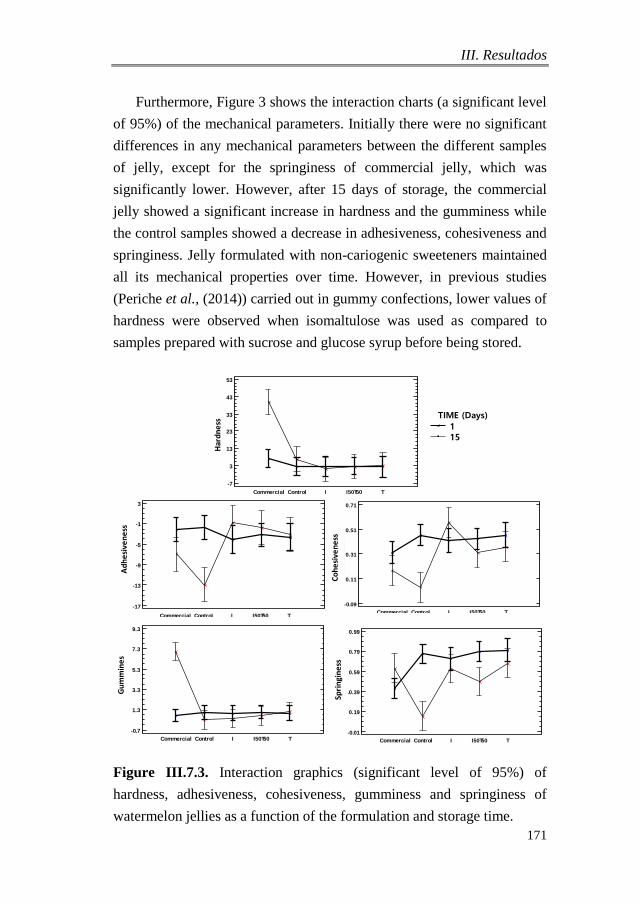
III. Resultados
171
Furthermore, Figure 3 shows the interaction charts (a significant level
of 95%) of the mechanical parameters. Initially there were no significant
differences in any mechanical parameters between the different samples
of jelly, except for the springiness of commercial jelly, which was
significantly lower. However, after 15 days of storage, the commercial
jelly showed a significant increase in hardness and the gumminess while
the control samples showed a decrease in adhesiveness, cohesiveness and
springiness. Jelly formulated with non-cariogenic sweeteners maintained
all its mechanical properties over time. However, in previous studies
(Periche et al., (2014)) carried out in gummy confections, lower values of
hardness were observed when isomaltulose was used as compared to
samples prepared with sucrose and glucose syrup before being stored.
Figure III.7.3. Interaction graphics (significant level of 95%) of
hardness, adhesiveness, cohesiveness, gumminess and springiness of
watermelon jellies as a function of the formulation and storage time.
Interactions and 95.0 Percent LSD Interv als
Formulation
-0.01
0.19
0.39
0.59
0.79
0.99
Sprin
gin
es
s
Commercial Control I I50T50 T
Time (days)
1
15
Spri
ngi
ne
ss
Interactions and 95.0 Percent LSD Interv als
Formulation
-0.7
1.3
3.3
5.3
7.3
9.3
Gu
mm
ines
s
Commercial Control I I50T50 T
Time (days)
1
15
Gu
mm
ine
s
Interactions and 95.0 Percent LSD Interv als
Formulation
-7
3
13
23
33
43
53
Hardn
es
s
Commercial Control I I50T50 T
Time (days)
1
15
Har
dn
ess
Interactions and 95.0 Percent LSD Interv als
Formulation
-17
-13
-9
-5
-1
3
Adh
es
ive
ne
ss
Commercial Control I I50T50 T
Time (days)
1
15
Ad
he
sive
ne
ss
Interactions and 95.0 Percent LSD Interv als
Formulation
-0.09
0.11
0.31
0.51
0.71
Coh
es
ive
ne
ss
Commercial Control I I50T50 T
Time (days)
1
15
Co
he
sive
ne
ss
Interactions and 95.0 Percent LSD Interv als
Formulation
-0.09
0.11
0.31
0.51
0.71
Coh
es
ive
ne
ss
Commercial Control I I50T50 T
Time (days)
1
15
Interactions and 95.0 Percent LSD Interv als
Formulation
-0.09
0.11
0.31
0.51
0.71
Coh
es
ive
ne
ss
Commercial Control I I50T50 T
Time (days)
1
15
Interactions and 95,0 Percent LSD Intervals
-7
3
13
23
33
43
53
HA
RD
NESS
Commercial
Cont
rol I T
I50T
50
TIME (Days)
115

III. Resultados
172
Therefore, depending on the product studied the interaction of
sweeteners in gel formation has a different effect. According to these
results, the new sweeteners used in this study could have a greater ability
to maintain the mechanical properties of the gel over time. This
behaviour could be attributed to the effect of the acids present in the
commercial formulation.
Optical properties
Figure 4 shows the interaction charts of the colorimetric coordinates
L*, a* and b*, chrome (C*=(a*2+b*2)1/2) and hue (h*=arctg(b*/a*))
depending on the formulation used and the storage time. As can be seen,
the commercial jelly showed significant differences in coordinates L*, a*
and b* as compared to the jelly samples formulated with sweeteners.
More specifically, commercial samples showed lower values of
luminosity but higher values of a* and b* coordinates. These differences
may be attributable to the colourants used in commercial jelly (carminic
acid (E-120) and curcumin (E-100)).
Taking in consideration only the jelly formulated with watermelon
juice, it was noteworthy that the use of the new sweeteners significantly
reduced its luminosity. Besides, L* in formulation with only tagatose
significantly decreased over time. Initially there were no significant
differences among samples for a* coordinate, but after storage, there was
a significant change in the sample of jelly with only tagatose once again,
but in this case it was an increase. The b* coordinate followed the same
trend as a* coordinate, but in this case the mixture of isomaltulose and
tagatose also showed an increase after storage. As a consequence, the
chrome (C*) was significantly greater after 15 days in samples that only
contained tagatose. Finally, the major values of hue (h*) were recorded in
the jelly with the combination of isomaltulose and tagatose.

III. Resultados
173
Figure III.7.4. Interaction graphics (significant level of 95%) of colour
parameters: L*, a*, b* coordinates, chroma (C*) and hue (h*) of the
watermelon jellies as a function of the formulation and storage time.
Sensory analysis
The results of sensory analysis of jelly, depending on their
formulation (commercial, control, T, I50T50), are presented in Figure 5.
In this case, two ANOVAs were performed in order to assess the
influence of the commercial jelly on these results.
One ANOVA was carried out on all formulations (commercial,
control, T, T50I50) and in the case of the other ANOVA, the commercial
sample (control, T, T50I50) was excluded.
Interactions and 95.0 Percent LSD Intervals
0
10
20
30
40
L*
Commercial Control I T T50I50
1
15
Interactions and 95.0 Percent LSD Intervals
0
4
8
12
16
20
a*
Commercial Control I T T50I50
Time (days)
1
15
Interactions and 95.0 Percent LSD Intervals
0
2
4
6
8
10
12
b*
Commercial Control I T T50I50
Time (days)
1
15
a* b*
L*
Interactions and 95.0 Percent LSD Intervals
0
4
8
12
16
20
24
C*
Commercial Control I T T50I50
Time (days)
1
15
C*
Interactions and 95.0 Percent LSD Intervals
20
24
28
32
36
40
44
h*
Commercial Control I T T50I50
Time (days)
1
15
h*
Day 1 – --Day 15 __

III. Resultados
174
Figure III.7.5. Sensory assessment of watermelon jelly as a function of
the formulation. Level of significance (ns) of the ANOVA considering all
jellies: *ns: 95%, **ns: 99%. Level of significance (ns) ANOVA without
considering the commercial jelly: ººns: 99%.
From the results obtained in the first ANOVA it was concluded that
colour and flavour were better in commercial jelly in comparison to the
other samples of jelly due to the addition of colourants and artificial
flavours. Moreover, the values for texture of the jelly made with the
mixture of isomaltulose and tagatose were similar to those obtained for
commercial jelly, being significantly lower in the other two cases. These
results were the opposite of those obtained in the instrumental analysis of
the mechanical properties, since no significant differences were initially
detected in any of the samples studied, except for springiness, which was
lower in the commercial sample. Finally, there were no significant
differences observed with respect to sweet taste, global acceptance and
intention of buying between the samples of jelly studied in the ANOVAs
analysed.
Colour**
Flavour**
Texture**°°
Sweetness
Global
acceptance
Intention of
buying
Comercial Control T T50I50

III. Resultados
175
Therefore, according to this study, the replacement of sucrose with a
mixture of isomaltulose and tagatose in equal proportion would be
feasible from a sensory point of view.
CONCLUSIONS
The reformulation of watermelon jelly with the non-cariogenic
sweeteners used in this research is viable. The mixture of isomaltulose
and tagatose and storage enhanced its levels of antioxidant capacity to
values similar to those of jelly with sucrose, although values registered
for commercial jelly were not reached.
The mechanical properties of jelly made with the new sweeteners
were similar to those prepared with sucrose and were very stable.
However, in terms of sensory analysis, texture was a determinant
attribute in the evaluation of the jelly, and the two types of jelly scored
the best were the jelly containing equal proportions of isomaltulose and
tagatose and the commercial jelly. However, further studies should be
carried out in order to improve the colour stability of jelly formulated
only with tagatose over time.
ACKNOWLEDGEMENTS
The authors would like to thank the Serigó-Andrés family for donating
the raw materials, and also the GVA projects GV/2013/029,
GV/2014/012 as well as the Universitat Politècnica de València (Spain)
for the financial support given to this research study (UPV PAID-06-12
SP20120889).
REFERENCES
AOAC. (2000). Official Methods of Analysis of AOAC International
(17th ed.). Gaithersburg, MD, USA.

III. Resultados
176
Calzada-León, R., Ruiz-Reyes, M.L., Altamirano-Bustamante, N., &
Padrón-Martínez, M.M. (2013). Features of the noncaloric sweeteners
and their use in children. Acta Pediátrica de México, 34(3), 141–153.
Dobbs, C.M., & Bell, L.N. (2010). Storage stability of tagatose in buffer
solutions of various composition. Food Research International, 43,
382–386.
FDA. (2005). GRAS Notification Isomaltulose (PALATINOSETM).
http://www.fda.gov/ucm/groups/fdagov-public/@fdagov-foodsgen/
documents/ document/ucm268989.pdf Accessed 2015 March.
FDA. (2010). Tagatose GRAS notice. http://www.fda.gov/ucm/groups
/fdagov-public/@fdagov-foods-gen/documents/document/ucm
269560.pdf Accessed 2015 March.
Hong, M., Hartig, N., Kaufman, K., Hooshmand, S., Figueroa, A., &
Kern, M. (2015). Watermelon consumption improves inflammation
and antioxidant capacity in rats fed an atherogenic diet. Nutrition
Research, 35, 251–258.
ISO 4121. (2003). Sensory analysis. Guidelines for the use of quantitative
response scales. International Organization for Standardization.
Geneva, Switzerland.
ISO 8589. (2007). Sensory analysis. General guidance for the design of
test rooms. International Organization for Standardization. Geneva,
Switzerland.
ISO 5492. (2008). Sensory analysis. Vocabulary. International
Organization for Standardization. Geneva, Switzerland.
Kearsley, M., & O’Donnell, K. (2012). Sweeteners and Sugar
Alternatives in Food Technology (2th ed.). Wiley-Blackwell (Eds.),
Chichester, West Sussex, U.K.
Levin, G.V. (2002). Tagatose, the new GRAS sweetener and health
product. Journal of Medical Food, 5(1), 23–36.
Li, Z., Gao, Y., Nakanishi, H., Gao, X., & Cai, L. (2013). Biosynthesis of
rare hexoses using microorganisms and related enzymes. Beilstein
Journal of Organic Chemistry, 9, 2434–2445.

III. Resultados
177
Lina, B.A.R., Jonker, G., & Kozianowski, G. (2002). Isomaltulose
(Palatinose review of biological and toxicologycal studies). Food and
Chemical Toxicology, 40(10), 1375–381.
Oh, D.K. (2007). Tagatose: properties, applications, and biotechnological
processes. Applied Microbiology and Biotechnology, 76(1), 1–8.
Periche, A., Heredia, A., Escriche, I., Andrés, A., & Castelló, M.L.
(2014). Optical, mechanical and sensory properties of based-
isomaltulose gummy confections. Food Bioscience, 7, 37–44.
Renwick, A.G., & Nordmann, H. (2007). First European conference on
aspartame: Putting safety and benefits into perspective. Synopsis of
presentations and conclusions. Food and Chemical Toxicology, 45(7),
1308–1313.
Shahidi, F., Liyana-Pathirana, C.M., & Wall, D.S. (2006). Antioxidant
activity of white and black sesame seeds and their hull fractions. Food
Chemistry, 99(3), 478–483.
Soffritti, M., Belpoggi, F., Degli Esposti, D., Lambertini, L., Tibaldi, E.,
& Rigano, A. (2006). First experimental demonstration of the
multipotential carcinogenic effects of aspartame administered in the
feed to Sprague-Dawley rats. Environmental Health Perspectives,
114(3), 379–385.
Taylor, T.P., Fasina, O., & Bell, L.N. (2008). Physical properties and
consumer liking of cookies prepared by replacing sucrose with
tagatose. Journal of food science, 73(3), 145–151.
Vastenavond, C.M., Bertelsen, H., Hansen, S.J., Laursen, R.S., Saunders,
J., & Eriknauer, K. (2012). Tagatose (D-tagatose). In: Nabors L, (ed.).
Alternative sweeteners, 13, (pp.197–222). Marcel Dekker, New York,
USA.
Weihrauch, M.R., & Diehl, V. (2004). Artificial sweetener—do they bear
a carcinogenic risk? Annals of Oncology, 15(10), 1460–1465.
WHO. (2014). http://www.who.int/mediacentre/news/notes/2014/
consultation-sugar-guideline/en/ Accessed 2015 March.


III.8. PHYSICOCHEMICAL
CHARACTERISTICS OF CITRUS JELLY
WITH NON-CARIOGENIC AND
FUNCTIONAL SWEETENERS
Susana Rubio-Arraez1, Juan Vicente Capella2, María
Dolores Ortolá1, and María Luisa Castelló1.
1Institute of Food Engineering for Development and 2Institute ITACA (ICT Technologies),
Universitat Politècnica de València,
Camino de Vera, s/n. 46022, Valencia, Spain
European Food Research and Technology
EFRT-15-0985
(Enviado)


III. Resultados
178
ABSTRACT
In this study the effect of sweeteners with low glycemic index and
non-cariogenic characteristics (isomaltulose, oligofructose and tagatose)
in jelly prepared with citrus juice has been evaluated considering as
reference a citrus jelly formulated with sucrose. For that, analyses of
soluble solids, moisture content, pH, water activity, antioxidant capacity,
optical and mechanical properties of different blenders of these new
sweeteners have been carried out, initially and after 15, 30 and 45 days of
storage. Besides, mesophilic aerobics and moulds and yeasts have been
also counted to determine their stability over time. A sensory evaluation
of the citrus jelly has also been done.
The results showed the antioxidant activity decreased over storage
time in all formulations. Throughout time tagatose increased luminosity
whereas coordinates a*, b* and chrome of all the new formulations were
lower than in jellies with sucrose. Moreover, the use of only oligofructose
or tagatose or the mixture of isomaltulose and tagatose were the
formulations most similar to the control jelly. Finally, the jelly prepared
with the combination of isomaltulose and tagatose in equal proportions
obtained the best scored in the sensorial analysis.
Keywords: jelly, citrus fruits, sweeteners, antioxidants, mechanical
properties and sensory evaluation.
INTRODUCTION
Currently awareness of health-related issues in society has increased
the demand of new functional foods and consequently food industry must
be constanly innovating to offer consumers new alternative products.
Bearing this in mind, the reformulation of jelly desserts with new non-
cariogenic sweeteners available in the market could be a good chance to
achieve this goal.

III. Resultados
179
Traditionally, jelly desserts are mainly produced with edible gelatine,
water, sugar and flavors. Despite the fact that this type of dessert is not
considered with a high nutritional value, it is important to point out that
this situation might change if natural vitamins and antioxidants provided
from fruit juice were included in its formulation instead of the water.
Citrus fruits such as orange, lemon and mandarin orange have many
beneficial properties due to their high content of fibre, vitamins, minerals,
ascorbic acid and specially high content in antioxidant compounds, such
as carotenoids, flavonoids and phenolic compounds (Álvarez et al.,2014;
Balasundram et al., 2006; Dhuique-Mayer et al., 2005; Navarro et al.,
2011). Besides, this type of fruits are available thoroughout the year
because they are grown in the north and south hemispheres. Concretely,
there is a total production of citrus fruits of 136 millions of tons per year
divided in 71 millions of tons of oranges, 29 millions of tons tones of
mandarin oranges and 15 millions of tons of lemons (FAOSTAT, 2013).
As far as we know, a jelly dessert prepared with a mixture of different
citrus juices does not exist in the market and it could expand the
possibilities of commercialization.
In terms of composition, although jelly desserts have low content of
gelatine this type of protein contains 18 different amino acids, including 8
essential amino acids (GME, 2015a, 2015b), being particularly rich in
glycine, proline and hydroxyproline. Furthemore, gelatine is a natural
colloide with properties of gelling and a stabilizing effect. Therefore,
gelatine has a quite high nutritional value but with a low caloric power
(17 kJ/ kg or 4 kcal/ g).
Other important components of jelly desserts are sugars. It is widely
known that their their excessive consumption is related to tooth decay,
diabetes and obesity (Edwards, 2002; Weihrauch & Diehl, 2004; Sloan,
2005; O'Donnell & Kearsley, 2012; WHO, 2014)), among other illnesses.
To cope with these issues nowadays there are natural sweeteners such as
tagatose, isomaltulose and oligofructose (FDA, 2001, 2005, 2010, 2011)

III. Resultados
180
which need to be studied in order to check their capacity to replace
sucrose and other sugars in traditional foods as jelly desserts.
Oligofructose is an oligosaccharide derived from fructose, which acts
as dietary fibre regulating intestinal transit. It presents a prebiotic effect
because it favours the selective growth of bifidus bacteria (Ledur et al.,
2013). Besides, it reduces cholesterol and blood sugar levels (Chacon-
Villalobos, 2006) and improves calcium absorption (Van den Heuvel et
al., 1999). Nevertheless, it is highly soluble and possesses technological
properties (sweet taste, stability…) analogous to sucrose (Pimentel et al.,
2015). In 2011, oligofructose was recognized as safe (GRAS) (FDA,
2011).
D-Tagatose (D-tag) is a ketohexose, a stereoisomer of D-galactose and
it is found naturally in several foods, including cheese and yoghurt. Its
texture is very similar to sucrose and almost as sweet as sucrose, with
only 1.5 kcal/g and it does not provoke dental caries (Levin, 2002; Oh,
2007; Taylor et al., 2008; Calzada-Leon et al., 2013). Tagatose is very
suitable for confectionary products, ice creams, soft drinks and breakfast
cereals (Vastenavond et al., 2012). Tagatose is minimally absorbed by the
upper gastrointestinal tract. The unabsorbed tagatose is fermented in the
intestines, causing a change in the proportions of various short chain fatty
acids (Taylor et al., 2008). Thus, it is considered a functional food and
besides it performs functions as soluble fibre favouring lactic acid
bacteria and Lactobacillus specie bacteria (Petersen-Skytte, 2006).
D-tagatose received GRAS status by the Food and Drug Administration
in 2001 (Levin, 2002; Donner et al., 2010; FDA, 2001, 2010).
Isomaltulose is a reducing disaccharide which is naturally present in
honey, and sugar cane juice, and its appearance, taste and viscosities of
aqueous solutions are comparable to sucrose (Schiweck et al., 1990;
Periche et al., 2014). Based on its chemical definition compared to
sucrose or glucose, it is less insulinemic, less glycemic and is non-
cariogenic (Lina et al., 2002).

III. Resultados
181
However, it has a third of the sweetening power of sucrose (Lina et
al., 2002; De Oliva-Neto & Menão, 2009; Peinado et al., 2012). In 2005,
isomaltulose was recognized as safe (GRAS) (FDA, 2005).
In accordance with the properties of these three sweeteners
(oligofructose, isomaltulose and tagatose), the aim of this paper was to
evaluate their potential use as an alternative to sucrose in the
development of jelly dessert along with the addition of fresh citrus juice
on composition, antioxidant capacity, mechanical and optical properties,
and sensory analysis.
MATERIALS AND METHODS
Components and formulation of citrus jelly
Jelly was manufactured with citrus fruits juice (Citrus reticulata
clementina, Citrus limon eureka, Citrus sinensis navelate),
sugar/sweeteners and gelatine (Junca Gelatines S.L., Girona, Spain). In
control jelly sucrose (Azucarera Iberia S.L., Madrid, Spain) whereas in
the new jellies the amount of sucrose was replaced by different mixtures
of oligofructose obtained from Sensus (Frutalose, Roosendaal,
Netherlands), isomaltulose obtained from Beneo (Palatinose, Mannheim,
Germany) and tagatose obtained from Damhert Nutrition (Tagatesse,
Heusden-Holder, Belgium).
The jelly dessert was prepared using the same proportions of
ingredients as in a commercial orange flavoured jelly powder (Royal,
Kraft Foods, Madrid,Spain) which were: 85.2% of sugars and 9.5% of
gelatine. It is important to point out that commercial jelly also contained
vitamin C, acidity regulators (fumaric acid, sodium citrate), flavourings
and colourants (E100: curcumine and E120: carminic acid) but these
components were not included in the jelly of this study. Following the
manufacturer’s instructions, the content of the powder was diluted with
500 g of water, leading to a final composition of 12.6% of sugars and
1.6% of gelatine.

III. Resultados
182
In the jelly prepared with citrus juice, the amount of sugars contained
in the juice were taken into account when adding sweeteners in order to
maintain the same proportion of sugars and gelatine as in the commercial
formula. Furthermore, 50% of the amount of water was replaced by citrus
juice. The citrus juice was prepared with the following proportionos of
each fruit: lemon juice 14%, orange juice 43% and mandarin orange juice
43%. Depending on the combination of sucrose/sweeteners used in jelly,
the following notation was used: Control: 100% sucrose; I50T50: 50%
isomaltulose and 50% tagatose; T: 100% tagatose; I: 100% isomaltulose;
I50O50: 50% isomaltulose and 50% oligofructose, and O jelly: 100%
oligofructose.
Manufacturing process of citrus jelly
Figure 1 shows the flow chart of the stages required to prepare jelly
for this study. The amounts of each component were weight in an
analytical scale (Precisa Gravimetrics AG, model BJ 6100D, Dietikon,
Switzerland). Juice was extracted using a liquidiser (Molinex, model
vitapress, Mayenne, France). For the stages of mixing and blending, a
thermal blender (Thermomix, model TM31, Vorwerk, Wuppertal,
Germany) was used. Once the mixture was obtained, containers were
filled and stored at refrigeration at 4ºC.

III. Resultados
183
Figure III.8.1. Flow chart of the manufacturing process of citrus jellies
Analytical determinations
Analysis of moisture content, Brix, pH, water activity, antioxidant
capacity, optical and mechanical properties and microbiological analysis
were performed for each formulation of citrus jelly at 1, 15, 30 and after
45 days of storage at 4 ºC by triplicate. Next the methodologies followed
for each case are described.
Moisture and soluble solids content, pH and water activity
Moisture content (xw: g water/g citrus jelly) was analysed
gravimetrically following an adaptation of the AOAC method (2000).
Soluble solids content of samples were measured by a refractometer at
20ºC (Atago3T, Tokyo, Japan), the results being obtained in Brix.
CITRUS JELLY
Cooling and Gelification
Filling
Heating
(100ºC, 3.5 min)
Mixing
Juice Extraction
GelatineWater
Sucrose/ Sweeteners
Fresh Fruit

III. Resultados
184
pH was registered using a pH-meter (Mettler Toledo, model
SevenEasy, Barcelona, Spain), previously calibrated with buffered
solutions of pH 7.0 and 4.0. Water activity (aw) was determined using a
hygrometer (Decagon Devices, Inc., model 4TE, Pullman, Washington,
USA), at 25ºC.
Determination of antioxidant capacity
The antioxidant activity of citrus jelly was analysed following the
method described by Shahidi et al., 2006. This method is based on the
scavenging activity of the stable 2,2-diphenyl-1-picrylhydrazyl (DPPH)
free radical. 1 g of citrus jelly was mixed with 6 mL of pure methanol in a
vortex for five minutes, keeping the supernatant. This mixture was
centrifuged at 13,000 rpm for 10 minutes.
The absorbance of 3.9 mL of the DPPH solution (0.025 mg/mL,
prepared in methanol: water (80:20)) was read at 515 nm in a
spectrocolorimeter Thermo Fisher Scientific, Inc. (Helios Zeta UV-VIS,
Waltham, Massachusetts, USA). Then, 0.1 mL of the supernatant was
mixed with the methanolic solution of DPPH and absorbance was read
again after 30 minutes. Quantification was performed considering a
standard curve of Trolox (6-Hydroxy-2,5,7,8-tetramethylchroman-2-
carboxylic acid) and the results were expressed as mg of Trolox
equivalent per 100 g of citrus jelly.
Optical Properties
The optical properties of citrus jelly placed in 20 mm-wide cuvettes
was measured using a spectrocolorimeter UV (Konica Minolta Inc., CM-
3600d model, Tokyo, Japan). CIEL*a*b* coordinates were obtained
using D65 illuminant and a 10º observer as reference system. Registered
parameters were: L* (brightness), a* (red component), b* (yellow
component), Chroma (C*=(a*2+b*2)1/2) and hue (h*=arctg(b*/a*)).

III. Resultados
185
Mechanical Properties
The samples were examined with Texture Profile Analysis test (TPA)
using a TA.XT plus Texture Analyser (Stable Micro Systems,
Godalming, U.K.). For this purpose, a load cell of 50 kg and a 45 mm
diameter cylindrical probe were used. The test conditions involved two
consecutive cycles of 50% compression with 15 seconds between cycles.
The test speed was 1 mm/s. Based on the resulting force-time curve it
was possible to measure the following parameters were quantified, and
are defined by Bourne (1978) as: hardness (N) (maximum peak force
during the first compression cycle), cohesiveness (the ratio of the positive
force area during the second compression and the first compression),
adhesiveness (negative force area), gumminess (N) (hardness x
cohesiveness) and springiness (the distance that the sample recovers till
the maximum peak of the first compression cycle divided by the distance
from the beginning of the second compression cycle to its maximum
peak).
Microbiological analysis
Serial dilutions were prepared by homogenizing 10 g of citrus jelly
with 90 mL of 1% sterile peptone water in a stomacher bag, using sterile
techniques. Mesophilic aerobic populations were analyzed in Plate Count
Agar (Scharlau Chemie, 1-329, Barcelona, Spain) incubating samples for
72 hours at 31ºC. Yeast and molds were determined in Sabouraud
Chloramphenicol Agar (Scharlau Chemie, 1-166, Barcelona, Spain)
plates for 5 days at 31ºC. Samples were analyzed at 1,15,30 and 45 days
of storage. Plates were inoculated by triplicated. Microbial counts were
expressed as CFU/g.

III. Resultados
186
Sensorial Analysis
An acceptance test using a 9-point hedonic scale (ISO 4121, 2003;
ISO 5492, 2008) was used to evaluate the following attributes in the
samples: colour, flavour, texture, sweetness, global preference and
intention of buying. The panel consisted of 30 trained panellists (aged
from 20 to 50) who are regular consumers of this kind of dessert. Testing
was conducted in a sensory evaluation laboratory built according to the
international standards for test rooms. In this analysis the citrus jelly
formulated using sweeteners containing only isomaltulose (I) and
combination isomaltulose-oligofructose (I50O50), were not considered
because the other samples of jelly were of a better quality.
Statistical analysis
Analyses of variance (multifactor ANOVA) were carried out by
Statgraphics plus software (Statpoint Technologies, Inc., Centurion,
Warrenton, Virginia, USA) to discern whether the effect of formulation
or storage was significant on the citrus jelly studied. Interactions between
factors were also considered.
RESULTS AND DISCUSSION
Compositional characterisation of citrus jelly
Table 1 shows the results of solids soluble content (Brix), moisture
content (xw), and water activity (aw), pH, and antioxidant capacity of the
jelly formulations with sucrose or new sweeteners (tagatose,
oligofructose and isomaltulose). Initially, all jelly desserts reached a
concentration of soluble solids around 22 Brix, but formulation that
contained only oligofructose (O) had the highest values of ºBrix
(≈23 Brix) unlike formulations contaning only isomaltulose (I) or
tagatose (T) that showed the lowest values of ºBrix (≈21 Brix).

III. Resultados
187
Table III.8.1. Values for, brix, moisture content (xw), pH, water activity (aw) and antioxidant capacity of citrus jelly formulated
with sucrose (control) or with new sweeteners (isomaltulose, oligofructose and tagatose), initially, 15 days, 30 days and after 45
days of storage.
Equal letters indicate homogeneous groups.
FORMULATION TIME
(days)
xw
(g water/
g marmalade)
ºBRIX pH aw
ANTIOXIDANT
CAPACITY
(mg Trolox/
100 g Jelly)
CONTROL
1 0.785±0.001a 21.4±0.1b 3.383±0.006a 0.9846±0.0002c 53.2±0.4d
15 0.785±0.004a 21.8±0.2 b 3.543±0.006b 0,9819±0.0001a 30.6±1.4bc
30 0.911±0.07a 21.5±0.5 b 3.523±0.006b 0.9839±0.0002b 26.8±1.1b
45 0.817±0.002a 21.43±0.12b 3.51±0.02b 0.9848±0.0002c 19.2±0.1a
T
1 0.792±0.004a 21.1±0.1b 3.367±0.006a 0.9894±0.0004d 61.6±1.8d
15 0.64±0.29a 20.7±0.3a 3.533±0.012b 0.9829±0.0002b 32.1±2.2bc
30 0.88±0.02a 22.2±0.3bc 3.637±0.006d 0.984±0.0001c 28.8±2.0b
45 0.804±0.005a 22.8±0.3c 3.64±0.01d 0.9851±0.0001d 19.1±0.2a
I50T50
1 0.78±0.01a 22.5±0.006c 3.677±0.006d 0.9855±0.0002c 57.7±5.9d
15 0.793±0.003a 21.5±0.1b 3.55±0,01b 0.983±0.0003b 27.4±1.5b
30 0.91±0.05a 21.3±0.3b 3.62±0.03c 0.984±0.0001c 25.4±1.2b
45 0.817±0.003a 20.7±0.3a 3.54±0.01b 0.9826±0.0004b 19.6±1.0a

III. Resultados
188
(Cont.)Table III.8.1. Values for, brix, moisture content (xw), pH, water activity (aw) and antioxidant capacity of citrus jelly
formulated with sucrose (control) or with new sweeteners (isomaltulose, oligofructose and tagatose), initially, 15 days, 30 days
and after 45 days of storage.
Equal letters indicate homogeneous groups.
FORMULATION TIME
(days)
xw
(g water/
g marmalade)
ºBRIX pH aw
ANTIOXIDANT
CAPACITY
(mg Trolox/
100 g Jelly)
I
1 0.809±0.004a 21.1±0.1b 3.527±0.006b 0.986±0.0001c 53.9±1.7d
15 0.804±0.013a 20.6±0.2a 3.487±0.006b 0.9856±0.0004c 36.2±1.2cd
30 0.88±0.04a 20.5±0.2a 3.53±0.02b 0.9826±0.0002b 34.6±1.0cd
45 0.818±0.003a 21.2±0.1b 3.52±0.01b 0.9804±0.0003 a 18.8±0.3a
O
1 0.775±0.003a 23.2±0.1c 3.64±0.01d 0.9886±0.0001d 52.5±1.3d
15 0.775±0.004a 23.03±0.06c 3.61±0.01c 0.9868±0.0003c 30.9±2.5bc
30 0.88±0.04a 22.63±0.15c 3.587±0.006c 0.9866±0.0001c 26.6±2.4b
45 0.82±0.07a 22.57±0.12c 3.593±0.006c 0.9872±0.0003c 17.9±0.2a
I50O50
1 0.811±0.048a 21.37±0.06b 3.543±0.006b 0.9885±0.0001d 54.7±0.1d
15 0.866±0.143a 21.23±0.06b 3.527±0.006b 0.9829±0.0003b 30.9±2.5cd
30 0.897±0.005a 21.2±0.3b 3.51±0.02b 0.9831±0.0002b 31.7±0.4cd
45 0.81±0.02a 21.3±0.2b 3.52±0.02b 0.9826±0.0004b 18.2±0.3a

III. Resultados
189
The storage decreased significantly ºBrix of formulation I50T50 but
they increased in formulation T, being control and I50O50 the most
stable formulations. Consequently, tagatose would be responsible for the
variation of the soluble solid content over time. These results are in
accordance our previous study carried out with watermelon jelly
formulated with isomaltulose and tagatose (Rubio-Arraez et al., 2015),
where jelly formulated only with tagatose showed initially around 15
Brix but there was an increase at the end of storage (15 days) remaining
constant the soluble solid content (≈16 Brix) in control samples
formulated only with sucrose.
In terms of moisture content, there were no significant differences due
to formulation and only after 30 days of storage there was a significant
increased but moisture content was the same as initially after 45 days in
all cases. Besides, values of water activity were always 0.98, although
formulation T showed the highest aw initially. However, over the storage
time there was a significant decrease in aw in almost all cases especially
in formulation I. Again, the pH was very similar in all formulations of
jelly, but it initially was lower in formulation T and control jelly,
althougth all jellies presented similar values after 45 days of storage.
As can be seen in table 1 initially all samples of jelly prepared with
citrus juice showed the same antioxidant capacity except for I50T50 and
T jellies which had the highest values due to their content in tagatose,
which would be responsible for this behaviour. However, in all cases
there was a significant reduction of the antioxidant capacity over the
storage period considered, reaching similar values after 45 days for all
formulations. Nevertheless, in a previous study carried out in watermelon
jelly (Rubio-Arraez et al., 2015), isomaltulose and tagatose and storage
enhanced its levels of antioxidant capacity.

III. Resultados
190
Optical properties
The interaction charts of the colorimetric coordinates L*, a* and b*,
chroma (C*) and hue (h*) of the citrus jellies considering as factors the
formulation of sucrose/sweeteners used and the storage time are shown in
Figure 2. Initially control jelly desserts had more similarities in terms of
luminosity with samples containing tagatose, but for coordinates a* and
b* and for chroma formulation I50O50 was closed to control jelly. It was
also observed that the citrus jelly formulated with tagatose (T and
I50T50) showed an increase of their luminosity after 45 days of storage
time in contrast with the decrease observed in formulations with
isomaltulose and the combination of isomaltulose with oligofructose (I
and I50O50) at the end of storage.
Coordinate a* in jellies containing only oligofructose or isomaltulose
was the most stable in time but coordinate b* increased over time in
formulation I whereas it decreased in formulation O. At the end of
storage a*, b* and C* of the new formulations of jellies were lower than
in control jellies, except for a* of formulation I50T50 which was equal to
the control jelly. In terms of h*, it was noteworthy that all formulations
showed values around the results of the control jelly, being formulation I
above control jelly in the whole period of storage and formulation O the
most similar to control jelly.
Mechanical properties
Figure 3 shows the average curves of the TPA analysis carried out on
the samples of jelly used in this study. Moreover, Figure 4 shows the
interaction charts (a significant level of 95%) of the mechanical
parameters. As can be seen, initially the curves obtained for O jelly
(formulated only with oligofructose), showed more pronounced peaks
than the other samples and consequently they had the highest values of
hardness without statistical differences respect to citrus jelly formulated
with tagatose (T and I50T50), whereas samples prepared with
isomaltulose showed the lowest hardness.

III. Resultados
191
Figure III.8.2. Interaction graphics (95% of significant level) of colour
parameters: L*, a*, b* coordinates, chroma (C*) and hue (h*) of the
citrus jelly as a function of the formulation and storage time.
Interactions and 95,0 Percent LSD Intervals
TIME (Days)
32
34
36
38
40
L*
1 15 30 45
FORMULATION
Control
I
T
O
I50T50
I50O50
Interactions and 95,0 Percent LSD Intervals
TIME (Days)
32
34
36
38
40
L*
1 15 30 45
FORMULATION
Control
I
T
O
I50T50
I50O50
Interactions and 95,0 Percent LSD Intervals
TIME (Days)
4
5
6
7
8
9
a*
1 15 30 45
FORMULATION
Control
I
T
O
I50T50
I50O50
Interactions and 95,0 Percent LSD Intervals
TIME (Days)
23
25
27
29
31
33
b*
1 15 30 45
FORMULATION
Control
I
T
O
I50T50
I50O50
Interactions and 95,0 Percent LSD Intervals
TIME (Days)
23
25
27
29
31
33
C*
1 15 30 45
FORMULATION
Control
I
T
O
I50T50
I50O50
Interactions and 95,0 Percent LSD Intervals
TIME (Days)
73
74
75
76
77
78
79
h*
1 15 30 45
FORMULATION
Control
I
T
O
I50T50
I50O50

III. Resultados
192
Figure III.8.3. Representative curves of TPA test for citrus jelly studied as a function of sweeteners used in its formulation
initially (A), at 15 days (B), at 30 days (C) and after 45 days of storage (D).
-5
0
5
10
15
20
25
0 10 20 30 40 50 60
Fo
rce
(N)
Time (s)
Control I T O I50T50 I50O50
C
-5
0
5
10
15
20
25
0 10 20 30 40 50 60
Force (N
)
Time (s)
Control I T I50T50 I50O50 O
A
-5
0
5
10
15
20
25
0 10 20 30 40 50 60
Force (N
)
Time (s)
Control I T I50T50 I50O50 O
B
-5
0
5
10
15
20
25
0 10 20 30 40 50 60 70F
orce (N
)
Time (s)
Control I T I50T50 I50O50 O
DC
-5
0
5
10
15
20
25
0 10 20 30 40 50 60
Force (N
)
Time (s)
Control I T O I50T50 I50O50
A

III. Resultados
193
Figure III.8.4. Interaction graphics (95% of significant level) of
hardness, adhesiveness, cohesiveness, gumminess and springiness of
citrus jelly as a function of the formulation and storage time.
Besides, the second peak of control jelly was placed on the right of the
others formulations. After 15 days of storage, the O jelly curve was
overcome by the control jelly curve and its second peak was shifted to the
right. However at 30 days of storage the second peaks of all formulation
were placed together. Additionally, formulations with only tagatose (T)
and oligofructose (O) showed highest peaks at the end of the storage (45
days). Even though, factor time did not have a significant effect on most
of the mechanical parameters analyzed in these jellies.
HA
RD
NE
SS
Interactions and 95,0 Percent LSD Intervals
TIME (Days)
-3
2
7
12
17
22
27
HA
RD
NE
SS
1 15 30 45
FORMULATION
Control
I
T
O
I50T50
I50O50
Interactions and 95,0 Percent LSD Intervals
TIME (Days)
-3
2
7
12
17
22
27
HA
RD
NE
SS
1 15 30 45
FORMULATION
Control
I
T
O
I50T50
I50O50
Interactions and 95,0 Percent LSD Intervals
TIME (Days)
0
0,2
0,4
0,6
0,8
1
1,2
SP
RIN
GIN
ES
S
1 15 30 45
FORMULATION
Control
I
T
O
I50T50
I50O50
GU
MM
INE
SS
AD
HE
SIV
EN
ES
S
0.8
0.6
0.4
0.2
Interactions and 95,0 Percent LSD Intervals
TIME (Days)
0
0,2
0,4
0,6
0,8
CO
HE
SIV
EN
ES
S
1 15 30 45
FORMULATION
Control
I
I50O50
O
T
I50T50
0
0.2
0.4
0.6
0.8
1
0
Interactions and 95,0 Percent LSD Intervals
TIME (Days)
0
0,2
0,4
0,6
0,8
1
1,2
SP
RIN
GIN
ES
S
1 15 30 45
FORMULATION
Control
I
I50O50
O
T
I50T50
1.2
Interactions and 95,0 Percent LSD Intervals
TIME (Days)
-17
-13
-9
-5
-1
AD
HE
SIV
INE
SS
1 15 30 45
FORMULATION
Control
I
T
O
I50T50
I50O50
Interactions and 95,0 Percent LSD Intervals
TIME (Days)
0
0,2
0,4
0,6
0,8
CO
HE
SIV
INE
SS
1 15 30 45
FORMULATION
Control
I
T
O
I50T50
I50O50
Interactions and 95,0 Percent LSD Intervals
TIME (Days)
0
1
2
3
4
5
GU
MM
INE
SS
1 15 30 45
FORMULATION
Control
I
T
O
I50T50
I50O50

III. Resultados
194
However, the formulation composed by isomaltulose and
oligofructose (I50O50) showed the highest values of adhesiveness.
Besides, cohesiveness and springiness were also higher in that
formulation and when there was only isomaltulose in the sweetener
content of jelly (I). In contrast, gumminess was very low in formulation
I50O50. Therefore, the most similar jellies to control samples were those
prepared only with oligofructose (O) or tagatose (T) or the mixture of
isomaltulose and tagatose (I50T50).
Microbiological analysis
Microbial counts of mesophilic aerobics, yeasts and moulds were not
found in any of the citrus jelly at 1, 15, 30 days during storage. However,
at the end of storage (45 days) there were presence of mesophilic
aerobics, yeasts and moulds, except for the formulation that only contain
oligofructose. According to Pascual & Calderón (2000), the microbial
counts must not exceed 5·102 CFU/g mesophilic aerobics and 5·101 CFU
/g yeasts and moulds. Even though, the microbial count was low (3·101
CFU/g mesophilic aerobics and 2·101 CFU /g yeasts and moulds) after 45
days in all cases. These results evidence that the product is
microbiologically stable for the studied period. The microbiological
stability of the samples could be attributed to the acidity of citrus juice
which gave place to a low pH (3.5) in citrus jellies.
Sensory analysis
The results of sensory analysis of citrus jelly, depending on their
formulation (control, T, I50T50, O), are presented in Figure 5. As can be
seen, O and I50T50 formulations showed the highest scores in all
attributes, although no significant differences were found in colour,
aroma and texture among the samples formulated with new sweeteners.
Moreover, T and I50T50 formulations showed the highest sweetness, due
to their higher content of tagatose. This would be according with the
recommendations given by the manufacturer of the commercial tagatose
(two tablespoons of sucrose provides the same sweetness as one

III. Resultados
195
tablespoon of tagatose), though as was mentioned in the introduction,
tagatose should have similar sweetening power to sucrose (Oh 2007;
Taylor et al. 2008; Calzada-León et al. 2013). It is noteworthy that the
global preference and intention of buying of jelly formulated with equal
proportion of tagatose and isomaltulose (I50T50) presented the better
score. These results are in accordance with our others studies carried out
in watermelon jelly (Rubio-Arraez et al., 2015). Therefore, the
replacement of sucrose by a mixture of isomaltulose and tagatose in equal
proportion would be feasible from a sensory point of view.
Figure III.8.5. Sensory assessment of citrus jelly as a function of the
formulation. Level of significance (ns) of the ANOVA considering all
jelly: *ns: 95%.
CONCLUSIONS
The reformulation of citrus jelly with non-cariogenic and low
glycemic index sweeteners used in this research is viable. Besides,
tagatose favoured the antioxidant capacity of citrus jelly initially, but not
differences among all formulations were found after storage. In general,
at the end of storage coordinates a*, b* and chrome of the new
formulations of jellies were lower than in jellies with sucrose.
0
3
6
9Colour
Arome
Texture
Sweetness
Global
acceptance*
Intention of
buying*
Control T 0 I50T50

III. Resultados
196
From the mechanical point of view the recommended formulations
would be oligofructose (O) or tagatose (T) or the mixture of isomaltulose
and tagatose (I50T50). In citrus jellies with only oligofructose there was
no microbial presence in the considered storage period. According to
sensorial analysis, I50T50 was the best scored jelly.
ACKNOWLEDGEMENTS
The authors would like to thank the Serigó-Andrés family for donating
the raw materials, and also the GVA projects GV/2013/029,
GV/2014/012 as well as the Universitat Politècnica de València (Spain)
for the financial support given to this research study (UPV PAID-06-12
SP20120889).
REFERENCES
Álvarez, J., Pastoriza, S., Alonso-Olalla, R., Delgado-Andrade, C., &
Rufián-Henares J.A. (2014). Nutritional and physicochemical
characteristic of commercial Spanish citrus juices. Food Chemistry,
164, 396–405.
AOAC. (2000). Official Methods of Analysis of AOAC International
(17th ed.). Gaithersburg, MD, USA.
Bourne, M.C. (1978).Texture profile analysis. Food technology, 32,
62–66.
Balasundram N, Sundram K, & Samman S. (2006). Phenolic compounds
in plants and agri-industrial by-products: antioxidant activity,
occurrence, and potential uses. Food Chemistry, 99,191−203.
Calzada-León, R., Ruiz-Reyes, M.L., Altamirano-Bustamante, N., &
Padrón-Martínez, M.M. (2013). Features of the noncaloric sweeteners
and their use in children. Acta Pediátrica de México, 34(3), 141–153.
Chacón-Villalobos, A. (2006). Current Perspectives agribusiness
oligofructosaccharides (FOS). Agronomía Mesoamericana, 17(2),
265-286.

III. Resultados
197
De Oliva-Neto, P., & Menão, P.T.P. (2009). Isomaltulose production
from sucrose by Protaminobacter rubrum immobilized in calcium
alginate. Bioresource Technology, 100,252–4256.
Dhuique-Mayer, C., Caris-Veyrat, C., Ollitrault, P., Curk, F., & Amiot,
M.J. (2005). Varietal and interspecific influence on micronutrient
contents in citrus from the Mediterranean area. Journal Agriculture
and Food Chemistry, 53, 2140−2145.
Donner, T.W., Magder, L.S., &Zarbalian, K. (2010). Dietary
supplementation with D-tagatose in subjects with type 2 diabetes leads
to weight loss and raises high-density lipoprotein cholesterol.
Nutrition Research, 30, 801–806.
Edwards, W.P. (2002). The science of goodies. Acribia. S.A., Zaragoza.
Spain.
Food and Drug Administration (FDA). (2001). GRAS Notification
Tagatose. GRN No.78. Available at: http://www.fda.gov/ucm/
groups/fdagov-public/@fdagov-foods-gen/documents/document/ucm
261321.pdf . Accessed 2015 May.
Food and Drug Administration (FDA). (2005). GRAS Notification
Isomaltulose (PALATINOSE). Available at: http://www.fda.gov/
ucm/groups/fdagov-public/@fdagovfoodsgen/documents/document/
ucm268989.pdf . Accessed 2015 May.
Food and Drug Administration (FDA). (2010). GRAS Notification
Tagatose. GRN No.352. Available at: http://www.fda.gov/ucm/
groups/fdagov-public/@fdagov-foods-gen/documents/document/ucm
269560.pdf. Accessed 2015 May.
Food and Drug Administration (FDA). (2011). GRAS Notification
Oligofructose. GRN No.392. Available at: http://www.fda.gov/ucm/
groups/fdagov-public/@fdagov-foodsgen/documents/document/ucm
277112.pdf. Accessed 2015 May.
FAOSTAT. (2013). Production data, yield and harvested area of citrus
fruits. Available at: http://faostat3.fao.org/ browse/Q/QC/S
Accessed 2015 May.

III. Resultados
198
Gelatine Manufactured Europe (GME). (2015a). Gelatine Properties.
Available at http://www.gelatine.org/en/about-gelatine/properties.
html. Accessed 2015 May.
Gelatine Manufactured Europe (GME). (2015b). All about Gelatine.
Available at http://www.gelatine.org/fileadmin/user_upload/
downloads/press/publications_downloads/GME_all_about_gelatine_e
n.pdf . Accessed 2015 May.
ISO 4121. (2003). Sensory analysis. Guidelines for the use of quantitative
response scales. International Organization for Standardization.
Geneva, Switzerland.
ISO 8589. (2007). Sensory analysis. General guidance for the design of
test rooms. International Organization for Standardization. Geneva,
Switzerland.
ISO 5492. (2008). Sensory analysis. Vocabulary. International
Organization for Standardization. Geneva, Switzerland.
Ledur, M.J., Tessaro, I., & Zapata, C.P. (2013). Physicochemical
characterization of Saccharides Powder Obtained from Yacon Roots
(Smallanthus sonchifolius) by Membrane Technology. Brazilian
Archives of Biology and Technology, 56(6), 1024–1033.
Levin, G.V. (2002). Tagatose, the new GRAS sweetener and health
product. Journal of Medical Food, 5(1), 23–36.
Lina, B.A.R., Jonker, G., & Kozianowski, G. (2002). Isomaltulose
(Palatinose review of biological and toxicologycal studies). Food and
Chemical Toxicology, 40(10), 1375–381.
Navarro, P., Pérez-López, A. J., Mercader, M. T., Carbonell-Barrachina,
A. A., & Gabaldón, J.A. (2011). Antioxidant activity, color,
carotenoids composition, minerals, vitamin C and sensory quality of
organic and conventional mandarin juice, cv. Orogrande. Food
Science and Technology International, 17, 241–248.
O'Donnell, K. & Kearsley, M., (2012). Sweeteners and Sugar
Alternatives in Food Technology (2th ed.). Wiley-Blackwell (Eds.),
Chichester, West Sussex, U.K.
Oh, D.K. (2007). Tagatose: properties, applications, and biotechnological
processes. Applied Microbiology and Biotechnology, 76(1), 1–8.

III. Resultados
199
Pacual, M.R. & Calderón-Pascual, V. (2000). Food Microbiology.
Analytical Methodology for Foods and Drinks. (2rd Edition). Diaz de
Santos (Ed.), Madrid, Spain.
Peinado, I., Rosa, E., Heredia, A., & Andrés, A. 2012. Rheological
characteristics of healthy sugar substituted spreadable strawberry
product. Journal Food of Engineering, 113(3), 365–373.
Periche, A., Heredia, A., Escriche, I., Andrés, A., & Castelló, M.L.
(2014). Optical, mechanical and sensory properties of based-
isomaltulose gummy confections. Food Biosicience, 7, 37–44.
Petersen-Skytte U. (2006). Tagatose. In: Sweeteners and sugar
alternatives in food technology (Mitchell, H., ed.) pp. 262–292,
Blackwell Publishing, Oxford, UK.
Pimentel, T.C., Madrona, G.S. & Prudencio, S.H. (2015). Probiotic
clarified apple juice with oligofructose or sucralose as sugar
substitutes: Sensory profile and acceptability. LWT – Food Science
Technology, 62(1), 838–846.
Rubio-Arraez, S., Benavent, C., Capella, J.V., Castelló, M.L., & Ortolá,
M. D. 2015. Characterization of watermelon jelly with non-cariogenic
sweeteners. Food Chemistry. In press.
Shahidi, F., Liyana-Pathirana, C.M., & Wall, D.S. (2006). Antioxidant
activity of white and black sesame seeds and their hull fractions. Food
Chemistry, 99(3), 478–483.
Sloan, A.E. (2005). Healthy vending and other emerging trends. Food
Technology, 59(2), 26–35.
Schiweck, H., Munir, M., Rapp, K., Schenider, B., & Bogel, M. (1990).
New developments in the use of sucrose as an industrial bulk
chemical. Zuckerindustrie, 115,555–565.
Taylor, T.P., Fasina, O., & Bell, L.N. (2008). Physical properties and
consumer liking of cookies prepared by replacing sucrose with
tagatose. Journal of Food Science, 73(3), 145–151.
Van Den Heuvel, E.G.H.M., Muys, T., Van Dokkum, W. & Schaafsma,
G. (1999). Oligofructose stimulates calcium absorption in
adolescents. American Journal of Clinical Nutrition, 69, 544–548.

III. Resultados
200
Vastenavond, C.M., Bertelsen, H., Hansen, S.J., Laursen, R.S., Saunders,
J., & Eriknauer, K. (2012). Tagatose (D-tagatose). In: Nabors L, (ed.).
Alternative sweeteners, 13, (pp.197–222). Boca Ratón, Florida, USA.
Weihrauch, M.R., & Diehl, V. (2004). Artificial sweetener—do they bear
a carcinogenic risk? Annals of Oncology, 15(10), 1460–1465.
World Health Organization (WHO). (2014). Consultation sugar guideline
http://www.who.int/mediacentre/news/notes/2014/consultation-sugar-
guideline/en/ Accessed 2015 May.


IV. CONCLUSIONES


IV. Conclusiones
201
IV.CONCLUSIONES
IV.1. Cinética de deshidratación osmótica de rodajas de naranja
utilizando edulcorantes saludables.
Se ha comprobado que el extracto acuoso de stevia aumenta la
concentración de sólidos solubles en estos productos.
Los resultados pusieron de manifiesto que tanto la incorporación de
stevia como de oligofructosa en los jarabes aumentó la pérdida de
masa total y de masa de agua de las rodajas de naranja.
El ajuste de la ecuación de Fick fue mejor cuando se utilizó la
combinación de isomaltulosa y extracto acuoso de stevia.
La difusividad efectiva de sólidos solubles fue mayor en las muestras
deshidratadas utilizando la combinación de isomaltulosa-
oligofructosa, lo que demuestra que la concentración de azúcares sería
más rápida.
IV.2. Modelización de la deshidratación osmótica de rodajas de limón
utilizando nuevos edulcorantes.
En las muestras deshidratadas osmóticamente con isomaltulosa se
favoreció la pérdida de masa total, sin embargo en las muestras
sometidas a la tagatosa como agente osmótico sucedió lo contrario.
La concentración de sólidos solubles alcanzados por las muestras
deshidratadas con tagatosa sería menor que en el caso de los otros
edulcorantes y además sería alcanzado más lentamente.
La combinación de oligofructosa, extracto acuoso de stevia y tagatosa
como agentes osmóticos, muestran una mayor concentración de
sólidos solubles.
La difusividad efectiva en rodajas de limón fue mayor en la
combinación de oligofructosa y extracto acuoso de stevia.

IV. Conclusiones
202
IV.3. Influencia de los edulcorantes saludables (tagatosa y
oligofructosa) sobre sus características fisicoquímicas en mermelada de
naranja.
La reformulación de mermelada de naranja con edulcorantes
saludables como tagatosa y oligofructosa es factible.
La mermelada de naranja formulada con igual proporción de la
tagatosa y oligofructosa presentó mayor consistencia y su
componente elástica aumentó con el tiempo.
Las mermeladas elaboradas con oligofructosa mejoraron su capacidad
antioxidante en comparación con la mermelada control. A su vez,
presentaron ligeros cambios en el color, reduciendo su luminosidad
durante el tiempo de almacenamiento.
Las mermeladas resultaron estables microbiológicamente, durante
todo el tiempo de almacenamiento.
En relación al análisis sensorial, las formulaciones A (con igual
proporción de tagatosa y oligofructosa), y B (30% oligofructosa y
70% tagatosa) presentaron las mejores calificaciones en todos los
atributos.
IV.4. Caracterización de mermeladas de limón elaboradas con
edulcorantes saludables (isomaltulosa y tagatosa).
La reformulación de mermelada de limón con edulcorantes no
cariogénicos, tales como isomaltulosa y tagatosa es posible.
La capacidad antioxidante de las nuevas formulaciones disminuyó con
el almacenamiento.
La combinación de los nuevos edulcorantes redujo ligeramente los
valores de los parámetros reológicos con respecto a las muestras con
sacarosa.
Las mermeladas de limón con una mayor proporción de isomaltulosa
en su formulación, inicialmente presentaron alta luminosidad y tono
en comparación con el resto, pero con el tiempo pardearon.
Todas las mermeladas fueron microbiológicamente estables durante
el período de almacenamiento considerado.

IV. Conclusiones
203
Las mermeladas de limón elaboradas con tagatosa obtuvieron mejores
puntuaciones en el análisis sensorial, debido a su alto poder
edulcorante.
IV.5. Efecto de isomaltulosa y tagatosa como sustitutos de la sacarosa
en mermeladas de mandarina.
Es posible reformular las mermeladas de mandarina con edulcorantes
no cariogénicos como isomaltulosa y tagatosa.
Las muestras elaboradas sólo con tagatosa mostraron diferencias
significativas en el comportamiento reológico, dando lugar a un
carácter menos elástico y menor consistencia que el control.
Se produjo una mejora en la luminosidad y la capacidad antioxidante
en mermeladas con mayor contenido en tagatosa a lo largo del
almacenamiento
La muestra formulada únicamente con tagatosa obtuvo la mejor
puntuación en la aceptación global y la intención de compra de los
consumidores.
IV.6. Monitorización de mermeladas de mandarina durante la etapa
de almacenamiento, utilizando redes de sensores inalámbricas.
Las redes de sensores inalámbricas, son una herramienta muy valiosa
para disciplinas como la tecnología de alimentos. Se divisa un futuro
muy prometedor en la investigación debido al creciente número de
aplicaciones que pueden necesitar nuevos sensores cuyo objetivo es
asegurar la calidad de los alimentos.
Se ha propuesto un enfoque basado en redes robustas de sensores
inalámbricos con los requisitos específicos de flexibilidad,
escalabilidad, confiabilidad y facilidad de instalación y operación,
para la vigilancia y monitorización de alimentos almacenados,
concretamente en las mermeladas de mandarina.
Los resultados obtenidos en el análisis experimental coinciden con los
obtenidos mediante la monitorización de las mermeladas con la red de
sensores inalámbrica basada en la nueva arquitectura EDETA;
obteniéndose además numerosas ventajas adicionales, como la

IV. Conclusiones
204
posibilidad de obtener medidas en tiempo real y de forma remota,
obtener alarmas automáticas por parte del sistema, así como mucha
mayor información sobre el estado de las mermeladas (al obtener más
medidas) y un tratamiento automatizado de la misma.
En cuanto a los parámetros de temperatura, todas las mermeladas
muestran la misma tendencia y respecto al contenido en humedad, las
mermeladas cuya combinación era en igual proporción tagatosa e
isomaltulosa mostraron valores similares al control y al comercial.
Las mermeladas de mandarina permanecieron estables
microbiológicamente durante el tiempo de estudio (360 días).
En líneas futuras de investigación, son necesarios nuevos
transductores y sensores, con las características apropiadas para su
integración en una red de sensores (básicamente de reducido tamaño,
bajo coste y consumo), que posibiliten la monitorización de nuevos
parámteros, permitiendo extender la aplicación de esta propuesta.
IV.7. Caracterización de gelatinas de sandía elaboradas con
edulcorantes no cariogénicos (isomaltulosa y tagatosa).
La capacidad antioxidante de las gelatinas de sandía, aumentó sobre
todo en las gelatinas formuladas con sacarosa y con la combinación
isomaltulosa-tagatosa durante el tiempo de almacenamiento, pero sin
llegar a los mismos niveles que en la gelatina comercial debido a su
enriquecimiento con vitamina C.
Se confirma que los nuevos edulcorantes no afectaron a la textura
instrumental de la gelatina, permaneciendo estable en el tiempo al
igual que la gelatina control. Sin embargo, el color cambió
especialmente en la gelatina que contenía sólo tagatosa.
En cuanto al análisis sensorial la gelatina con la combinación en igual
proporción de isomaltulosa y tagatosa, logró los máximos resultados.
Por tanto es viable el uso de estos edulcorantes no cariogénicos en la
formulación de gelatinas.
IV. Conclusiones
205
IV.8. Influencia de los edulcorantes no cariogénicos (oligofructosa,
isomaltulosa y tagatosa) sobre sus características fisicoquímicas en
gelatinas de cítricos.
La reformulación de la composición de gelatinas de cítricos con
edulcorantes de bajo índice glicémico y no cariogénicos utilizados en
esta investigación es posible.
La capacidad antioxidante disminuyó con el tiempo de para todas las
muestras, sin embargo, la formulación de isomaltulosa y tagatosa
mostró la mejor puntuación entre todas las formulaciones.
Las gelatinas de cítricos formuladas con tagatosa, mostraron mayor
luminosidad a lo largo del tiempo de almacenamiento.
Las propiedades mecánicas de las gelatinas fueron muy similares, a
excepción de la gelatina I50O50 (en igual proporción isomaltulosa y
oligofructosa), con mayor adhesividad y gomosidad.
La estabilidad microbiológica se mantuvo hasta los 45 días,
manifestándose la presencia de mesófilos aerobios, levaduras y
mohos, en todas las gelatinas, a excepción de la gelatina formulada
únicamente con oligofructosa, que continuó inalterada más allá del
tiempo de estudio.
