yearly technical progress report
TRANSCRIPT
PRRC 02-21
YEARLY TECHNICAL PROGRESS REPORT
(7th Year – 2001-2002)
ADVANCED OIL RECOVERY TECHNOLOGIES FOR IMPROVED RECOVERY FROM SLOPE BASIN CLASTIC RESERVOIRS,
NASH DRAW BRUSHY CANYON POOL, EDDY COUNTY, NM
DOE Cooperative Agreement No. DE-FC-95BC14941
Strata Production Company P.O. Box 1030
Roswell, NM 88202 (505) 622-1127
Date of Report: October 31, 2001 Award Date: September 25, 1995 Anticipated Completion Date: September 24, 1998 - Budget Period I December 31, 2003 - Budget Period II Award Amount for Current Fiscal Year: $2,017,435 Award Amount for Budget Period II: $5,013,760 Name of Project Manager: Mark B. Murphy Contracting Officer’s Representative: Dan Ferguson Reporting Period: October 1, 2001-September 30, 2002 US/DOE Patent Clearance is not required prior to the publication of this document.

1
TABLE OF CONTENTS LIST OF FIGURES.......................................................................................................................... i OBJECTIVE.................................................................................................................................... 1 ABSTRACT.................................................................................................................................... 1 EXECUTIVE SUMMARY ............................................................................................................ 1 INTRODUCTION........................................................................................................................... 2 RESULTS AND DISCUSSION ..................................................................................................... 3
Reporting ............................................................................................................................ 3
Technology Transfer ........................................................................................................... 6 CONCLUSIONS............................................................................................................................. 6 REFERENCES................................................................................................................................ 7
LIST OF FIGURES
Figure 1. Nash Draw #36 toe zone completions. .......................................................................... 13
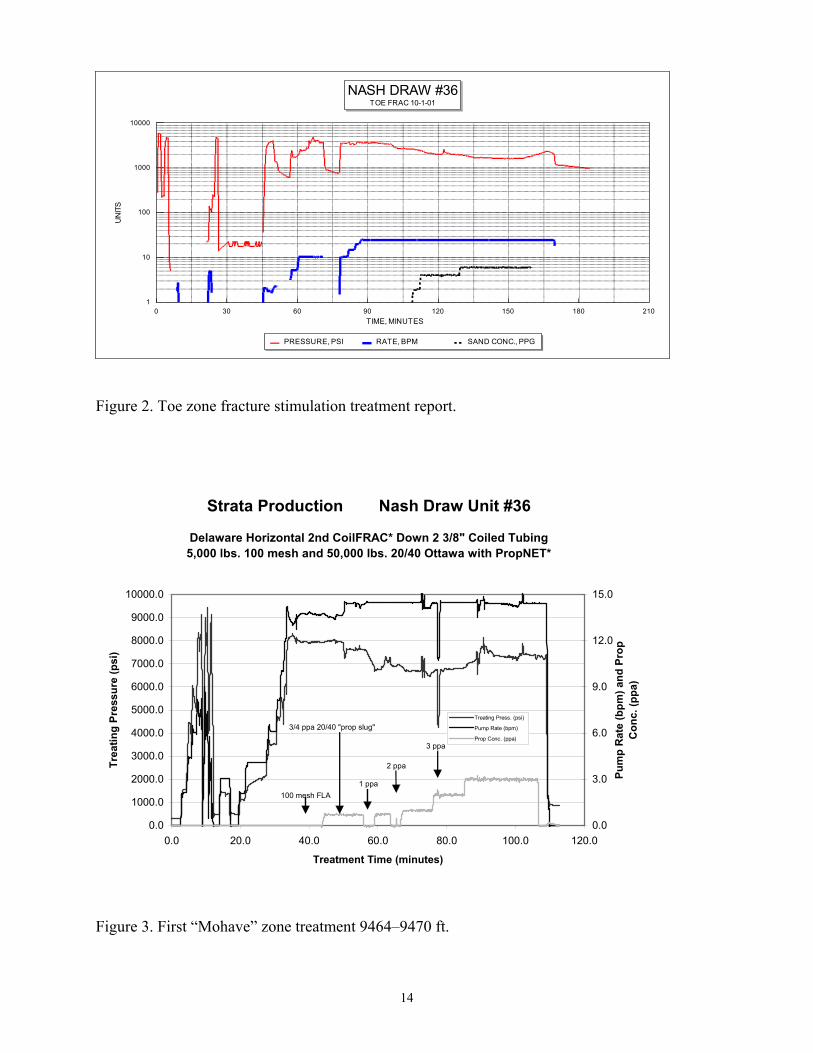
Figure 2. Toe zone fracture stimulation treatment report. ............................................................ 14
Figure 3. First “Mohave” zone treatment 9464-9470 ft ................................................................ 14
Figure 4. Second “Mohave” zone treatment 9123-9129 ft ........................................................... 15
Figure 5. Rock Stresses.. ............................................................................................................... 15
Figure 6. BHP test.. ....................................................................................................................... 16
Figure 7. Refrac treatment............................................................................................................. 16
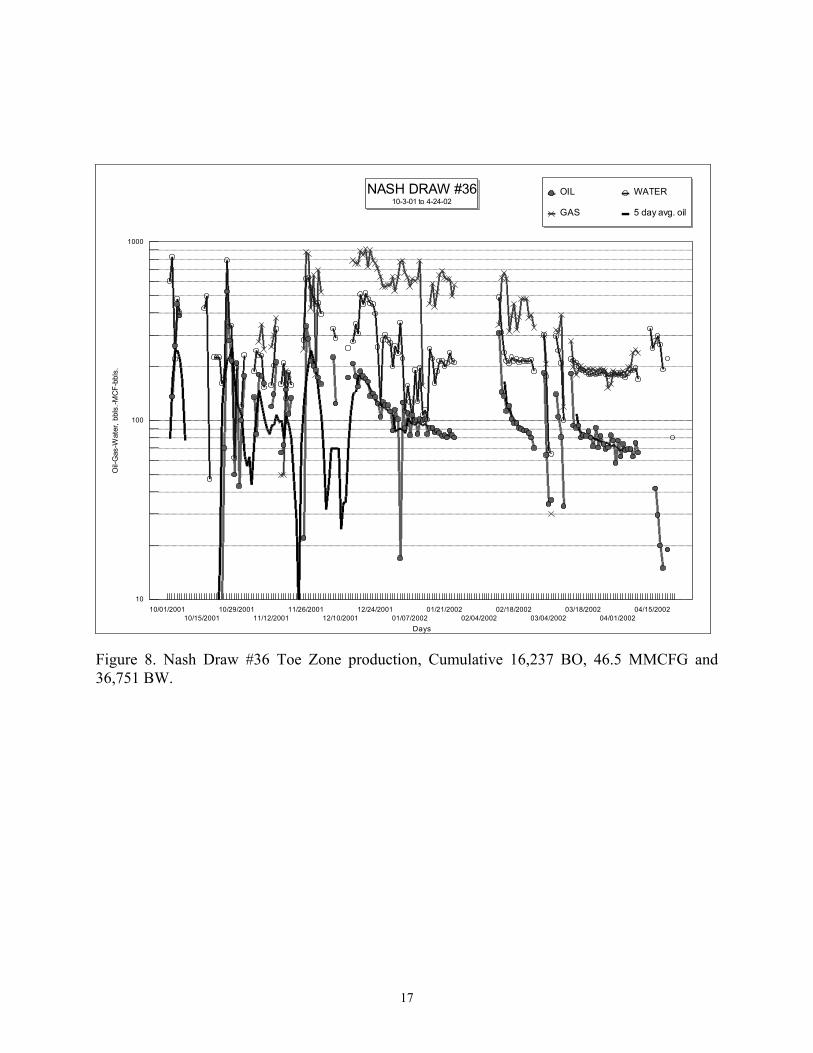
Figure 8. Nash Draw #36 toe zone production, cumulative 16,237 BO and 46.5 MMCFG.. ...... 17
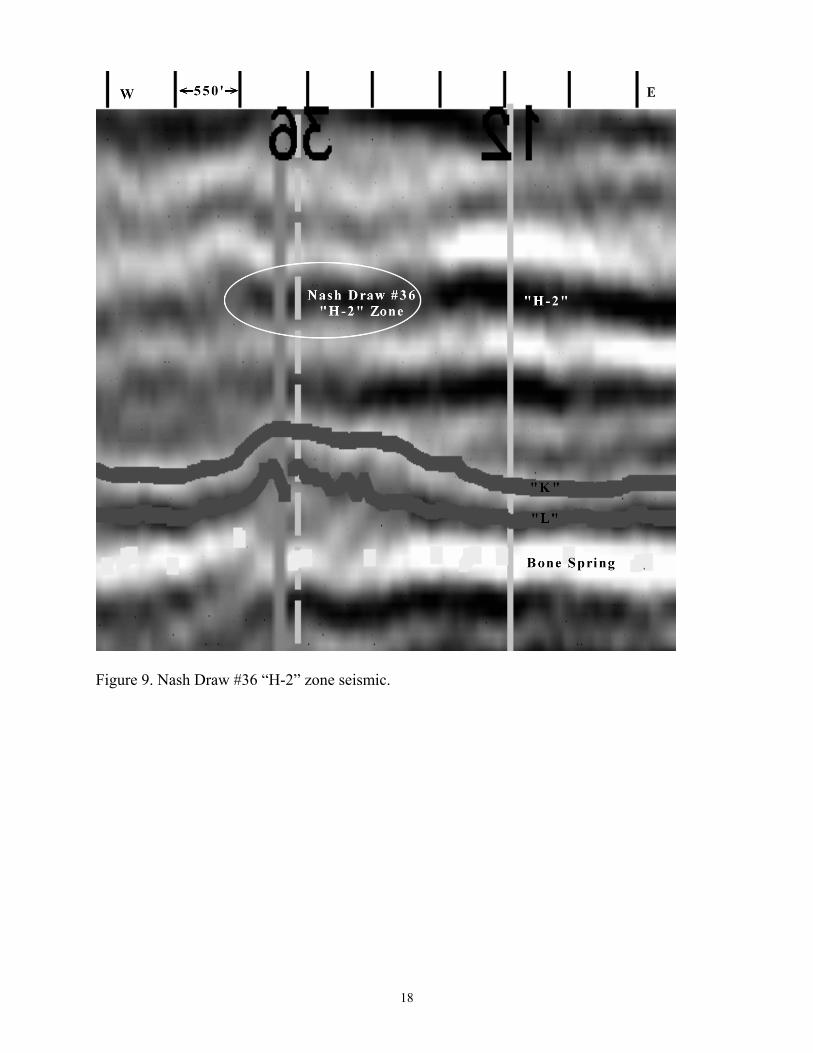
Figure 9. Nash Draw #36 “H-2” zone seismic. ............................................................................. 18
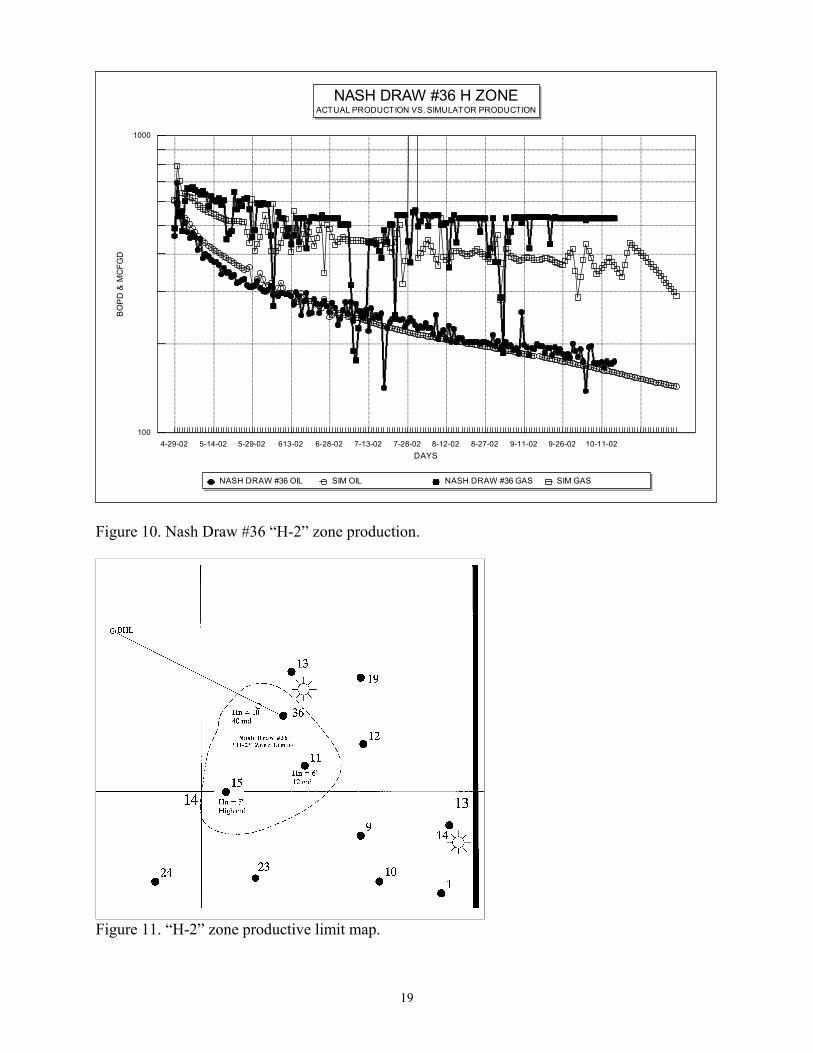
Figure 10. Nash Draw #36 “H-2” zone production....................................................................... 19
Figure 11. “H-2” zone productive limit map.. .............................................................................. 19
Figure 12. Nash Draw #33 “L” zone 3-D seismic amplitude map................................................ 20
Figure 13. Nash Draw #33 3-D view of the proposed well path................................................... 21
Figure 14. Final 3-D seismic survey design for the north end survey. ......................................... 22
2
OBJECTIVE The overall objective of this project is to demonstrate that a development program-based on advanced reservoir management methods-can significantly improve oil recovery at the Nash Draw Pool (NDP). The plan includes developing a control area using standard reservoir management techniques and comparing its performance to an area developed using advanced reservoir management methods. Specific goals are (1) to demonstrate that an advanced development drilling and pressure maintenance program can significantly improve oil recovery compared to existing technology applications and (2) to transfer these advanced methodologies to oil and gas producers in the Permian Basin and elsewhere throughout the U.S. oil and gas industry.
ABSTRACT
The Nash Draw Brushy Canyon Pool (NDP) in southeast New Mexico is one of the nine projects selected in 1995 by the U.S. Department of Energy (DOE) for participation in the Class III Reservoir Field Demonstration Program. The goals of the DOE cost-shared Class Program are to: (1) extend economic production, (2) increase ultimate recovery, and (3) broaden information exchange and technology application. Reservoirs in the Class III Program are focused on slope-basin and deep-basin clastic depositional types. Production at the NDP is from the Brushy Canyon formation, a low-permeability turbidite reservoir in the Delaware Mountain Group of Permian, Guadalupian age. A major challenge in this marginal-quality reservoir is to distinguish oil-productive pay intervals from water-saturated non-pay intervals. Because initial reservoir pressure is only slightly above bubble-point pressure, rapid oil decline rates and high gas/oil ratios are typically observed in the first year of primary production. Limited surface access, caused by the proximity of underground potash mining and surface playa lakes, prohibits development with conventional drilling. Reservoir characterization results obtained to date at the NDP show that a proposed pilot injection area appears to be compartmentalized. Because reservoir discontinuities will reduce effectiveness of a pressure maintenance project, the pilot area will be reconsidered in a more continuous part of the reservoir if such areas have sufficient reservoir pressure. Most importantly, the advanced characterization results are being used to design extended-reach/horizontal wells to tap into predicted "sweet spots" that are inaccessible with conventional vertical wells.
The activity at the NDP during the past year has included the completion of the NDP Well #36 deviated/horizontal well and the completion of additional zones in three wells, the design of the NDP #33 directional/horizontal well, The planning and regulatory approval for the north #-D seismic survey extension and the continued analysis of data.
EXECUTIVE SUMMARY
The use of the Advanced Log Analysis techniques developed from the NDP project have proven
3
useful in defining additional productive zones and refining completion techniques. The Advanced Log Analysis program proved to be especially helpful in locating and evaluating potential recompletion intervals, which has resulted in low development costs with only small incremental increases in lifting costs. To develop additional reserves at lower costs, zones behind pipe in existing wells were evaluated using techniques developed for the Brushy Canyon interval. Log analysis techniques developed in Phase I have been used to complete a total of thirteen of the NDP wells in uphole zones. Four wells were recompleted in 1999, which allowed the development of economical reserves during a period of low crude oil prices. An additional four wells were recompleted during 2000, which resulted in 123,462 BO and 453,424 MCFG reserves being added at a development cost of $1.57 per B.O.E. Two wells, #29 and #38 were recompleted in 2001 which added 7,000 BO and 18 MMCFG to the reserves at a cost of $9.70 per BOE. NDP Wells #1, #15 and #20 were completed in uphole zones during August and September 2002. Initial results from the three most current workovers appear encouraging and economic analysis will be available next quarter. Based on the technical and economic success of the thirteen workovers, other project wells are being evaluated for completions in shallower zones. The NDP #36 well toe zone was completed in October 2001, then restimulated in April 2002. During the workover an additional zone in the deviated section of the well was added. Cumulative production through September 2002 is 57,701 BO, 124.5 MMCFG and 45,862 BW. Continued interpretation of the original 3-D seismic survey using the results from drilling NDP Well #36 has resulted in a more complete characterization of the Brushy Canyon reservoir. A new seismic survey has been designed for the north end of the NDP. This new survey will overlap the original survey in an attempt to determine undrained areas that are not pressure depleted. Results of the new survey will be instrumental in identifying regions of the reservoir that will be targeted with deviated/horizontal wells.
INTRODUCTION
The Nash Draw Pool (NDP) in Eddy County, New Mexico produces oil and associated gas from the Permian (Guadalupian) Brushy Canyon Formation. The Brushy Canyon is a relatively new producer in the Delaware Basin of West Texas, with most drilling having occurred since the late 1980s and many discoveries occurring in the 1990s. Regionally, the fine-grained sandstones of the Brushy Canyon contain as much as 400-800 MMbbls of oil-in-place and thus this formation represents a significant reservoir interval in the Permian Basin. However, low permeability and petrophysical heterogeneity limit primary recovery to only 10-16%.
The NDP is one of the project sites in the Department of Energy (DOE) Class III field demonstration program for slope-basin clastic reservoirs. The objective of the NDP Class III project is to demonstrate that an advanced development drilling and pressure maintenance program can significantly improve oil recovery compared to existing technology applications. A further goal of the project is to transfer these advanced methodologies to oil and gas producers in the Permian Basin and elsewhere throughout the U.S. oil and gas industry.
4
In the first phase of the NDP project, an integrated reservoir characterization study was performed to better understand the nature of Brushy Canyon production and to explore options for enhanced recovery. Results obtained in the NDP project indicate that a combination of early pressure maintenance (gas injection) and secondary carbon dioxide flooding may maximize production in these complex, laterally variable reservoirs. Because of low permeabilities involved and high water-to-oil relative permeabilities, the use of gas instead of water is suggested as preferable as an oil-mobilizing agent.
Phase II is directed toward enhancing the ultimate recovery from the project. The plan includes directional/horizontal drilling of new wells in order to develop reserves under surface-restricted areas and potash mines and evaluation of prospects of early pressure maintenance.
RESULTS AND DISCUSSION
This is the seventh annual progress report on the project. Results obtained in the first five years of the project are discussed in previous annual reports1-6 and in technical papers.7-14 Results obtained during this reporting period are summarized in this progress report. Reporting
Early in the current project year, the Sixth Annual Technical Progress Report was prepared and submitted to the DOE. Four quarterly reports have been prepared and submitted for the period September 25, 2001 through September 25, 2002. Well Drilling and Completions
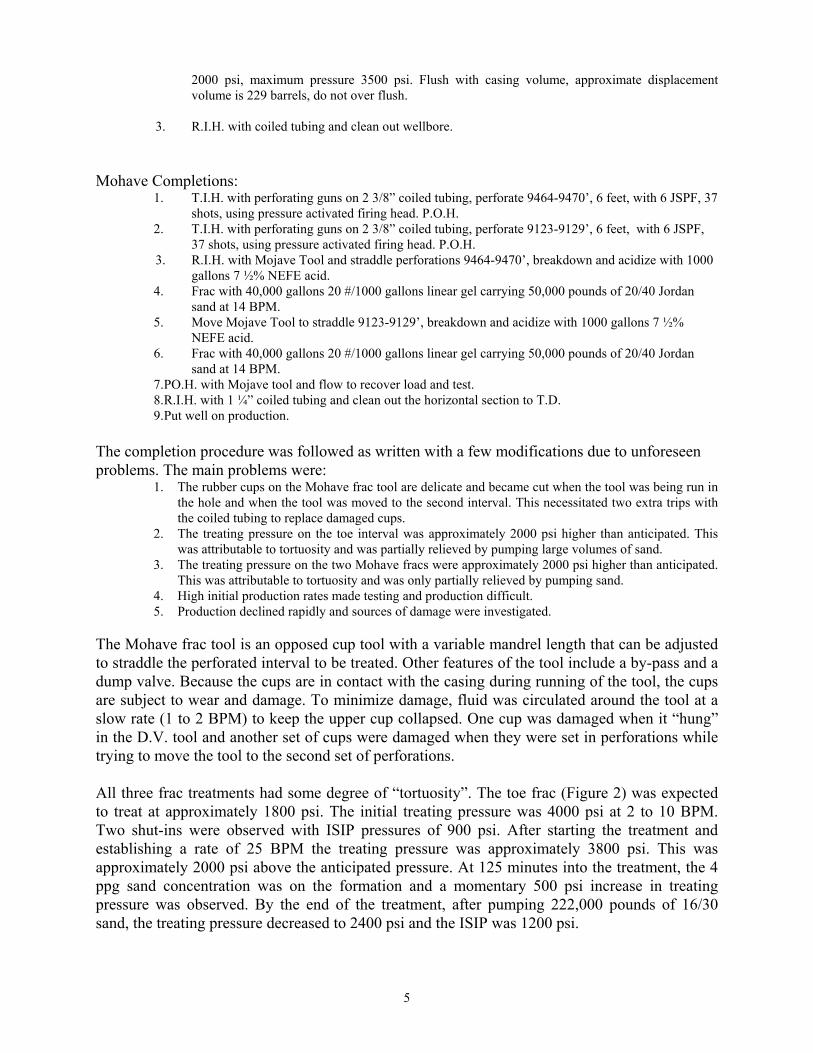
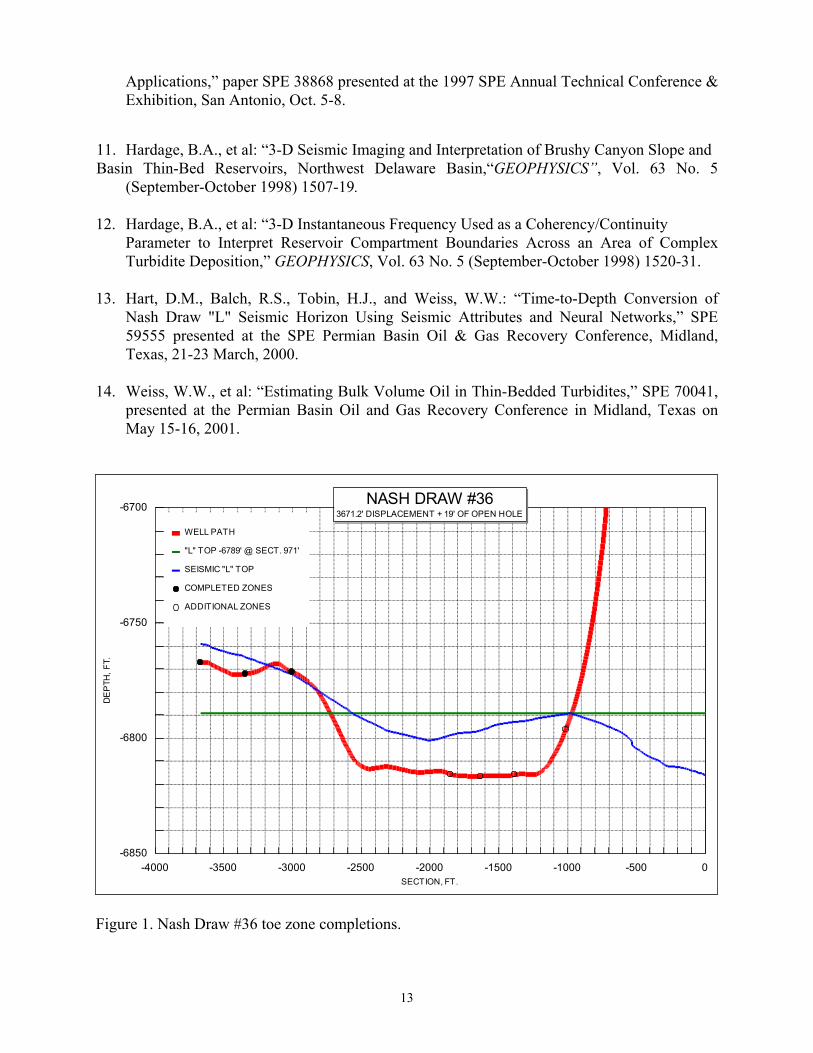
Strata drilled the NDP Well #36, a directional/horizontal well, in the second quarter of 2001. The well extended 3690 feet at a bearing of 296o northwest with a bottomhole location in the SW/NE of Section 11 and the surface location in the NW/SW of Section 12. The completion started in October 2002 with the completion of the toe zones. Three intervals at the toe of the well were initially completed (Figure 1). The intervals are 9786-9805’, 9464-9470’ and 9123-9129’.The completion procedure was: Toe Completion:
1. R.I.H. with coiled tubing to T.D. (9805') and spot 500 gallons of 7 1/2% NEFE acid across the open hole. P.O.H. to 9300' and reverse circulate the hole. P.O.H. with coiled tubing unit. Breakdown, establish a rate into the formation of 10 BPM and pump a total of 50 barrels. Note breakdown pressure, ISIP, 5 minute, 10 minute and 15 minute shut-in pressures. Pump sand slugs as needed to reduce torturosity. Flow back to bleed off pressure.
2. Frac "L" zone with 71,000 gallons 35 #/1000 gallons cross-linked gelled KCL water carrying
216,000 pounds of 16/30 Jordan sand. Treatment to include J501-PROPNET proppant stabilizer in the last 60,000 pounds of sand. Rate 25 BPM with an anticipated surface treating pressure of
5
2000 psi, maximum pressure 3500 psi. Flush with casing volume, approximate displacement volume is 229 barrels, do not over flush.
3. R.I.H. with coiled tubing and clean out wellbore.
Mohave Completions:
1. T.I.H. with perforating guns on 2 3/8” coiled tubing, perforate 9464-9470’, 6 feet, with 6 JSPF, 37 shots, using pressure activated firing head. P.O.H.
2. T.I.H. with perforating guns on 2 3/8” coiled tubing, perforate 9123-9129’, 6 feet, with 6 JSPF, 37 shots, using pressure activated firing head. P.O.H.
3. R.I.H. with Mojave Tool and straddle perforations 9464-9470’, breakdown and acidize with 1000 gallons 7 ½% NEFE acid.
4. Frac with 40,000 gallons 20 #/1000 gallons linear gel carrying 50,000 pounds of 20/40 Jordan sand at 14 BPM.
5. Move Mojave Tool to straddle 9123-9129’, breakdown and acidize with 1000 gallons 7 ½% NEFE acid.
6. Frac with 40,000 gallons 20 #/1000 gallons linear gel carrying 50,000 pounds of 20/40 Jordan sand at 14 BPM.
7. PO.H. with Mojave tool and flow to recover load and test. 8. R.I.H. with 1 ¼” coiled tubing and clean out the horizontal section to T.D. 9. Put well on production.
The completion procedure was followed as written with a few modifications due to unforeseen problems. The main problems were:
1. The rubber cups on the Mohave frac tool are delicate and became cut when the tool was being run in the hole and when the tool was moved to the second interval. This necessitated two extra trips with the coiled tubing to replace damaged cups.
2. The treating pressure on the toe interval was approximately 2000 psi higher than anticipated. This was attributable to tortuosity and was partially relieved by pumping large volumes of sand.
3. The treating pressure on the two Mohave fracs were approximately 2000 psi higher than anticipated. This was attributable to tortuosity and was only partially relieved by pumping sand.
4. High initial production rates made testing and production difficult. 5. Production declined rapidly and sources of damage were investigated.
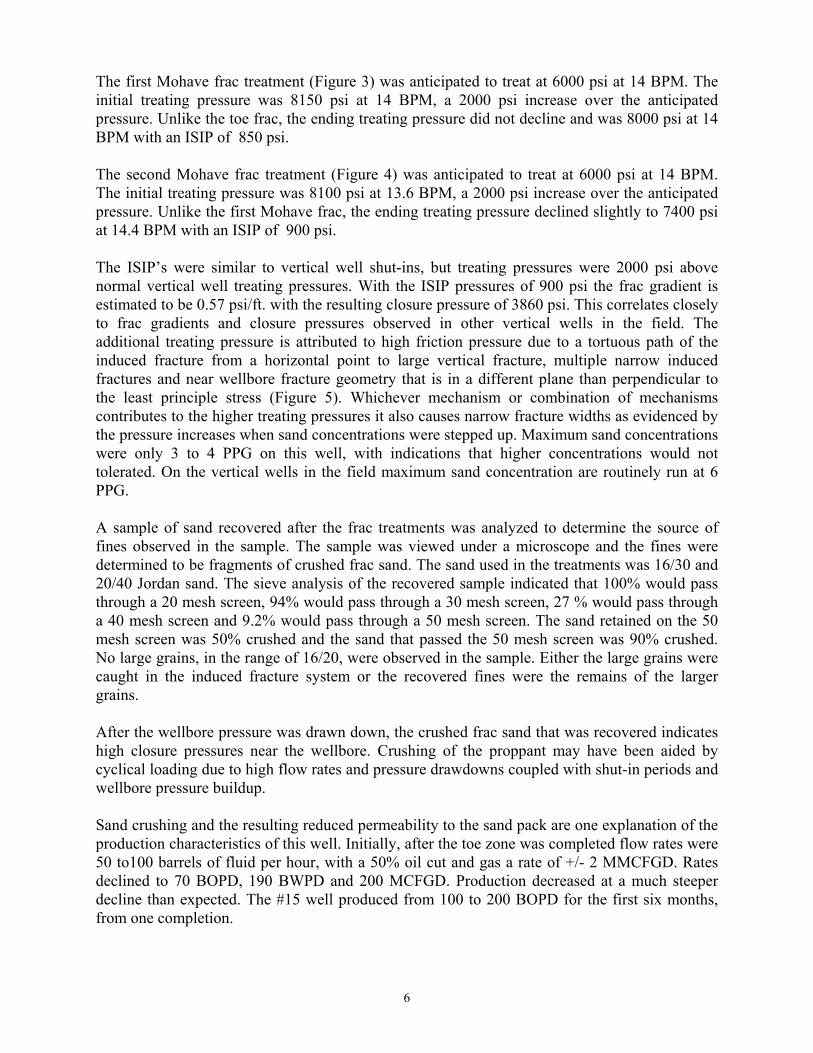
The Mohave frac tool is an opposed cup tool with a variable mandrel length that can be adjusted to straddle the perforated interval to be treated. Other features of the tool include a by-pass and a dump valve. Because the cups are in contact with the casing during running of the tool, the cups are subject to wear and damage. To minimize damage, fluid was circulated around the tool at a slow rate (1 to 2 BPM) to keep the upper cup collapsed. One cup was damaged when it “hung” in the D.V. tool and another set of cups were damaged when they were set in perforations while trying to move the tool to the second set of perforations. All three frac treatments had some degree of “tortuosity”. The toe frac (Figure 2) was expected to treat at approximately 1800 psi. The initial treating pressure was 4000 psi at 2 to 10 BPM. Two shut-ins were observed with ISIP pressures of 900 psi. After starting the treatment and establishing a rate of 25 BPM the treating pressure was approximately 3800 psi. This was approximately 2000 psi above the anticipated pressure. At 125 minutes into the treatment, the 4 ppg sand concentration was on the formation and a momentary 500 psi increase in treating pressure was observed. By the end of the treatment, after pumping 222,000 pounds of 16/30 sand, the treating pressure decreased to 2400 psi and the ISIP was 1200 psi.
6
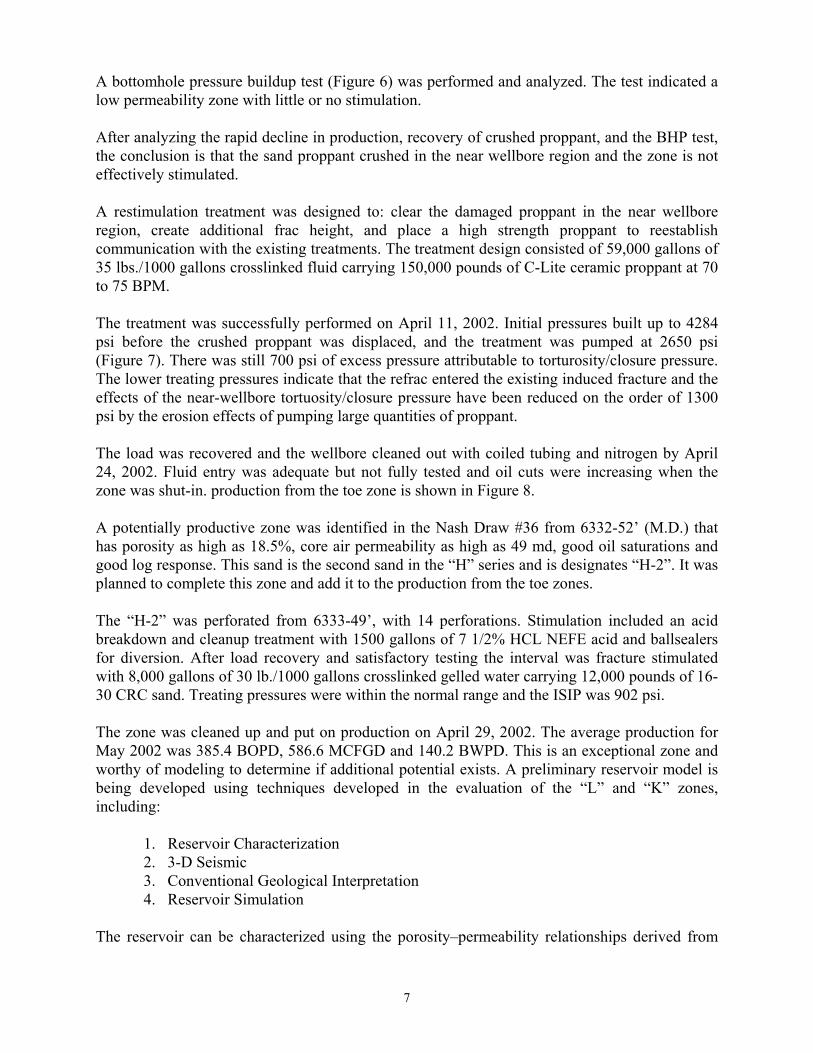
The first Mohave frac treatment (Figure 3) was anticipated to treat at 6000 psi at 14 BPM. The initial treating pressure was 8150 psi at 14 BPM, a 2000 psi increase over the anticipated pressure. Unlike the toe frac, the ending treating pressure did not decline and was 8000 psi at 14 BPM with an ISIP of 850 psi. The second Mohave frac treatment (Figure 4) was anticipated to treat at 6000 psi at 14 BPM. The initial treating pressure was 8100 psi at 13.6 BPM, a 2000 psi increase over the anticipated pressure. Unlike the first Mohave frac, the ending treating pressure declined slightly to 7400 psi at 14.4 BPM with an ISIP of 900 psi. The ISIP’s were similar to vertical well shut-ins, but treating pressures were 2000 psi above normal vertical well treating pressures. With the ISIP pressures of 900 psi the frac gradient is estimated to be 0.57 psi/ft. with the resulting closure pressure of 3860 psi. This correlates closely to frac gradients and closure pressures observed in other vertical wells in the field. The additional treating pressure is attributed to high friction pressure due to a tortuous path of the induced fracture from a horizontal point to large vertical fracture, multiple narrow induced fractures and near wellbore fracture geometry that is in a different plane than perpendicular to the least principle stress (Figure 5). Whichever mechanism or combination of mechanisms contributes to the higher treating pressures it also causes narrow fracture widths as evidenced by the pressure increases when sand concentrations were stepped up. Maximum sand concentrations were only 3 to 4 PPG on this well, with indications that higher concentrations would not tolerated. On the vertical wells in the field maximum sand concentration are routinely run at 6 PPG. A sample of sand recovered after the frac treatments was analyzed to determine the source of fines observed in the sample. The sample was viewed under a microscope and the fines were determined to be fragments of crushed frac sand. The sand used in the treatments was 16/30 and 20/40 Jordan sand. The sieve analysis of the recovered sample indicated that 100% would pass through a 20 mesh screen, 94% would pass through a 30 mesh screen, 27 % would pass through a 40 mesh screen and 9.2% would pass through a 50 mesh screen. The sand retained on the 50 mesh screen was 50% crushed and the sand that passed the 50 mesh screen was 90% crushed. No large grains, in the range of 16/20, were observed in the sample. Either the large grains were caught in the induced fracture system or the recovered fines were the remains of the larger grains. After the wellbore pressure was drawn down, the crushed frac sand that was recovered indicates high closure pressures near the wellbore. Crushing of the proppant may have been aided by cyclical loading due to high flow rates and pressure drawdowns coupled with shut-in periods and wellbore pressure buildup. Sand crushing and the resulting reduced permeability to the sand pack are one explanation of the production characteristics of this well. Initially, after the toe zone was completed flow rates were 50 to100 barrels of fluid per hour, with a 50% oil cut and gas a rate of +/- 2 MMCFGD. Rates declined to 70 BOPD, 190 BWPD and 200 MCFGD. Production decreased at a much steeper decline than expected. The #15 well produced from 100 to 200 BOPD for the first six months, from one completion.
7
A bottomhole pressure buildup test (Figure 6) was performed and analyzed. The test indicated a low permeability zone with little or no stimulation. After analyzing the rapid decline in production, recovery of crushed proppant, and the BHP test, the conclusion is that the sand proppant crushed in the near wellbore region and the zone is not effectively stimulated. A restimulation treatment was designed to: clear the damaged proppant in the near wellbore region, create additional frac height, and place a high strength proppant to reestablish communication with the existing treatments. The treatment design consisted of 59,000 gallons of 35 lbs./1000 gallons crosslinked fluid carrying 150,000 pounds of C-Lite ceramic proppant at 70 to 75 BPM. The treatment was successfully performed on April 11, 2002. Initial pressures built up to 4284 psi before the crushed proppant was displaced, and the treatment was pumped at 2650 psi (Figure 7). There was still 700 psi of excess pressure attributable to torturosity/closure pressure. The lower treating pressures indicate that the refrac entered the existing induced fracture and the effects of the near-wellbore tortuosity/closure pressure have been reduced on the order of 1300 psi by the erosion effects of pumping large quantities of proppant. The load was recovered and the wellbore cleaned out with coiled tubing and nitrogen by April 24, 2002. Fluid entry was adequate but not fully tested and oil cuts were increasing when the zone was shut-in. production from the toe zone is shown in Figure 8. A potentially productive zone was identified in the Nash Draw #36 from 6332-52’ (M.D.) that has porosity as high as 18.5%, core air permeability as high as 49 md, good oil saturations and good log response. This sand is the second sand in the “H” series and is designates “H-2”. It was planned to complete this zone and add it to the production from the toe zones. The “H-2” was perforated from 6333-49’, with 14 perforations. Stimulation included an acid breakdown and cleanup treatment with 1500 gallons of 7 1/2% HCL NEFE acid and ballsealers for diversion. After load recovery and satisfactory testing the interval was fracture stimulated with 8,000 gallons of 30 lb./1000 gallons crosslinked gelled water carrying 12,000 pounds of 16-30 CRC sand. Treating pressures were within the normal range and the ISIP was 902 psi. The zone was cleaned up and put on production on April 29, 2002. The average production for May 2002 was 385.4 BOPD, 586.6 MCFGD and 140.2 BWPD. This is an exceptional zone and worthy of modeling to determine if additional potential exists. A preliminary reservoir model is being developed using techniques developed in the evaluation of the “L” and “K” zones, including:
1. Reservoir Characterization 2. 3-D Seismic 3. Conventional Geological Interpretation 4. Reservoir Simulation
The reservoir can be characterized using the porosity–permeability relationships derived from
8
the Nash Draw cores. The closest rock type match is with the medium to fine grain sand found primarily in the “L” zone. That relationship is expressed by the equation of the line, generated by regression analysis of the porosity – permeability relationship, using an exponent of 0.23125 and a constant of –3.0633.
k= 10(0.23125*Porosity)-3.0633 md
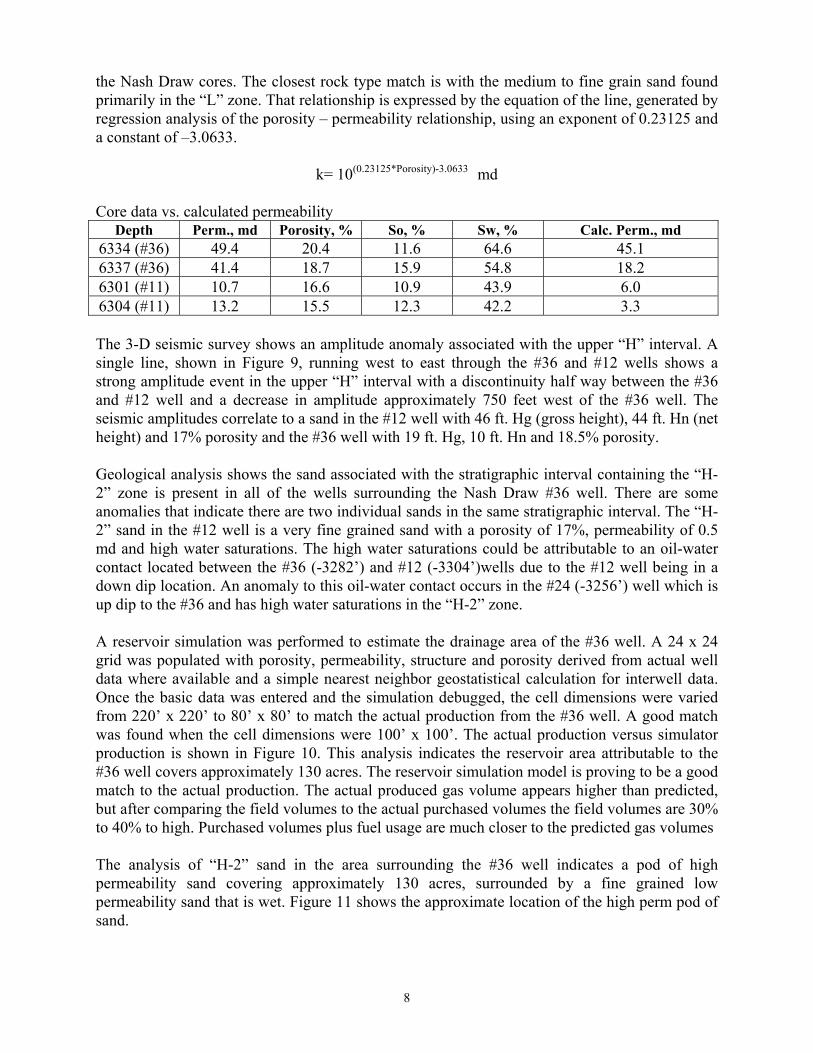
Core data vs. calculated permeability Depth Perm., md Porosity, % So, % Sw, % Calc. Perm., md
6334 (#36) 49.4 20.4 11.6 64.6 45.1 6337 (#36) 41.4 18.7 15.9 54.8 18.2 6301 (#11) 10.7 16.6 10.9 43.9 6.0 6304 (#11) 13.2 15.5 12.3 42.2 3.3 The 3-D seismic survey shows an amplitude anomaly associated with the upper “H” interval. A single line, shown in Figure 9, running west to east through the #36 and #12 wells shows a strong amplitude event in the upper “H” interval with a discontinuity half way between the #36 and #12 well and a decrease in amplitude approximately 750 feet west of the #36 well. The seismic amplitudes correlate to a sand in the #12 well with 46 ft. Hg (gross height), 44 ft. Hn (net height) and 17% porosity and the #36 well with 19 ft. Hg, 10 ft. Hn and 18.5% porosity. Geological analysis shows the sand associated with the stratigraphic interval containing the “H-2” zone is present in all of the wells surrounding the Nash Draw #36 well. There are some anomalies that indicate there are two individual sands in the same stratigraphic interval. The “H-2” sand in the #12 well is a very fine grained sand with a porosity of 17%, permeability of 0.5 md and high water saturations. The high water saturations could be attributable to an oil-water contact located between the #36 (-3282’) and #12 (-3304’)wells due to the #12 well being in a down dip location. An anomaly to this oil-water contact occurs in the #24 (-3256’) well which is up dip to the #36 and has high water saturations in the “H-2” zone. A reservoir simulation was performed to estimate the drainage area of the #36 well. A 24 x 24 grid was populated with porosity, permeability, structure and porosity derived from actual well data where available and a simple nearest neighbor geostatistical calculation for interwell data. Once the basic data was entered and the simulation debugged, the cell dimensions were varied from 220’ x 220’ to 80’ x 80’ to match the actual production from the #36 well. A good match was found when the cell dimensions were 100’ x 100’. The actual production versus simulator production is shown in Figure 10. This analysis indicates the reservoir area attributable to the #36 well covers approximately 130 acres. The reservoir simulation model is proving to be a good match to the actual production. The actual produced gas volume appears higher than predicted, but after comparing the field volumes to the actual purchased volumes the field volumes are 30% to 40% to high. Purchased volumes plus fuel usage are much closer to the predicted gas volumes The analysis of “H-2” sand in the area surrounding the #36 well indicates a pod of high permeability sand covering approximately 130 acres, surrounded by a fine grained low permeability sand that is wet. Figure 11 shows the approximate location of the high perm pod of sand.

9
As of September 30, 2002 the “H-2” zone has cumulative production of 41,464 BO, 78 MMCFG, and 9111 BW and production rates are 190 BOPD, 400 MCFGD and 27 BWPD. When the “H-2” zone stops flowing the retrievable bridge plug will be removed and production from the toe zone and the “H-2” zone will be commingled and tested. Workovers Three (3) workovers, to add additional pay zones, were performed on the Nash Draw #1, Nash Draw #15 and #20 wells. The work is summarized in the following table: Well
Interval
Increase in Oil, BOPD
Increase in Gas, MCFD
Increase in Water, BWPD
1 5750-56’, 5477-80’ 10 17 25 15 6276-79’ 33 80 10 20 6254-57’, 5497-5509’, 5319-31’
Completed W.O. 9-23-02 Testing Testing
Testing
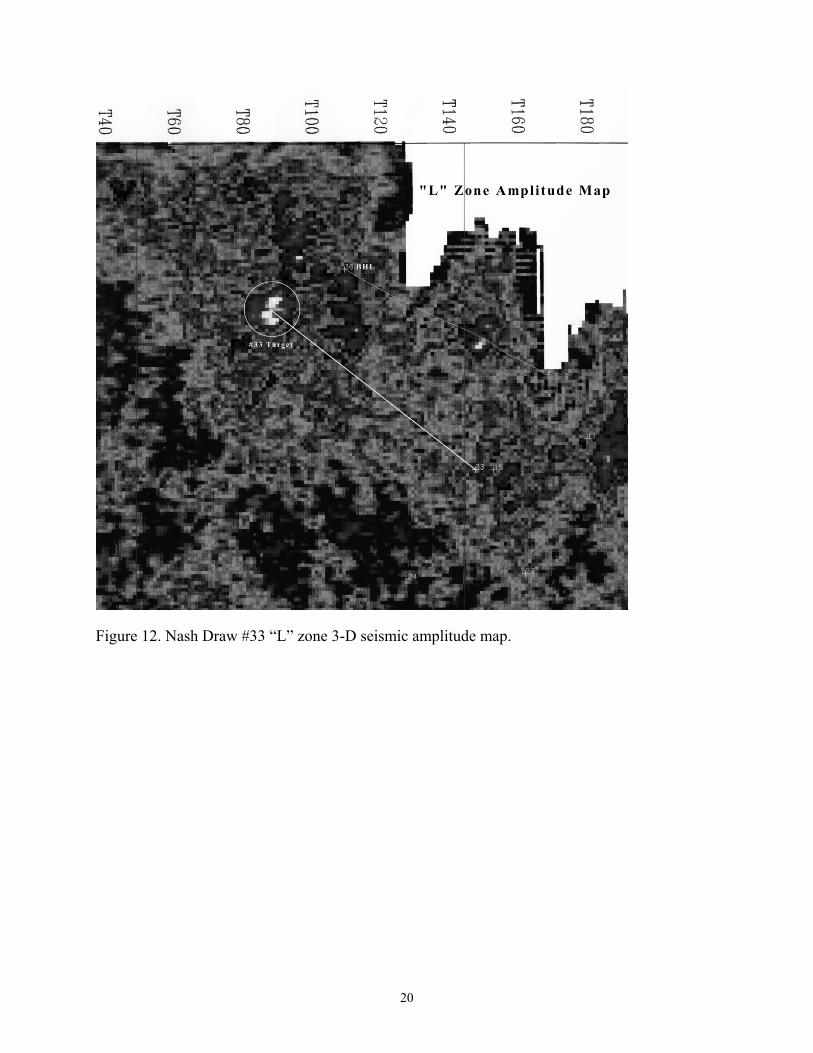
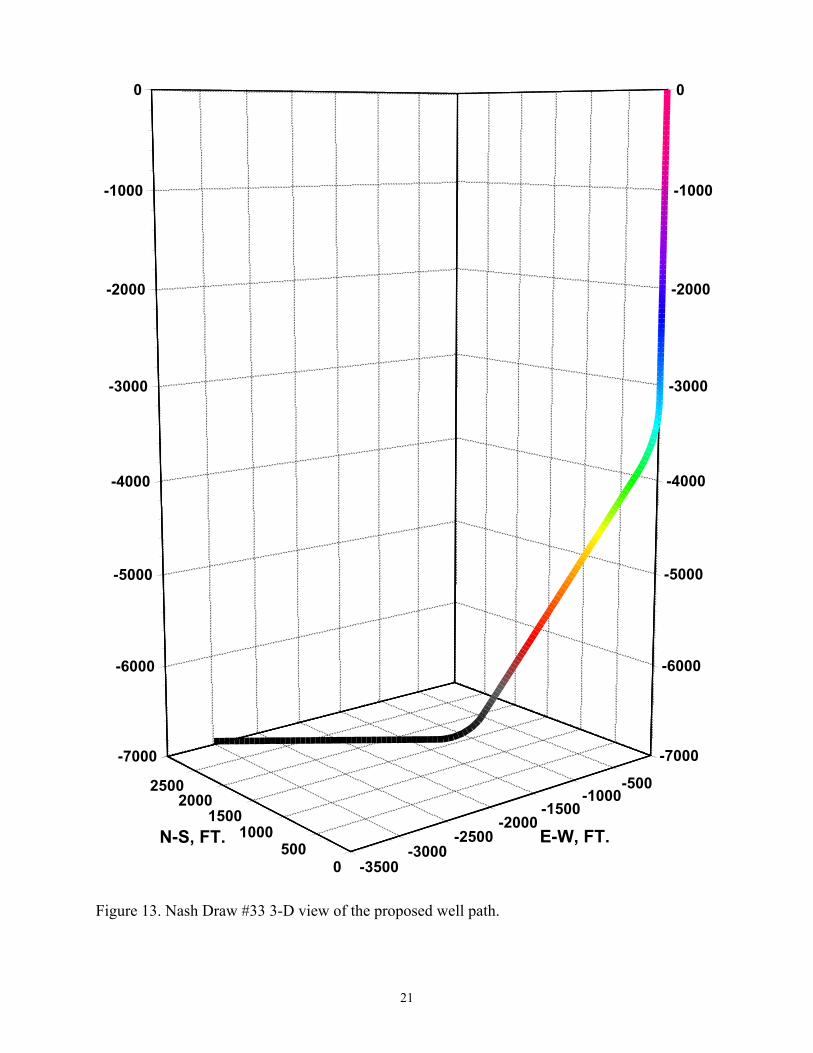
Nash Draw #33 The design of the next deviated-horizontal well has been completed and drilling is scheduled for mid October. The Nash Draw #33 will be drilled from a surface location located 10’ FSL & 175’ FWL of section 12-T23S-R29E. The BHL will be at 2250’ FWL & 2630’ FNL of section 11-T23S-R29E. The toe of the well will develop a seismic anomaly in the “L” zone as shown in Figure 12. This well will be drilled parallel to the #36 well and approximately 2000 feet southwest. The preliminary well design will be to drill a 17 1/2” hole to 400 feet and set 13 3/8” casing. A 11” hole will be drilled to 3,100 feet and 8 5/8” casing will be set. A 7 7/8” hole will be drilled below the 8 5/8” casing and the wellbore kicked off at 3150 feet with a build rate of 3.5o/100 ft. to 28.47o. The 28.47o deviation will be maintained to 6550 feet MD where the deviation will be increased by 12o/100 ft. until the wellbore is horizontal at a measured depth of 6,800 feet. Horizontal drilling will continue for 2,114 feet. The BHL is projected to be located 4152.3 feet from the surface location at a bearing of 309.48o. A 3-D view of the proposed wellbore path is shown in Figure 13. The well plan for the #33 well has been modified based on the problems encountered while drilling the #36 well. The problems and the remedy are presented in the following table: Nash Draw #36 – Problem ND #33 - Solution 1 A keyseat was created due to a change in
direction at the first kick off point at 3150 ft. A deviation survey will be run at 2500 ft. and steering tools will be used to T.D. the intermediate hole with the orientation in a northwesterly direction.
10
2 Sufficient weight was not available at the bit to drill effectively.
Heavy weight drill pipe will be used below the drill collars to transfer weight to the bit.
3 Due to the abrasive nature of the sands the drill bits were worn out of gauge in a short period of time.
A new bit design will be tried that has a diamond coating to protect the gauge.
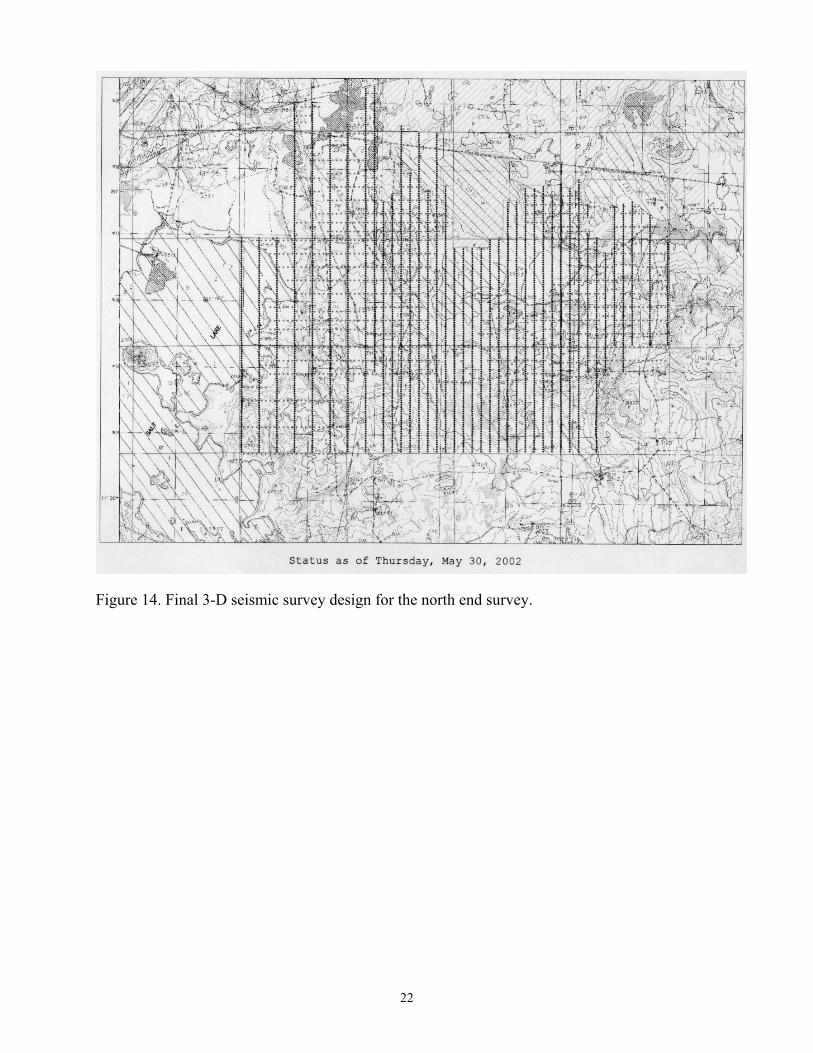
Gas Processing and Injection A study was undertaken to evaluate the design and economics of processing the gas at Nash Draw to recover liquids and reinject lean gas for pressure maintenance. The study indicates that stable gas volumes of 3 MMCFGD or larger would be economic to process. Recovery of liquids from a -10o F plant would be 4.08 gal/MCFG of the 6.13 gal/MCFG that is available. The study and preliminary design have indicated the cost of the gas plant to be $957,000 and the cost of compression to be $1,000,000. These estimates may have as much as 25% variance depending on the availability of equipment. The economics of processing the gas at Nash Draw to recover liquids and reinject lean gas for pressure maintenance will now be evaluated. 3-D Seismic The design of the 3-D seismic survey for the north end of the Nash Draw Unit will incorporate receivers located in the playa lakes. Dawson Geophysical and the Bureau of Land Management representatives met in the field during the later part of March to identify areas where receiver lines could be laid into the playa lakes. This will increase the number of receivers and sources by 50%. This design should yield adequate resolution to provide useful data for targeting the next series of wells. The final design is shown in Figure 14. The design of the 3-D seismic survey for the north end of the Nash Draw Unit is completed and will incorporate receivers located on the shore and into selected areas of the playa lakes to record data from beneath mined areas. To acquire data under playa lakes and potash mines the source and receiver points have been increased from 679 and 2491 to 1050 and 3886 respectfully. With a 60% increase in source and receiver points the cost of the 3-D survey has increased by 53%. We believe that this is the first 3-D seismic survey designed to model the Delaware formation where surface and subsurface constraints, including voids created by underground potash mining is being attempted The survey of the source and receiver lines has been completed, the permitting of the 3-D seismic survey for the north end of the Nash Draw Unit is completed and the acquisition will start on or about November 1, 2002. Data and Databases The NDP production database was updated through August 1, 2002. These data were added to the history of each well to update the decline curves and to project ultimate recoveries as well as to assess the effects of interference and production strategies.
11
Technology Transfer
Disseminating technical information generated during the course of this project is a prim objective of the project. A summary of technology transfer activities during this quarter is outlined below.
Internet Homepage: The PRRC server went down and the Nash Draw Project Web Page was lost. An initiative has been started to rebuild this web site. This site will exhibit the annual reports, the final Phase I report, including graphics and project updates.
“A New Tool For Brushy Canyon Completion Decisions”, was presented at the West Texas Geological Society Fall Symposium in Midland, Texas on October 25-26, 2001. “The Nash Draw #36 Completion”, was presented at “The Coiled Tubing Symposium” held in Midland, Texas on December 12, 2001. “Reducing Exploration Risk with the Fuzzy Expert Exploration Tool”, was presented at Eastern New Mexico University Roswell on September 17, 2002.
CONCLUSIONS Several conclusions can be drawn from the work done during the seventh year of the NDP project. The use of the Advanced Log Analysis techniques developed from the NDP project have proven useful in defining additional productive zones and refining completion techniques. The 3-D seismic survey has proven to be a useful tool to define areas for potential development. Drilling a deviated/horizontal well to develop reserves in an area not accessible by vertical drilling is possible. Completion technology has not advanced as quickly as drilling technology and the completion of a deviated/horizontal well may be the most challenging phase of this project.
12
REFERENCES
1. Murphy M.B., et al: “Advanced Oil Recovery Technologies for Improved Recovery from Slope Basin Clastic Reservoirs, Nash Draw Brushy Canyon Pool, Eddy County, New Mexico,” Report, Cooperative Agreement DE-FC-95BC14941, submitted to the U.S. Department of Energy (October 1996).
2. Murphy M.B., et al: “Advanced Oil Recovery Technologies for Improved Recovery from
Slope Basin Clastic Reservoirs, Nash Draw Brushy Canyon Pool, Eddy County, New Mexico,” Second Annual Report, Cooperative Agreement DE-FC-95BC14941, submitted to the U.S. Department of Energy (October 1997).
3. Murphy M.B., et al: “Advanced Oil Recovery Technologies for Improved Recovery from
Slope Basin Clastic Reservoirs, Nash Draw Brushy Canyon Pool, Eddy County, New Mexico,” Third Annual Report, Cooperative Agreement DE-FC-95BC14941, submitted to the U.S. Department of Energy (October 1998).
4. Murphy M.B., et al: “Advanced Oil Recovery Technologies for Improved Recovery from
Slope Basin Clastic Reservoirs, Nash Draw Brushy Canyon Pool, Eddy County, New Mexico,” Fourth Annual Report, Cooperative Agreement DE-FC-95BC14941, submitted to the U.S. Department of Energy (October 1999).
5. Murphy M.B., et al: “Advanced Oil Recovery Technologies for Improved Recovery from
Slope Basin Clastic Reservoirs, Nash Draw Brushy Canyon Pool, Eddy County, New Mexico,” Fifth Annual Report, Cooperative Agreement DE-FC-95BC14941, submitted to the U.S. Department of Energy (October 2000).
6. Murphy M.B., et al: “Advanced Oil Recovery Technologies for Improved Recovery from
Slope Basin Clastic Reservoirs, Nash Draw Brushy Canyon Pool, Eddy County, New Mexico,” Sixth Annual Report, Cooperative Agreement DE-FC-95BC14941, submitted to the U.S. Department of Energy (October 2001).
7. Martin F.D., et al: “Advanced Reservoir Characterization for Improved Oil Recovery in a
New Mexico Delaware Basin Project,” Proc. Fourth International Reservoir Characterization Technical Conference, Houston, (1997) March 2�4, 703-26, and revised in Reservoir Characterization—Recent Advances, AAPG Memoir 71, R.A. Schatzinger and J.F. Jordan (eds.), AAPG, Tulsa, (1999) 93-107.
8. Martin, F.D., et al: “Reservoir Characterization as a Risk Reduction Tool at the Nash Draw
Pool,” paper SPE 38916 presented at the 1997 SPE Annual Technical Conference & Exhibition, San Antonio, Oct. 5-8, Proc. SPE Reservoir Engineering, 751-66, and revised in SPE Reservoir Eval. & Eng., 2 (2), (April 1999) 169-79.
9. Stubbs, B.A., et al: “Using Reservoir Characterization Results at the Nash Draw Pool to
Improve Completion Design and Stimulation Treatments,” paper SPE 39775 presented at the 1998 SPE Permian Basin Oil and Gas Recovery Conference, Midland, March 23-26.
10. Martin, F.D., et al: “Implementation of a Virtual Enterprise for Reservoir Management
13
Applications,” paper SPE 38868 presented at the 1997 SPE Annual Technical Conference & Exhibition, San Antonio, Oct. 5-8.
11. Hardage, B.A., et al: “3-D Seismic Imaging and Interpretation of Brushy Canyon Slope and Basin Thin-Bed Reservoirs, Northwest Delaware Basin,“GEOPHYSICS”, Vol. 63 No. 5 (September-October 1998) 1507-19. 12. Hardage, B.A., et al: “3-D Instantaneous Frequency Used as a Coherency/Continuity
Parameter to Interpret Reservoir Compartment Boundaries Across an Area of Complex Turbidite Deposition,” GEOPHYSICS, Vol. 63 No. 5 (September-October 1998) 1520-31.
13. Hart, D.M., Balch, R.S., Tobin, H.J., and Weiss, W.W.: “Time-to-Depth Conversion of
Nash Draw "L" Seismic Horizon Using Seismic Attributes and Neural Networks,” SPE 59555 presented at the SPE Permian Basin Oil & Gas Recovery Conference, Midland, Texas, 21-23 March, 2000.
14. Weiss, W.W., et al: “Estimating Bulk Volume Oil in Thin-Bedded Turbidites,” SPE 70041,
presented at the Permian Basin Oil and Gas Recovery Conference in Midland, Texas on May 15-16, 2001.
-4000 -3500 -3000 -2500 -2000 -1500 -1000 -500 0-6850
-6800
-6750
-6700
SECTION, FT.
DE
PTH
, FT.
WELL PATH
"L" TOP -6789' @ SECT. 971'
SEISMIC "L" TOP
COMPLETED ZONES
ADDITIONAL ZONES
NASH DRAW #363671.2' DISPLACEMENT + 19' OF OPEN HOLE
Figure 1. Nash Draw #36 toe zone completions.
14
0 30 60 90 120 150 180 2101
10
100
1000
10000
TIME, MINUTES
UN
ITS
PRESSURE, PSI RATE, BPM SAND CONC., PPG
NASH DRAW #36TOE FRAC 10-1-01
Figure 2. Toe zone fracture stimulation treatment report. Figure 3. First “Mohave” zone treatment 9464–9470 ft.
Strata Production Nash Draw Unit #36
Delaware Horizontal 2nd CoilFRAC* Down 2 3/8" Coiled Tubing5,000 lbs. 100 mesh and 50,000 lbs. 20/40 Ottawa with PropNET*
0.0
1000.0
2000.0
3000.0
4000.0
5000.0
6000.0
7000.0
8000.0
9000.0
10000.0
0.0 20.0 40.0 60.0 80.0 100.0 120.0
Treatment Time (minutes)
Trea
ting
Pres
sure
(psi
)
0.0
3.0
6.0
9.0
12.0
15.0
Pum
p Ra
te (b
pm) a
nd P
rop
Con
c. (p
pa)
Treating Press. (psi)
Pump Rate (bpm)
Prop Conc. (ppa)
100 mesh FLA
3/4 ppa 20/40 "prop slug"
1 ppa
2 ppa
3 ppa

15
Figure 4. Second “Mohave” zone treatment 9123–9129 ft.
Figure 5. Rock stresses.
, , p
0.0
1000.0
2000.0
3000.0
4000.0
5000.0
6000.0
7000.0
8000.0
9000.0
10000.0
100.0 110.0 120.0 130.0 140.0 150.0 160.0 170.0 180.0 190.0 200.0
Treatment Time (minutes)
Trea
ting
Pres
sure
(psi
)
0.0
3.0
6.0
9.0
12.0
15.0
Pum
p R
ate
(bpm
) and
Pro
p C
onc.
(ppa
)
Treating Press. (psi)
Pump Rate (bpm)
Prop Conc. (ppa)
100 mesh FLA
3/4 ppa 20/40 "prop slug"
1 ppa
2 ppa3 ppa
Pressure increase--momentarily go to flush

16
0 1 2 3 4 5 6500
700
900
1100
1300
1500
1700
LOG T+dt/dt
PR
ES
SU
RE
, PS
IPRESSURE
NASH #36DELAWARE "L"
Figure 6. BHP test.
NASH DRAW #36 REFRAC
1
10
100
1000
10000
1
134
267
400
533
666
799
932
1065
1198
1331
1464
1597
1730
1863
1996
2129
2262
2395
2528
2661
2794
2927
3060
3193
3326
TIME, Sec.
PRES
SUR
E, P
SI
Rate, BPM Treating Pressure, PSI Proppant Concentration, PPG
Figure 7. Refrac treatment.
17
10
100
1000
Days
Oil-
Gas
-Wat
er, b
bls.
-MC
F-bb
ls.
10/01/200110/15/2001
10/29/200111/12/2001
11/26/200112/10/2001
12/24/200101/07/2002
01/21/200202/04/2002
02/18/200203/04/2002
03/18/200204/01/2002
04/15/2002
OIL
GAS
WATER
5 day avg. oil
NASH DRAW #3610-3-01 to 4-24-02
Figure 8. Nash Draw #36 Toe Zone production, Cumulative 16,237 BO, 46.5 MMCFG and 36,751 BW.
18
Figure 9. Nash Draw #36 “H-2” zone seismic.
19
100
1000
DAYS
BO
PD
& M
CFG
D
4-29-02 5-14-02 5-29-02 613-02 6-28-02 7-13-02 7-28-02 8-12-02 8-27-02 9-11-02 9-26-02 10-11-02
NASH DRAW #36 OIL SIM OIL NASH DRAW #36 GAS SIM GAS
NASH DRAW #36 H ZONEACTUAL PRODUCTION VS. SIMULATOR PRODUCTION
Figure 10. Nash Draw #36 “H-2” zone production.
Figure 11. “H-2” zone productive limit map.
20
Figure 12. Nash Draw #33 “L” zone 3-D seismic amplitude map.
21
-3500-3000
-2500-2000
-1500-1000
-500
E-W, FT.0
5001000
15002000
2500
N-S, FT.
-7000
-6000
-5000
-4000
-3000
-2000
-1000
0
-7000
-6000
-5000
-4000
-3000
-2000
-1000
0
Figure 13. Nash Draw #33 3-D view of the proposed well path.
22
Figure 14. Final 3-D seismic survey design for the north end survey.