an exploratory analysis of adequate yearly progress ... · an exploratory analysis of adequate...
TRANSCRIPT

An Exploratory Analysis of Adequate Yearly Progress, Identification for Improvement, and Student Achievement in Two States and Three Cities
A report from the National Longitudinal Study of No Child Left Behind (NLS-NCLB)
Technical Report
2009

An Exploratory Analysis of Adequate Yearly Progress, Identification for Improvement, and Student Achievement in Two States and Three Cities
A report from the National Longitudinal Study of No Child Left Behind (NLS-NCLB)
Technical Report
Brian Gill, Mathematica Policy Research J.R. Lockwood III, RAND Francisco Martorell, RAND
Claude Messan Setodji, RAND Kevin Booker, Mathematica Policy Research
----------------
National Longitudinal Study Principal Investigators
Georges Vernez, RAND Beatrice F. Birman, AIR Michael S. Garet, AIR
Prepared for:
U.S. Department of Education Office of Planning, Evaluation and Policy Development
Policy and Program Studies Service
2009

This report was prepared for the U.S. Department of Education under Contract Number ED00CO0087 with RAND and Contract Number ED-01-CO-0026/0024 with AIR. Stephanie Stullich served as the contracting officer’s representative for the National Longitudinal Study of No Child Left Behind. The views expressed herein do not necessarily represent the positions or policies of the Department of Education. No official endorsement by the U.S. Department of Education is intended or should be inferred. U.S. Department of Education Arne Duncan Secretary
Office of Planning, Evaluation and Policy Development Carmel Martin Assistant Secretary Policy and Program Studies Service Alan Ginsburg Director
Program and Analytic Studies Division David Goodwin Director August 2009 This report is in the public domain. Authorization to reproduce it in whole or in part is granted. While permission to reprint this publication is not necessary, the suggested citation is: U.S. Department of Education, Office of Planning, Evaluation and Policy Development, Policy and Program Studies Service, An Exploratory Analysis of Adequate Yearly
Progress, Identification for Improvement, and Student Achievement in Two States and Three Cities, Washington, D.C., 2009. To order copies of this report, write:
ED Pubs Education Publications Center U.S. Department of Education P.O. Box 1398 Jessup, MD 20794-1398
Via fax, dial 301-470-1244.
You may also call toll-free: 1-877-433-7827 (1-877-4-ED-PUBS). If 877 service is not yet available in your area, call 1-800-872-5327 (1-800-USA-LEARN). Those who use a telecommunications device for the deaf (TDD) or a teletypewriter (TTY) should call 1-877-576-7734.
To order online, point your Internet browser to: www.edpubs.ed.gov.
This report is also available on the Department’s Web site at: www.ed.gov/about/offices/list/opepd/ppss/reports.html#title.
On request, this publication is available in alternate formats, such as Braille, large print, or computer diskette. For more information, please contact the Department’s Alternate Format Center at 202-260-0852 or 202-260-0818.

Table of Contents iii
CONTENTS
List of Exhibits ..........................................................................................................................v
Preface .....................................................................................................................................vii
Acknowledgments ................................................................................................................... ix
Executive Summary................................................................................................................. xi
Introduction ..................................................................................................................................................xi
Methods........................................................................................................................................................xii
Key Findings and Implications ................................................................................................................xiii
I. Introduction ......................................................................................................................... 1
Background ....................................................................................................................................................1
Research Questions and Methods ..............................................................................................................2
Approach: Quasi-Experimental Regression Discontinuity Analysis..................................................3
Avoiding False Discovery With Multiple Comparisons ......................................................................4
Limitations......................................................................................................................................................4
Site Selection ..................................................................................................................................................6
Organization of This Report .......................................................................................................................6
II. Using RD to Examine the Effects of Not Making AYP and Identification for Improvement .............................................................................................................................7
Examining Discontinuities in Multiple Dimensions ................................................................................7
Avoiding Misidentification of Discontinuities ..........................................................................................9
III. School-Level RD Analysis in Two States ......................................................................... 11
State Accountability System and School-Level Data: State 1 ...............................................................11
State Accountability System and School-Level Data: State 2 ...............................................................12
Effect of Not Making AYP .......................................................................................................................13
Effect of Not Making AYP for the First Time (State 1) ...................................................................17
Effect of Being Identified for Improvement (State 1)...........................................................................18
IV. RD Analysis of Student-Level Achievement Data in Three Large Districts.................... 21
Data ...............................................................................................................................................................21
Student-Level RD Analysis Approach .....................................................................................................22
Effect of Not Making AYP .......................................................................................................................24
Effect of Not Making AYP for the First Time...................................................................................25

Table of Contents iv
Effects on Specific Student Subgroups................................................................................................26
Effect of Being Identified for Improvement for the First Time..........................................................27
V. Summary and Implications................................................................................................29
References............................................................................................................................... 31
Appendix A. Supplemental Tables for Subgroups of Students..............................................33
Appendix B. Selection of Sites Included in This Report ....................................................... 41

List of Exhibits v
EXHIBITS
I. Introduction
Exhibit 1 Stages of Identification for School Improvement .............................................................2
III. School-Level RD Analysis in Two States
Exhibit 2 Numbers of Title I Elementary and Middle Schools in State 1, by Overall AYP Status and AYP Proficiency Components, 2002–03 and 2003–04 .....................12
Exhibit 3 Numbers of Title I Elementary and Middle Schools in State 2, by Overall AYP Status and AYP Proficiency Components, 2002–03 and 2003–04 .....................13
Exhibit 4 Effect of Not Making AYP on Proficiency, School-Level RD Estimates in Two States, 2003–04 and 2004–05.....................................................................................15
Exhibit 5 Data Plot for RD Analysis of 2002–03 AYP Status and 2003–04 Proficiency, Lowest-Achieving Subgroup from Previous Year, Elementary and Middle Schools in State 1..................................................................................................................16
Exhibit 6 Effect of Not Making AYP for the First Time on Proficiency, School-Level RD Estimates in State 1, 2004–05......................................................................................18
Exhibit 7 Number of Title I Elementary and Middle Schools Relevant to RD Analysis of Identification for Improvement, State 1.......................................................................19
Exhibit 8 Effect of Being Identified for Improvement for the First Time on Proficiency, School-Level RD Results in State 1, 2004–05 ............................................19
IV. RD Analysis of Student-Level Achievement Data in Three Large Districts
Exhibit 9 Number of Schools and Students Included in RD Analyses in Three Districts, 2003–04 and 2004–05 .........................................................................................22
Exhibit 10 Effect of Not Making AYP on Proficiency, Student-Level RD Estimates in Three Districts, 2003–04 and 2004–05..............................................................................24
Exhibit 11 Effect of Not Making AYP for the First Time: Student-Level RD Estimates in District A, 2004–05..........................................................................................................25
Exhibit 12 Effect of Being Identified for Improvement for the First Time, Student-Level RD Estimates in District A, 2004–05 .....................................................................27
Appendix A. Supplemental Tables for Subgroups of Students
Exhibit A.1 Effect of Missing AYP on Students at Different Points in Achievement Distribution, Districts A and B, 2003–04 and 2004–05..................................................34
Exhibit A.2 Estimates for Specific Student Subgroups, Student-Level RD Estimates in District A, 2003–04 ..............................................................................................................35

List of Exhibits vi
Exhibit A.3 Estimates for Specific Student Subgroups, Student-Level RD Estimates in District A, 2004–05 ..............................................................................................................36
Exhibit A.4 Estimates for Specific Student Subgroups, Student-Level RD Estimates in District B, 2003–04...............................................................................................................37
Exhibit A.5 Estimates for Specific Student Subgroups, Student-Level RD Estimates in District B, 2004–05...............................................................................................................38
Exhibit A.6 Estimates for Specific Student Subgroups, Student-Level RD Estimates in District C, 2003–04 ..............................................................................................................39
Exhibit A.7 Estimates for Specific Student Subgroups, Student-Level RD Estimates in District C, 2004–05 ..............................................................................................................40
Appendix B. Selection of Sites Included in this Report
Exhibit B.1 State Starting Points for AYP Proficiency Requirements...............................................42
Exhibit B.2 Schools That Made AYP and Title I Schools Identified for Improvement, by State, 2003–04 .......................................................................................................................42
Exhibit B.3 Percentage of Students in Various Demographic Categories, by State, 2003–04..................................................................................................................................42
Exhibit B.4 Core Components of State AYP Definitions, 2003–04Error! Bookmark not defined.

Preface vii
PREFACE
This report describes exploratory analyses of the effects of components of the No Child Left Behind
(NCLB) accountability system on the achievement of students in affected Title I schools. The analyses used school-level and student-level assessment data from two states and three school districts, employing a quasi-experimental regression discontinuity method to examine whether schools that fell short of “adequate yearly progress” (AYP) or were identified for improvement under NCLB showed subsequent improvements in student achievement. The purpose of the analysis was to explore the usefulness of the regression discontinuity method for examining the effects of the NCLB accountability system. This analysis was conducted under the National Longitudinal Study of No Child Left Behind (NLS-NCLB), which is examining the implementation of key NCLB provisions at the district and school levels.


Acknowledgments ix
ACKNOWLEDGMENTS
We wish to thank the many individuals who contributed to the completion of this report. We are especially grateful to the state and district officials who graciously provided state assessment datasets for the analysis. Without their efforts, this report would not have been possible, and we deeply appreciate their assistance.
The information in this report was provided through the National Longitudinal Study of No Child Left
Behind (NLS-NCLB), which was conducted by the RAND Corporation and the American Institutes for Research (AIR) under contract to the U.S. Department of Education. The NLS-NCLB was led by Georges Vernez of the RAND Corporation and Michael Garet and Beatrice Birman of AIR, assisted by Brian Stecher (accountability team leader), Brian Gill (choice team leader), and Meredith Ludwig (teacher quality team leader). Marie Halverson of the National Opinion Research Center directed data collections for the NLS-NCLB.
Several individuals at the U.S. Department of Education provided guidance and direction for this report. Stephanie Stullich served as project officer for the NLS-NCLB and provided invaluable substantive guidance and support throughout this study and the production of this report. We would also like to acknowledge the assistance of David Goodwin, director of Program and Analytic Studies Division in the Policy and Program Studies Service (PPSS), and Daphne Kaplan, PPSS team leader.
We would like to acknowledge the thoughtful contributions of the members of our Technical Working Group, including Julian Betts, David Francis, Margaret Goertz, Brian Gong, Eric Hanushek, Richard Ingersoll, Phyllis McClure, Paul Peterson, Christine Steele, and Phoebe Winter. We also benefited from helpful comments on the methodology provided by Thomas Cook, Guido Imbens, Jeffrey Smith, and Petra Todd.
While we appreciate the assistance and support of all the above individuals, any errors in judgment or fact are, of course, the responsibility of the authors.

Executive Summary xi
EXECUTIVE SUMMARY
INTRODUCTION
Title I of the federal Elementary and Secondary Education Act, as reauthorized by the No Child Left Behind Act
(NCLB), requires states to establish standards, assessments, and accountability systems to ensure that every child achieves proficiency in reading and mathematics by the year 2014. Each state is required to test all students in grades 3–8 and once in grades 10–12 on assessments that are aligned with challenging state standards for reading and mathematics; each state must also set standards for making “adequate yearly progress” (AYP) toward the goal of 100 percent proficiency. To make AYP, schools must meet proficiency targets not only for the school as a whole but also for student subgroups, including major racial and ethnic groups, economically disadvantaged students, students with disabilities, and students with limited English proficiency.
NCLB puts in place a multi-component accountability system for Title I schools. If schools miss their AYP targets for one year, no sanctions are applied, but they may view that as a “warning” of the potential for future interventions. Schools that do not make AYP targets for two consecutive years are “identified for improvement,” and states and districts are expected to provide assistance and interventions to help these schools improve student achievement. In particular, students in Title I schools that are identified for improvement must be offered the opportunity to transfer to non-identified schools within their school districts. If an identified school falls short of AYP again (i.e., for a third time), students from low-income families must be given the additional option of enrolling in supplemental educational services offered by state-approved providers that are in addition to instruction provided during the school day. A fourth year of missing AYP moves a school into “corrective action,” at which point the district must implement at least one of a series of interventions that include replacing staff, replacing the curriculum, reducing the school’s management authority, bringing in an outside expert, adding time to the school calendar, or reorganizing the school internally. Missing AYP for a fifth year leads to “restructuring,” which requires major governance changes, such as making significant changes in the school’s staff, converting the school to charter-school status, or turning over management to the state or to a private firm.
As part of the National Longitudinal Study of No Child Left Behind (NLS-NCLB), we conducted exploratory quasi-experimental analyses in two states and three large urban school districts to examine the relationships between the first two stages of NCLB accountability—i.e., not making AYP and being identified for improvement—and subsequent student achievement in Title I schools. The most rigorous method for examining the effectiveness of educational interventions is a randomized controlled trial, which randomly assigns students or schools to “treatment” and “control” groups. However, this approach would not be legal in the context of Title I accountability provisions, which under the law must be applied equally to all Title I schools. Thus, this report examines the relationship between the first two stages of the NCLB accountability system and student achievement using a quasi-experimental regression discontinuity (RD) design; this design can provide causal inferences that approach the validity of randomized controlled trials (i.e., Shadish, Cook, and Campbell, 2002). The RD approach is described below under Methods.
The analyses discussed in this report do not answer the question of whether the NCLB accountability system as a whole was effective in raising student achievement in the two states and three school districts that were studied. Rather, these analyses were intended to explore the usefulness of the regression discontinuity method for examining the effects of certain aspects of the NCLB accountability system, specifically, the effects of not making AYP or of being identified for the first year of school

Executive Summary xii
improvement status (after missing AYP for two consecutive years), which are far narrower questions than the effects of the entire NCLB accountability system.
METHODS
We conducted analyses for two states and three large urban school districts for the effects measured in the 2003–04 and 2004–05 school years (based on AYP results from spring 2003 and spring 2004). We used longitudinal student-level data in the analyses for the three districts. The statewide analyses conducted in both states (which contain the three districts) used longitudinal school-level data. Some analyses could be conducted in only one state or one district because of sample size limitations. The states and districts were chosen based on the availability of necessary data for the analysis, and should not be considered representative of the country as a whole.
In most of the analyses, four measures of student achievement were examined: average schoolwide reading achievement, average schoolwide mathematics achievement, and achievement in mathematics and reading for the subgroup that had the lowest score in the previous year. The outcome of greatest interest is the result for the subgroup-subject combination with the lowest score in the previous year, because that score can be viewed as the primary reason the school did not make AYP (i.e., if a school’s lowest-achieving subgroup does better than the AYP standard, the school will make AYP). Schools, therefore, have an incentive to make special efforts to improve the scores of the students in this subgroup.
Schools may likewise have an incentive to focus on students whose prior achievement put them just below the standard for proficiency (referred to as “bubble students”). Therefore, the study also examines whether there is any evidence of differential achievement gains for students who are just below the proficiency standard.
And as noted above, the study separately examines achievement gains associated with two components of the full NCLB accountability system: not making AYP and becoming identified for improvement (i.e., not making AYP for two consecutive years).
The most rigorous quasi-experimental research design possible in this context is an RD design. An RD analysis compares the relationship between an assignment variable (in this case, the proportion of students achieving proficiency in a specific year) and an outcome variable (average student achievement or the proportion of students achieving proficiency the following year) for subjects (schools) above and below the cutoff point that determines assignment to “treatment” status. A “discontinuity” in the relationship between prior achievement and subsequent achievement can be interpreted as the effect of treatment.
RD may be viewed by lay readers as counterintuitive, because it uses treatment and comparison groups that are different by definition. However, because the rules for assigning schools to treatment (i.e., for not making AYP) are explicit, controlling for the assignment variable (in this case, the school’s prior proficiency level) fully adjusts for the underlying difference between treatment schools and comparison schools. If we observe a shift (discontinuity) in the relationship between prior proficiency and subsequent achievement at the proficiency cut point used to determine AYP, we have strong evidence that the shift is attributable to not making AYP.
The RD analyses conducted for this report used an assignment rule that accounts for the fact that in order to make AYP, each Title I school must reach the relevant state proficiency standards in reading and mathematics overall and for all relevant subgroups. Similarly, schools that did not make AYP for

Executive Summary xiii
the first time must achieve AYP for the school overall and for all relevant subgroups to avoid becoming identified for improvement. This means that a school’s assignment to treatment status (either not making AYP or being identified for improvement) depends on having its lowest-scoring subgroup-subject combination fall short of the state standard.1 The RD analyses examine the relationship between the minimum AYP score for which a school is accountable and the school’s subsequent achievement, assessing whether schools with minimum scores below AYP cutoffs (the treatment group) show achievement bumps in the subsequent year that distinguish them from schools with minimum scores that exceed AYP cutoffs (the comparison group).
Readers should be aware that the study does not assess the total impact of NCLB on all schools, including those that are making AYP. It is possible that NCLB affects schools that are currently making AYP as well as schools that have not made AYP and those that have been identified for improvement. Schools that are currently meeting AYP may perceive a threat of missing AYP and becoming identified for improvement in the future and take action to avoid being identified. Thus, no school can be viewed as entirely unaffected by NCLB. In addition, this study examined only the effects of missing AYP or being identified for improvement for the first time, and did not examine the effects of assignment to later stages of school improvement status, such as corrective action or restructuring. Consequently, the schools included in this analysis may have experienced a relatively weak intervention relative to the full set of progressively more intensive interventions prescribed by NCLB. Although missing AYP once provides a warning of potential interventions that may lie ahead if the school does not make AYP again, and although this warning could potentially have an effect, the warning itself is not the primary treatment that NCLB is intended to provide. The RD analysis also examined schools that were identified for improvement for the first time in 2004–05 (based on 2003–04 testing), but we do not know whether these schools experienced substantial external assistance or undertook serious improvement efforts by the time the study’s outcome measure was collected about 6–8 months later (i.e., spring 2005 testing).
In this context, readers should bear in mind that all the estimates produced by the analyses in this report may
understate the full, systemic effect of NCLB on student achievement in the two states and three districts that were studied.
The analyses conducted for this report should be viewed as estimating the marginal effect on student achievement of a school having not made AYP or being identified for the first year of school improvement status in these states and districts. Assessing the larger systemic effects of NCLB on all schools (including those that made AYP and those identified for later stages of school improvement status) would require a different approach, such as one that examines differences in achievement trajectories across states.
KEY FINDINGS AND IMPLICATIONS
Findings from two states and three cities cannot be generalized to draw national conclusions about the effects of missing AYP or identification for improvement on subsequent student achievement. However, this exploratory analysis in this small number of states and districts yields several findings about the utility of the RD method for examining the effects of NCLB accountability, as well as about the effects that were measured in the individual states and districts that were studied.
• Utility of RD method for assessing effect of missing AYP and first-time identification for improvement. Our analysis using school-level data in two large states suggests that the RD method applied to aggregated, school-level data would lack sufficient statistical power to produce a useful state-level estimate of these effects. However, the state-level estimates could
1 This description is slightly oversimplified, because it ignores complications associated with safe harbor gains, confidence intervals, and standards for non-test outcomes, such as test participation rates, attendance, and graduation.

Executive Summary xiv
nonetheless be used in a 50-state meta-analysis that could produce a valid estimate of the average effect across the country. Student-level data, where available, can substantially increase the precision of the RD analysis, making it possible to produce useful state-level estimates of the effect of missing AYP or first-time identification for improvement.
• Utility of RD method for assessing effect of later stages of improvement status. Regardless of whether school-level or student-level data are available, it is not clear that the RD method can produce useful estimates of the marginal impacts of later phases of improvement status (i.e., School Improvement II, Corrective Action, and Restructuring), when the most intensive interventions of NCLB are triggered. The RD method estimates impacts only for schools entering a particular stage of improvement in a particular year, and the comparison schools are only those that were at risk of entering the same stage of improvement in the same year but made AYP and avoided entering the stage. These numbers are quite small in any individual state, severely limiting the power of the analysis. A 50-state, multiyear meta-analysis might have sufficient statistical power to produce useful national average estimates of the effects of some of the later stages of improvement status; further investigation of the number of schools across the country moving into each stage (and at risk for moving into each stage) would be necessary to assess this prospect.
• Effect in three cities and two states of not making AYP on school performance. In two cities, RD analyses using longitudinal, student-level data found that schools that did not make AYP showed positive impacts for some student achievement outcomes in 2003–04 or 2004–05, but the effects were not consistent across years and outcomes. In the third city, we found no significant student achievement effects. Statewide RD analyses conducted using aggregate, school-level data did not find a significant effect on schoolwide proficiency rates in reading or math; a significant positive impact on the achievement of the lowest-achieving subgroup was found in one of two states in one of the two years examined.
• Effect in three cities of not making AYP on performance of “bubble students” and demographic subgroups. In two cities where RD analyses could be conducted, student-level analyses showed no evidence that gains in schools that did not make AYP were concentrated among bubble students (students who had prior scores just below the proficient level). Similarly, in three cities where RD analyses could be conducted, the analyses produced no evidence that not making AYP had specific effects for particular racial or ethnic groups (white, Hispanic, black), special education students, students with limited English proficiency, or economically disadvantaged students.
• Effect in one city and one state of first-time identification for improvement on school performance. We found no statistically significant achievement effects in schools identified for improvement in the year subsequent to identification, in the one state and one district where RD analysis was possible (in one year, 2004–05).
Overall, these quasi-experimental regression discontinuity analyses in a small number of states and districts did not find consistent effects on student achievement in schools that missed AYP or were identified for improvement. A few effect estimates were positive, but they were not consistent across years and outcomes. None of the analyses found negative effects on student achievement.

Chapter I 1
I. INTRODUCTION
BACKGROUND
The federal No Child Left Behind Act of 2001 (NCLB), the latest reauthorization of the Elementary and
Secondary Education Act of 1965 (ESEA), requires that every child be proficient in reading and mathematics by the year 2014. Each state must define its own proficiency standards and is also required to set standards for making adequate yearly progress (AYP) toward the goal of 100 percent proficiency. NCLB requires states to establish accountability systems and mandates a variety of interventions for schools that repeatedly miss their state’s AYP targets, including new educational options for parents (such as offering supplemental educational services to children from low-income families in low-performing Title I schools and the option to move a child from a low-performing school to a higher-performing school), increased professional development and other forms of technical assistance to help schools improve, and restructuring of chronically low-performing schools.
The process by which a school is identified for improvement is defined broadly by NCLB and more specifically by the accountability plans that states have adopted to comply with NCLB. In general, a school that misses AYP for the first time does not experience specific sanctions, but it may be considered to have received a warning of the potential for future interventions. If the school does not make AYP for two consecutive years, it is identified for improvement. States have some discretion in setting AYP standards, but the standards must involve thresholds describing a number of factors, including the proportion of students achieving proficiency in reading and math, applied to the “all students” group as well as to each relevant subgroup of students (such as minority students and special education students); a minimum participation rate on state assessment exams of 95 percent; a minimum attendance rate (for most elementary and middle schools); and a minimum graduation rate (for high schools).
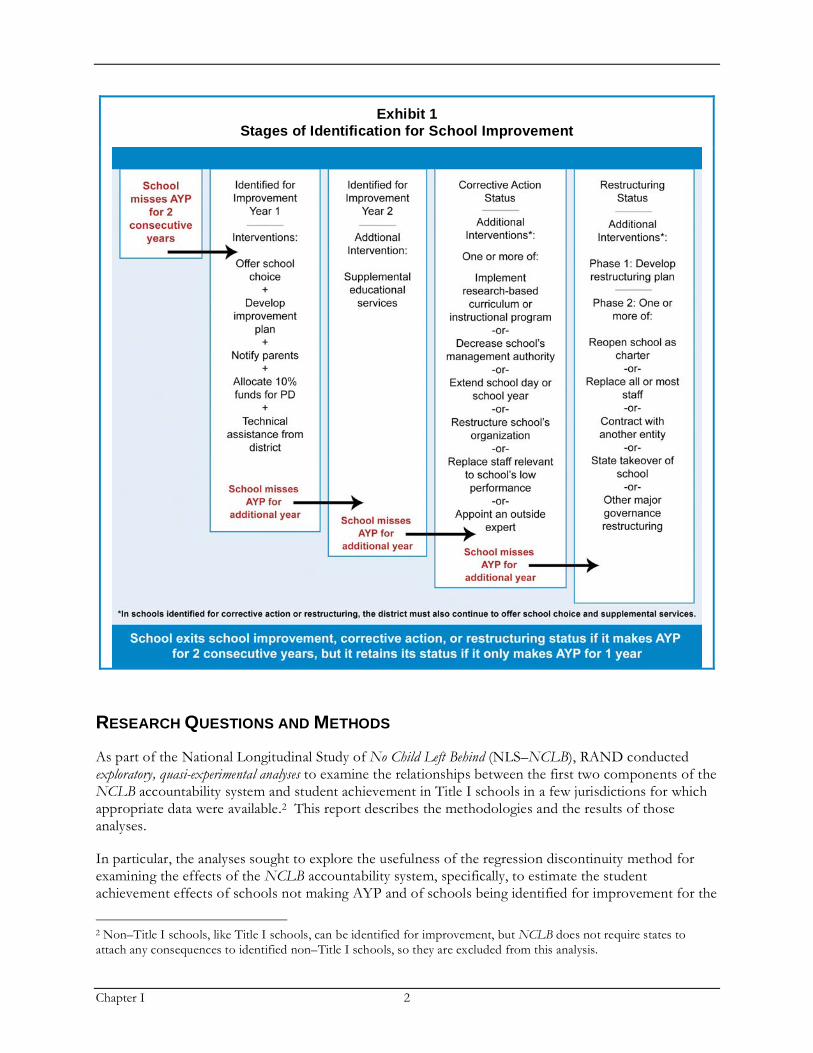
As shown in Exhibit 1, NCLB defines four different phases of school improvement status, with progressively increasing interventions and sanctions: Identified for Improvement (Year 1), Identified for Improvement (Year 2), Corrective Action, and Restructuring. Students in all Title I schools that are in any phase of identification (i.e., in Year 1 or beyond) must be offered the opportunity to transfer to non-identified schools within their districts. If a school that is in Year 1 falls short of AYP again (i.e., for a third time), it moves to Year 2 of being identified for improvement, at which point its students from low-income families must be given the additional option of enrolling in supplemental educational services offered by state-approved providers that are in addition to instruction provided during the school day and funded by the district’s Title I funds. An additional year of missing AYP moves a school into Corrective Action status, at which point the district must implement at least one of a series of interventions that include replacing staff, replacing the curriculum, reducing the school’s management authority, bringing in an outside expert, adding time to the school calendar (day or year), or reorganizing the school internally. A school in Corrective Action that again does not make AYP moves to the final phase, Restructuring. Restructuring requires major changes to the governance of the school, such as making significant changes in the school’s staff, converting to charter-school status, or turning over management of the school to the state or to a private firm. The first year in Restructuring status is to be used to develop a restructuring plan for the school, which must be implemented the following year if the school continues to miss AYP.
Schools in any phase of improvement status can move out of the status by making AYP for two consecutive years. A school in improvement that makes AYP once remains in its prior improvement status until the following year, when it will either exit improvement status if it makes AYP again or, if it does not make AYP, move to the next phase of improvement.
Chapter I 2
Exhibit 1
Stages of Identification for School Improvement
RESEARCH QUESTIONS AND METHODS
As part of the National Longitudinal Study of No Child Left Behind (NLS–NCLB), RAND conducted exploratory, quasi-experimental analyses to examine the relationships between the first two components of the NCLB accountability system and student achievement in Title I schools in a few jurisdictions for which appropriate data were available.2 This report describes the methodologies and the results of those analyses.
In particular, the analyses sought to explore the usefulness of the regression discontinuity method for examining the effects of the NCLB accountability system, specifically, to estimate the student achievement effects of schools not making AYP and of schools being identified for improvement for the
2 Non–Title I schools, like Title I schools, can be identified for improvement, but NCLB does not require states to attach any consequences to identified non–Title I schools, so they are excluded from this analysis.

Chapter I 3
first time (having not made AYP for two consecutive years). Specifically, this report examines in a small number of locations the following research questions:
1. How does missing AYP affect student achievement?
2. How does identification for improvement affect student achievement in the first year after identification?
We used data from two states and three cities to examine effects of the two components of NCLB accountability on several measures of achievement outcomes. Where available, the measures of student achievement outcomes include:
A. Schoolwide proficiency percentages.
B. Proficiency percentages and mean student-level achievement results in particular subgroups that did not make AYP in the preceding year.
C. Student-level achievement results for students with different pretreatment levels of achievement.
D. Proficiency percentages and mean achievement levels for minority and low-income subgroups, regardless of whether their groups were the reason a school did not make AYP.
Sites under examination in these analyses include three large urban school districts where longitudinal student-level data were available. In addition, statewide analyses were conducted using longitudinal school-level data in two states that encompassed the three districts. The data needs that drove the selection of sites are described in Appendix B, which also includes descriptive information on the characteristics of each site.
Approach: Quasi-Experimental Regression Discontinuity Analysis
In many situations, the best way to get valid causal inferences about the effects of interventions is to use a randomized controlled trial, which randomly assigns students or schools to “treatment” and “control” groups. NCLB, however, requires consistent application of the law’s accountability provisions to all Title I public schools within each state, so there is no opportunity to design an impact assessment based on an experimental design by which schools are randomly assigned to improvement status. Thus, our analyses rely on a regression discontinuity (RD) design (see, e.g., Shadish, Cook, and Campbell, 2002), a quasi-experimental method that can provide some of the strongest causal inferences possible short of a randomized experiment (Lee, 2006).
In its simplest form, an RD analysis compares the relationship between an assignment variable (such as the proportion of students achieving proficiency last year) and an outcome variable (such as the proportion of students achieving proficiency this year) for subjects (such as schools) above and below the cutoff point that determines assignment to “treatment” status. In the NCLB context, this involved examining the relationship between a school’s proficiency rates last year—used to determine AYP and identification for improvement—and subsequent student achievement and examining whether there is a shift, or discontinuity, in that relationship at the proficiency standard used to determine AYP. Such a shift would identify the effect of treatment. This report used RD methods in separate analyses of

Chapter I 4
longitudinal school-level and student-level achievement data. The RD approach is described in detail in Chapter II.3
Avoiding False Discovery With Multiple Comparisons
When conducting large numbers of simultaneous hypothesis tests, it is important to account for the possibility that some results will achieve statistical significance simply by chance. For example, the use of a traditional 95 percent confidence interval will result in one out of 20 comparisons achieving statistical significance as a result of random error. Therefore, adjustments should be made to account for false positives when large numbers of comparisons are made.
This report addresses false positives using the False Discovery Rate (FDR) method (Benjamini and Hochberg, 1995), which allows the analyst to bound the expected fraction of rejected null hypotheses that are mistakenly rejected (i.e., that are "false discoveries"). The rejection decision for each hypothesis in the family of tests is a simple function of the rank of the p-value of the test, the total number of tests, and the chosen false discovery rate. Our assessments of statistical significance were based on applying the FDR procedure to all the primary tests in this report (as reported in Exhibits 4, 6, 8, 10, 11, and 12) using a false discovery rate of 0.10. This led to adopting a statistical significance cutoff of 0.0063; that is, we declare significant those tests whose p-values are less than 0.0063.
LIMITATIONS
This study is not a comprehensive assessment of the effects of NCLB, even in the two states and three cities examined. Three key limitations merit mention.
First, the analyses examined only the earliest stages of the NCLB accountability framework. RD requires large sample sizes to have sufficient statistical power to detect small-to-moderately sized impacts. The number of schools and students in our data was sufficient to conduct RD analyses of the effect of not making AYP in both states and all three districts. However, the effect of becoming identified for improvement—for schools not previously identified—could be examined in only one state and one district. Effects of later phases of the NCLB accountability framework, when more intensive interventions are mandated, could not be examined in this sample of states and districts using the RD approach. Consequently, the schools included in this analysis may have experienced a relatively weak intervention relative to the full set of progressively more intensive interventions prescribed by NCLB. Although missing AYP once provides a warning of potential interventions that may lie ahead if the school does not make AYP again, and although this warning could potentially have an effect, the warning itself is not the primary treatment that NCLB is intended to provide. The RD analysis also examined schools that were identified for improvement for the first time in 2004–05 (based on 2003–04 testing), but we do not know whether these schools experienced substantial external assistance or undertook serious improvement efforts by the time the study’s outcome measure was collected about 6–8 months later (i.e., spring 2005 testing).
3 These analyses can be undertaken even under circumstances when state testing regimes change or when state AYP cut points are ratcheted up (as they must be periodically to achieve 100 percent proficiency by 2014), because they incorporate comparison groups that experience the same changes. In all sites, student test score distributions must be standardized to make comparisons across grades and years valid. We standardize test scores by transforming the raw scores into rank-based Z-scores by grade-subject-year (a transformation that fits the data onto a normal distribution with a mean of zero and a variance of one).

Chapter I 5
Second, the study did not examine the effects of state-level accountability systems that exist independent of NCLB. State-level accountability systems, many of which pre-dated NCLB, vary widely. Moreover, the impact of NCLB accountability in any particular state may partly depend on the characteristics of the state’s accountability system. We are aware of only one study that has attempted to compare the impacts of NCLB accountability with an independent state accountability system; that study was conducted in Florida by Martin West and Paul Peterson (2005). Florida’s accountability system predates NCLB, but as is the case in NCLB, Florida grades schools based on achievement test results and requires two years of low performance before a school enters “treatment.” West and Peterson found that the state accountability system produced positive effects on “treated” schools, but they found no effects from NCLB identification.
It is likely that the effects of NCLB vary across states. NCLB may have smaller effects in states (like Florida) in which ambitious, high-stakes accountability systems exist independent of the federal law. By contrast, in states with limited or no high-stakes accountability independent of NCLB, the federal law might have a larger effect. Assessing the relative importance of NCLB accountability in the context of varying state accountability systems would require examining effects in a large number of different states. However, this study included only two states, one of which had a relatively developed preexisting test-based accountability system while the other did not. Thus, readers should keep in mind that the results for these two states may not predict results that may be occurring in other states. The current study attempted to gauge the marginal impact of components of the NCLB’s accountability system on targeted schools in those two states, taking as given the state-level accountability systems and the other state policies in place.
Third, these analyses did not identify any systemic effects that NCLB may have had on schools that were achieving AYP thresholds and that were, therefore, not identified for improvement. It is possible that NCLB has a more global, systemic effect on all schools, apart from any specific effect on schools that fall short of AYP. Identification for improvement reoccurs annually, with proficiency standards ratcheted upward over time until they reach 100 percent in the year 2014. As a result, schools that are not currently identified for improvement (and their districts) may take actions that anticipate the possibility that they may be identified for improvement the next year. Thus, although the formal policy interventions designated in NCLB apply only to schools identified for improvement, some of the behavioral responses that NCLB induces in identified schools may also occur in non-identified schools.
In this context, readers should bear in mind that all the estimates produced by the analyses in this report may
understate the full, systemic effect of NCLB on student achievement in the two states and three districts that were studied.
The analyses conducted for this report should be viewed as estimating the marginal effect on student achievement of a school having not made AYP4 or being identified for the first year of school improvement status in these states and districts. Assessing the larger systemic effects of NCLB on all schools (including those that made AYP and those identified for later stages of school improvement status) would require a different approach, such as one that examines differences in achievement trajectories across states.
4 Three recent quasi-experimental studies of the achievement impact of Florida’s high-stakes state accountability system (Greene and Winters, 2003; West and Peterson, 2005; Chakrabarti, 2005) took a similar approach to the same problem, examining effects on schools that were merely “threatened” by an accountability system. Each of the Florida analyses found a positive effect of the state’s high-stakes accountability system on achievement in low-rated or threatened schools. Of the three studies, only Chakrabarti’s used a formal RD analysis. The other two studies constructed a series of comparison groups that relied on a quasi-experimental design and that sought to examine threat effects and direct effects of identification.

Chapter I 6
Although this study examined threat effects on schools missing AYP, it did not attempt to estimate any larger, systemic effect of NCLB that might affect all schools, even those that were currently making AYP. Thus, the analyses conducted for this report should be viewed as estimating the marginal effect on student achievement of a school’s identification for improvement or falling short of AYP.
SITE SELECTION
We sought locations where we could undertake both school- and student-level analyses to examine whether school-level results corresponded with results using finer-grained student-level data. Because longitudinal, student-level data were available in only a limited number of states and districts, we focused our attention on elementary and middle schools in two states and three cities where we had access to extensive school- and student-level data. High schools could not easily be accommodated into the analysis and were therefore excluded.5 Because the states and districts had to be chosen based on data availability, they are not representative of the country as a whole.
State 1 is the larger state, with 4,579 Title I elementary and middle schools that could be included in the study. Of these, a substantial number of schools did not make AYP and were identified for improvement during the period for which data were available. In 2003–04, for example, 35 percent of schools in the state did not make AYP. The following year, 18 percent of the state’s schools were identified for improvement. Although longitudinal student-level data were unavailable statewide, the research team had access to longitudinal student-level data for two large districts in the state. State 1 had a relatively well-developed system of test-based accountability in place prior to NCLB.
State 2 had fewer schools (883 Title I elementary and middle schools were included in the study), but enough schools to enable us to analyze the effect of missing AYP. In 2003–04, over one-fourth of all schools in the state did not make AYP. A similar number missed AYP in the preceding year. For State 2, as for State 1, we lacked longitudinal student achievement data statewide, but we had longitudinal student achievement data for a large district. State 2 had a less-developed system of test-based accountability in place prior to NCLB.
Additional details about the study’s sites are included in Appendix B.
ORGANIZATION OF THIS REPORT
The remainder of this report begins with an explanation of RD analyses (Chapter II) and moves on to the results of the school-level RD analyses (Chapter III), and the results of the student-level RD analyses (Chapter IV). Chapter V presents our conclusions and implications.
In addition to examining effects for students at different points in the achievement distribution, we carried out analogous stratified analyses for other subgroups of students, including different racial or ethnic groups (white, Hispanic, black), special education students, limited English proficiency (LEP) students, economically disadvantaged students (two of three districts), whether students were in the same school last year, and whether students were held back or not held back in grade last year. The results for each of these subgroups—examined in all three districts—are provided in Appendix A.
5 The number of Title I high schools was much smaller than the number of Title I elementary and middle schools in both states. Moreover, in State 1, the proportion of high schools with missing scores was substantially higher than the proportion of elementary and middle schools with missing scores, and the proportion of high schools that did not make AYP solely for reasons other than proficiency rates (i.e., graduation or attendance rates) was nontrivial.

Chapter II 7
II. USING RD TO EXAMINE THE EFFECTS OF NOT MAKING AYP AND IDENTIFICATION FOR IMPROVEMENT
This chapter describes the RD method used in the two subsequent chapters (with school-level data and student-level data) to estimate the effects of not making AYP and becoming identified for improvement on student achievement.
RD differs markedly from other quasi-experimental designs and may be viewed by lay readers as counterintuitive, because it uses treatment and comparison groups that are different by definition. However, although the “treated” schools (e.g., those that miss AYP) and untreated schools are not equivalent because the pre-score distributions do not overlap, RD can produce unbiased estimates of treatment effects under plausible assumptions. Because the rules for assigning schools to treatment (i.e., for not making AYP) are explicit, controlling for the assignment variable (in this case, the school’s prior proficiency level) fully adjusts for the underlying difference between treatment schools and comparison schools. If we observe a shift (discontinuity) in the relationship between prior proficiency and subsequent achievement at the proficiency cut point used to determine AYP, we have strong evidence that the shift is attributable to not making AYP. Provided that the model between pre- and post-scores is properly specified, the RD design is robust to threats to internal validity; this is because a confounding factor would have to act discontinuously as a function of the pre-score, with the discontinuity coinciding with the cutoff on the assignment variable. Such confounders are extremely unlikely to occur naturally, making RD a powerful method for valid causal inference.
Algebraically, if we define Score_2004 and Score_2003 as the proportion of students in a school achieving proficiency in 2004 and 2003, respectively, the basic linear RD analysis model for school-level data, when AYP and improvement status are determined by proficiency percentages in the preceding year, is:
Score_2004 = μ + Score_2003 + Treatment +
where Treatment is the assignment variable (i.e., an indicator for whether Score_2003 is less than the cutoff) and a normally distributed random error with mean 0. The coefficient is the treatment effect, which is identified by a “jump” in the expected Score_2004 for schools immediately below the cutoff relative to schools immediately above. Later, we discuss how this model becomes more complicated when using achievement data for individual students rather than schoolwide proficiency results.
EXAMINING DISCONTINUITIES IN MULTIPLE DIMENSIONS
One challenge of implementing an RD analysis in the context of NCLB is the complexity of the law’s rules for making AYP and identifying a school for improvement. Schools are required to meet minimum proficiency standards in reading and mathematics, not only schoolwide but also for several subgroups of students (such as low-income students, English-language learners, racial or ethnic minorities, and special education students). Thus, the RD approach cannot be applied in a single dimension with a single cut point. We require an analysis that accounts for the multiple dimensions and multiple cut points defined by NCLB and its associated state accountability systems.
The analyses described below simplify this problem by reducing the multi-dimensional problem to a single dimension, defined as the criterion on which the school achieved its lowest score relative to the cut point. A school does not make AYP if it falls short on any one of the various subgroups and subject

Chapter II 8
tests.6 As a result, examining all subgroups to find the score that is lowest as compared to the cut point is sufficient to determine whether a school makes AYP. In other words, each school’s worst proficiency result must exceed the state standard for the school to make AYP. Thus, we can conduct an RD analysis that examines whether a discontinuity exists at the cut point of the dimension that represents the lowest score for each school.
Examining the effect of identification for improvement (rather than the effect of not making AYP) requires an additional step to distinguish schools that are merely warned (because they did not make AYP only once) from those that are identified for improvement. Many states, including State 1 and State 2 in our analyses, identify schools for improvement only if they do not make AYP two years in a row for
the same subject. Such rules preclude the straightforward use of the “minimum score” RD method for assessing the effects of identification, because the minimum score in the second year does not necessarily determine identification (i.e., a school’s minimum score may fall short of AYP in two consecutive years, but if it falls short for reading in one year and math in the other year, it will not be identified for improvement).
The most straightforward way to undertake such an analysis is to begin by shrinking the pool of schools to those that did not make AYP two years ago but were not yet identified for improvement. Two different subsets of schools are relevant. First, consider schools that missed AYP in 2002–03 for one subject or the other (but not both), and that were not (yet) identified for improvement. In each of those schools, becoming identified for improvement in 2004–05 was fully determined by its minimum (across subgroups) 2003–04 proficiency rate for the subject that was the reason it did not make AYP in 2002–03. Thus, we can run an RD analysis on the effect of the first year of identification for improvement, using each school’s minimum 2003–04 proficiency rate on its 2002–03 failed subject as the assignment variable.
Second, consider schools that missed AYP in 2002–03 for both subjects, and that were not (yet) identified for improvement. In each of those schools, becoming identified for improvement in 2004–05 was fully determined by its minimum subgroup-subject proficiency rate in 2003–04. Because these schools did not make AYP in 2002–03 in both subjects, they had to achieve AYP in both subjects in 2003–04 to avoid identification. As a result, the minimum-score RD analysis can be used to assess the effect of identification for this group of schools.
In practice, we combined the two methods described in the preceding paragraphs into a single RD analysis that uses the appropriate minimum score for each school, as determined by its previous year’s results.
The major stumbling block for an RD analysis of identification for improvement is sample size. The analysis requires excluding all schools that were already identified for improvement at the beginning of the data series (i.e., based on their performance under the law preceding NCLB) and then subsetting the remaining schools into two groups for separate analyses. Among the schools included in each of the two subsets described above, it further requires sufficient numbers that reached AYP in the second year and that did not make AYP in the second year. In fact, however, AYP status within schools is correlated over time: Most schools that do not make AYP in one year do not make it the next year, while most schools that meet AYP one year also meet it the next year. Later, we describe how these numbers worked out in State 1 and State 2.
6 Most states have established minimum group sizes for subgroup accountability purposes. Schools are accountable for the achievement of each subgroup only if the subgroup exceeds the state’s minimum group size.

Chapter II 9
AVOIDING MISIDENTIFICATION OF DISCONTINUITIES
Valid inference with RD analyses relies heavily on proper model specification. Incorrect specification of the underlying relationship between the assignment variable and the outcome variable—for example, failure to adequately capture nonlinearities—can lead to the identification of nonexistent discontinuities (and nonexistent treatment effects). Nonlinearities might result from a structural relationship between school performance and the magnitude of change in school performance. They may also result from measurement error in school performance when performance is nonlinearly related to school size or from floor or ceiling effects for school-level outcomes, which cannot go below zero percent proficient. We used two primary approaches to avoid misidentification of discontinuities.
First, for school-level RD analyses, we complemented linear models with polynomial models and generalized additive models (or GAMs) (Hastie and Tibshirani, 1990). GAMs, like models that include polynomial terms in the assignment variable, relax the assumption of a linear relationship between the assignment and outcome variables.
Second, for both school-level and student-level RD analyses, we restricted the analyses to schools whose value of the assignment variable was within a specified range of the AYP cut point. The RD design is most compelling in assessing differences in performance between schools near the point of discontinuity. Restricting the range of the data to schools near the cut point reduces the likelihood that estimates will be biased by influential outliers or nonlinearities occurring far from the cut point. Indeed, linear analyses that did not restrict the data range (not reported here) produced results that often differed from those of the restricted models, and diagnostics performed on those models indicated that the differences resulted from misspecification of the unrestricted models.
Although restricting the range reduces the chance of model misspecification, it also, unfortunately, erodes efficiency by reducing the number of cases contributing to the estimate. For statewide, school-level analyses in State 1, with relatively large numbers of schools—and where it was imperative to guard against bias introduced by floor effects, given low proficiency requirements for AYP—we used a tight restriction of plus or minus 5 percentage points of the appropriate AYP cutoff (in math, for example, where meeting AYP required achieving a proficiency rate of at least 16 percent, we examined schools with math proficiency of the lowest-scoring subgroup ranging from 11 percent to 21 percent). In State 2, we had less statistical power and less concern about floor effects (because proficiency requirements for AYP were higher), but we nevertheless also used a five-point window because results with the ten-point window were sometimes inconsistent. For student-level analyses carried out in two of the three large districts, where we had access to scaled scores and floor effects were not a serious concern, we included schools with assignment variable values within 10 percentage points of the appropriate AYP cutoff. For student-level analyses in the largest of the three districts, we used a five-point window, because we had more than adequate statistical power with that window and no reason to use a larger frame.


Chapter III 11
III. SCHOOL-LEVEL RD ANALYSIS IN TWO STATES
This chapter describes RD analyses conducted using school-level proficiency data in two states. In both states, we examined the impact of not making AYP on a school’s proficiency rates in the subsequent year. In the larger state (State 1), we also examined the impact on schools not making AYP for the first time (as distinguished from all schools missing AYP in the first analysis) and the impact on schools that become identified for improvement.
We found that not making AYP was associated with a small positive effect on the proficiency rate of the lowest-achieving
subgroup from the preceding year, but only in one of the two states examined and only in one of two years examined in that
state. In that state, we found no evidence of a student achievement impact associated with not making AYP ffo r t he f i rs t
t ime and no evidence of a student achievement impact associated with identification for improvement.
STATE ACCOUNTABILITY SYSTEM AND SCHOOL-LEVEL DATA: STATE 1
In State 1, the statewide RD analysis was restricted to the 4,570 schools that were Title I elementary and middle schools in both 2002–03 and 2003–04. It examined the effects in 2003–04 and 2004–05 of AYP designations that were determined by student achievement results in the preceding year (2002–03 and 2003–04, respectively).
As in other states, the AYP rules in State 1 are complex. They include the following:
• Minimum proficiency requirements schoolwide in reading and math.
• The same minimum proficiency requirements applied to subgroups of students classified by race, ethnicity, poverty, LEP, and special education status.
• A provision that a subgroup is counted for AYP purposes only if the subgroup has a minimum of 100 tested students in the school or 50–99 tested students constituting at least 15 percent of the school’s tested population.
• A “safe harbor” provision that allows schools short of proficiency targets to meet AYP if they have shown large achievement gains since the previous year.
• A provision that allows schools with fewer than 100 students in a relevant subgroup to meet the AYP requirement for that subgroup through a statistical confidence interval even if the actual proficiency percentage is below the AYP cut point.
• A requirement that 95 percent of students participate in testing.
• An additional achievement objective (referred to in the NCLB law as an “other academic indicator”)—graduation rate for high schools and a measure tied to the separate state performance measure for elementary and middle schools.
The RD analyses conducted for this report incorporated schoolwide proficiency targets, subgroup proficiency requirements, and the subgroup size thresholds. We excluded schools that did not make AYP but met targets for reading and mathematics proficiency (i.e., schools that missed AYP only because of test participation rates or the “other academic indicator”), because the primary interest is

Chapter III 12
whether schools that fall short of NCLB’s academic standards are subsequently able to increase their academic performance. However, an alternative analysis that included these schools in the comparison group—implicitly viewing the treatment of interest as not making AYP for proficiency reasons (rather than not making AYP for any reason)—produced virtually identical results to those described below. We also excluded schools that met AYP but did not meet all proficiency targets (which could occur because of the safe harbor or confidence interval options permitted under the law). These schools were excluded from our primary analyses, but incorporated in a sensitivity analysis; results indicated that their exclusion did not make a meaningful difference.7
These two exclusions removed only a small number of schools from the analysis. The great majority of elementary and middle schools in State 1 that did not make AYP in 2002–03 and (especially) in 2003–04 fell short because they missed one or more proficiency targets in reading or math (schoolwide or for at least one subgroup), as seen in Exhibit 2. And the great majority of elementary and middle schools that made AYP met all the proficiency targets, without resort to safe harbor or confidence intervals.
Exhibit 2 Numbers of Title I Elementary and Middle Schools in State 1, by Overall
AYP Status and AYP Proficiency Components, 2002–03 and 2003–04
AYP Status in 2002–03 (n=4,579)
AYP Status in 2003–04 (n=4,570)
Not Met Met Not Met Met
Not met 1,804 60 1,689 73
Met 266 2,409 44 2,714
Missing data 11 29 9 41
AYP proficiency components status (whether schools met AYP targets for math and reading proficiency)
Total 2,081 2,498 1,742 2,828
Exhibit reads: Of the 2,081 Title I elementary and middle schools in State 1 that did not make AYP targets in 2002–03, 1,804 did not meet AYP targets for math or reading proficiency, 266 did meet proficiency targets (but did not make other AYP targets), and proficiency status was unknown for 11 schools.
Of the 2,081 Title I elementary and middle schools in State 1 in 2002–03 that missed AYP, only 266 had met all reading and math proficiency targets. Almost all the 266 did not make AYP because their test participation rates were below the 95 percent requirement. The next year, the number of schools not making AYP solely for non-proficiency reasons declined to 44 schools statewide. Meanwhile, 60 schools in 2002–03 and 73 in 2003–04 did not meet all math and reading proficiency targets but were deemed as making AYP, presumably because of the safe harbor or confidence interval provisions. (Only 12 schools in the state did not meet other provisions of AYP but met the safe harbor standard in 2002–03).
STATE ACCOUNTABILITY SYSTEM AND SCHOOL-LEVEL DATA: STATE 2
Rules for meeting AYP in State 2, as in State 1, were complicated. Exhibit 3 shows the extent to which the proficiency cut points for AYP in fact determined official AYP status for these schools in 2002–03 and 2003–04. State 2 set AYP requirements at 40 percent of students achieving proficiency in both reading and math in these two years. However, the state used a 95 percent confidence interval, as permitted under the statute, to address the possibility of random error in small groups, with the result
7 The sensitivity analysis incorporated these schools in the treatment group. Although they are not in fact labeled as not making AYP, such an analysis is analogous to an “intent to treat” analysis that includes subjects dropped from the treatment group. This analysis produced results that did not differ meaningfully from those presented below.

Chapter III 13
that some schools with student proficiency rates slightly below 40 percent were deemed to have made AYP.8 For the overwhelming majority of schools, official AYP status was in fact determined by whether the school had met the state’s proficiency cut points in reading and math schoolwide and for all relevant subgroups. We present results based on analyses that excluded the small number of schools for which official AYP status was not determined by meeting the proficiency cut points.
Exhibit 3 Numbers of Title I Elementary and Middle Schools in State 2, by Overall
AYP Status and AYP Proficiency Components, 2002–03 and 2003–04
AYP Status in 2002–03 (n=855)
AYP Status in 2003–04 (n=883)
Not Met Met Not Met Met Not met 517 7 483 6
Met 29 302 8 386
Missing data 0 0 0 0
AYP proficiency components status
(whether schools met AYP targets for math and reading proficiency)
Total 546 309 491 392
Exhibit reads: Of the 546 Title I elementary and middle schools in State 1 that did not make AYP targets in 2002–03, 517 did not meet AYP targets for math or reading proficiency, and 29 did meet proficiency targets (but did not meet other AYP targets).
EFFECT OF NOT MAKING AYP
As described in the preceding chapter, the analysis makes use of a “minimum score” approach to characterizing the rule for determining whether a school makes AYP: Among the universe of Title I elementary and middle schools under consideration, a school with a minimum score for any subgroup that is below the state’s proficiency cutoff in reading and math will not make AYP, and a school with a minimum greater than the cut will make AYP. With the data used, these classifications match the official AYP status (with a few exceptions as noted above), therefore meeting the requirements of the RD analysis.
Because the AYP cut points were different for math and reading in State 1 (16 percent proficient for math and 14 percent proficient for reading in elementary and middle schools in 2002–03 and 2003–04), a standardized value of the minimum score was created by subtracting the specific subject cut point from the minimum score obtained. Thus, a standardized score less than zero did not make AYP regardless of the subject or the subgroup. Data were restricted to schools whose minimum scores were within 5 percentage points of the proficiency cut point to reduce the likelihood of model misspecification and to reduce the likelihood of floor effects that could result given the low proficiency thresholds for meeting AYP.
Results were analyzed separately for 2003–04 effects (based on 2002–03 AYP determinations) and for 2004–05 effects (based on 2003–04 AYP determinations). For 2003–04 results, the standardized minimum score in 2002–03 was used as the assignment variable in the RD model. For 2004–05 results, the standardized minimum score in 2003–04 was used as the assignment variable. In each of the two
8 The use of confidence intervals is designed to reduce the likelihood that schools will be incorrectly labeled as not making AYP; by 2006–07, a majority of states had received approval to apply confidence intervals to AYP calculations, most often at the 95 percent or 99 percent level. A confidence interval is a statistical calculation that provides an estimated range of values that includes the observed performance plus an allowance for sampling error. Confidence intervals take into account the fact that the students tested in any particular year might not be representative of students in that school across the years.
Chapter III 14
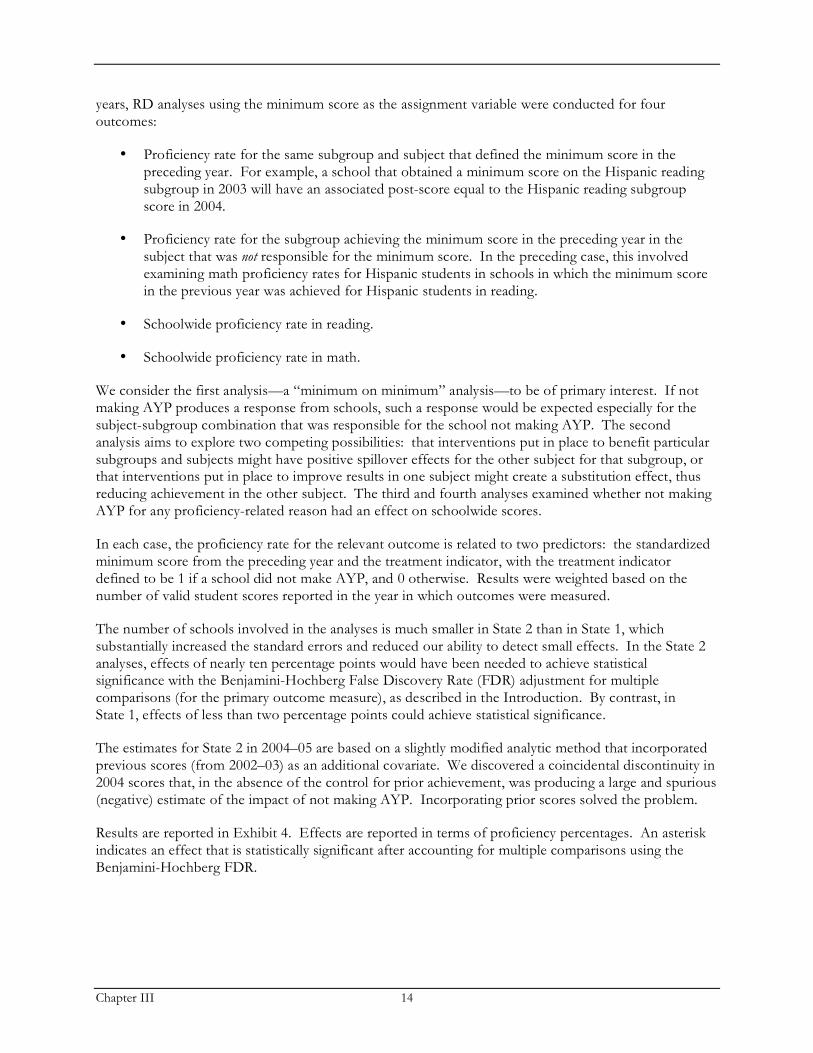
years, RD analyses using the minimum score as the assignment variable were conducted for four outcomes:
• Proficiency rate for the same subgroup and subject that defined the minimum score in the preceding year. For example, a school that obtained a minimum score on the Hispanic reading subgroup in 2003 will have an associated post-score equal to the Hispanic reading subgroup score in 2004.
• Proficiency rate for the subgroup achieving the minimum score in the preceding year in the subject that was not responsible for the minimum score. In the preceding case, this involved examining math proficiency rates for Hispanic students in schools in which the minimum score in the previous year was achieved for Hispanic students in reading.
• Schoolwide proficiency rate in reading.
• Schoolwide proficiency rate in math.
We consider the first analysis—a “minimum on minimum” analysis—to be of primary interest. If not making AYP produces a response from schools, such a response would be expected especially for the subject-subgroup combination that was responsible for the school not making AYP. The second analysis aims to explore two competing possibilities: that interventions put in place to benefit particular subgroups and subjects might have positive spillover effects for the other subject for that subgroup, or that interventions put in place to improve results in one subject might create a substitution effect, thus reducing achievement in the other subject. The third and fourth analyses examined whether not making AYP for any proficiency-related reason had an effect on schoolwide scores.
In each case, the proficiency rate for the relevant outcome is related to two predictors: the standardized minimum score from the preceding year and the treatment indicator, with the treatment indicator defined to be 1 if a school did not make AYP, and 0 otherwise. Results were weighted based on the number of valid student scores reported in the year in which outcomes were measured.
The number of schools involved in the analyses is much smaller in State 2 than in State 1, which substantially increased the standard errors and reduced our ability to detect small effects. In the State 2 analyses, effects of nearly ten percentage points would have been needed to achieve statistical significance with the Benjamini-Hochberg False Discovery Rate (FDR) adjustment for multiple comparisons (for the primary outcome measure), as described in the Introduction. By contrast, in State 1, effects of less than two percentage points could achieve statistical significance.
The estimates for State 2 in 2004–05 are based on a slightly modified analytic method that incorporated previous scores (from 2002–03) as an additional covariate. We discovered a coincidental discontinuity in 2004 scores that, in the absence of the control for prior achievement, was producing a large and spurious (negative) estimate of the impact of not making AYP. Incorporating prior scores solved the problem.
Results are reported in Exhibit 4. Effects are reported in terms of proficiency percentages. An asterisk indicates an effect that is statistically significant after accounting for multiple comparisons using the Benjamini-Hochberg FDR.

Chapter III 15
Exhibit 4
Effect of Not Making AYP on Proficiency, School-Level RD Estimates in Two States, 2003–04 and 2004–05
Effect in Proficiency Percentage Points (Standard Error, n) Outcome
Outcome Year
State 1 State 2
2003–04 1.41a (0.40, 1,669) 2.79 (3.50, 150) Lowest-achieving subgroup from prior year, same
subject (primary outcome) 2004–05 0.17 (0.47, 1,791) -1.59 (3.41, 159)
2003–04 -0.33 (0.74, 1,666) 0.82 (4.51, 150) Lowest-achieving subgroup from prior Year, other
subject 2004–05 -0.52 (0.81, 1,786) 0.09 (3.03, 159)
2003–04 1.98 (0.92, 1,670) 5.01 (3.36, 153) Schoolwide reading
2004–05 0.00 (0.93, 1,791) -4.45 (2.71, 178)
2003–04 0.39 (0.91, 1,670) -2.21 (4.45, 153) Schoolwide math
2004–05 -0.40 (0.91, 1,791) -3.89 (2.60, 178)
Exhibit reads: In State 1, schools not making AYP in 2002–03 achieved an average 1.41 percentage points increase in proficiency for the lowest-scoring subgroup-subject combination in 2003–04.
a statistically significant using Benjamini-Hochberg FDR of 0.1.
In State 1, not making AYP in 2002–03 was associated with a positive effect of 1.4 percentage points on the proficiency rate in 2003–04 for the lowest-scoring subgroup-subject combination from 2002–03. But the effect was not repeated the following year.
None of the other results in State 1 achieved statistical significance. Exhibit 5 displays the graphical results for the positive estimate in 2003–04 for the lowest-achieving subgroup from the prior year (same subject).
In State 2, not making AYP was not associated with statistically significant effects on any achievement outcomes in either of the two years examined.
Moreover, a number of the signs of the estimates in State 2 did not point in consistent directions (see Exhibit 4). However, it is important to keep in mind that effects would have needed to be much larger in State 2 than in State 1 to achieve statistical significance.
To guard against the possibility of model misspecification, we complemented linear models with nonparametric models, including quadratic models and GAMs. The quadratic and GAM results (not reported here) were generally similar to the linear model fits, thus supporting the adequacy of the linear model assumption.

Chapter III 16
Exhibit 5
Data Plot for RD Analysis of 2002–03 AYP Status and 2003–04 Proficiency, Lowest-Achieving Subgroup from Previous Year, Elementary and Middle Schools in State 1
Exhibit reads: The discontinuity at point 0 between the two regression lines indicates a positive treatment effect of not making AYP on the lowest scoring subgroups in State 1.
For the one case in which statistically significant results were found, we conducted sensitivity tests to examine whether discontinuities would be detected at points other than the AYP cut point. Those analyses confirmed that the largest discontinuities were observed at or very close to the AYP cut point.9
We also conducted RD analyses of the effect of not making AYP on changes in the demographic characteristics of the school’s population, to ensure that any discontinuities evident in achievement results were not driven by population changes. We found no evidence of any effect of not making AYP on student demographics in State 1.
9 We set possible standardized thresholds to be a point between –5 and 5, and for every standardized minimum score obtained by a school, we assumed that the school did not make AYP (treatment group) if its score was smaller than the defined threshold; if not, the school was included in the comparison group. We then fit the RD analysis using the new defined treatment and comparison groups and recorded the treatment effect. This procedure was repeated for 100 evenly selected possible threshold points between minus 5 and 5. These tests suggest that the analyses satisfy the major requirements of the RD approach and that the effects obtained are not just model artifacts.
2003 Score Minus cut where minimum was obtained in 2003
20
04
Sco
re w
he
re m
inim
um
wa
s o
bta
ine
d in
20
03

Chapter III 17
The RD analysis that examined changes in the characteristics of tested students in State 2, by contrast, suggested a different story.
Schools not making AYP in 2003 in State 2 saw statistically significant declines in the percentage of low-income and minority students in tested grades in 2004.
Not making AYP in 2003 was associated with a 6 percentage point drop in the proportion of low-income students and a 3 percentage point drop in the proportion of minority students among the school’s tested population in 2004 in State 2. Such effects might occur, for example, if not making AYP led schools to be more aggressive in holding back low-achieving students to repeat grades and if low-achieving students were disproportionately low-income and minority students. But, as shown in Exhibit 4, this change did not produce a statistically significant increase in schoolwide proficiency rates, as might have been expected. The effects on the characteristics of tested students were not replicated the following year, nor were they evident in State 1. Nevertheless, these results are suggestive for future analyses.
Future studies of NCLB effects that rely on school-level data should conduct supplemental analyses to confirm that any observed achievement effects are not the result of demographic shifts rather than actual changes in the performance of schools.
Effect of Not Making AYP for the First Time (State 1)
The results presented in Exhibit 4 assessed the effect of not making AYP regardless of whether a school had not made AYP in the past and regardless of whether the school was identified for improvement. It is possible, however, that schools are differentially affected by missing AYP the first time they miss it. Therefore, we conducted a separate analysis that examined only schools that were not already identified for improvement and that did not previously make AYP. This analysis was limited to a single outcome year (2004–05), because it required looking backward at prior results to determine that schools had not previously missed AYP. It was also limited to State 1, because not enough schools could be included in a “first-time not making AYP” analysis in State 2. For the primary outcome of interest, effects of about 2 percentage points could be detected after making the FDR adjustment for multiple comparisons. The results are shown in Exhibit 6.
Among schools not making AYP for the first time in State 1, there were no statistically significant effects for any of the achievement outcomes examined (see Exhibit 6).

Chapter III 18
Exhibit 6
Effect of Not Making AYP for the First Time on Proficiency, School-Level RD Estimates in State 1, 2004–05
Outcome n Effect in Proficiency Percentage Points
(Standard Error)
Lowest-achieving subgroup from prior year, same subject (primary outcome)
759 0.79 (0.78)
Lowest-achieving subgroup from prior year, other subject 756 1.44 (1.26)
Schoolwide reading 759 0.31 (1.53)
Schoolwide math 759 2.45 (1.44)
Exhibit reads: In State 1, not making AYP for the first time in 2003–04 did not have a statistically significant effect in 2004–05 on the proficiency of the lowest achieving subgroup from 2003–04.
EFFECT OF BEING IDENTIFIED FOR IMPROVEMENT (STATE 1)
As previously described, examining the effect of identification for improvement using the RD method is more complicated than examining the effect of not making AYP. Because identification for improvement occurs only after a school has not made AYP twice, it is necessary to make use of an additional year of historical data and to create a subset of schools based on previous AYP status. In State 2, subsetting schools this way does not leave enough sample size to conduct an analysis of the effect of identification for improvement. In State 1, we examined two subsets of schools. The first group included schools that did not make AYP for the first time in 2002–03 in one subject, using each school’s minimum 2003–04 proficiency rate on its 2002–03 failed subject as the assignment variable (because the school’s scores in the same subject the following year determine whether it will be identified for improvement). The second group included schools that missed AYP for the first time in 2002–03 for both subjects, using each school’s minimum 2003–04 proficiency rate in either subject as the assignment variable.
Combined, these two methods should distinguish between identified and nonidentified schools’ 2003–04 AYP results. Exhibit 7 shows the distribution of State 1 Title I elementary and middle schools in the relevant subsets. The two subsets were combined in an RD analysis that involves examining the minimum score for all subgroup-subject combinations for which the school is accountable for determining identification for improvement. For schools that had did not make AYP in only one subject in 2003, we examined the minimum score only for the same subject in 2004. For schools that did not make AYP in both subjects in 2003, we examined the minimum score in both subjects in 2004. The RD analysis that examines the effect of identification for improvement in 2004 on 2005 outcomes included 401 schools (232+169) in treatment (identified for improvement) and 229 schools (188+41) in the comparison group (nonidentified for treatment). This population was then restricted to the schools with 2004 minimum scores falling within five points of the AYP cut point.
As Exhibit 7 indicates, the assignment rules used for this analysis did not perfectly predict identification for improvement as reported by the state. A small number of schools (22) were identified for improvement even though they made AYP in the relevant subject(s), presumably because they did not make AYP in consecutive years for a reason other than proficiency (e.g., test participation rates, other academic indicator).
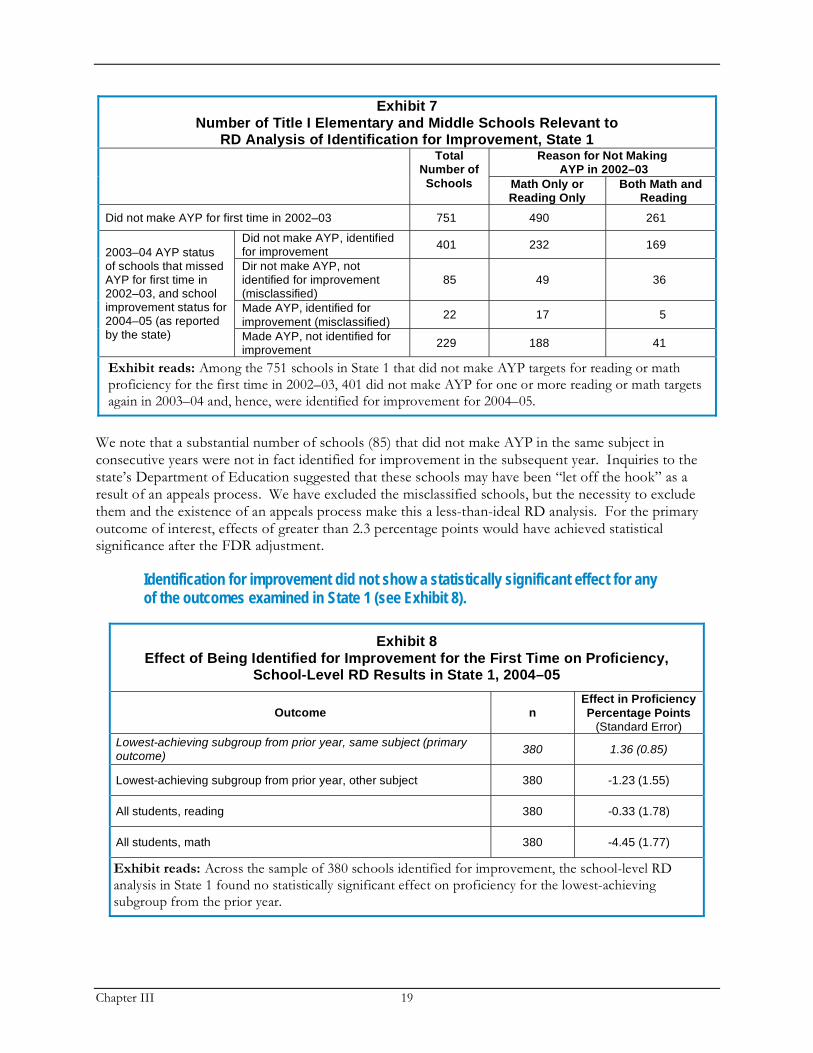
Chapter III 19
Exhibit 7
Number of Title I Elementary and Middle Schools Relevant to RD Analysis of Identification for Improvement, State 1
Reason for Not Making AYP in 2002–03
Total Number of
Schools Math Only or Reading Only
Both Math and Reading
Did not make AYP for first time in 2002–03 751 490 261
Did not make AYP, identified for improvement
401 232 169
Dir not make AYP, not identified for improvement (misclassified)
85 49 36
Made AYP, identified for
improvement (misclassified) 22 17 5
2003–04 AYP status of schools that missed AYP for first time in 2002–03, and school improvement status for 2004–05 (as reported by the state) Made AYP, not identified for
improvement 229 188 41
Exhibit reads: Among the 751 schools in State 1 that did not make AYP targets for reading or math proficiency for the first time in 2002–03, 401 did not make AYP for one or more reading or math targets again in 2003–04 and, hence, were identified for improvement for 2004–05.
We note that a substantial number of schools (85) that did not make AYP in the same subject in consecutive years were not in fact identified for improvement in the subsequent year. Inquiries to the state’s Department of Education suggested that these schools may have been “let off the hook” as a result of an appeals process. We have excluded the misclassified schools, but the necessity to exclude them and the existence of an appeals process make this a less-than-ideal RD analysis. For the primary outcome of interest, effects of greater than 2.3 percentage points would have achieved statistical significance after the FDR adjustment.
Identification for improvement did not show a statistically significant effect for any of the outcomes examined in State 1 (see Exhibit 8).
Exhibit 8
Effect of Being Identified for Improvement for the First Time on Proficiency, School-Level RD Results in State 1, 2004–05
Outcome n Effect in Proficiency
Percentage Points (Standard Error)
Lowest-achieving subgroup from prior year, same subject (primary outcome)
380 1.36 (0.85)
Lowest-achieving subgroup from prior year, other subject 380 -1.23 (1.55)
All students, reading 380 -0.33 (1.78)
All students, math 380 -4.45 (1.77)
Exhibit reads: Across the sample of 380 schools identified for improvement, the school-level RD analysis in State 1 found no statistically significant effect on proficiency for the lowest-achieving subgroup from the prior year.

Chapter III 20
We conducted RD analyses of the effect of identification on changes in the proportion of students who came from low-income families, who were members of racial or ethnic minority groups, or who had limited English proficiency. Schools that became identified for improvement saw no changes in the representation of these populations that distinguished them from nonidentified schools.10
Given the high rate of exclusion in the analysis conducted for Exhibit 8, we also conducted an “intent-to-treat” analysis that ignored misclassification and included all schools, regardless of whether they avoided identification through appeal, in examining achievement effects. This can produce an unbiased estimate of the effect of “intending” to treat schools based on the AYP proficiency rules used for identification for improvement, but such an effect is likely to underestimate the effect of treatment on schools actually treated, because nonidentified schools are included in the group of those intended to be treated.
As expected, the effect estimates in the intent-to-treat analysis (not presented here) were generally smaller than those in Exhibit 8. However, at the same time, the intent-to-treat estimate for the effect of identification on the lowest-achieving group actually increased from 1.36 to 1.63 percentage points. But this positive result was not robust to different model specifications—it was not evident when using quadratic or generalized additive models, so we have little confidence in it.
10 In the two large districts in State 1 where we had student-level data, we also compared the pre-identification achievement levels of students in the schools before and after identification, to examine whether there was any evidence that schools might be losing students with higher math scores when they become identified for improvement. We found no evidence that identified schools in those districts were losing higher-achieving students.

Chapter IV 21
IV. RD ANALYSIS OF STUDENT-LEVEL ACHIEVEMENT DATA IN THREE LARGE DISTRICTS
This chapter describes the results of RD analyses that used longitudinal, student-level data (rather than aggregate, school-level data as in Chapter III) to assess the effect on student achievement of schools’ not making AYP, not making AYP for the first time, and becoming identified for improvement. We examined the effect of not making AYP in three large districts, two of which are in State 1 and one of which is in State 2. As in the statewide, school-level analyses, the sample size constraints limit the sites where we could usefully examine the effect of missing AYP for the first time and the effect of becoming identified for improvement. Thus, we examined those particular effects only in the largest of the three districts, which is in State 1.
Longitudinal, student-level data have several advantages over the schoolwide averages used in the RD analyses discussed in the preceding chapter. First, they are robust to possible changes in the student populations of treated schools.11 Second, student-level data enable us to examine whether effects differ for different populations of students beyond the subgroups that are explicitly measured for AYP purposes. Finally, using individual student-level data allows us to control for individual students’ prior achievement, which removes a large source of the variation in current achievement outcomes and, thus, greatly improves the efficiency of estimates.
Thus, the analyses presented in this chapter aim to combine the internal validity benefits of RD with the richer information available in student-level data.
We found some evidence of significantly positive achievement impacts associated with not making AYP in two of three
districts, but these impacts were not consistent across years. In the largest district, we found little evidence of impacts of not
making AYP ffo r t he f i rs t t ime or of identification for improvement. We also found no evidence that “bubble
students”—those with prior achievement levels just short of proficiency—experienced larger gains than other students in
schools that did not make AYP.
DATA
The data used for these analyses are longitudinally linked, individual student-level reading and mathematics achievement scores for students in two districts in State 1 and one district in State 2. The data encompass grades 2–8 in the two State 1 districts (henceforth described as Districts A and B) and grades 3–8 in the State 2 district (henceforth described as District C), for school years 2002–03, 2003–04 and 2004–05. We refer to these school years by their spring years (2003, 2004 and 2005, respectively) for the remainder of the discussion. We present two parallel sets of analyses: One examined the effect of not making AYP in 2003 on scores in 2004 and another examined the effect of not making AYP in 2004 on scores in 2005. For each of 2004 and 2005, two basic types of RD analyses were performed, and for each of these basic types, we considered various outcomes.
One unique feature of the District C data is that achievement results are from a district-mandated, nationally normed test, rather than from the test used to determine AYP status in State 2. This changes the interpretation of the results, because schools that do not meet AYP may emphasize preparation for
11 Student populations might change systematically, for example, if high-achieving students opt out of identified schools through the Title I school-choice option. However, results from the nationwide sample of districts surveyed for the NLS-NCLB suggest that participation rates for the school choice provision of NCLB have been on the order of 1 percent of eligible students (Stullich et al., 2007). As a result, the choice provision is unlikely to produce a measurable change in the composition of school populations.

Chapter IV 22
the tests that count for NCLB purposes rather than the test that does not. Arguably, the use of an alternate outcome measure that does not carry accountability consequences allows for a more-robust assessment of whether any measured achievement effects involve generalizable skills and knowledge rather than test-specific skills and knowledge.
The analyses were restricted to schools whose assignment variables were within 10 percentage points of the cut point in two of the districts, and within 5 percentage points of the cutoff in the largest district (one of the State 1 districts). We used a five-point window in the largest district because it included a substantial number of schools in that range and because results in that district, unlike in the other two districts, appeared to be sensitive to the size of the window used.12 The number of schools and students included in the analysis in each of the three districts is described in Exhibit 9.
Exhibit 9
Number of Schools and Students Included in RD Analyses in Three Districts, 2003–04 and 2004–05
District Outcome Year Number of Schools That Did Not Make
AYP
Total Number of Schools Included in
RD Analyses
Number of Students Included
in RD Analyses
2003–04 157 80 78,691 District A
2004–05 173 77 77,796
2003–04 73 34 26,958 District B
2004–05 74 28 28,006
2003–04 106 76 27,928 District C
2004–05 125 72 33,413
Exhibit reads: In District A in 2003–04, 80 of 157 schools that did not make AYP were included in the analysis; these 80 schools contain 78,691 students.
The 2004 analysis was restricted to students who had complete testing data in 2003 and 2004, and the 2005 analysis was restricted to students who had complete testing data in 2004 and 2005. Students were included as long as they either advanced normally in grade or were held back a grade; the few students with anomalous grade changes were eliminated from the analyses. Students were included whether or not they changed schools from the pre-year to the post-year; as a result, these analyses included students who were in the lowest middle school grade in the post-year.
STUDENT-LEVEL RD ANALYSIS APPROACH
The student-level analysis used standardized scaled scores rather than proficiency as the outcome variable. Scaled scores were standardized as rank-based z-scores to increase the plausibility of the
12 As in the school-level analyses presented in the preceding chapter, the student-level analyses in all three sites were restricted to elementary and middle schools for which official AYP status matched the AYP status predicted by the school’s minimum proficiency score. We made sure our results were not sensitive to this restriction by refitting all the models, including the small minority of schools where their assignment variable did not properly characterize AYP status (i.e., conducting “intent-to-treat” analyses); the impacts on the results were minimal. In addition, a few schools with fewer than 10 tested students were excluded from the analyses, as were a few schools for which the school-level AYP data and the student-level data had substantial discrepancies about the percentage of students meeting proficiency.

Chapter IV 23
assumption of a common scale necessary to include scores from different tests in the same regression model.13
In the model, i = 1,...,N indexes all the students in the analysis, s = 1,...,S indexes the schools in which these students are nested, and s(i) denoted the school index s in which student i is enrolled in the outcome year. Zirt denotes the rank-based z-score for student i in year t in reading, and similarly Zimt
denotes the rank-based z-score for student i in year t in math. Ms denotes the minimum score for school s in the assignment year. This is 2003 for the 2004 analysis and 2004 for the 2005 analysis.
For each year, we carried out four analyses in parallel with those used in the school-level analyses described in Chapter 3. Models were fit separately to two groups of students (all students and students belonging to the lowest-achieving groups) and two outcomes (reading and mathematics for all students, and “matched” and “other” subject scores for students belonging to the lowest-achieving groups), for a total of four models per year. The model for reading scores for all students was:
Zirt = a + (b1Zir,t-1 + b2Zir,t-12 + b3Zir,t-13) + (b4Zim,t-1 + b5Zim,t-12 + b6Zim,t-13) + b7Ms(i) + b81(Ms(i) < 0) + cs(i) + eirt
The previous year’s math and reading scores for each student were used as controls in the model.
Based on residual plots, it was necessary to include the third-degree polynomial in each score to improve the plausibility of the model assumptions. Likelihood ratio tests confirmed that these additional terms significantly increased the model fit. Including the prior scores in the model was not necessary to produce unbiased estimates of treatment effect, but it greatly improved the precision of the estimates because the polynomials in the prior scores account for between 60 percent and 70 percent of the total variance in the current year scores. Including the prior year scores in the model not only improves efficiency but also makes the linear functional form specification in the assignment variable (the term b7Ms ) much more plausible because the residuals after controlling for prior scores have an extremely weak relationship with the assignment variable (estimated coefficient on the order of 0.01 or less for all models). The key coefficient in the model is b8, which is the estimate of the effect of not making AYP on the rank-based z-scores of the students in the following year.
Because the model was fit at the individual student level, it was necessary to account for correlations of score residuals of students in the same school to achieve optimally efficient estimates and to produce proper standard error estimates. Thus, the model separated the residuals from the fixed-effect terms into two pieces: the term cs, which is shared by all students in the same school, and the error term eirt, treated as independent and identically distributed normal variables with mean zero and a common variance. The school effects cs are treated as normally distributed random effects with mean zero and a common variance.14
The model for math scores for all students is identical to the model presented above. The models for the “matched” and “other” subjects for students belonging to the lowest-achieving groups have one additional set of terms. Because these models have a mixture of math and reading scores on the left-hand side, it is not reasonable to estimate a single set of coefficients for the adjustments of prior scores because the ability of a prior math score to predict a current math score is different from its ability to
13 The standardization applied to create “rank-based z-scores” was the following: Let F be the empirical cumulative distribution function of the scaled scores for all students in the district in a particular grade, year, and subject. For a given score Y, we let Z = �-1(F(Y)), where �-1 is the inverse standard normal CDF. That is, F(Y) is the percentile on (0,1) of Y in the distribution of scores for a given year, grade and subject, and �-1 maps that percentile to a standardized normal (Z) score. 14 The models were estimated in the R Environment using the linear mixed-effects models routine in the NLME library.
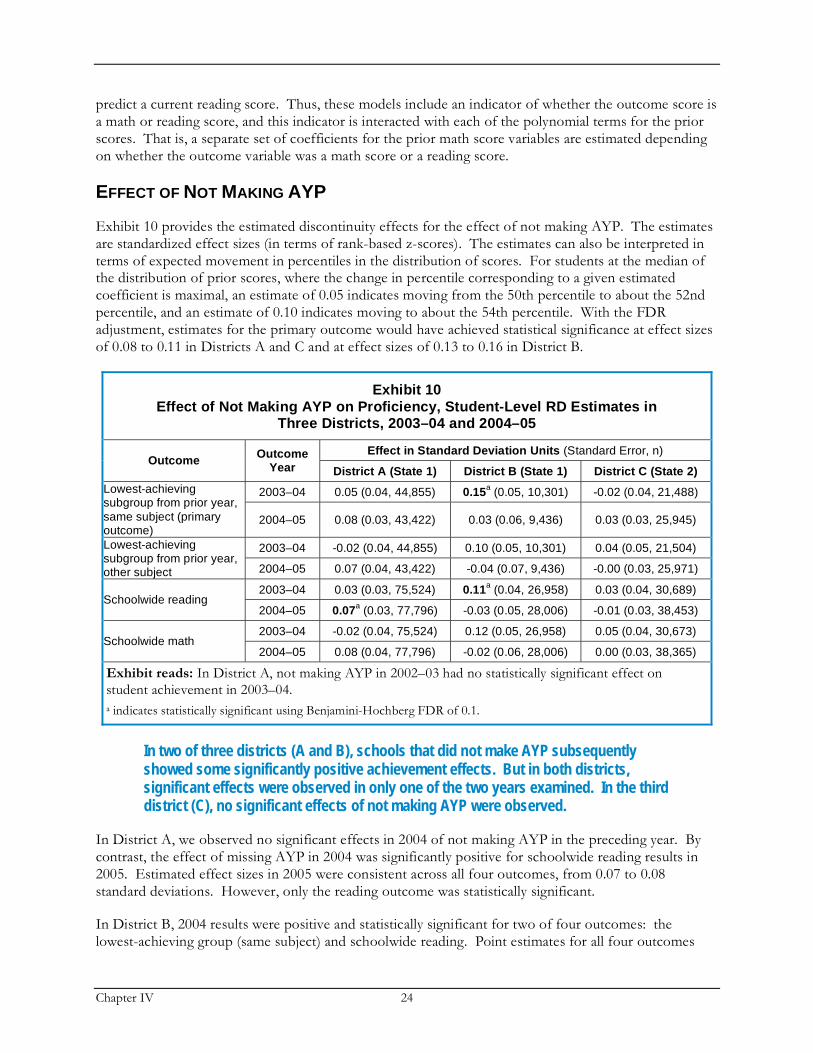
Chapter IV 24
predict a current reading score. Thus, these models include an indicator of whether the outcome score is a math or reading score, and this indicator is interacted with each of the polynomial terms for the prior scores. That is, a separate set of coefficients for the prior math score variables are estimated depending on whether the outcome variable was a math score or a reading score.
EFFECT OF NOT MAKING AYP
Exhibit 10 provides the estimated discontinuity effects for the effect of not making AYP. The estimates are standardized effect sizes (in terms of rank-based z-scores). The estimates can also be interpreted in terms of expected movement in percentiles in the distribution of scores. For students at the median of the distribution of prior scores, where the change in percentile corresponding to a given estimated coefficient is maximal, an estimate of 0.05 indicates moving from the 50th percentile to about the 52nd percentile, and an estimate of 0.10 indicates moving to about the 54th percentile. With the FDR adjustment, estimates for the primary outcome would have achieved statistical significance at effect sizes of 0.08 to 0.11 in Districts A and C and at effect sizes of 0.13 to 0.16 in District B.
Exhibit 10
Effect of Not Making AYP on Proficiency, Student-Level RD Estimates in Three Districts, 2003–04 and 2004–05
Effect in Standard Deviation Units (Standard Error, n) Outcome
Outcome Year District A (State 1) District B (State 1) District C (State 2)
2003–04 0.05 (0.04, 44,855) 0.15a (0.05, 10,301) -0.02 (0.04, 21,488) Lowest-achieving
subgroup from prior year,
same subject (primary outcome)
2004–05 0.08 (0.03, 43,422) 0.03 (0.06, 9,436) 0.03 (0.03, 25,945)
2003–04 -0.02 (0.04, 44,855) 0.10 (0.05, 10,301) 0.04 (0.05, 21,504) Lowest-achieving subgroup from prior year, other subject 2004–05 0.07 (0.04, 43,422) -0.04 (0.07, 9,436) -0.00 (0.03, 25,971)
2003–04 0.03 (0.03, 75,524) 0.11a (0.04, 26,958) 0.03 (0.04, 30,689)
Schoolwide reading 2004–05 0.07
a (0.03, 77,796) -0.03 (0.05, 28,006) -0.01 (0.03, 38,453)
2003–04 -0.02 (0.04, 75,524) 0.12 (0.05, 26,958) 0.05 (0.04, 30,673) Schoolwide math
2004–05 0.08 (0.04, 77,796) -0.02 (0.06, 28,006) 0.00 (0.03, 38,365)
Exhibit reads: In District A, not making AYP in 2002–03 had no statistically significant effect on student achievement in 2003–04.
a indicates statistically significant using Benjamini-Hochberg FDR of 0.1.
In two of three districts (A and B), schools that did not make AYP subsequently showed some significantly positive achievement effects. But in both districts, significant effects were observed in only one of the two years examined. In the third district (C), no significant effects of not making AYP were observed.
In District A, we observed no significant effects in 2004 of not making AYP in the preceding year. By contrast, the effect of missing AYP in 2004 was significantly positive for schoolwide reading results in 2005. Estimated effect sizes in 2005 were consistent across all four outcomes, from 0.07 to 0.08 standard deviations. However, only the reading outcome was statistically significant.
In District B, 2004 results were positive and statistically significant for two of four outcomes: the lowest-achieving group (same subject) and schoolwide reading. Point estimates for all four outcomes
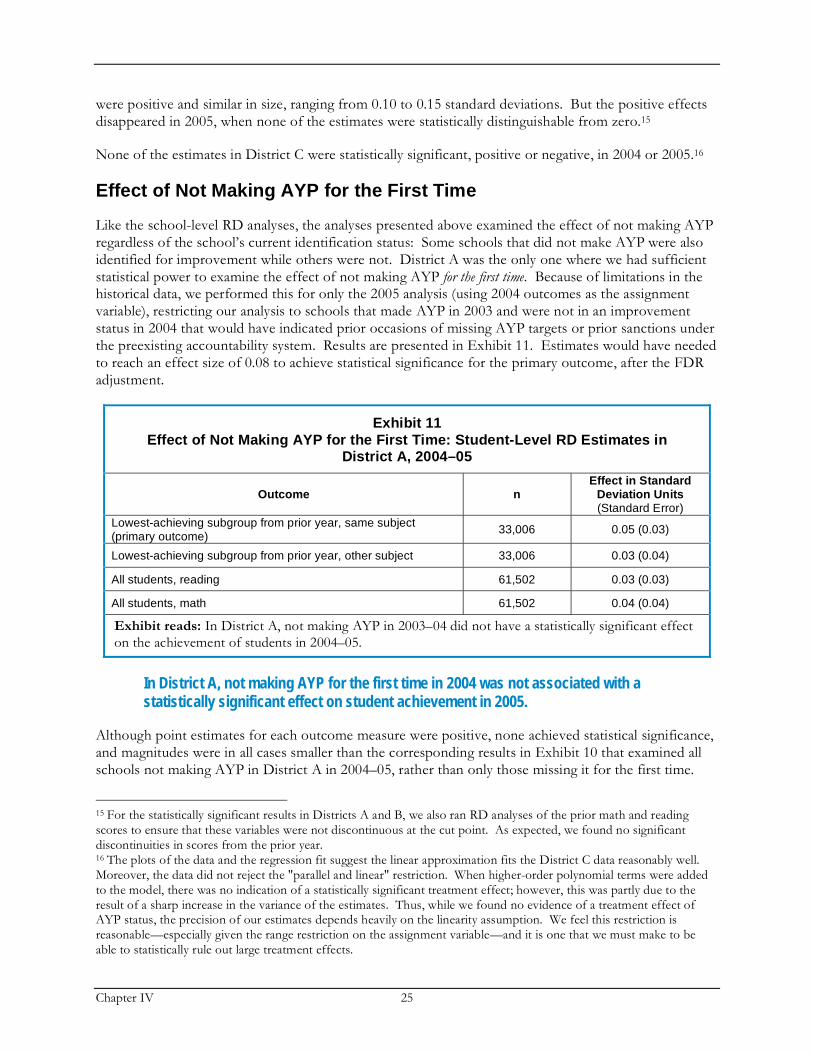
Chapter IV 25
were positive and similar in size, ranging from 0.10 to 0.15 standard deviations. But the positive effects disappeared in 2005, when none of the estimates were statistically distinguishable from zero.15
None of the estimates in District C were statistically significant, positive or negative, in 2004 or 2005.16
Effect of Not Making AYP for the First Time
Like the school-level RD analyses, the analyses presented above examined the effect of not making AYP regardless of the school’s current identification status: Some schools that did not make AYP were also identified for improvement while others were not. District A was the only one where we had sufficient statistical power to examine the effect of not making AYP for the first time. Because of limitations in the historical data, we performed this for only the 2005 analysis (using 2004 outcomes as the assignment variable), restricting our analysis to schools that made AYP in 2003 and were not in an improvement status in 2004 that would have indicated prior occasions of missing AYP targets or prior sanctions under the preexisting accountability system. Results are presented in Exhibit 11. Estimates would have needed to reach an effect size of 0.08 to achieve statistical significance for the primary outcome, after the FDR adjustment.
Exhibit 11
Effect of Not Making AYP for the First Time: Student-Level RD Estimates in District A, 2004–05
Outcome n Effect in Standard
Deviation Units (Standard Error)
Lowest-achieving subgroup from prior year, same subject (primary outcome)
33,006 0.05 (0.03)
Lowest-achieving subgroup from prior year, other subject 33,006 0.03 (0.04)
All students, reading 61,502 0.03 (0.03)
All students, math 61,502 0.04 (0.04)
Exhibit reads: In District A, not making AYP in 2003–04 did not have a statistically significant effect on the achievement of students in 2004–05.
In District A, not making AYP for the first time in 2004 was not associated with a statistically significant effect on student achievement in 2005.
Although point estimates for each outcome measure were positive, none achieved statistical significance, and magnitudes were in all cases smaller than the corresponding results in Exhibit 10 that examined all schools not making AYP in District A in 2004–05, rather than only those missing it for the first time.
15 For the statistically significant results in Districts A and B, we also ran RD analyses of the prior math and reading scores to ensure that these variables were not discontinuous at the cut point. As expected, we found no significant discontinuities in scores from the prior year. 16 The plots of the data and the regression fit suggest the linear approximation fits the District C data reasonably well. Moreover, the data did not reject the "parallel and linear" restriction. When higher-order polynomial terms were added to the model, there was no indication of a statistically significant treatment effect; however, this was partly due to the result of a sharp increase in the variance of the estimates. Thus, while we found no evidence of a treatment effect of AYP status, the precision of our estimates depends heavily on the linearity assumption. We feel this restriction is reasonable—especially given the range restriction on the assignment variable—and it is one that we must make to be able to statistically rule out large treatment effects.
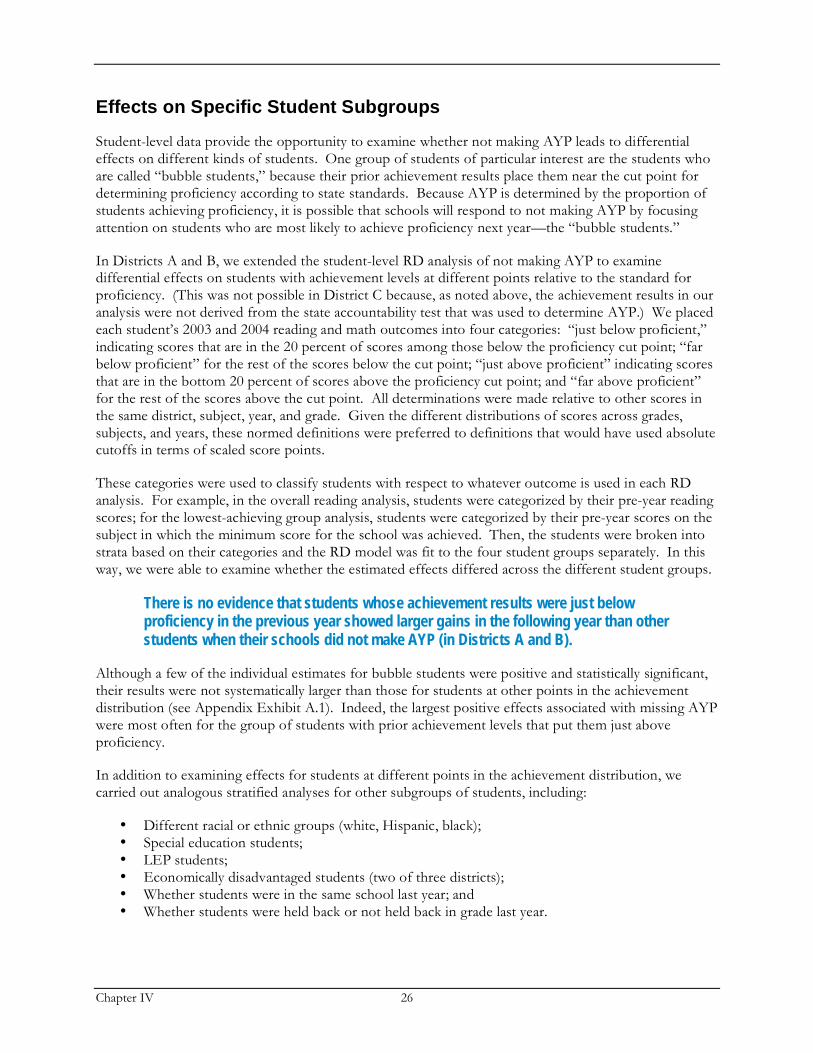
Chapter IV 26
Effects on Specific Student Subgroups
Student-level data provide the opportunity to examine whether not making AYP leads to differential effects on different kinds of students. One group of students of particular interest are the students who are called “bubble students,” because their prior achievement results place them near the cut point for determining proficiency according to state standards. Because AYP is determined by the proportion of students achieving proficiency, it is possible that schools will respond to not making AYP by focusing attention on students who are most likely to achieve proficiency next year—the “bubble students.”
In Districts A and B, we extended the student-level RD analysis of not making AYP to examine differential effects on students with achievement levels at different points relative to the standard for proficiency. (This was not possible in District C because, as noted above, the achievement results in our analysis were not derived from the state accountability test that was used to determine AYP.) We placed each student’s 2003 and 2004 reading and math outcomes into four categories: “just below proficient,” indicating scores that are in the 20 percent of scores among those below the proficiency cut point; “far below proficient” for the rest of the scores below the cut point; “just above proficient” indicating scores that are in the bottom 20 percent of scores above the proficiency cut point; and “far above proficient” for the rest of the scores above the cut point. All determinations were made relative to other scores in the same district, subject, year, and grade. Given the different distributions of scores across grades, subjects, and years, these normed definitions were preferred to definitions that would have used absolute cutoffs in terms of scaled score points.
These categories were used to classify students with respect to whatever outcome is used in each RD analysis. For example, in the overall reading analysis, students were categorized by their pre-year reading scores; for the lowest-achieving group analysis, students were categorized by their pre-year scores on the subject in which the minimum score for the school was achieved. Then, the students were broken into strata based on their categories and the RD model was fit to the four student groups separately. In this way, we were able to examine whether the estimated effects differed across the different student groups.
There is no evidence that students whose achievement results were just below proficiency in the previous year showed larger gains in the following year than other students when their schools did not make AYP (in Districts A and B).
Although a few of the individual estimates for bubble students were positive and statistically significant, their results were not systematically larger than those for students at other points in the achievement distribution (see Appendix Exhibit A.1). Indeed, the largest positive effects associated with missing AYP were most often for the group of students with prior achievement levels that put them just above proficiency.
In addition to examining effects for students at different points in the achievement distribution, we carried out analogous stratified analyses for other subgroups of students, including:
• Different racial or ethnic groups (white, Hispanic, black); • Special education students; • LEP students; • Economically disadvantaged students (two of three districts); • Whether students were in the same school last year; and • Whether students were held back or not held back in grade last year.

Chapter IV 27
The results for each of these subgroups—examined in all three districts—are provided in Appendix A. Again, although various individual estimates are statistically significant, we found no clear patterns for particular student subgroups across outcomes, cities, and years.
There is no evidence that specific subgroups of students defined by race, ethnicity, poverty, special education status, or English-language learner status had systematically larger or smaller achievement gains in schools not making AYP in the previous year (in Districts A, B, and C).
EFFECT OF BEING IDENTIFIED FOR IMPROVEMENT FOR THE FIRST TIME
As with the analysis of missing AYP for the first time, we were only able to conduct an RD analysis of the effect of identification for improvement in the largest of the three districts (District A) because of sample size constraints. In District A, we analyzed the effect of identification for improvement using the same method of subsetting schools that we employed in the statewide, school-level analysis described in the preceding chapter but using longitudinal, student-level data. For this analysis, we included all 65 schools (40 of which were identified for improvement) that were within ten points of the AYP cut point in 2004 to increase statistical power, given the smaller number of schools that could be included. Results are shown in Exhibit 12.
Exhibit 12 Effect of Being Identified for Improvement for the First Time,
Student-Level RD Estimates in District A, 2004–05
Outcome n Effect in Standard
Deviation Units (Standard Error)
Lowest-achieving subgroup from prior year, same subject (primary outcome)
18,535 0.07 (0.06)
Lowest-achieving subgroup from prior year, other subject 18,535 0.09 (0.05)
All students, reading 37,473 0.00 (0.03)
All students, math 37,473 0.02 (0.05)
Exhibit reads: In District A, a school’s being identified for improvement for the first time in 2003–04 had no statistically significant effect on the achievement of students in 2004–05.
Student-level RD analyses in one district (District A) did not provide strong evidence of achievement effects of identification for improvement, but some of the analyses suggested possible positive effects for some outcomes.
None of the estimated effects for schools identified for improvement in 2004–05 achieved statistical significance. For the lowest-achieving group analyses, however, statistical power was limited, such that effects would have needed to be larger than 0.16 standard deviations to achieve significance for the primary outcome, after the FDR adjustments. Analyses using a narrower, five-point window suggested the possibility of larger positive effects, particularly for schoolwide results in mathematics. But these analyses included a relatively small number of schools, and they appeared to be driven largely by a few outliers.


Conclusions 29
V. SUMMARY AND IMPLICATIONS
There is no way to generalize nationally about the effects of elements of the NCLB accountability regime from effects observed in two states and three cities. In those locations, quasi-experimental regression discontinuity (RD) analyses found no consistent effects on student achievement in schools that missed AYP in the preceding year. A few effect estimates were positive, but they were not consistent across years and outcomes. None of the analyses found missing AYP to lead to significantly negative effects in the subsequent year.
Across the two states and three cities, there is no evidence that achievement gains in schools that did not make AYP were concentrated among “bubble” students who had prior achievement scores just below the proficient level.
In the one state and one city where RD analysis could be used to examine achievement effects in schools identified for improvement, no statistically significant achievement effects, positive or negative, were found in schools identified for improvement in the year subsequent to identification.
The RD method could be used in additional states and school districts to estimate the effects of missing AYP or becoming identified for improvement. RD is most useful for assessing such impacts when very large numbers of schools are in treatment or when data are available for individual students longitudinally.
In examining AYP effects using publicly available, school-level proficiency results, the RD method provided sufficient power to detect moderately sized effects in State 1 (the larger state), but in State 2, effects could not be detected unless they were quite large. The sub-setting of schools required for an RD analysis of the effect of identification for improvement further reduces statistical power. In most states, RD analysis of school-level results would not produce results sufficient for reasonable precision in making state-specific estimates of AYP impacts (let alone identification impacts). The use of longitudinal, student-level data dramatically increases the precision of estimates, making RD analysis potentially fruitful for producing local estimates of AYP impact and identification impact in smaller states or large districts (or groups of districts) with such data available.
Even though student-level data are unlikely to be available on a nationwide scale anytime soon, a nationwide study that uses the RD approach on school-level data in conjunction with meta-analytic methods might be able to assess the average effect of missing AYP and the average effect of identification for improvement nationally. Even though the state-specific impact estimates would lack sufficient precision in most states, a meta-analysis of estimates across 50 states might well produce a national estimate with sufficient power to detect small to moderate effects.
Assessing the larger systemic effects of NCLB on all schools (not only those that do not make AYP) would require a different approach, such as one that examines differences in achievement trajectories across states.

References 31
REFERENCES
Andrews, M., Schank, T., and Upward, R. (2004). Practical Estimation Methods for Linked Employer-Employee
Data. Unpublished paper, University of Manchester.
Benjamini, Y., and Hochberg, Y. (1995). “Controlling the False Discovery Rate: A Practical and Powerful Approach to Multiple Testing.” Journal of the Royal Statistical Society, Series B, 57: 289–300.
Cappelleri, J.C., William, M.K., Trochim, T.D., Reichardt, S., and Reichardt, C.S. (1991). “Random measurement error does not bias the treatment effect estimate in the regression-discontinuity design (Part I: The case of no interaction).” Evaluation Review, 15: 295–419.
Chakrabarti, R. (2005). “Impact of Voucher Design on Public-School Performance: Evidence from Florida and Milwaukee Voucher Programs.” National Center for the Study of Privatization in Education (available at www.ncspe.org).
Greene, J.P., and Winters, M.A. (2003). “When Schools Compete: The Effect of Vouchers on Florida Public School Achievement.” Manhattan Institute Education Working Paper #2 (available at www.manhattan-institute.org).
Hahn, J., Todd, P., and van der Klaauw, W. (2001). “Identification and Estimation of Treatment Effects With a Regression-Discontinuity Design.” Econometrica, 69: 201–209.
Hanushek, E.A., Kain, J.F., Rivkin, S.G., and Branch, G.F. (2005). “Charter School Quality and Parental Decision Making with School Choice.” NBER Working Paper, 11252.
Hastie, T., and Tibshirani, R. (1990). Generalized Additive Models. London: Chapman and Hall.
Lee, D. (2006). “Randomized Experiments from Non-Random Selection in U.S. House Elections,” Journal of Econometrics (forthcoming).
Sass, T. (2005). “Charter Schools and Student Achievement in Florida.” Education Finance and Policy, 1: 91–122.
Shadish, W.R., Cook, T.D., and Campbell, D.T. (2002). Experimental and Quasi-Experimental Designs for
Generalized Causal Inference. Boston: Houghton Mifflin.
Stullich, S., Eisner, E., and McCrary, J. (2007). National Assessment of Title I Final Report: Volume I:
Implementation of Title I. Washington, D.C.: U.S. Department of Education, Institute of Education Sciences, National Center for Education Evaluation and Regional Assistance.
Van der Klaauw, W. (2002). “Estimating the Effect of Financial Aid Offers on College Enrollment: A Regression Discontinuity Approach.” International Economic Review, 43(4): 1249–87.
West, M.R., and Peterson, P.E. (2005). “The Efficacy of Choice Threats Within School Accountability Systems.” Harvard University: Program on Education Policy and Governance.
U.S. Department of Education, Office of Planning, Evaluation and Policy Development, Policy and Program Studies Service (2007). State and Local Implementation of the No Child Left Behind Act,
References 32
Volume I: Title I School Choice, Supplemental Educational Services, and Student Achievement, by R. Zimmer, B. Gill, P. Razquin, K. Booker, and J.R. Lockwood III. Washington D.C.: Author.
U.S. Department of Education, Office of Planning, Evaluation and Policy Development, Policy and Program Studies Service (2007). State and Local Implementation of the No Child Left Behind Act, Volume III—Accountability Under NCLB: Interim Report, by K.C. LeFloch, F. Martinez, J. O’Day, B. Stecher, and J. Taylor. Washington, D.C.: Author.

Appendix A 33
APPENDIX A SUPPLEMENTAL TABLES FOR SUBGROUPS OF STUDENTS
In addition to examining effects for students at different points in the achievement distribution, we carried out analogous stratified analyses for other subgroups of students, including different racial or ethnic groups (white, Hispanic, black), special education students, limited English proficiency (LEP) students, economically disadvantaged students (two of three districts), whether students were in the same school last year, and whether students were held back or not held back in grade last year. The results for each of these subgroups—examined in all three districts—are provided here in Appendix A.
Note: Results in the supplemental tables have not been adjusted based on the False Detection Rate (FDR) method. Statistical significance in these tables is assessed using standard confidence interval measures. Given the large number of comparisons made in these tables, some of the results that are labeled as statistically significant are probably due to the result of random error.

Appendix A 34
Exhibit A.1
Effect of Missing AYP on Students at Different Points in Achievement Distribution, Districts A and B, 2003–04 and 2004–05
Effect in Standard Deviation Units (Standard Error, n)
Student Group District and
Year
Lowest-Achieving
Group, Same Subject
Lowest-Achieving Group, Other
Subject Reading Math
District A,
2003–04
0.04
(0.03, 53,358)
0.02
(0.03, 43,682)
0.02
(0.02, 85,471)
-0.01
(0.03, 71,415)
District A, 2004–05
0.06a
(0.03, 50,607)
0.06
(0.03, 39,792)
0.01
(0.02, 93,979)
0.04
(0.03, 75,806)
District B, 2003–04
0.15b
(0.04, 7,752)
0.13a
(0.05, 6,902)
0.14b
(0.03, 14,919)
0.12a
(0.05, 14,320)
Far below proficient
District B, 2004–05
0.07
(0.07, 7,450)
-0.07
(0.07, 6,416)
0.01
(0.05, 15,537)
-0.01
(0.06, 14,694)
District A, 2003–04
0.05
(0.03, 10,154)
0.00
(0.04, 9,606)
0.02
(0.02, 23,372)
-0.01
(0.03, 19,764)
District A,
2004–05
0.06
(0.03, 8,630)
0.09a
(0.04, 9,053)
0.01
(0.02, 25,484)
0.06a
(0.03, 11,994)
District B, 2003–04
0.11
(0.07, 1,278)
0.05
(0.08, 1,326)
0.08
(0.05, 4,094)
0.13a
(0.06, 4,150)
Just below proficient
District B, 2004–05
-0.11
(0.08, 1,048)
-0.05
(0.10, 1,083)
-0.07
(0.05, 4,243)
-0.09
(0.07, 4,113)
District A, 2003–04
0.12b
(0.05, 2,678)
-0.02
(0.05, 5,698)
0.04
(0.03, 7,295)
-0.00
(0.03, 11,912)
District A, 2004–05
0.09a
(0.05, 2,189)
0.09a
(0.04, 4,808)
-0.01
(0.03, 8,001)
0.06
(0.03, 11,994)
District B, 2003–04
0.22a
(0.09, 465)
0.19a
(0.08, 683)
0.10
(0.06, 1,840)
0.14a
(0.07, 2,144)
Just above proficient
District B,
2004–05
0.01
(0.14, 329)
0.13
(0.13, 604)
-0.03
(0.07, 1,823)
0.05
(0.08, 2,125)
District A, 2003–04
0.05
(0.05, 5,495)
0.02
(0.04, 12,699)
-0.01
(0.03, 23,048)
0.00
(0.04, 36,815)
District A, 2004–05
0.09
(0.05, 4,242)
0.04
(0.04, 12,015)
0.00
(0.03, 25,676)
0.04
(0.03, 42,050)
District B, 2003–04
0.13
(0.12, 806)
0.07
(0.09, 1,390)
0.05
(0.06, 6,105)
0.14a
(0.07, 6,344)
Far above proficient
District B, 2004–05
-0.00
(0.12, 609)
0.08
(0.11, 1,333)
-0.07
(0.06, 6,403)
-0.05
(0.07, 7,074)
Exhibit reads: In District A, students far below proficient in schools that did not make AYP in 2002–03 made no statistically significant improvement in achievement in 2003–04. Far below proficient is defined as scoring below the 20 percent of students whose scores are immediately below the proficiency cut point.
a indicates statistical significance at .05.
b indicates statistical significance at .01.

Appendix A 35
Exhibit A.2
Estimates for Specific Student Subgroups, Student-Level RD Estimates in District A, 2003–04
Effect in Standard Deviation Units
(Standard Error, n)
Subgroup Lowest-Achieving
Group, Same Subject
Lowest-Achieving Group,
Other Subject Reading Math
Same school last year 0.04
(0.02, 64,449)
0.01
(0.03, 64,449)
0.01
(0.02, 121,573)
-0.00
(0.03, 121,573)
Not held back 0.04
(0.02, 69,718)
0.02
(0.03, 69,718)
0.01
(0.02, 136,336)
-0.00
(0.03, 136,336)
Held back 0.07
(0.08, 1,967)
0.04
(0.07, 1,967)
0.07
(0.07, 2,850)
-0.05
(0.06, 2,850)
White 0.01
(0.12, 899)
-0.02
(0.10, 899)
0.03
(0.05, 6,868)
0.05
(0.06, 6,868)
Hispanic 0.05
(0.03, 63,137)
0.02
(0.03, 63,137)
0.01
(0.02, 111,976)
0.01
(0.03, 111,976)
Black 0.02
(0.06, 6,859)
-0.03
(0.07, 6,859)
-0.02
(0.03, 13,521)
-0.05
(0.05, 13,521)
Special education 0.02
(0.05, 11,163)
0.01
(0.04, 11,163)
0.04
(0.04, 14,440)
-0.03
(0.04, 14,440)
LEP 0.05
(0.03, 60,072)
0.01
(0.03, 60,072)
0.02
(0.02, 81,433)
0.00
(0.03, 81,433)
Economically disadvantaged
0.04
(0.02, 68,914)
0.01
(0.03, 68,914)
0.01
(0.02, 126,211)
-0.01
(0.03, 126,211)
Exhibit reads: In District A, students in the lowest-scoring group who remained in the same schools that did not make AYP in 2002–03 had no significant change in the following year in the subject of the school’s minimum score.

Appendix A 36
Exhibit A.3
Estimates for Specific Student Subgroups, Student-Level RD Estimates in District A, 2004–05
Effect in Standard Deviation Units
(Standard Error, n)
Subgroup Lowest-Achieving
Group, Same Subject
Lowest-Achieving Group,
Other Subject Reading Math
Same school last year 0.07
a
(0.03, 58,312)
0.05
(0.03, 58,312)
0.00
(0.02, 128,802)
0.05
(0.03, 128,802)
Not held back 0.06
a
(0.02, 64,271)
0.06
(0.03, 64,271)
0.01
(0.02, 150,869)
0.04
(0.03, 150,869)
Held back 0.07
(0.07, 1,397)
-0.00
(0.07, 1,397)
0.02
(0.07, 2,271)
-0.02
(0.06, 2,271)
White 0.01
(0.11, 1,115)
0.03
(0.10, 1,115)
-0.00
(0.05, 8,508)
-0.03
(0.07, 8,508)
Hispanic 0.07
a
(0.03, 57,294)
0.10b
(0.03, 57,294)
0.01
(0.02, 119,844)
0.05a
(0.02, 119,844)
Black 0.03
(0.07, 6,364)
-0.10
(0.07, 6,364)
-0.08a
(0.04, 15,953)
-0.04
(0.04, 15,953)
Special education 0.02
(0.04, 13,174)
0.04
(0.04, 13,174)
-0.00
(0.04, 16,140)
0.01
(0.04, 16,140)
LEP 0.06
a
(0.03, 55,197)
0.09b
(0.03, 55,197)
0.01
(0.02, 82,536)
0.05
(0.03, 82,536)
Economically disadvantaged
0.06a
(0.03, 62,796)
0.06
(0.03, 62,796)
0.01
(0.02, 136,284)
0.04
(0.03, 136,284)
Exhibit reads: In District A, students in the lowest-achieving group who remained in the same schools that did not make AYP in 2003–04 made an improvement in achievement of 0.07 standard deviations in the following year in the subject of the school’s minimum score.
a indicates statistical significance at .05.
b indicates statistical significance at .01.

Appendix A 37
Exhibit A.4
Estimates for Specific Student Subgroups, Student-Level RD Estimates in District B, 2003–04
Effect in Standard Deviation Units
(Standard Error, n)
Subgroup Lowest-Achieving
Group, Same Subject
Lowest-Achieving Group,
Other Subject Reading Math
Same school last year 0.14
b
(0.05, 8,296)
0.11a
(0.05, 8,296)
0.12b
(0.04, 20,954)
0.12a
(0.05, 20,954)
Not held back 0.15
b
(0.05, 10,138)
0.11a
(0.05, 10,138)
0.11b
(0.04, 26,748)
0.12a
(0.05, 26,748)
Held back -0.16
(0.21, 163)
0.04
(0.16, 163)
0.03
(0.16, 210)
0.12
(0.19, 210)
White 0.27
(0.34, 130)
0.34
(0.32, 130)
0.13
(0.06a, 4,139)
0.15
(0.08, 4,139)
Hispanic 0.16
b
(0.05, 8,960)
0.12a
(0.05, 8,960)
0.12b
(0.04, 14,442)
0.13a
(0.05, 14,442)
Black -0.12
(0.18, 825)
-0.10
(0.14, 825)
0.05
(0.05, 4,038)
0.11
(0.06, 4,038)
Special education -0.06
(0.07, 1,471)
0.01
(0.08, 1,471)
0.02
(0.05, 3,019)
0.02
(0.07, 3,019)
LEP 0.14
b
(0.04, 8,244)
0.10
(0.05, 8,244)
0.10a
(0.04, 9,788)
0.11a
(0.05, 9,788)
Exhibit reads: In District B, students in the lowest-achieving subgroup who remained in the same schools that did not make AYP in 2002–03 made an improvement in achievement of 0.14 standard deviations in the following year in the subject of the school’s minimum score.
a indicates statistical significance at .05.
b indicates statistical significance at .01.

Appendix A 38
Exhibit A.5
Estimates for Specific Student Subgroups, Student-Level RD Estimates in District B, 2004–05
Effect in Standard Deviation Units
(Standard Error, n)
Subgroup Lowest-Achieving
Group, Same Subject
Lowest-Achieving Group,
Other Subject Reading Math
Same school last year 0.04
(0.06, 7,352)
-0.02
(0.07, 7,352)
-0.02
(0.05, 20,436)
-0.01
(0.07, 20,436)
Not held back 0.03
(0.06, 9,364)
-0.04
(0.07, 9,364)
-0.03
(0.05, 27,869)
-0.02
(0.06, 27,869)
Held back -0.32
(0.29, 72)
-0.14
(0.33, 72)
-0.37
(0.21, 137)
-0.54
(0.33, 137)
White -0.07
(0.28, 160)
-0.81
(0.33, 160)
-0.08
(0.08, 3,928)
-0.03
(0.11, 3,928)
Hispanic 0.02
(0.07, 7,815)
-0.06
(0.08, 7,815)
-0.01
(0.05, 15,804)
-0.02
(0.06, 15,804)
Black 0.18
(0.15, 984)
-0.02
(0.17, 984)
0.02
(0.05, 4,294)
0.05
(0.07, 4,294)
Special education 0.02
(0.09, 1,882)
-0.15
(0.09, 1,882)
-0.05
(0.08, 3,183)
-0.08
(0.07, 3,183)
LEP 0.03
(0.07, 8,014)
-0.05
(0.08, 8,014)
0.00
(0.05, 10,650)
-0.02
(0.06, 10,650)
Exhibit reads: In District B, students in the lowest-achieving subgroup who remained in the same schools that did not make AYP in 2003–04 saw no significant change in the following year in the subject of the school’s minimum score.

Appendix A 39
Exhibit A.6
Estimates for Specific Student Subgroups, Student-Level RD Estimates in District C, 2003–04
Effect in Standard Deviation Units
(Standard Error, n)
Subgroup Lowest-Achieving
Group, Same Subject
Lowest-Achieving Group,
Other Subject Reading Math
Same school last year -0.03
(0.04, 17,518)
0.02
(0.05, 17,530)
0.03
(0.04, 25,899)
0.02
(0.04, 25,912)
Not held back -0.02
(0.04, 20,871)
0.04
(0.05, 20,887)
0.05
(0.04, 29,869)
0.03
(0.04, 29,888)
Held back -0.07
(0.12, 617)
0.08
(0.11, 617)
0.14
(0.09, 804)
-0.03
(0.09, 801)
White -0.05
(0.28, 304)
-0.12
(0.23, 304)
-0.04
(0.11, 999)
0.05
(0.10, 1,000)
Hispanic -0.14
(0.07, 3,778)
-0.13
(0.08, 3,790)
-0.05
(0.05, 10,948)
-0.04
(0.05, 10,942)
Black 0.05
(0.05, 17,160)
0.09
(0.05, 17,164)
0.07
(0.05, 17,909)
0.06
(0.05, 17,931)
Special education -0.06
(0.08, 2,936)
0.05
(0.08, 2,957)
0.04
(0.07, 3,829)
0.02
(0.07, 3,826)
LEP -0.20
(0.08, 1,773)
-0.11
(0.11, 1,779)
-0.11
(0.09, 1,929)
-0.16
(0.08, 1,920)
Economically disadvantaged
-0.01
(0.04, 20,239)
0.04
(0.05, 20,255)
0.05
(0.04, 28,706)
0.03
(0.04, 28,720)
Exhibit reads: In District C, students in the lowest-achieving subgroup who remained in the same schools that did not make AYP in 2002–03 saw no significant change in the following year in the subject of the school’s minimum score.
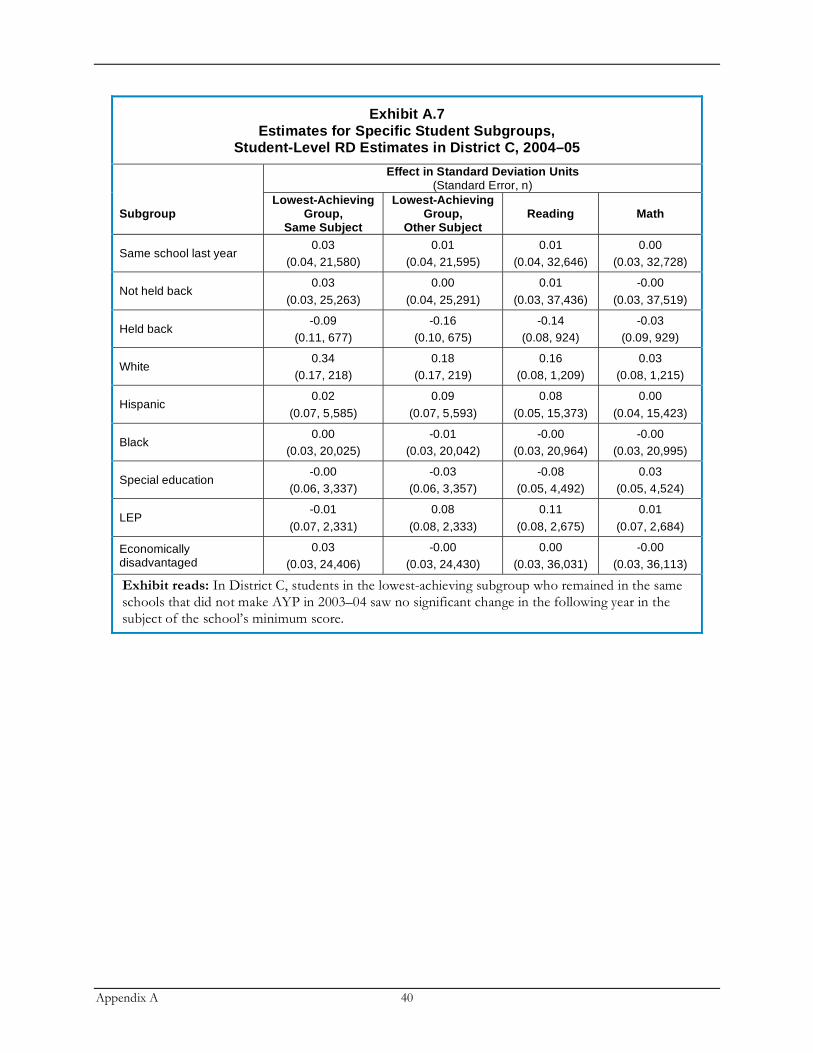
Appendix A 40
Exhibit A.7
Estimates for Specific Student Subgroups, Student-Level RD Estimates in District C, 2004–05
Effect in Standard Deviation Units
(Standard Error, n)
Subgroup Lowest-Achieving
Group, Same Subject
Lowest-Achieving Group,
Other Subject Reading Math
Same school last year 0.03
(0.04, 21,580)
0.01
(0.04, 21,595)
0.01
(0.04, 32,646)
0.00
(0.03, 32,728)
Not held back 0.03
(0.03, 25,263)
0.00
(0.04, 25,291)
0.01
(0.03, 37,436)
-0.00
(0.03, 37,519)
Held back -0.09
(0.11, 677)
-0.16
(0.10, 675)
-0.14
(0.08, 924)
-0.03
(0.09, 929)
White 0.34
(0.17, 218)
0.18
(0.17, 219)
0.16
(0.08, 1,209)
0.03
(0.08, 1,215)
Hispanic 0.02
(0.07, 5,585)
0.09
(0.07, 5,593)
0.08
(0.05, 15,373)
0.00
(0.04, 15,423)
Black 0.00
(0.03, 20,025)
-0.01
(0.03, 20,042)
-0.00
(0.03, 20,964)
-0.00
(0.03, 20,995)
Special education -0.00
(0.06, 3,337)
-0.03
(0.06, 3,357)
-0.08
(0.05, 4,492)
0.03
(0.05, 4,524)
LEP -0.01
(0.07, 2,331)
0.08
(0.08, 2,333)
0.11
(0.08, 2,675)
0.01
(0.07, 2,684)
Economically disadvantaged
0.03
(0.03, 24,406)
-0.00
(0.03, 24,430)
0.00
(0.03, 36,031)
-0.00
(0.03, 36,113)
Exhibit reads: In District C, students in the lowest-achieving subgroup who remained in the same schools that did not make AYP in 2003–04 saw no significant change in the following year in the subject of the school’s minimum score.

Appendix B 41
APPENDIX B SELECTION OF SITES INCLUDED IN THIS REPORT
We gathered student- and school-level achievement data and NCLB status information in various states and large districts around the country and conducted exploratory analyses in many of these locations to assess which ones would be most suitable for each of the three analyses we were conducting. Several criteria were involved in selecting the analysis sites. First, the sites needed to have a substantial number of schools identified for improvement as of the 2004–05 school year, so that there would be a sufficiently large treatment group. Each site needed to have a substantial number of schools that are in the key groups: those that are identified for improvement, those that did not make AYP for one year, and those that are meeting AYP. Ideally, each selected site should have some schools at various points on NCLB’s improvement calendar. Our data sets follow students from 2001–02 (and earlier in some cases) through 2004–05, observing the effects of missing AYP and being identified for improvement beginning in 2002–03.
For the methods that rely on student-level achievement data, we were further constrained because we needed sites that administered assessments in a series of consecutive grades, so that we could examine multiple, annual test results for individual students. Tests in consecutive grades should involve both mathematics and reading (or English language arts).
The student-level analyses also require longitudinal student-level achievement data for the mandated tests, available in electronic form, ideally for several years retrospectively. These data had to include unique student and school codes (without identifying information on students) that allowed us to follow students and schools across years and grades and to link students’ achievement scores to data on schools’ accountability status.
In sum, different analytic methods and different research questions placed different demands on the data, such that the same sites were not appropriate for all methods. Sites for which we acquired student-level data, and in which we could conduct at least some student-level analyses, included two districts in State 1 and one in State 2. These states and districts were selected solely on the basis of the availability of necessary data, and should not be viewed as representative of the country as a whole.
Each of these sites included a substantial number of schools that were identified for improvement under NCLB, and each of these sites provided us with several years of longitudinal, student-level achievement data from a series of annual assessments that are conducted in successive grades.
We also analyzed school-level data statewide in State 1 and State 2, both of which had substantial numbers of schools not making AYP and identified for improvement.
Information on AYP requirements, school counts, and demographic data for the sites included in the analyses are included in Exhibits B.1 to B.4 below.
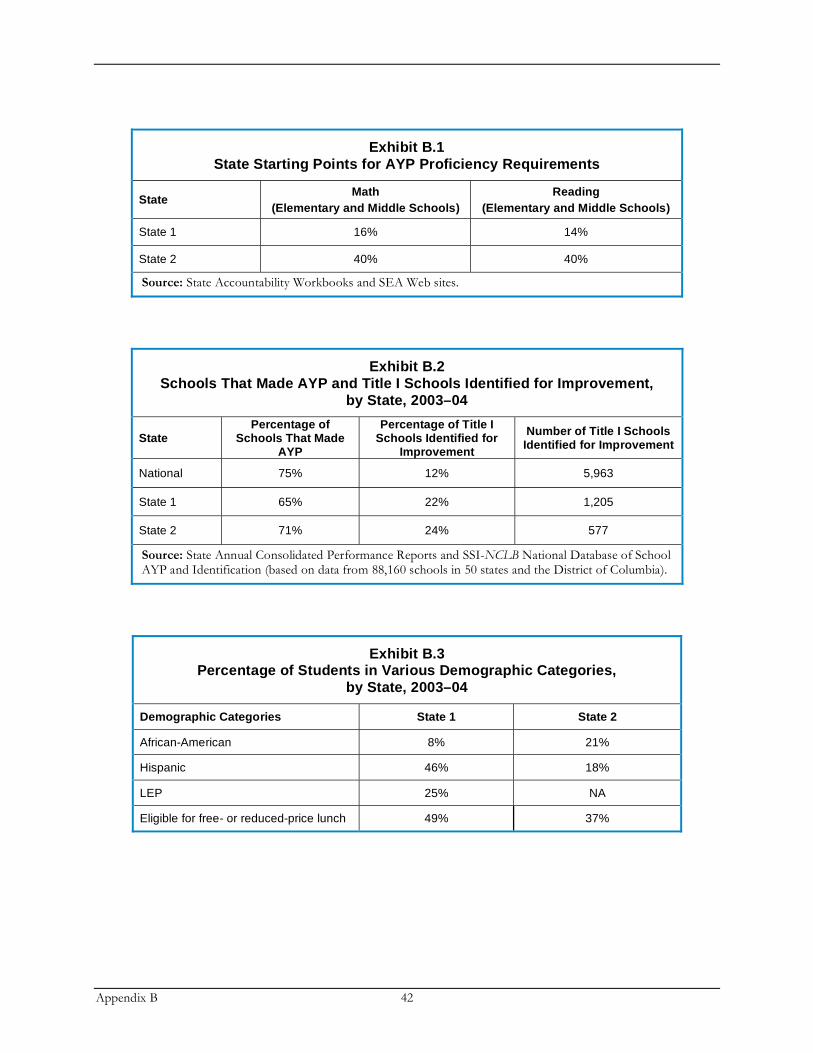
Appendix B 42
Exhibit B.1
State Starting Points for AYP Proficiency Requirements
State Math
(Elementary and Middle Schools)
Reading
(Elementary and Middle Schools)
State 1 16% 14%
State 2 40% 40%
Source: State Accountability Workbooks and SEA Web sites.
Exhibit B.2
Schools That Made AYP and Title I Schools Identified for Improvement,
by State, 2003–04
State Percentage of
Schools That Made AYP
Percentage of Title I Schools Identified for
Improvement
Number of Title I Schools Identified for Improvement
National 75% 12% 5,963
State 1 65% 22% 1,205
State 2 71% 24% 577
Source: State Annual Consolidated Performance Reports and SSI-NCLB National Database of School AYP and Identification (based on data from 88,160 schools in 50 states and the District of Columbia).
Exhibit B.3 Percentage of Students in Various Demographic Categories,
by State, 2003–04
Demographic Categories State 1 State 2
African-American 8% 21%
Hispanic 46% 18%
LEP 25% NA
Eligible for free- or reduced-price lunch 49% 37%

Appendix B 43
Exhibit B.4
Core Components of State AYP Definitions, 2003–04
Elementary Grades Used for AYP
State Minimum n
for AYP (all students)
Use of Confidence
Intervals for AYP
Safe Harbor
Math Reading
State 1
100 students or 50 students who represent
at least 15
percent of the students to be
tested.
Yes – 95
Three conditions must be met: (1) Percentage performing below proficient decreased by at least 10 percent of that percentage from
preceding year. (2) Met 95 percent participation rate. (3) Improvement in the state’s index of performance (graduation rate also may be considered).
2–6 2–6
State 2 40 No
Three conditions must be met: (1)10 percent reduction in the
percentage not meeting standards within the subgroup(s) over the previous year. (2) Met 95 percent participation rate. (3) Met minimum annual objective for graduation rate.
3, 5 3, 5
Source: SSI-NCLB; CCSSO Profiles of State Accountability Systems, http://accountability.ccsso.org/index.asp.
