the impact of the adequate yearly progress...
TRANSCRIPT
The Impact of the Adequate Yearly Progress Requirement of the Federal “No Child Left Behind” Act on Schools in the Great Lakes
Region by
Edward W. Wiley Assistant Professor
University of Colorado – Boulder
William J. Mathis Superintendent
Rutland Northeast Supervisory Union University of Vermont
David R. Garcia
Assistant Professor Arizona State University
The Great Lakes Center for Education Research & Practice
PO Box 1263 East Lansing, MI 48826 Phone: (517) 203-2940
Email: [email protected] Web Site: http://www.greatlakescenter.org
September 2005
This research was made possible by a grant from the Great Lakes Center for Education Research and Practice.
The Impact of the Adequate Yearly Progress Requirement of
the Federal “No Child Left Behind” Act on Schools in the
Great Lakes Region
Edward W. Wiley University of Colorado – Boulder
William J. Mathis Rutland Northeast Supervisory Union
University of Vermont
David R. Garcia Arizona State University
Executive Summary
This study finds that nearly every school in the Great Lakes states is threatened to
fail the Adequate Yearly Progress (AYP) requirements mandated by the federal “No
Child Left Behind” (NCLB) Act. NCLB holds schools and districts accountable for
student achievement on state standardized tests and schools that do not make AYP face
sanctions. A school or district can avoid sanctions one of two ways: produce test scores
that meet AYP annual objectives set by the state, or by making sufficient improvement
over the previous year’s test scores to take advantage of “Safe Harbor” status.
The goals of NCLB are deceptively simple: All schools and districts receiving
funds for socially and economically deprived children (Title I) must bring all students up
ii
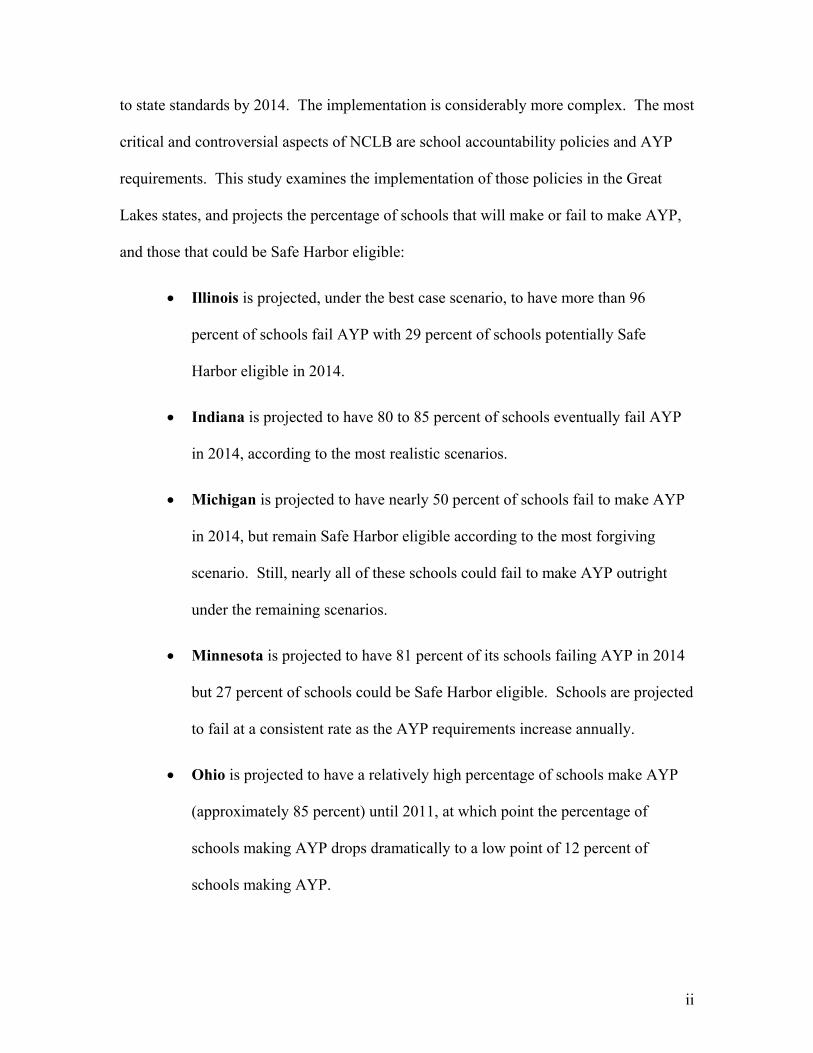
to state standards by 2014. The implementation is considerably more complex. The most
critical and controversial aspects of NCLB are school accountability policies and AYP
requirements. This study examines the implementation of those policies in the Great
Lakes states, and projects the percentage of schools that will make or fail to make AYP,
and those that could be Safe Harbor eligible:
• Illinois is projected, under the best case scenario, to have more than 96
percent of schools fail AYP with 29 percent of schools potentially Safe
Harbor eligible in 2014.
• Indiana is projected to have 80 to 85 percent of schools eventually fail AYP
in 2014, according to the most realistic scenarios.
• Michigan is projected to have nearly 50 percent of schools fail to make AYP
in 2014, but remain Safe Harbor eligible according to the most forgiving
scenario. Still, nearly all of these schools could fail to make AYP outright
under the remaining scenarios.
• Minnesota is projected to have 81 percent of its schools failing AYP in 2014
but 27 percent of schools could be Safe Harbor eligible. Schools are projected
to fail at a consistent rate as the AYP requirements increase annually.
• Ohio is projected to have a relatively high percentage of schools make AYP
(approximately 85 percent) until 2011, at which point the percentage of
schools making AYP drops dramatically to a low point of 12 percent of
schools making AYP.
iii
• Wisconsin is projected to experience the biggest impact in the later years
(2011-2014) when 84 percent schools are projected to fail AYP, but 34
percent of schools could be Safe Harbor eligible.
In general, approximately 85 percent of schools in the Great Lakes states are
projected to fail AYP in 2014 under the most optimistic scenarios. Under more realistic
circumstances, the overall failure rate is projected to be at or above 95 percent.
In summation, the authors question the sustainability of the AYP requirements.
Furthermore, they caution that schools are not capable of closing the achievement gap
without resolving the social problems that underlie this gap. They point out that adequate
funding for remediation and social infrastructure is essential to meeting the stated goals
of NCLB.
The projections for the Great Lakes states are applicable to the nation as a whole
and are a warning about the sustainability of NCLB, as the AYP requirements are
currently constructed. The entire country faces tremendous failure rates, even under a
conservative estimate with several forgiving assumptions.
The Impact of the Adequate Yearly Progress Requirement of
the Federal “No Child Left Behind” Act on Schools in the
Great Lakes Region
Edward W. Wiley University of Colorado – Boulder
William J. Mathis Rutland Northeast Supervisory Union
University of Vermont
David R. Garcia Arizona State University
Introduction
Described by some as the greatest “unwarranted intrusion”1 of federal policy in
our nation’s educational history or the last “best hope”2 for rescuing children from
“failing” schools, the 2001 reauthorization of the Elementary and Secondary Education
Act, known as “No Child Left Behind” (NCLB) has generated great controversy across
the land. Regardless of the perspective, all would agree the law has massive implications
for the very nature, and future, of public education.
In the view of the federal administration and its supporters, the law provides the
best means of focusing attention on the most forgotten students. By dint of annual
standardized testing, annual improvement targets on these tests, and prescriptive
Page 2 of 65 This document is available on the Great Lakes Center website at: http://www.greatlakescenter.org
teaching; adherents claim that the law will force the closing of achievement gaps that
exist between students along racial, ethnic, and socio-economic lines. In support of the
law, federal officials point to “historic” funding increases that accompany NCLB.
Critics retort that schools cannot single-handedly close the achievement gap that
the law is dramatically under funded and that massive social investments are also needed.
Further, they note the historical shortcomings of efforts by both the federal and state
governments to close the achievement gap, and they point out that federal funding
increases amount to less than a one percent increase in total education spending.
The purpose of this report is to address the major issues associated with the
NCLB school accountability policies, the most critical and controversial aspect of the
law. We also review the implementation of the NCLB school accountability policies in
each of the Great Lakes States and project the number of schools making or failing to
make “Adequate Yearly Progress” (AYP) in future years for each of the Great Lakes
states.
The report begins with a short review of the NCLB school accountability policies,
with an emphasis on AYP and related sanctions. We then highlight the major
philosophical and practical issues with NCLB. These issues constitute the basis for many
of the criticism and objections leveled against NCLB. Next, we develop an individual
profile for each of the Great Lakes states. The statistical analyses used to project the
percentage of schools making or failing to make AYP are tailored to the unique elements
of each state. The issues and findings in this report are relevant beyond the Great Lakes
states and call into question the sustainability of NCLB itself.
Page 3 of 65 This document is available on the Great Lakes Center website at: http://www.greatlakescenter.org
NCLB, Adequate Yearly Progress, and Sanctions
NCLB affects virtually every aspect of K-12 public education, including teacher
and paraprofessional qualifications, English Language Learners, testing and assessment,
public school choice, private provider services, comprehensive school reform efforts, and
ultimately, forced re-organization of schools and districts.
While each of these areas has far-reaching implications, the testing, accountability
and sanctions provisions of the law have received the most attention and provoked the
greatest controversy. The goals of NCLB are deceptively simple: all schools and districts
receiving funds for socially and economically deprived children (Title I) must bring all
students up to state standards by 2014. Thus, all students in each subgroup (or
disaggregated group), such as students in poverty, special education students, and non-
English speaking students, must achieve the standards by the target date.
The implementation of the law is considerably more complex. In 49 states,
“bringing all students up to standards” is implemented as students passing state-adopted
standardized tests at the state-defined level(s) of proficiency. Schools must also meet at
least one non-test-based academic standard. For high schools, this must be the
graduation rate. States most frequently use attendance rates in elementary schools.
NCLB tracks progress toward the stated goal by holding schools and districts accountable
for student achievement on the state standardized tests. To meet this requirement, all
states are required to adopt a single, unified accountability system for all public schools
and districts in their jurisdiction. Non-Title I schools, however, may be exempt from
some or part of the sanctions if the state so chooses.3
Page 4 of 65 This document is available on the Great Lakes Center website at: http://www.greatlakescenter.org
Under NCLB, each state is to define Annual Measurable Objectives (annual
objectives), or minimal levels of improvement, that schools must meet in order to “make
AYP.” The annual objectives are defined as increasing percentages of students meeting
state standards on the standardized tests. States are allowed to set the annual objectives
as long as they result in 100 percent of all students in all subgroups meeting state
standards by 2014.
States use one or a combination of two common methods to set the annual
objectives schools must meet in order to make AYP. The first method sets the annual
objectives based on equal annual growth expectations (straight-line), with consistent
growth expectations each year. The second method consists of flat growth expectations
over a period of no more than three years, followed by steep increases (stair-step). The
stair-step method results in a plateau of expectations, followed by a sudden growth in
expectations, followed by another plateau for consolidation. The increases are steeper
with the stair-step method in order to compensate for the years when growth expectations
were flat. Some states intentionally set the annual objectives using the stair-step method
in the early years, followed by a rapid escalation of the annual objectives in the later
years (back-loaded).
If a school does not meet the annual objectives, “Safe Harbor” is another way for
a school to demonstrate that they have made adequate yearly progress. If the school or
subgroup misses its AYP target but reduces the percentage of students not meeting
standards by at least ten percent. The school may avoid designation of “not making
AYP” if it can also demonstrate adequate progress on an alternative criterion such as
attendance rate or graduation rate.
Page 5 of 65 This document is available on the Great Lakes Center website at: http://www.greatlakescenter.org
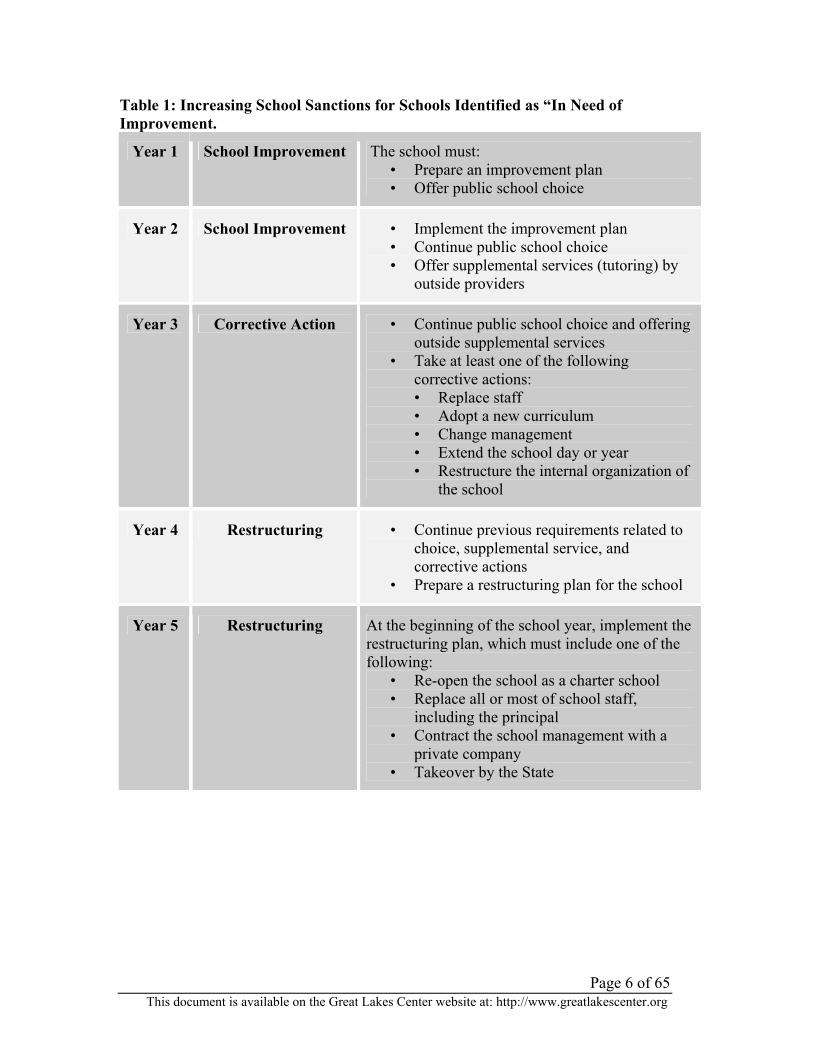
Schools that do not meet the annual objectives, for either the total school or any
student subgroup, are regarded as not making AYP, also referred to in this report as
“failing AYP” Or “failing to make AYP.” If the school fails to make AYP for two
consecutive years, the school is identified as “In Need of Improvement.” Once so
identified, the school is subject to a series of sanctions that escalate in severity for each
subsequent year the school fails to make AYP (see Table 1 for a list of school sanctions
by year).
Page 6 of 65 This document is available on the Great Lakes Center website at: http://www.greatlakescenter.org
Table 1: Increasing School Sanctions for Schools Identified as “In Need of Improvement.
Year 1 School Improvement The school must: • Prepare an improvement plan • Offer public school choice
Year 2 School Improvement • Implement the improvement plan • Continue public school choice • Offer supplemental services (tutoring) by
outside providers
Year 3 Corrective Action • Continue public school choice and offering outside supplemental services
• Take at least one of the following corrective actions: • Replace staff • Adopt a new curriculum • Change management • Extend the school day or year • Restructure the internal organization of
the school
Year 4 Restructuring • Continue previous requirements related to choice, supplemental service, and corrective actions
• Prepare a restructuring plan for the school
Year 5 Restructuring At the beginning of the school year, implement the restructuring plan, which must include one of the following:
• Re-open the school as a charter school • Replace all or most of school staff,
including the principal • Contract the school management with a
private company • Takeover by the State
Page 7 of 65 This document is available on the Great Lakes Center website at: http://www.greatlakescenter.org
Major Issues with NCLB and AYP
NCLB is the subject of considerable political, media, and research controversy,
and much of the contention stems from the AYP policies. The following section reviews
the spectrum of issues related to NCLB and AYP, ranging from broad differences in
educational philosophy to consequential practical considerations.
Philosophical Issues
The Proper Role of the Federal Government in Education
By April 2005, 41 of the 50 states had registered some form of complaint or
remonstrance about the intrusion of NCLB.4 Many of the objections center on the federal
government’s imposition of inflexible testing and AYP requirements on the states. The
manner of the protests include oppositional statements from the Chief State School
Officers, the passage of state laws and legislative resolutions in opposition to NCLB, and
a lawsuit filed by the National Education Association, with the Pontiac, Michigan, school
district as the lead plaintiff. The protestors span the political spectrum, from
conservative-voting Utah, to the President’s home state of Texas, to liberal-leaning
Connecticut. In fact, there is no correlation between strength of political protests and
voting patterns in the 2004 presidential election.5
At the core of these protests is the Tenth Amendment to the U.S. Constitution,
which assigns all responsibilities not specifically reserved in the Constitution to the
states. Thus, education is a state prerogative as confirmed by California’s Rodriguez
decision in 1973. After review, NCSL concluded the constitutionality of the NCLB
accountability requirements is questionable.6 Prior to NCLB, federal education monies
Page 8 of 65 This document is available on the Great Lakes Center website at: http://www.greatlakescenter.org
were distributed under the “promote the general welfare” provision of the Constitution.
However, the extensive prescriptions in NCLB and the unfunded mandates are seen by
some as going beyond these funding incentives. State and local governments not only
find NCLB intrusive on constitutional grounds, many complain that the federal action has
upset or destroyed years of localized efforts in education and replaced it with a narrow
and, in their eyes, inferior approach.
The Purpose of Education
AYP de facto reduces education to standardized test scores in basic academic areas, with
the token inclusion of a few other indicators. Certainly broader purposes of education are
acknowledged in the law, but these are either not part of the high-stakes accountability
system or are regarded nominally. As Education Secretary Margaret Spellings said,
“What gets measured gets taught.”7 In the minds of Hargreaves and others, this results in
educational apartheid, where some students get first-class accommodations, while poor
children in a “failing” school are condemned to the dull, spiritless and continuous drilling
of the basics that “get measured.”8 In this view, NCLB runs counter to those who believe
that education should be broad in purpose and democratizing in practice.
Proponents counter that children may escape failing schools simply by
transferring out using the choice provisions. Yet, less than one percent of eligible
children exercise this option,9 and Levin has demonstrated that choice schemes further
separate children by social and economic status.10
Page 9 of 65 This document is available on the Great Lakes Center website at: http://www.greatlakescenter.org
Practical Issues
Funding Inadequacy
According to former Education Secretary Rod Paige and current Secretary
Spellings, NCLB is fully funded at “historic” federal investment levels.11 Upon closer
examination, one learns that Title I represents only 2.6 percent of total education
spending, and all federal education spending represents no more than 8 percent of overall
spending. Thus, new NCLB appropriations represent a 0.9 percent increase in overall
education spending.12 The Center for Educational Policy’s surveyed states and districts
and learned the law is significantly under funded;13 the National Conference of State
Legislatures (NCSL) has come to a similar conclusion.14
Based on 46 studies of the adequacy of state education funding conducted since
1999, the median cost of bringing all children up to standard (if such a goal is even
possible) requires a 27.5 percent increase in overall spending.15 The 0.9 percent total
increase in funding from NCLB is only a fraction of the 27.5 percent estimate needed to
achieve the stated goals of the law. Without proper remediation funds, AYP goals are
unlikely to be met or sustained.
The Effects of Poverty on Education
The AYP process requires all students to reach the same standards by 2014
regardless of individual or social circumstances. The much-discussed “achievement gap”
demonstrates that poorer children score demonstrably lower than their more affluent
peers. Paradoxically, in order for all students to reach the same goals by the same time,
in theory the growth increments for poor children must be larger than for their wealthier
Page 10 of 65 This document is available on the Great Lakes Center website at: http://www.greatlakescenter.org
peers; however, in practice the Northwest Evaluation Association (NWEA) study found
that the growth increments for these children were smaller.16 Richard Rothstein has
demonstrated that far more resources, directed toward pedagogical pre-requisites such as
food, housing, medical care, pre-school programs, and after school programs, must be in
place before we can effectively close the achievement gap.17 The consensus among
researchers is that it costs about twice the average currently paid per pupil to educate a
student in poverty to standards.18 According to NCLB, students in poverty should
receive 40 percent additional funds, yet the total federal appropriation for Title I amounts
to only 2.6 percent of funds. State level categorical aid for poverty averages only 17
percent of the basic foundation amount guaranteed to each student.
Michigan State Education Policy Center Director David Plank’s analysis,
demonstrates that the NCLB system is unresponsive to Michigan’s high poverty needs.
In the simplest of terms, testing and sanctions do not address the underlying problems
that cause poor performance.19
Standards and the Skyhook Dilemma
The numbers and percentages of schools in school improvement varies greatly by
state, ranging from Alaska’s 36 percent to Minnesota’s two percent. When the
percentage of schools “in need of improvement” for each state was correlated with the
state’s National Assessment of Educational Progress (NAEP) scores, the result was a
statistically insignificant coefficient of -0.23.20 This indicates there is no relationship
between the percent of schools identified as needing improvement by NCLB compared
with an outside indicator of state academic achievement. Consequently, schools are
being held to a highly variable standard.21
Page 11 of 65 This document is available on the Great Lakes Center website at: http://www.greatlakescenter.org
One major reason for the variability is inconsistent and ungrounded academic
expectations across states. The NWEA compared standards in 16 states to national
percentile score ranks in order to compare academic standards across a consistent scale.
The study looked at “cut points” that states used to separate a passing from a failing score
on a test. The lowest proficiency standard was Colorado’s ninth-grade reading, with a
cut-point at the ninth (9th) percentile, while Wyoming’s eighth-grade math was at the 89th
percentile. Obviously, the concept of “proficiency” varies a great deal between these two
neighboring states. The other state academic standards are distributed at all points
between these extremes.22
Most states set the cut points for meeting state standards by ranking test items
according to difficulty and then asking a panel to decide where to place the “bookmark,”
or cut point. One of the failings of this procedure is that the standards are not connected
to an external validation measure, such as work-force or college entrance requirements.
The cut points that denote meeting the standards are in effect held up by a skyhook: they
have no means of support.
Despite the implication that meeting state standards is an external benchmark of
quality, they are quite variable and inconsistent across states. Taken together, they have
not demonstrated a predictive relationship with anything – except poverty.23
Unrealistic Growth Assumptions
There is little or no scientific evidence that the growth assumptions necessary to
attain, maintain and sustain Adequate Yearly Progress year after year can be
accomplished.24 In fact there is considerable evidence to the contrary.25 Further, there is
Page 12 of 65 This document is available on the Great Lakes Center website at: http://www.greatlakescenter.org
evidence that schools that make AYP in a given year will most likely fall back toward the
mean in the following years.26
The Northwest study examined 320,000 student records over time and did find
early growth with NCLB, but the growth rate “won’t bring schools close” to meeting the
NCLB target. More disturbing was that the growth rate was declining, and the growth
rate of minority students is less than the growth rate of majority students.27 The
California Department of Education projects that 93 percent of schools will fail by 2011
and 99 percent will fail by 2014.28
If these findings hold true across states and across time, then the inevitable result
of AYP is a scenario where virtually all schools are eventually listed as failures, even in
states with a low percentage of schools currently failed to make AYP. The unrealistic
growth assumptions will drive the failure rate upward as the annual objectives increase
year after year to meet the 2014 timeline.
Penalties on Diverse Schools
Schools with greater diversity, meaning they have more student subgroups, will
be identified at a faster rate than schools with more homogenous populations simply
because there are increased opportunities to fail.29 The effect of these provisions is that a
school with a highly diverse population of ethnic groups, children in poverty, non-
English speakers, and special education students may have more than 30 opportunities to
fail in a given year. In contrast, a school with limited poverty and no sizable minority
population has far fewer opportunities to fail and is less likely to be identified. Thus, the
same schools that face the greatest challenges are more likely to fail regardless of the
quality of their instructional efforts.30
Page 13 of 65 This document is available on the Great Lakes Center website at: http://www.greatlakescenter.org
Most states employ statistical safeguards, such as a “confidence interval” around
the score for each student subgroup and a minimum number of students required for a
student subgroup to be included in the AYP analysis. The purpose is to ensure that
differences in scores between one year and the next are statistically significant. A
confidence interval protects against variation in scores due to a small number of students
in a category. As we will demonstrate in the results section, even with these statistical
safeguards and the safe harbor provisions, the preponderance of schools are subject to
failure.
Assessment Concerns
Prominent psychometricians and former American Education Research
Association presidents James Popham, Robert Linn, David Berliner, and Lorrie Shepard
have noted that the state assessment programs, upon which AYP decisions are based, are
inadequate for the purposes they are used in NCLB and cannot produce valid results.31
They offer a multitude of reasons, including:
• Validity: The tests cannot and do not adequately measure the breadth of the
curriculum within the tested areas. The ability to measure higher-order learning
by such tests is, at the least, debatable.
• The system measures poverty rather than school quality: While NCLB requires
standards-based tests with proficiency cut-off scores, the psychometric
approaches used in the construction of these tests are borrowed from norm-
referenced methods. Such systems, in their design, discriminate against lower
socio-economic children.32 Michigan State University’s policy center concluded
that accrediting schools on the basis of the state test was a measure of school
Page 14 of 65 This document is available on the Great Lakes Center website at: http://www.greatlakescenter.org
poverty rather than school quality.33 A six-state study from the Harvard Civil
Rights Project, which included Illinois, found that state tests and resulting AYP
failures measure community demographics rather than school contributions to
student learning.34
• Score Volatility: The AYP system compares different cohorts of students over
time. For example, academic growth is measured by comparing the scores of
third grade students in year one to the scores of third graders in year two. The
difference between one year and the next can be attributed to test error and cohort
effects rather than to teaching, learning, or the excellence of a school’s programs.
In fact, Kane and Staiger found these year-to-year comparisons to be 70 percent
error.35
• The AYP System does not Consider Growth: The required and expected growth
assumptions are not benched against any realistic expectations for growth. Thus,
as Linn demonstrates, a poor school can make great gains and still fall below
AYP requirements, while an affluent school can make very modest gains and still
be above the penalty threshold.36
• Inadequate Test Construction Methods: Most state tests are constructed using a
latent traits methodology. In short, this means that all test content is assumed to
be linear, hierarchal, and sequential. This is the foundation for establishing test
cut-off scores, equating scores from year to year, and equating scores from one
grade to the next. Unfortunately, it is doubtful that these assumptions can be
satisfied beyond the lower grades and beyond basic skill areas, where curricular
content is more uniform. As children are taught the new test content, items

Page 15 of 65 This document is available on the Great Lakes Center website at: http://www.greatlakescenter.org
previously considered difficult become easy. Likewise, subject matter not taught
shifts items into more difficult ranges. In New York’s Regents Math test, shifts in
assumptions caused the state to set a cut-point 20 points too high and resulted in
massive false failure rates.37
• Inability to Provide Improvement Data to Schools and Teachers: State
standardized tests provide limited diagnostic information to teachers and
principals regarding how to improve teaching and learning. As a result, schools
are labeled but have no useful information upon which to base school-
improvement efforts.
• Incentives for Corruption: According to Nichols and Berliner, schools and
teachers are penalized for school test scores over which they have nominal
control. After applying Campbell’s law, the authors uncover inherent incentives
that encourage corruption. For example, the popular media have reported on false
dropout reporting in Houston, exclusion of low performing students from testing
in Tampa, and incentives for testing companies to cover up errors.38
NCLB Profiles for the Great Lakes States
The Great Lakes states (Illinois, Indiana, Michigan, Minnesota, Ohio, and
Wisconsin), while sharing a great basin, encompass a huge diversity in population, cities,
ethnic groups, and economies. Each of these states has faced controversies over school
funding, state standards, academic achievement, and compliance with AYP. This section
includes a separate profile dedicated to each Great Lakes state. The profiles include a
summary of state accountability pre-NCLB, the current status of schools vis a vis AYP,
Page 16 of 65 This document is available on the Great Lakes Center website at: http://www.greatlakescenter.org
major funding developments, state protests of NCLB, and the parameters associated with
setting the annual objectives that schools must meet in order to make AYP.
In general, none of the Great Lakes states was among the top ten states with the
highest percentage of schools failing to make AYP in either 2003 or 2004. Ohio is
among the ten states with the lowest percentage of schools failing to make AYP in 2004,
and Wisconsin had the lowest percentage of schools failing to make AYP in both 2003
and 2004. Minnesota and Wisconsin record among the lowest percentages of “schools
needing improvement,” while no Great Lakes state is among the top ten.
While the national protest against NCLB reached a new high in spring 2005, the
Great Lakes states are scattered in their responses. Minnesota has registered strong and
loud protests, as has the Wisconsin Attorney General. The other states have been
relatively quiet. Nevertheless, two of the most comprehensive NCLB costing studies,
have come from Ohio and Minnesota. Pontiac, Michigan is the lead plaintiff in the NEA
lawsuit, but this is not a state-level action.
As for the AYP parameters, the annual objectives for four of the six Great Lakes
states are based on the stair-step method in the early years, followed by steep, back-
loaded objectives in the later years. The full detail of each state’s AYP parameters are
presented in the state profiles in an effort to be comprehensive. It is not necessary for the
reader to be familiar with the statistical terms; the focus of the study is on the impact of
the parameters on the school projections.
Page 17 of 65 This document is available on the Great Lakes Center website at: http://www.greatlakescenter.org
Illinois
Pre-NCLB Accountability
NCLB requires states to have a unified single accountability system for both Title I and
non-Title I schools. In most cases, such as Illinois, the NCLB system was grafted onto
the pre-existing state system. Illinois previously had a school accountability system
under which an independent authority could ultimately be appointed to take over a failing
school. Under these circumstances, students and staff could be reassigned. In Chicago,
the superintendent could remove, replace, or reassign employees in a school.39
NCLB Status
In 2005, five percent of Illinois schools were eligible for school choice and five
percent for supplemental services. Six percent of schools are in corrective action, the
highest percentage of any state in the nation.40
Funding
In 1996 and again in 1999, the state Supreme Court rejected plaintiffs’ challenges
to the Constitutionality of the funding system. In 2000, however, the General
Assembly’s Funding Advisory Board estimated it would cost an additional $1.8 billion
for all children to reach standards. Early education needed increases of 33 percent,
elementary schools needed a nine percent increase, and high schools required a 15
percent bump.41 In 2001, Augenblick and Meyers estimated a lower figure of only a four
percent increase in spending. That study, however, was based on only 83 percent of the
students reaching mastery.42
Page 18 of 65 This document is available on the Great Lakes Center website at: http://www.greatlakescenter.org
NCLB Protest Activities
Compared to other states, Illinois state officials have not strongly protested
NCLB. The state association of school administrators adopted a policy statement and the
Illinois Association of School Boards condemned the act and called for fundamental
changes in 2003-2004.43 State legislative and executive branches have been silent.
AYP Parameters
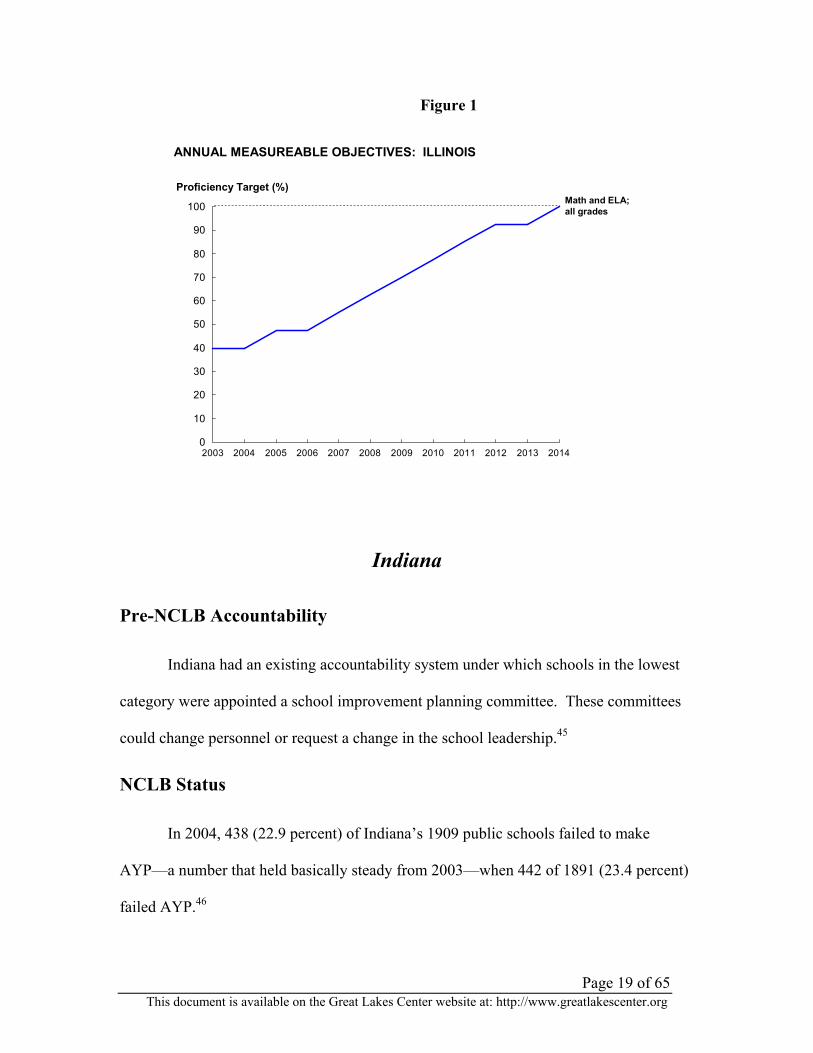
Illinois uses the stair-step method in the initial and final years of NCLB, with
linear annual objectives in the middle years. The minimum subgroup size is 40
students.44 The state employs a straight buffer interval of +3 percent (across all subgroup
proficiency estimates) to account for statistical uncertainty in these scores. In Illinois,
37.9 percent of children are identified as economically disadvantaged, the highest
percentage for all Great Lakes states. In all of the following graphs, “ELA” stands for
English/language arts.
Page 19 of 65 This document is available on the Great Lakes Center website at: http://www.greatlakescenter.org
Figure 1
0
10
20
30
40
50
60
70
80
90
100
2003 2004 2005 2006 2007 2008 2009 2010 2011 2012 2013 2014
Math and ELA;all grades
ANNUAL MEASUREABLE OBJECTIVES: ILLINOIS
Proficiency Target (%)
Indiana
Pre-NCLB Accountability
Indiana had an existing accountability system under which schools in the lowest
category were appointed a school improvement planning committee. These committees
could change personnel or request a change in the school leadership.45
NCLB Status
In 2004, 438 (22.9 percent) of Indiana’s 1909 public schools failed to make
AYP—a number that held basically steady from 2003—when 442 of 1891 (23.4 percent)
failed AYP.46

Page 20 of 65 This document is available on the Great Lakes Center website at: http://www.greatlakescenter.org
Funding
A 2002 study sponsored by the Indiana State Teacher’s Association concluded
that a 27.5 percent increase in funding was needed to ensure that all students meet
standards.47 The follow-up study conducted by the Indiana state budget agency reported
a similar increase of 25.5 percent was needed.48
NCLB Protest Activities
The Indiana Urban Schools Association was among the first in the nation to
realize the potential impact of the law on urban schools. A coalition of officials with
various Indiana educational associations expressed their concerns as well. As of January
2005, the state Senate passed a resolution asking for waivers from the U.S. Department of
Education, and the state board voted six to five in 2004 for changes in the accountability
provisions of the federal law. A cost study was initiated by the state.
AYP Parameters
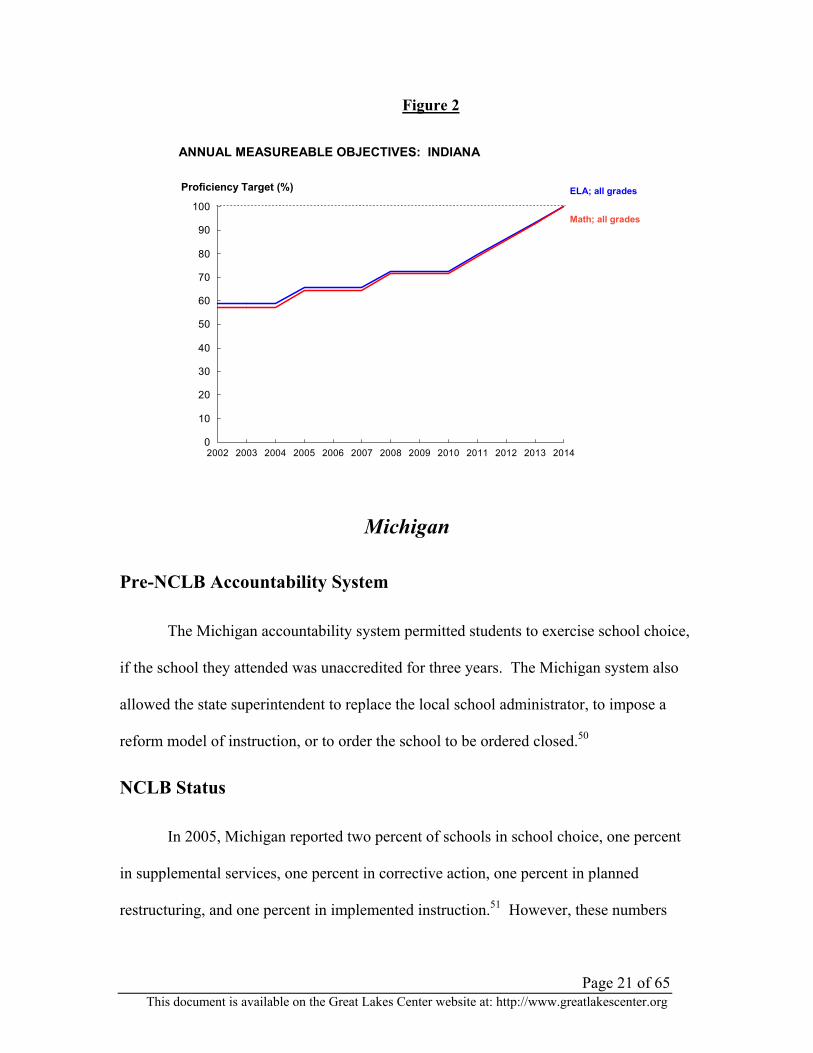
Indiana’s annual objectives are based on the stair-step method until 2010,
followed by accelerated, back-loaded expectations in the later years. The combination of
a minimum cell size of 30 students in a disaggregated group with a rigorous “one-tail”
binomial one percent confidence interval requirement has kept the number of identified
schools relatively low.49 Thirty-three percent of Indiana students are identified as
economically disadvantaged.
Page 21 of 65 This document is available on the Great Lakes Center website at: http://www.greatlakescenter.org
Figure 2
0
10
20
30
40
50
60
70
80
90
100
2002 2003 2004 2005 2006 2007 2008 2009 2010 2011 2012 2013 2014
ELA; all grades
ANNUAL MEASUREABLE OBJECTIVES: INDIANA
Proficiency Target (%)
Math; all grades
Michigan
Pre-NCLB Accountability System
The Michigan accountability system permitted students to exercise school choice,
if the school they attended was unaccredited for three years. The Michigan system also
allowed the state superintendent to replace the local school administrator, to impose a
reform model of instruction, or to order the school to be ordered closed.50
NCLB Status
In 2005, Michigan reported two percent of schools in school choice, one percent
in supplemental services, one percent in corrective action, one percent in planned
restructuring, and one percent in implemented instruction.51 However, these numbers
Page 22 of 65 This document is available on the Great Lakes Center website at: http://www.greatlakescenter.org
may be deceiving. Reimann and Lee found the number of schools that failed AYP
quadrupled from 2003 to 2004 and included 25 percent of the schools in the state.52
Funding
Michigan faces the worst funding crisis in 20 years, with the state unable to fund
an adequate education.53 Urban districts have been hardest hit due to declining
enrollments, high costs, and slow growth in basic aid.54 It is the large, urban, high-
poverty schools that failed AYP, that led David Plank to conclude that the NCLB system
is unresponsive to Michigan’s high poverty needs.55
NCLB Protest Activities
Michigan state officials have not registered protest activities like other states. The
state board did lower the standards when early projections showed almost immediate and
universal failure of almost all schools. The most significant protest activity is the Pontiac
School District’s role as lead plaintiff in the NEA’s federal court challenge. Pontiac
contends that the law forces unfunded and illegal mandates on schools.
AYP Parameters
Michigan’s annual objectives are based on the stair-step method until 2010,
followed by accelerated, back-loaded expectations in the later years. The system used a
minimum cell size of 30 and plans on implementing a confidence interval system, but no
such system is in place as of this writing.56 In Michigan, 32.2 percent of students are
identified as “economically disadvantaged.”

Page 23 of 65 This document is available on the Great Lakes Center website at: http://www.greatlakescenter.org
Figure 3
0
10
20
30
40
50
60
70
80
90
100
2002 2003 2004 2005 2006 2007 2008 2009 2010 2011 2012 2013 2014
Math & ELA; Middle
ANNUAL MEASUREABLE OBJECTIVES: MICHIGAN
Proficiency Target (%)
Math; Elementary
ELA; Elementary
Math; High School
ELA; High School
Minnesota
Pre-NCLB Accountability System
The existing state accountability system includes state standards, regular testing,
and an improvement plan for schools showing insufficient improvement. The Legislative
Auditor found that NCLB has created duplication and disrupted the state’s existing
system.57
NCLB Status
In 2004, 472 (21.6 percent) of the state’s 2182 public schools failed AYP, over
three times the number (144) identified as failing in 2003.58 Similar to the other Great
Page 24 of 65 This document is available on the Great Lakes Center website at: http://www.greatlakescenter.org
Lakes states, only one percent of schools were implementing required school choice, and
less than one percent is listed in other categories.
Nevertheless, the Legislative Auditor’s report projects 82 percent of the schools
failing under a high improvement rate assumption and 99 percent failing under a modest
improvement rate assumption. By 2014, 65 percent of Minnesota schools would be in the
restructuring phase.
Funding
The Legislative auditor’s report is a careful and complete study of the costs of
implementing NCLB. They parse state requirements before NCLB and calculate the
costs to modify or add on the new NCLB-required features. The report identifies new,
administrative costs related to NCLB alone at $39 million while the state received $42
million in total new money under NCLB. The report does not include the costs of
“making all students proficient,” nor does it include the costs of curriculum alignment,
restructuring, or the cost of qualified teachers and paraprofessionals. Money would have
to be taken from services to children, or a new funding source would have to be found the
report concludes.
NCLB Protest Activities
Following release of the costing study, Minnesota policy makers have been
among the more vocal national critics of the NCLB act. A January 2005 bill was
introduced directing the state Commissioner of Education to file for federal waivers from
“ineffective” provisions. If these waivers were not granted, then Minnesota would opt
out of NCLB. The bill has passed the Senate Finance and Senate Education committees
Page 25 of 65 This document is available on the Great Lakes Center website at: http://www.greatlakescenter.org
with bipartisan support. The state was earlier penalized in a dispute with the federal
government over the measurement of AYP.59 Two other resolutions were introduced in
the Senate asking the federal government to refrain from expanding NCLB to high
schools and to adopt the National Council of State Legislature’s recommendations on
improving NCLB. Yet another bill was introduced to revoke contracts with the federal
government if it did not accept specific Minnesota accountability procedures.60
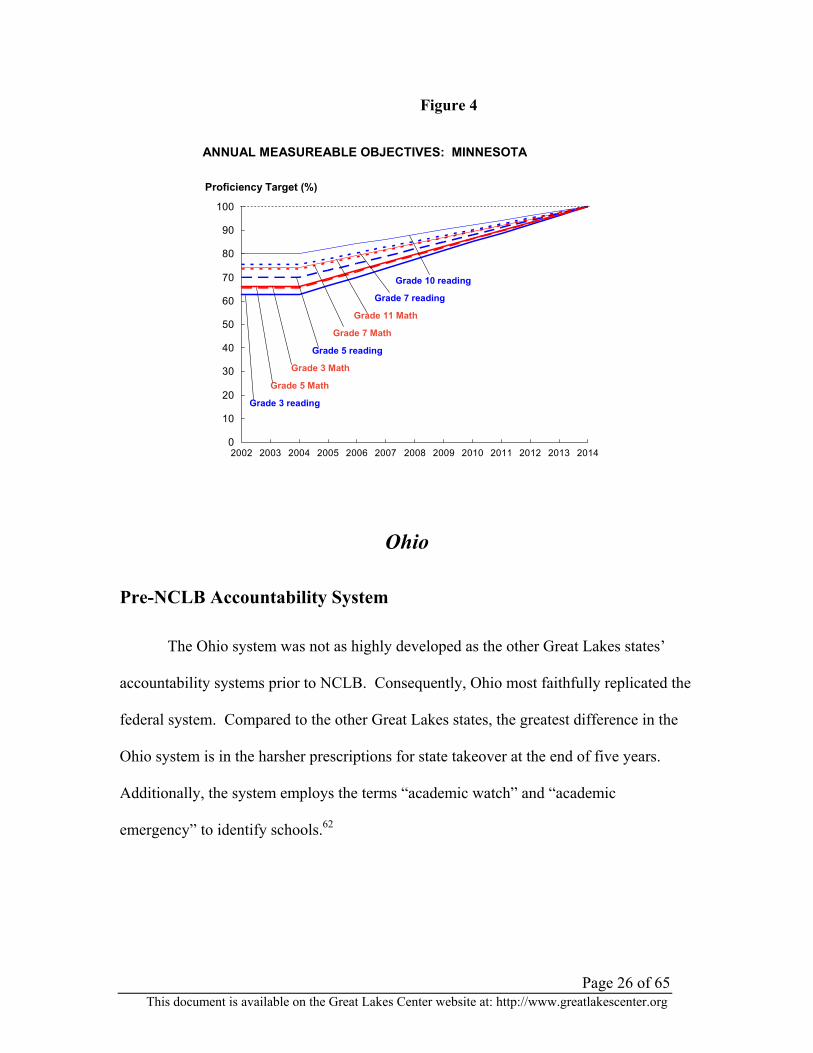
AYP Parameters
Minnesota’s growth expectations are flat in the earliest years, followed by a
straight-line increase beginning in 2004 until 2014. The minimum subgroup is a
relatively low 20 students. Confidence intervals are employed in the accountability
system on a sliding scale; these intervals fall between 95 percent and 99 percent based on
the number of subgroups measured in a particular school.61 A total of 27.5 percent of
students are economically disadvantaged.
Page 26 of 65 This document is available on the Great Lakes Center website at: http://www.greatlakescenter.org
Figure 4
0
10
20
30
40
50
60
70
80
90
100
2002 2003 2004 2005 2006 2007 2008 2009 2010 2011 2012 2013 2014
ANNUAL MEASUREABLE OBJECTIVES: MINNESOTA
Proficiency Target (%)
Grade 5 Math
Grade 3 reading
Grade 3 Math
Grade 5 reading
Grade 7 Math
Grade 11 Math
Grade 7 reading
Grade 10 reading
Ohio
Pre-NCLB Accountability System
The Ohio system was not as highly developed as the other Great Lakes states’
accountability systems prior to NCLB. Consequently, Ohio most faithfully replicated the
federal system. Compared to the other Great Lakes states, the greatest difference in the
Ohio system is in the harsher prescriptions for state takeover at the end of five years.
Additionally, the system employs the terms “academic watch” and “academic
emergency” to identify schools.62
Page 27 of 65 This document is available on the Great Lakes Center website at: http://www.greatlakescenter.org
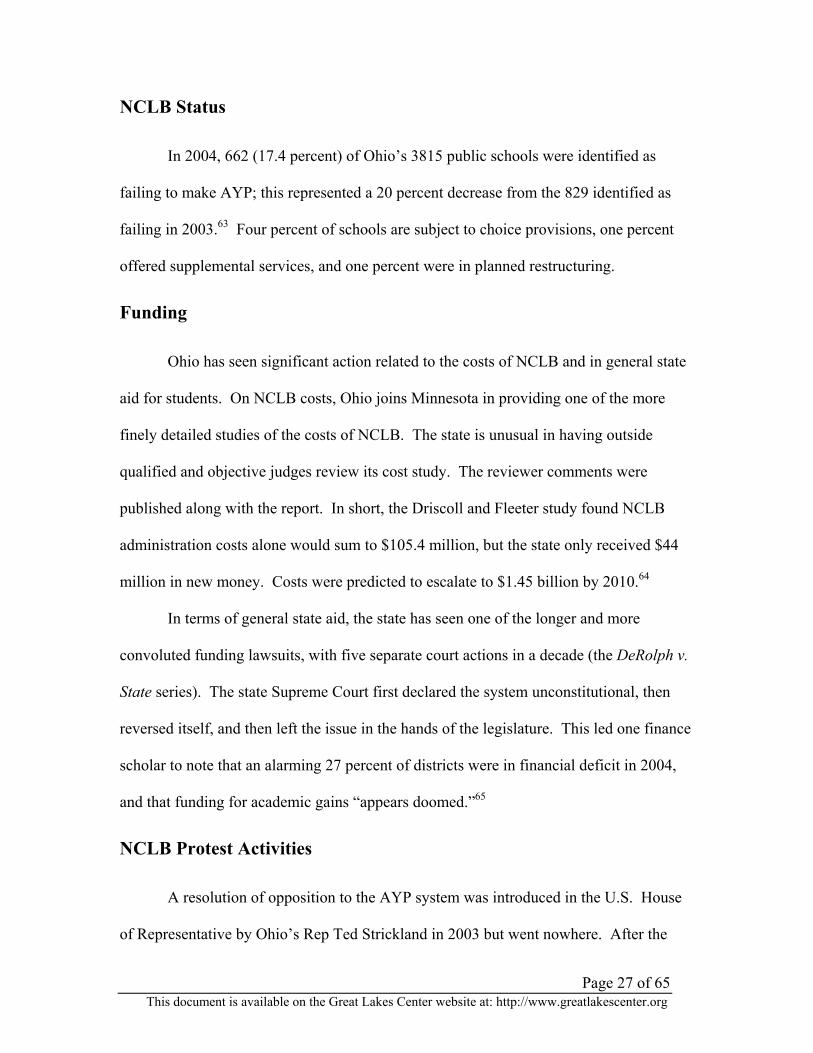
NCLB Status
In 2004, 662 (17.4 percent) of Ohio’s 3815 public schools were identified as
failing to make AYP; this represented a 20 percent decrease from the 829 identified as
failing in 2003.63 Four percent of schools are subject to choice provisions, one percent
offered supplemental services, and one percent were in planned restructuring.
Funding
Ohio has seen significant action related to the costs of NCLB and in general state
aid for students. On NCLB costs, Ohio joins Minnesota in providing one of the more
finely detailed studies of the costs of NCLB. The state is unusual in having outside
qualified and objective judges review its cost study. The reviewer comments were
published along with the report. In short, the Driscoll and Fleeter study found NCLB
administration costs alone would sum to $105.4 million, but the state only received $44
million in new money. Costs were predicted to escalate to $1.45 billion by 2010.64
In terms of general state aid, the state has seen one of the longer and more
convoluted funding lawsuits, with five separate court actions in a decade (the DeRolph v.
State series). The state Supreme Court first declared the system unconstitutional, then
reversed itself, and then left the issue in the hands of the legislature. This led one finance
scholar to note that an alarming 27 percent of districts were in financial deficit in 2004,
and that funding for academic gains “appears doomed.”65
NCLB Protest Activities
A resolution of opposition to the AYP system was introduced in the U.S. House
of Representative by Ohio’s Rep Ted Strickland in 2003 but went nowhere. After the
Page 28 of 65 This document is available on the Great Lakes Center website at: http://www.greatlakescenter.org
release of the Driscoll and Fleeter cost report, however, Ohio’s Republican-controlled
House decried the costs imposed on the state and in a 2004 bill asked for waivers and
federal funding. Interestingly, Rep. John Boehner (R-OH), Chair of the federal House
Committee on Education and the Workforce, has been one of the most vocal supporters
of NCLB. He has defended the adequacy of federal funding, saying that states were
“making money” off the NCLB appropriations.66
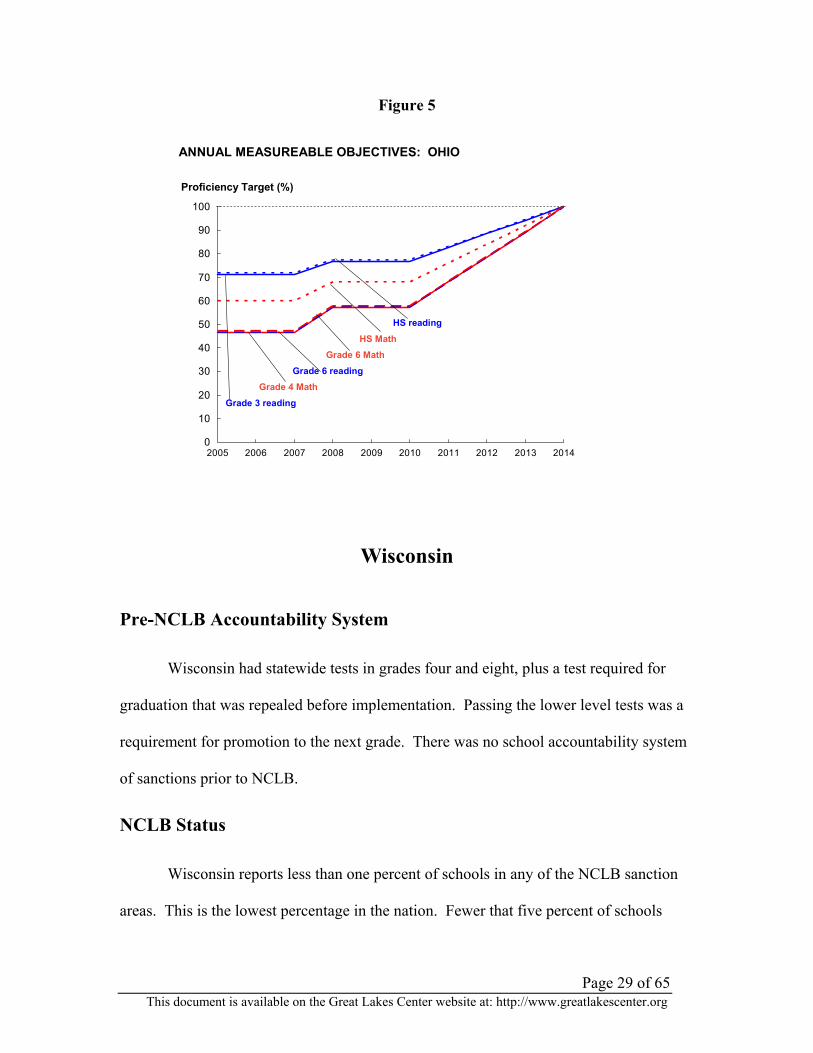
AYP Parameters
Ohio’s annual objectives are based on the stair-step method until 2010, followed
by accelerated, back-loaded expectations in the later years. Targets differ for both
reading and mathematics and are unique to elementary, middle, and high schools as well.
The minimum cell size is 30, with 45 students required in the special education category
before the group is used for accountability purposes. Ohio schools and subgroups can
meet their annual objectives on the basis of either current proficiency status or the
average proficiency status over the three years immediately preceding.67 A total of 28.7
percent of Ohio students are identified as economically disadvantaged.
Page 29 of 65 This document is available on the Great Lakes Center website at: http://www.greatlakescenter.org
Figure 5
0
10
20
30
40
50
60
70
80
90
100
2005 2006 2007 2008 2009 2010 2011 2012 2013 2014
ANNUAL MEASUREABLE OBJECTIVES: OHIO
Proficiency Target (%)
Grade 4 Math
Grade 3 reading
Grade 6 reading
Grade 6 MathHS Math
HS reading
Wisconsin
Pre-NCLB Accountability System
Wisconsin had statewide tests in grades four and eight, plus a test required for
graduation that was repealed before implementation. Passing the lower level tests was a
requirement for promotion to the next grade. There was no school accountability system
of sanctions prior to NCLB.
NCLB Status
Wisconsin reports less than one percent of schools in any of the NCLB sanction
areas. This is the lowest percentage in the nation. Fewer that five percent of schools
Page 30 of 65 This document is available on the Great Lakes Center website at: http://www.greatlakescenter.org
were identified as failing in either 2004 (108 of 2232 identified) or 2003 (110 of 2208
identified).68
Funding
Wisconsin is a relatively high-spending state, yet the funds are not targeted to the
cities where the resources are needed if high standards for all are to be achieved.69
Funding reform has stalled with the effects of the state’s recession, however. In costing
the amount needed to assure a high quality education for all students, the Institute for
Wisconsin’s Future estimates a need for a 35 percent increase in state educational
funding.70
NCLB Protests
Wisconsin Attorney General Peggy Lautenschlager provided one of the stronger
protests against NCLB under funding, stating in 2004 that states are not compelled to
fund any NCLB mandates not funded by the federal government.71 A resolution for full
funding subsequently passed the Senate but failed in the Assembly.
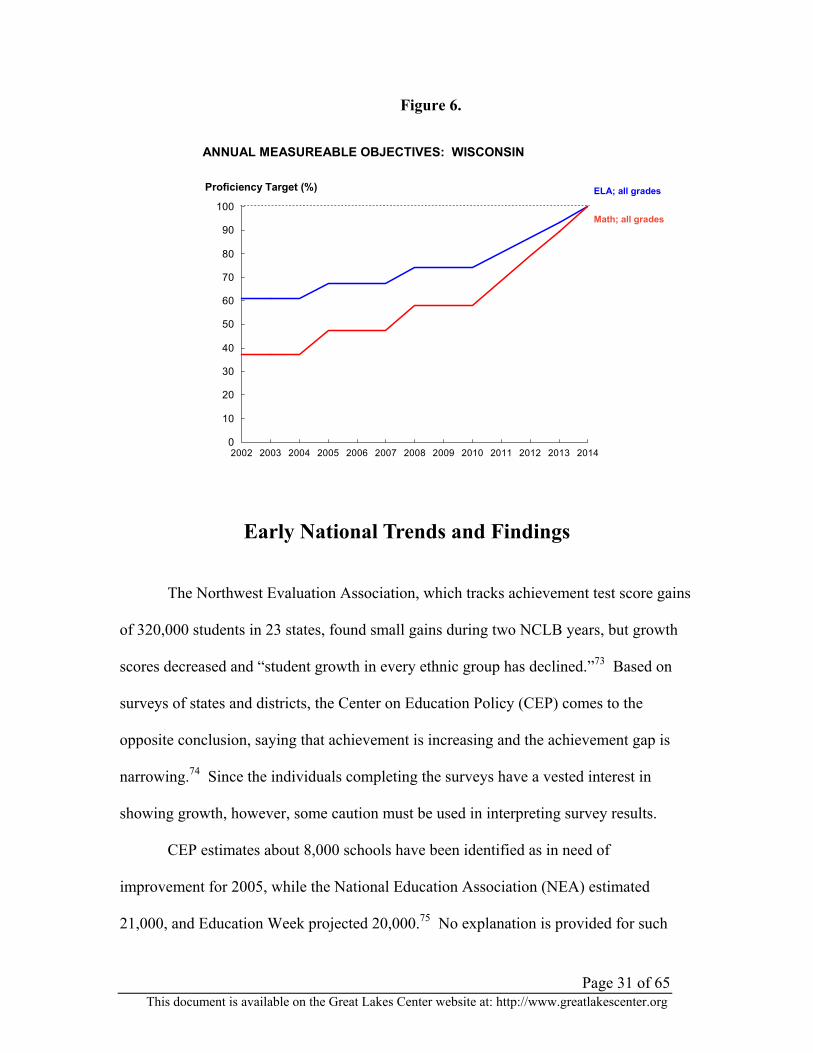
AYP Parameters
Wisconsin’s annual objectives are based on the stair-step method until 2010,
followed by accelerated, back-loaded expectations in later years. The minimum cell size
is 40 for most subgroups and 50 for special education students Likewise, the state uses a
standard error of measurement as a confidence interval, which results in lower numbers
of schools being identified. Wisconsin employs a two-tail 99 percent confidence interval
(as opposed to the one-tailed interval of Indiana) for this purpose.72 The student
population includes 27.6 percent of students identified as economically disadvantaged.
Page 31 of 65 This document is available on the Great Lakes Center website at: http://www.greatlakescenter.org
Figure 6.
0
10
20
30
40
50
60
70
80
90
100
2002 2003 2004 2005 2006 2007 2008 2009 2010 2011 2012 2013 2014
ELA; all grades
ANNUAL MEASUREABLE OBJECTIVES: WISCONSIN
Proficiency Target (%)
Math; all grades
Early National Trends and Findings
The Northwest Evaluation Association, which tracks achievement test score gains
of 320,000 students in 23 states, found small gains during two NCLB years, but growth
scores decreased and “student growth in every ethnic group has declined.”73 Based on
surveys of states and districts, the Center on Education Policy (CEP) comes to the
opposite conclusion, saying that achievement is increasing and the achievement gap is
narrowing.74 Since the individuals completing the surveys have a vested interest in
showing growth, however, some caution must be used in interpreting survey results.
CEP estimates about 8,000 schools have been identified as in need of
improvement for 2005, while the National Education Association (NEA) estimated
21,000, and Education Week projected 20,000.75 No explanation is provided for such
Page 32 of 65 This document is available on the Great Lakes Center website at: http://www.greatlakescenter.org
widely disparate projections. Thus, NEA and Education Week project large increases in
identified schools, while CEP shows basically a flat trajectory. Education Week reported
that the predicted “tidal wave” of identified schools has, so far, not yet occurred. CEP
and the Education Trust, a pro-accountability think tank, cite the number of schools
moving in or out of “needing improvement” status as evidence that NCLB is working.
Yet, a number of federal rule changes, and states’ and local districts’ increased
sophistication in applying the rules, offer alternative explanations for the plateau in the
number of identified schools. Indiana, for example, chose to count only those schools
receiving Title I money which shrank that state’s number of identified schools. Joel
Packer of the NEA says there are simply too many confounding variables in play to draw
definitive conclusions based on the number of identified schools.76
There is universal agreement that schools most frequently identified under AYP
tend to be middle schools, urban schools, or in very large districts. Schools with larger
numbers of Hispanic and Black students are also identified more frequently. Small, rural,
and suburban schools are identified less frequently. Schools with fewer minority groups,
less poverty and higher pre-existing achievement are less likely to be identified. A
number of analysts have concluded that the tests and the AYP system identify poverty
rather than the quality of a school’s academic program.77
Michigan state researchers, and many others, point to a number of compounding
factors that, in time, will lead to all schools being declared as in need of improvement:
• Standards continue to increase at regular intervals.
Page 33 of 65 This document is available on the Great Lakes Center website at: http://www.greatlakescenter.org
• More grade levels are being tested, which means that minimum cell size
requirements are more easily met, resulting in more subgroups in the AYP
analyses and more opportunities to fail.
• Since one year “gains” from previous changes to rules will no longer be
available, the number of schools identified as failing AYP, and the number of
schools in the various stages of “in need of assistance,” will grow
exponentially.
• Expectations for special education students and English Language Learners
are, prima facie, illogical and impossible to attain.
Predicting the Impact of AYP in the Great Lakes states
Although some earlier studies such as those in Indiana and Minnesota predicted
massive, if not universal, AYP failure rates; there is no clear estimate of how many
schools in the Great Lakes region will be affected by the AYP requirements. This section
projects the outcomes of AYP for schools in the Great Lakes states, taking into
consideration the parameters each state used to establish its annual objectives.
AYP projections are made for each year through 2014. The projections are based
on:
• each state’s current NCLB accountability system (as planned through 2014);
• the AYP parameters for each state as presented in section ZZ;
• the current (2003-2004) AYP status in each state/school/subgroup; and
• the projected rate of growth for state/school/subgroup according to three
separate scenarios.
Page 34 of 65 This document is available on the Great Lakes Center website at: http://www.greatlakescenter.org
The number of schools making or failing AYP is also affected by two other
factors: changes in student body makeup and the number of grades tested. These factors
influence the number of students per subgroup. An increase in the number of students
per subgroup is relevant because larger group sizes increase the possibility that subgroups
will reach the minimum student count thresholds necessary for inclusion in the AYP
analyses.
Demographic shifts (e.g. an influx of ELL students) will increase the size of the
student subgroups and states have little control over these demographic changes. The
expansion of state testing programs, however, is built into NCLB because the law
requires that all students in grades third through eighth and high school beginning in
2005-2006. The increase of students in state testing programs will also increase the
number of students in each subgroup. Our projections hold demographic makeup
constant. But they do account for the expansion of state testing programs and the impact
that increasing the number of students tested will have on the size and the numerical
significance of student subgroups.
The method each state used to set the annual objectives is a key element of the
study. As detailed earlier, states vary dramatically in how they set the annual objectives
that schools are required to meet in order to make sufficient progress toward the “100
percent proficient” requirement by 2014. Some states (e.g., Minnesota; Illinois) set
annual objectives in a more or less even, steady growth fashion, using primarily the
straight-line method. Other states (e.g., Michigan, Indiana, Ohio, and Wisconsin) use the
stair-step method and ramp up the annual objectives every few years until 2011, at which

Page 35 of 65 This document is available on the Great Lakes Center website at: http://www.greatlakescenter.org
time the annual objectives are back-loaded with rapid, straight-line growth required to
reach the 100 percent goal in 2014.
We should also note that the AYP requirements are a changing landscape. For
example, some states (e.g., Michigan, Ohio) plan to replace their state testing program
which, depending upon where the standards are set, could dramatically influence both the
failure rates as well as the year-to-year growth expectations. Also, states are seeking
flexibility from the U.S. Department of Education on the implementation of AYP.
Margaret Spellings, the Federal Education Secretary, recently signaled a willingness to
consider gain scores and other modifications that would allow schools to be measured
using growth indicators.78 At this writing, though, the Secretary’s signal for flexibility
remains undefined. Obviously, changes in the AYP requirements would influence the
rate and number of schools identified. As an example of how proposed changes might
affect the status of schools under AYP, we include projections for one state based on its
request to the U.S. Department of Education for flexibility.
Projecting the progress of schools under AYP is particularly complicated because
schools start at different points (meaning varied rates of growth are needed to reach the
100 percent proficiency goal) and schools can reasonably be expected to advance at
different rates. For example, growth expectations for schools starting out with 90 percent
of students meeting the standards in 2004 cannot be expected to be the same as schools
starting out with ten percent of students at proficiency. Furthermore, observed growth
and the standard setting assumptions which underlie the proficiency determinations differ
by school type; elementary schools will likely advance at a different rate than middle or
high schools. Studies that use a common growth rate across all schools, therefore, fail to
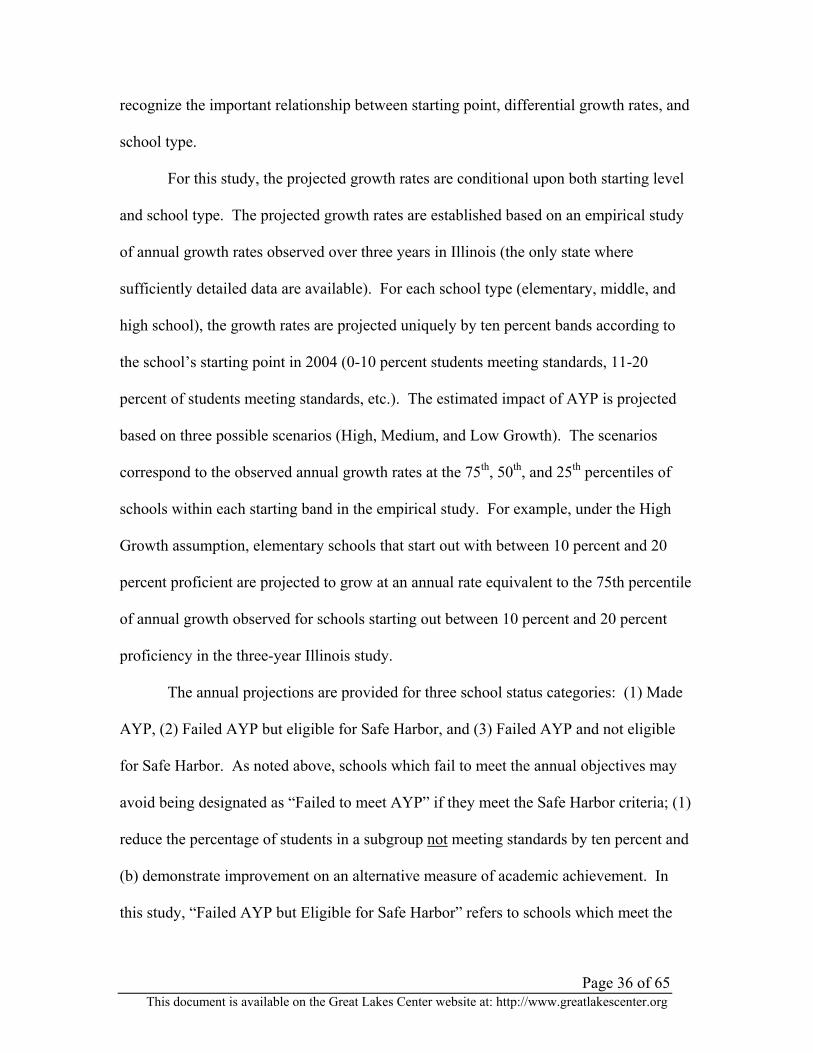
Page 36 of 65 This document is available on the Great Lakes Center website at: http://www.greatlakescenter.org
recognize the important relationship between starting point, differential growth rates, and
school type.
For this study, the projected growth rates are conditional upon both starting level
and school type. The projected growth rates are established based on an empirical study
of annual growth rates observed over three years in Illinois (the only state where
sufficiently detailed data are available). For each school type (elementary, middle, and
high school), the growth rates are projected uniquely by ten percent bands according to
the school’s starting point in 2004 (0-10 percent students meeting standards, 11-20
percent of students meeting standards, etc.). The estimated impact of AYP is projected
based on three possible scenarios (High, Medium, and Low Growth). The scenarios
correspond to the observed annual growth rates at the 75th, 50th, and 25th percentiles of
schools within each starting band in the empirical study. For example, under the High
Growth assumption, elementary schools that start out with between 10 percent and 20
percent proficient are projected to grow at an annual rate equivalent to the 75th percentile
of annual growth observed for schools starting out between 10 percent and 20 percent
proficiency in the three-year Illinois study.
The annual projections are provided for three school status categories: (1) Made
AYP, (2) Failed AYP but eligible for Safe Harbor, and (3) Failed AYP and not eligible
for Safe Harbor. As noted above, schools which fail to meet the annual objectives may
avoid being designated as “Failed to meet AYP” if they meet the Safe Harbor criteria; (1)
reduce the percentage of students in a subgroup not meeting standards by ten percent and
(b) demonstrate improvement on an alternative measure of academic achievement. In
this study, “Failed AYP but Eligible for Safe Harbor” refers to schools which meet the
Page 37 of 65 This document is available on the Great Lakes Center website at: http://www.greatlakescenter.org
first criterion only. These schools are eligible for Safe Harbor but have not necessarily
made AYP. “Making AYP with the Safe Harbor option is contingent on the relevant
subgroups meeting targets on alternative measures, which this analysis does not take into
consideration. Therefore, the projections in this study provide an upper bound, or a
conservative estimate, of the schools that will actually achieve Safe Harbor; in reality,
some proportion of schools eligible will fail to demonstrate progress on the alternative
measure and will subsequently be designated as failing to meet AYP.
In other ways as well our projections provide conservative estimates of school
identification as having failed to meet AYP. Under NCLB, schools and subgroups must
not only meet proficiency targets but must also meet an assessment “participation” target
(95 percent of students taking the state assessment); in this analysis all schools and
subgroups are assumed to have met the participation target, meaning that no schools are
estimated to have failed AYP on that basis. AYP also requires measurement of all
numerically significant subgroups made up of ethnic minority students, limited English
proficient (LEP) students, students with disabilities, and economically disadvantaged
students. In this study, only ethnic minority subgroups are assessed, as they are the only
ones that are mutually exclusive or non-overlapping. In other words, our projections do
not consider the schools that may fail to make AYP because of targets missed by
subgroups of LEP students, economically disadvantaged students, or students with
disabilities. Finally, in 2007 NCLB will require testing in science along with
English/language arts and math, potentially increasing by 50 percent the number of
participation and proficiency targets that a given school must meet. This analysis
Page 38 of 65 This document is available on the Great Lakes Center website at: http://www.greatlakescenter.org
includes only math and English/language arts, as no data is available to guide projections
of growth in science achievement. The science tests are required beginning in 2007.
Finally, the results are presented with minimum technical detail. The interested
reader is directed to the accompanying technical report for detailed information
(“Technical Details of Projecting AYP Success and Failure in Great Lakes States”). For
each of the Great Lakes states, the projected percentage of schools failing AYP, schools
failing AYP but Safe Harbor eligible, and schools making AYP are shown below:
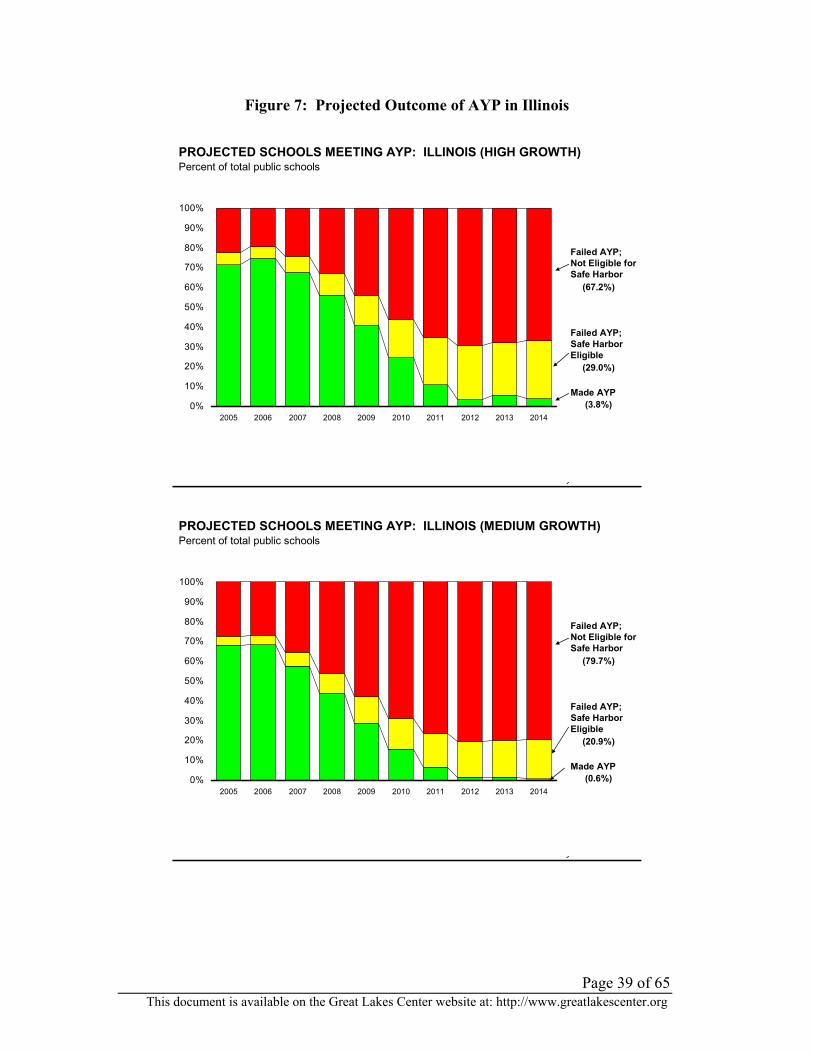
Illinois
Even under the most optimistic growth projections (High Growth) over 65 percent
of schools are expected to not make AYP by 2014 and nearly 30 percent more do not
make AYP but are Safe Harbor eligible. Most of the decline occurs after 2006 when the
Illinois annual objectives increase in a straight-line fashion. Furthermore, the projected
number of schools making AYP is expected to decrease precipitously until nearly all
schools are projected to have not made AYP.
Page 39 of 65 This document is available on the Great Lakes Center website at: http://www.greatlakescenter.org
Figure 7: Projected Outcome of AYP in Illinois
PROJECTED SCHOOLS MEETING AYP: ILLINOIS (HIGH GROWTH)
0%
10%
20%
30%
40%
50%
60%
70%
80%
90%
100%
2005 2006 2007 2008 2009 2010 2011 2012 2013 2014
Percent of total public schools
Made AYP
Failed AYP; Safe Harbor Eligible
Failed AYP; Not Eligible for Safe Harbor
(67.2%)
(29.0%)
(3.8%)
PROJECTED SCHOOLS MEETING AYP: ILLINOIS (MEDIUM GROWTH)
0%
10%
20%
30%
40%
50%
60%
70%
80%
90%
100%
2005 2006 2007 2008 2009 2010 2011 2012 2013 2014
Percent of total public schools
Made AYP
Failed AYP; Safe Harbor Eligible
Failed AYP; Not Eligible for Safe Harbor
(79.7%)
(20.9%)
(0.6%)

Page 40 of 65 This document is available on the Great Lakes Center website at: http://www.greatlakescenter.org
PROJECTED SCHOOLS MEETING AYP: ILLINOIS (LOW GROWTH)
0%
10%
20%
30%
40%
50%
60%
70%
80%
90%
100%
2005 2006 2007 2008 2009 2010 2011 2012 2013 2014
Percent of total public schools
Made AYP
Failed AYP; Safe Harbor Eligible
Failed AYP; Not Eligible for Safe Harbor
(85.7%)
(14.0%)
(0.3%)
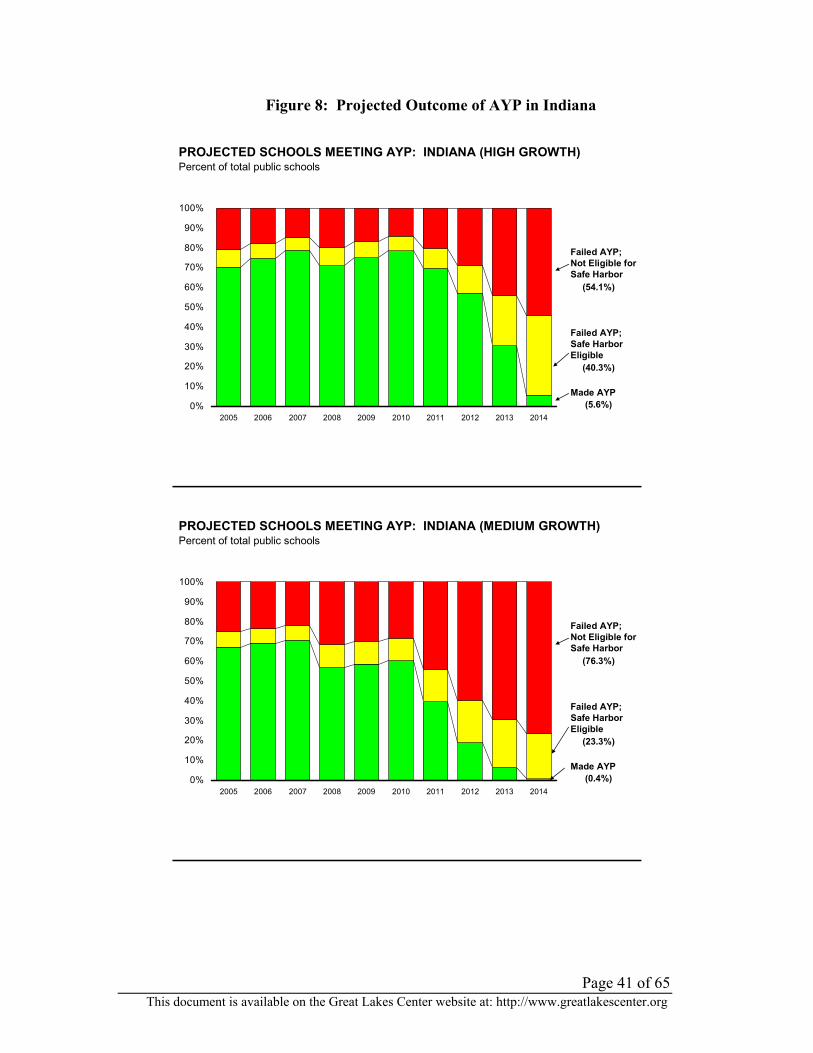
Indiana
If one assumes Indiana schools will progress at a high rate (equivalent to the 75th
percentile of schools in the empirical study), then the percentage of schools not making
AYP is limited to 54 percent come 2014. The percentage of schools making AYP,
however, even at this aggressive rate, is less than ten percent. Under the other scenarios,
the school outcomes are bleak and similar; 80 to 85 percent of schools eventually do not
make AYP.
Page 41 of 65 This document is available on the Great Lakes Center website at: http://www.greatlakescenter.org
Figure 8: Projected Outcome of AYP in Indiana
PROJECTED SCHOOLS MEETING AYP: INDIANA (HIGH GROWTH)
0%
10%
20%
30%
40%
50%
60%
70%
80%
90%
100%
2005 2006 2007 2008 2009 2010 2011 2012 2013 2014
Percent of total public schools
Made AYP
Failed AYP; Safe Harbor Eligible
Failed AYP; Not Eligible for Safe Harbor
(54.1%)
(40.3%)
(5.6%)
PROJECTED SCHOOLS MEETING AYP: INDIANA (MEDIUM GROWTH)
0%
10%
20%
30%
40%
50%
60%
70%
80%
90%
100%
2005 2006 2007 2008 2009 2010 2011 2012 2013 2014
Percent of total public schools
Made AYP
Failed AYP; Safe Harbor Eligible
Failed AYP; Not Eligible for Safe Harbor
(76.3%)
(23.3%)
(0.4%)
Page 42 of 65 This document is available on the Great Lakes Center website at: http://www.greatlakescenter.org
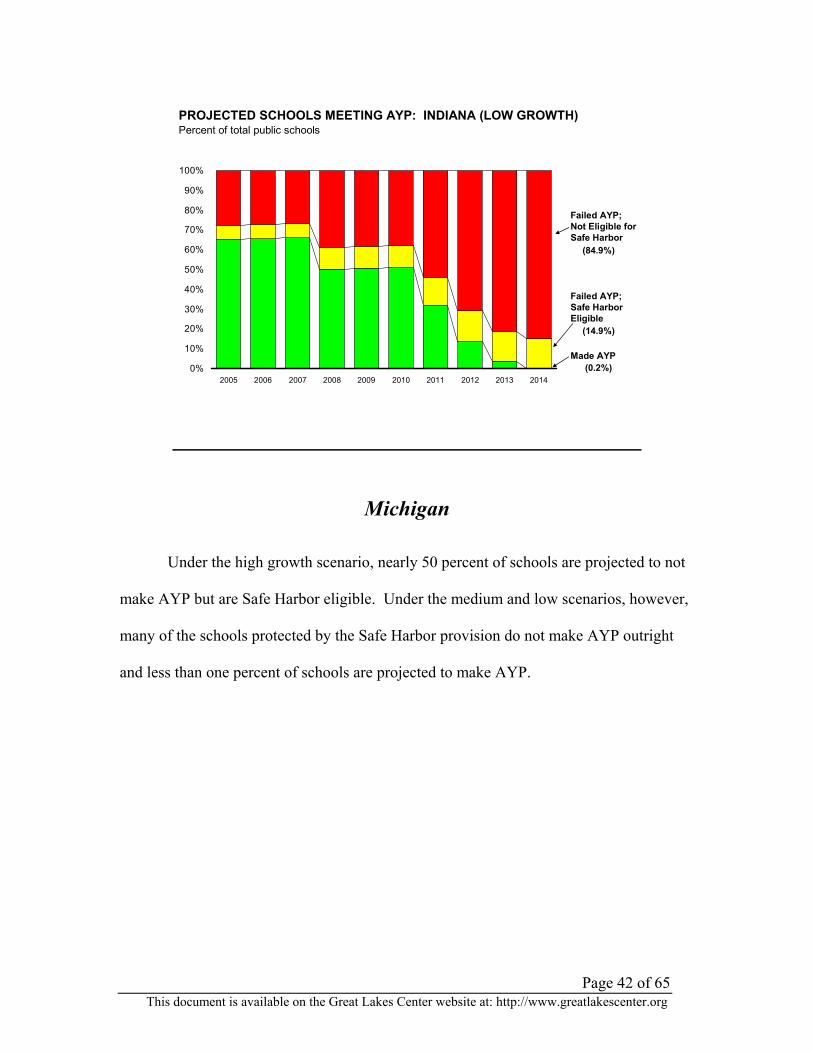
PROJECTED SCHOOLS MEETING AYP: INDIANA (LOW GROWTH)
0%
10%
20%
30%
40%
50%
60%
70%
80%
90%
100%
2005 2006 2007 2008 2009 2010 2011 2012 2013 2014
Percent of total public schools
Made AYP
Failed AYP; Safe Harbor Eligible
Failed AYP; Not Eligible for Safe Harbor
(84.9%)
(14.9%)
(0.2%)
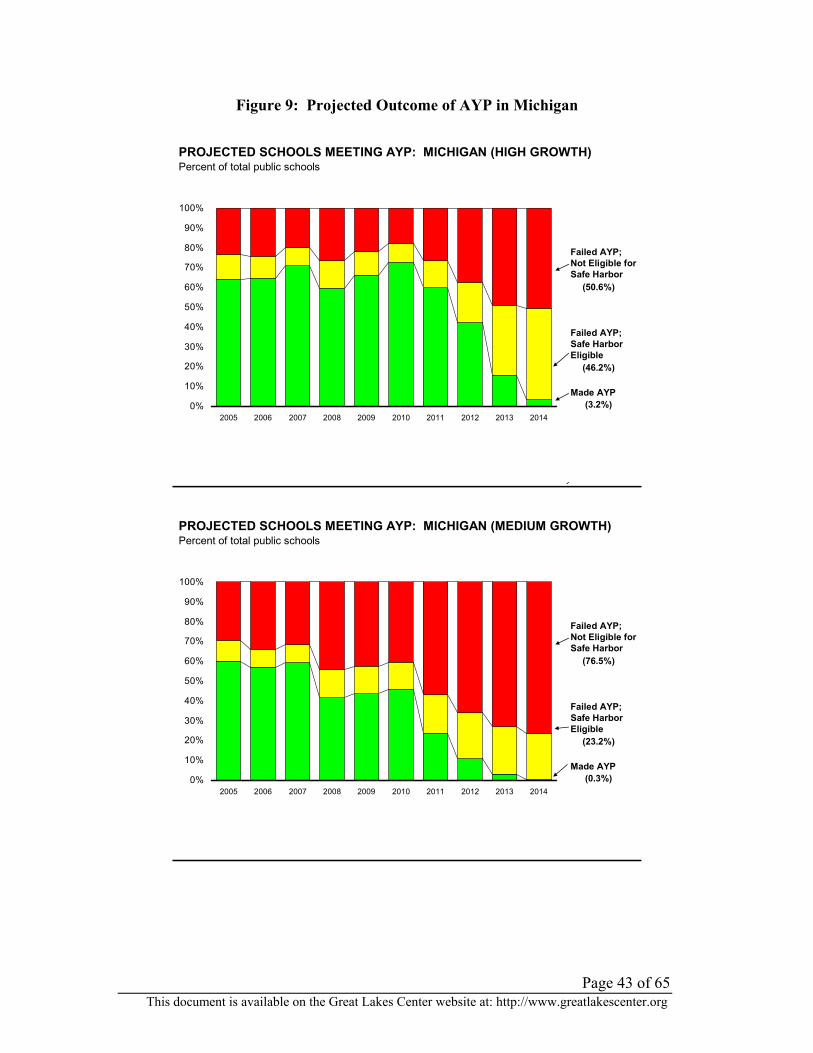
Michigan
Under the high growth scenario, nearly 50 percent of schools are projected to not
make AYP but are Safe Harbor eligible. Under the medium and low scenarios, however,
many of the schools protected by the Safe Harbor provision do not make AYP outright
and less than one percent of schools are projected to make AYP.
Page 43 of 65 This document is available on the Great Lakes Center website at: http://www.greatlakescenter.org
Figure 9: Projected Outcome of AYP in Michigan
PROJECTED SCHOOLS MEETING AYP: MICHIGAN (HIGH GROWTH)
0%
10%
20%
30%
40%
50%
60%
70%
80%
90%
100%
2005 2006 2007 2008 2009 2010 2011 2012 2013 2014
Percent of total public schools
Made AYP
Failed AYP; Safe Harbor Eligible
Failed AYP; Not Eligible for Safe Harbor
(50.6%)
(46.2%)
(3.2%)
PROJECTED SCHOOLS MEETING AYP: MICHIGAN (MEDIUM GROWTH)
0%
10%
20%
30%
40%
50%
60%
70%
80%
90%
100%
2005 2006 2007 2008 2009 2010 2011 2012 2013 2014
Percent of total public schools
Made AYP
Failed AYP; Safe Harbor Eligible
Failed AYP; Not Eligible for Safe Harbor
(76.5%)
(23.2%)
(0.3%)
Page 44 of 65 This document is available on the Great Lakes Center website at: http://www.greatlakescenter.org
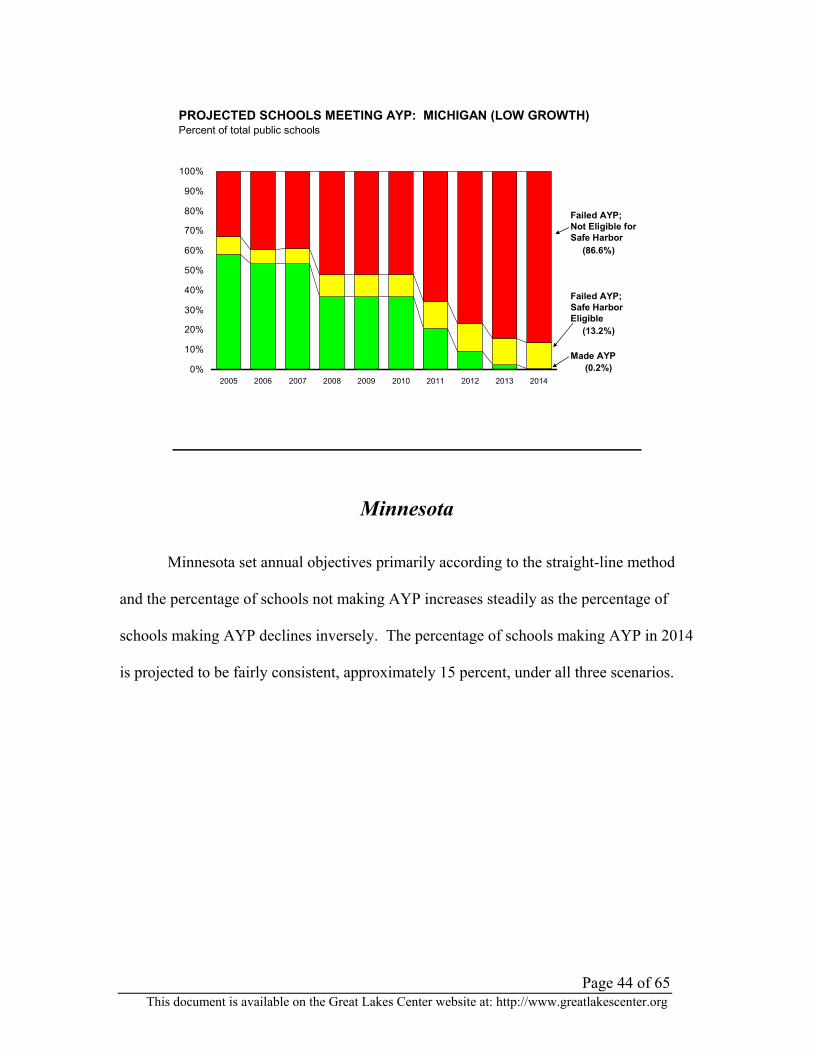
PROJECTED SCHOOLS MEETING AYP: MICHIGAN (LOW GROWTH)
0%
10%
20%
30%
40%
50%
60%
70%
80%
90%
100%
2005 2006 2007 2008 2009 2010 2011 2012 2013 2014
Percent of total public schools
Made AYP
Failed AYP; Safe Harbor Eligible
Failed AYP; Not Eligible for Safe Harbor
(86.6%)
(13.2%)
(0.2%)
Minnesota
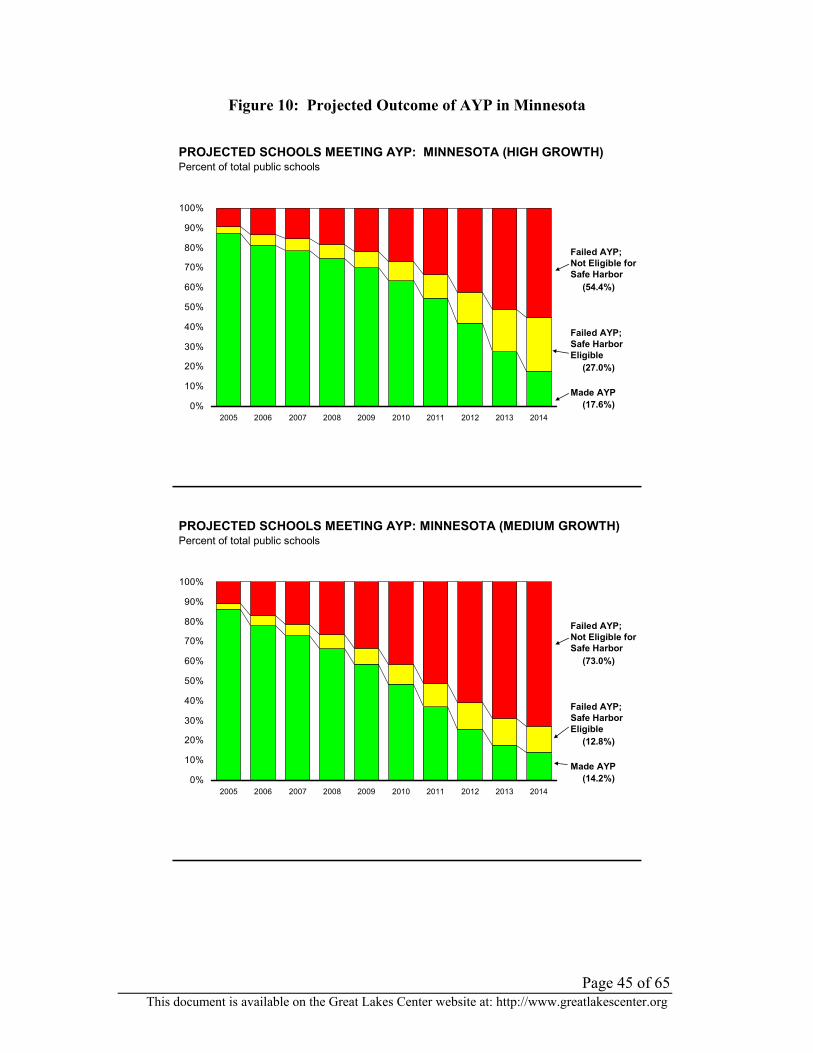
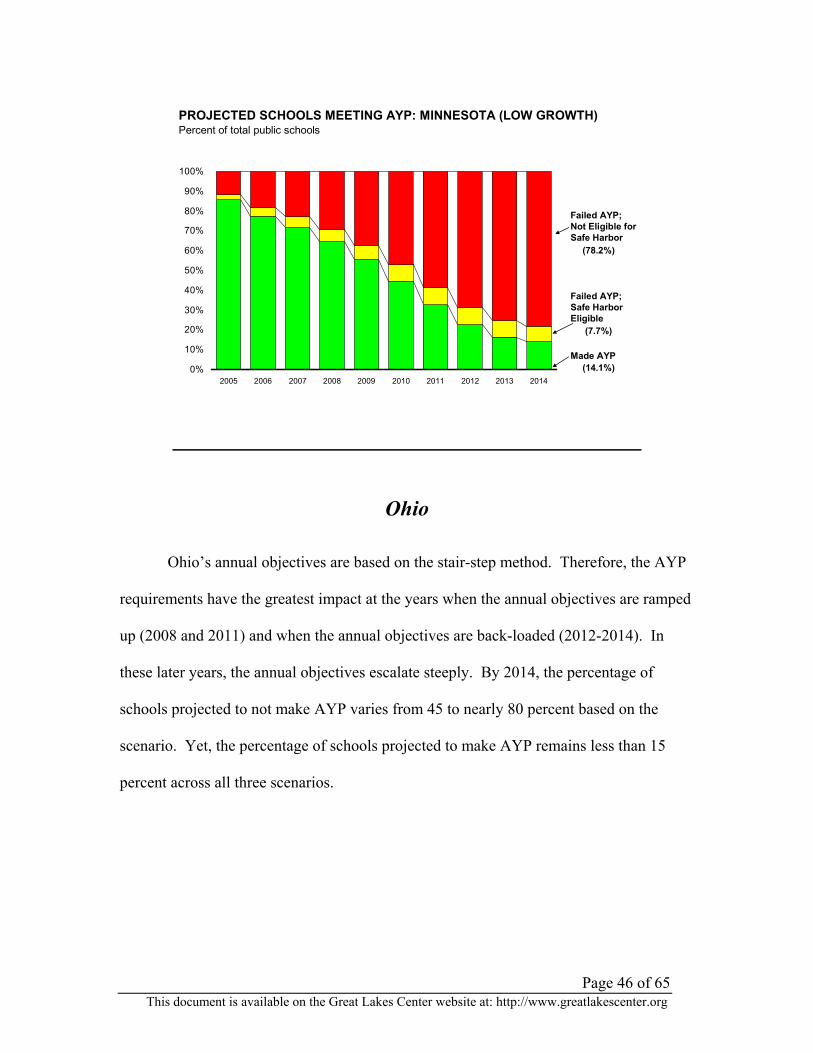
Minnesota set annual objectives primarily according to the straight-line method
and the percentage of schools not making AYP increases steadily as the percentage of
schools making AYP declines inversely. The percentage of schools making AYP in 2014
is projected to be fairly consistent, approximately 15 percent, under all three scenarios.
Page 45 of 65 This document is available on the Great Lakes Center website at: http://www.greatlakescenter.org
Figure 10: Projected Outcome of AYP in Minnesota
PROJECTED SCHOOLS MEETING AYP: MINNESOTA (HIGH GROWTH)
0%
10%
20%
30%
40%
50%
60%
70%
80%
90%
100%
2005 2006 2007 2008 2009 2010 2011 2012 2013 2014
Percent of total public schools
Made AYP
Failed AYP; Safe Harbor Eligible
Failed AYP; Not Eligible for Safe Harbor
(54.4%)
(27.0%)
(17.6%)
PROJECTED SCHOOLS MEETING AYP: MINNESOTA (MEDIUM GROWTH)
0%
10%
20%
30%
40%
50%
60%
70%
80%
90%
100%
2005 2006 2007 2008 2009 2010 2011 2012 2013 2014
Percent of total public schools
Made AYP
Failed AYP; Safe Harbor Eligible
Failed AYP; Not Eligible for Safe Harbor
(73.0%)
(12.8%)
(14.2%)
Page 46 of 65 This document is available on the Great Lakes Center website at: http://www.greatlakescenter.org
PROJECTED SCHOOLS MEETING AYP: MINNESOTA (LOW GROWTH)
0%
10%
20%
30%
40%
50%
60%
70%
80%
90%
100%
2005 2006 2007 2008 2009 2010 2011 2012 2013 2014
Percent of total public schools
Made AYP
Failed AYP; Safe Harbor Eligible
Failed AYP; Not Eligible for Safe Harbor
(78.2%)
(7.7%)
(14.1%)
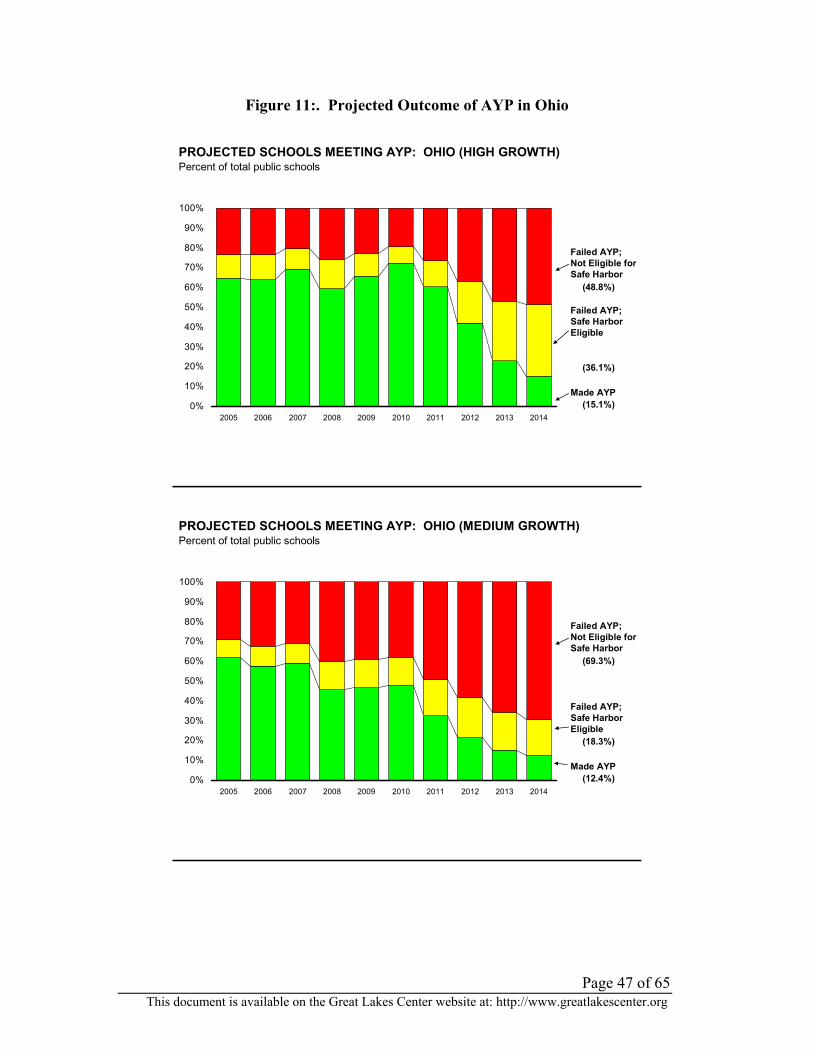
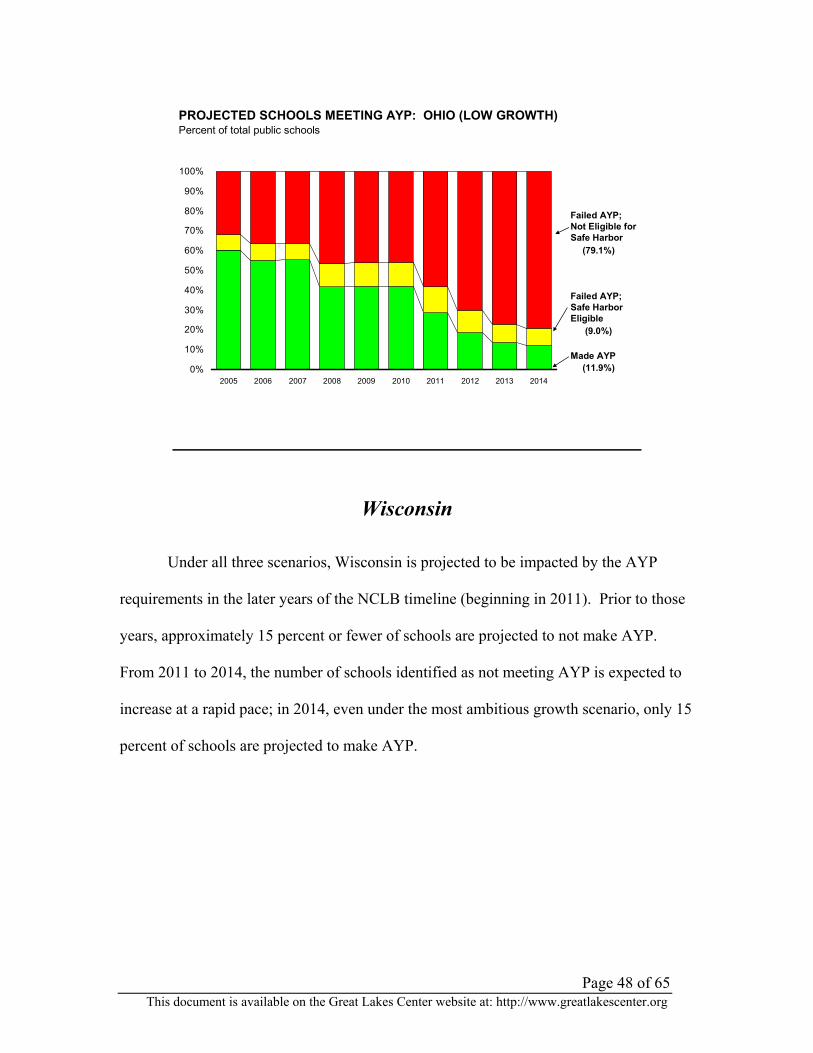
Ohio
Ohio’s annual objectives are based on the stair-step method. Therefore, the AYP
requirements have the greatest impact at the years when the annual objectives are ramped
up (2008 and 2011) and when the annual objectives are back-loaded (2012-2014). In
these later years, the annual objectives escalate steeply. By 2014, the percentage of
schools projected to not make AYP varies from 45 to nearly 80 percent based on the
scenario. Yet, the percentage of schools projected to make AYP remains less than 15
percent across all three scenarios.
Page 47 of 65 This document is available on the Great Lakes Center website at: http://www.greatlakescenter.org
Figure 11:. Projected Outcome of AYP in Ohio
PROJECTED SCHOOLS MEETING AYP: OHIO (HIGH GROWTH)
0%
10%
20%
30%
40%
50%
60%
70%
80%
90%
100%
2005 2006 2007 2008 2009 2010 2011 2012 2013 2014
Percent of total public schools
Made AYP
Failed AYP; Safe Harbor Eligible
Failed AYP; Not Eligible for Safe Harbor
(48.8%)
(36.1%)
(15.1%)
PROJECTED SCHOOLS MEETING AYP: OHIO (MEDIUM GROWTH)
0%
10%
20%
30%
40%
50%
60%
70%
80%
90%
100%
2005 2006 2007 2008 2009 2010 2011 2012 2013 2014
Percent of total public schools
Made AYP
Failed AYP; Safe Harbor Eligible
Failed AYP; Not Eligible for Safe Harbor
(69.3%)
(18.3%)
(12.4%)
Page 48 of 65 This document is available on the Great Lakes Center website at: http://www.greatlakescenter.org
PROJECTED SCHOOLS MEETING AYP: OHIO (LOW GROWTH)
0%
10%
20%
30%
40%
50%
60%
70%
80%
90%
100%
2005 2006 2007 2008 2009 2010 2011 2012 2013 2014
Percent of total public schools
Made AYP
Failed AYP; Safe Harbor Eligible
Failed AYP; Not Eligible for Safe Harbor
(79.1%)
(9.0%)
(11.9%)
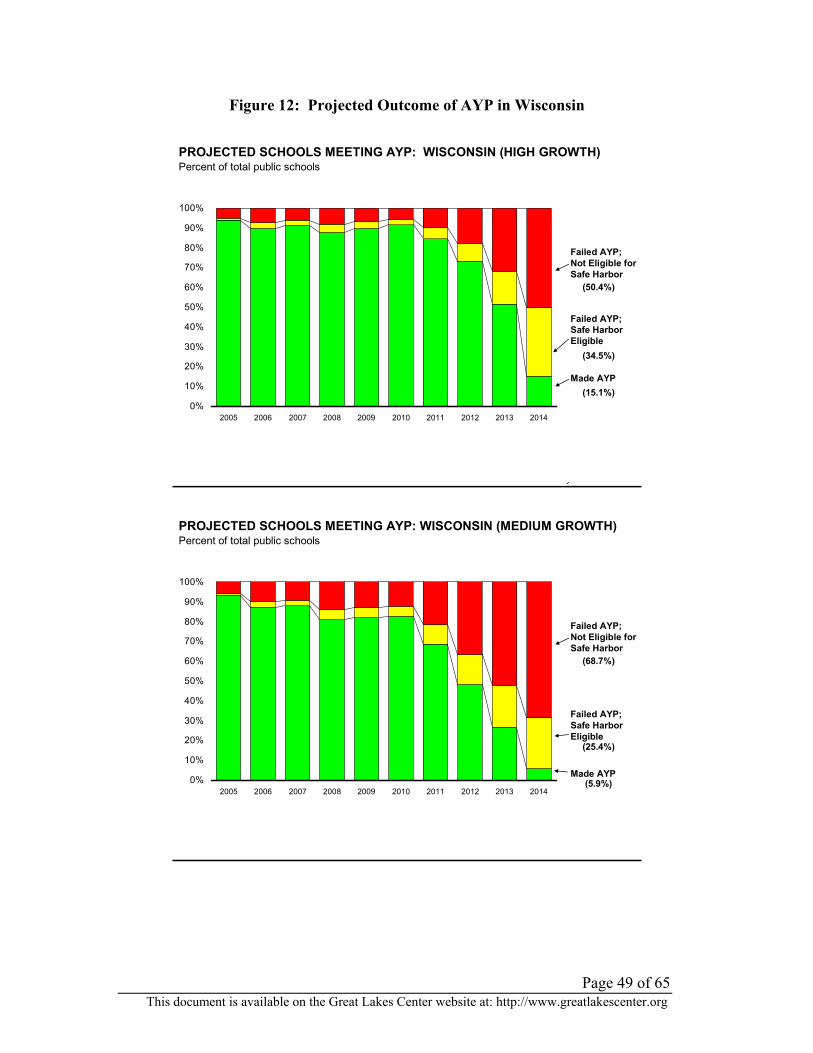
Wisconsin
Under all three scenarios, Wisconsin is projected to be impacted by the AYP
requirements in the later years of the NCLB timeline (beginning in 2011). Prior to those
years, approximately 15 percent or fewer of schools are projected to not make AYP.
From 2011 to 2014, the number of schools identified as not meeting AYP is expected to
increase at a rapid pace; in 2014, even under the most ambitious growth scenario, only 15
percent of schools are projected to make AYP.
Page 49 of 65 This document is available on the Great Lakes Center website at: http://www.greatlakescenter.org
Figure 12: Projected Outcome of AYP in Wisconsin
PROJECTED SCHOOLS MEETING AYP: WISCONSIN (HIGH GROWTH)
0%
10%
20%
30%
40%
50%
60%
70%
80%
90%
100%
2005 2006 2007 2008 2009 2010 2011 2012 2013 2014
Percent of total public schools
Made AYP
Failed AYP; Safe Harbor Eligible
Failed AYP; Not Eligible for Safe Harbor
(50.4%)
(34.5%)
(15.1%)
PROJECTED SCHOOLS MEETING AYP: WISCONSIN (MEDIUM GROWTH)
0%
10%
20%
30%
40%
50%
60%
70%
80%
90%
100%
2005 2006 2007 2008 2009 2010 2011 2012 2013 2014
Percent of total public schools
Made AYP
Failed AYP; Safe Harbor Eligible
Failed AYP; Not Eligible for Safe Harbor
(68.7%)
(25.4%)
(5.9%)

Page 50 of 65 This document is available on the Great Lakes Center website at: http://www.greatlakescenter.org
PROJECTED SCHOOLS MEETING AYP: WISCONSIN (LOW GROWTH)
0%
10%
20%
30%
40%
50%
60%
70%
80%
90%
100%
2005 2006 2007 2008 2009 2010 2011 2012 2013 2014
Percent of total public schools
Made AYP
Failed AYP; Safe Harbor Eligible
Failed AYP; Not Eligible for Safe Harbor
(54.7%)
(40.7%)
(4.6%)
When and at what rate schools are threatened by the possibility of failing AYP
differs significantly across states due in part to the aggressiveness of the annual
objectives. For example, Ohio’s annual objectives are relatively low until 2011, at which
time they increase substantially (ten percent annually) to 100 percent in 2014. As such,
Ohio’s rate of meeting targets stays high until 2011, at which point it drops dramatically.
An even more pronounced drop in AYP success is evidenced in Wisconsin, a state for
which targets step up only minimally until the 2011 onset of a rapid ascent. Minnesota,
on the other hand, requires straight-line growth forward from 2004 onward; it is little
surprise, then, that the percentage of schools making AYP in Minnesota’s declines
consistently with the increases in annual objectives.
Although states differ in the timing and rate at which schools fail to make AYP,
the ultimate outcome is clear and consistent across all states: even in high-growth

Page 51 of 65 This document is available on the Great Lakes Center website at: http://www.greatlakescenter.org
scenarios, states are likely to observe high rates of school failure relative to the annual
objectives, especially as targets increase in later years. This is the case regardless of
built-in easements of confidence intervals (common to IL, IN, MN, and WI), rolling
averages (OH), partial credit for nearly proficient students (MN), and safe harbor
requirements (all states).
Anticipating substantial and increasing numbers of schools facing the severe
sanctions associated with schools in “corrective action” or “restructuring,” many states
have proposed changes to their No Child Left Behind requirements. In fact, the U.S.
Department of Education expects nearly every state to apply for changes in the AYP
requirements.79
In most cases these changes are intended to ease the requirements for the annual
objectives. Though such changes will likely improve school “success” rates in the short
term, the ultimate widespread identification of schools as “needs improvement” will
ultimately be delayed rather than avoided. Illinois, for example, recently petitioned the
Department of Education to increase its standard for subgroup “numerical significance”
from 40 students to the greater of 50 students or 15 percent of the test-taking population.
As evidenced from the projections under Illinois’ proposed systems provided in Figure 13
below, proposed changes do partially stem the tide of schools failing AYP in the early
years (increasing AYP “success” rates by two to five percent). Ultimately, though, the
changes do little to prevent the widespread identification of schools as failing AYP in the
subsequent years of the NCLB timeline.
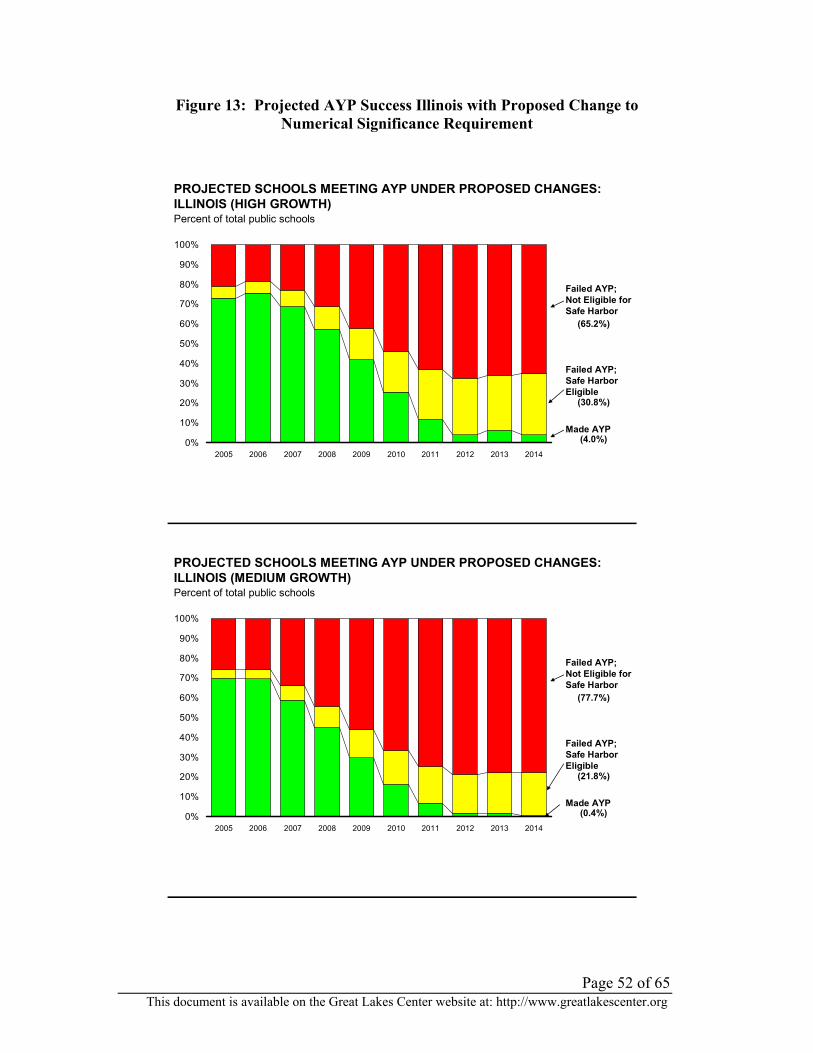
Page 52 of 65 This document is available on the Great Lakes Center website at: http://www.greatlakescenter.org
Figure 13: Projected AYP Success Illinois with Proposed Change to Numerical Significance Requirement
PROJECTED SCHOOLS MEETING AYP UNDER PROPOSED CHANGES: ILLINOIS (HIGH GROWTH)
0%
10%
20%
30%
40%
50%
60%
70%
80%
90%
100%
2005 2006 2007 2008 2009 2010 2011 2012 2013 2014
Percent of total public schools
Made AYP
Failed AYP; Safe Harbor Eligible
Failed AYP; Not Eligible for Safe Harbor
(65.2%)
(30.8%)
(4.0%)
0%
10%
20%
30%
40%
50%
60%
70%
80%
90%
100%
2005 2006 2007 2008 2009 2010 2011 2012 2013 2014
Made AYP
Failed AYP; Safe Harbor Eligible
Failed AYP; Not Eligible for Safe Harbor
PROJECTED SCHOOLS MEETING AYP UNDER PROPOSED CHANGES: ILLINOIS (MEDIUM GROWTH) Percent of total public schools
(77.7%)
(21.8%)
(0.4%)
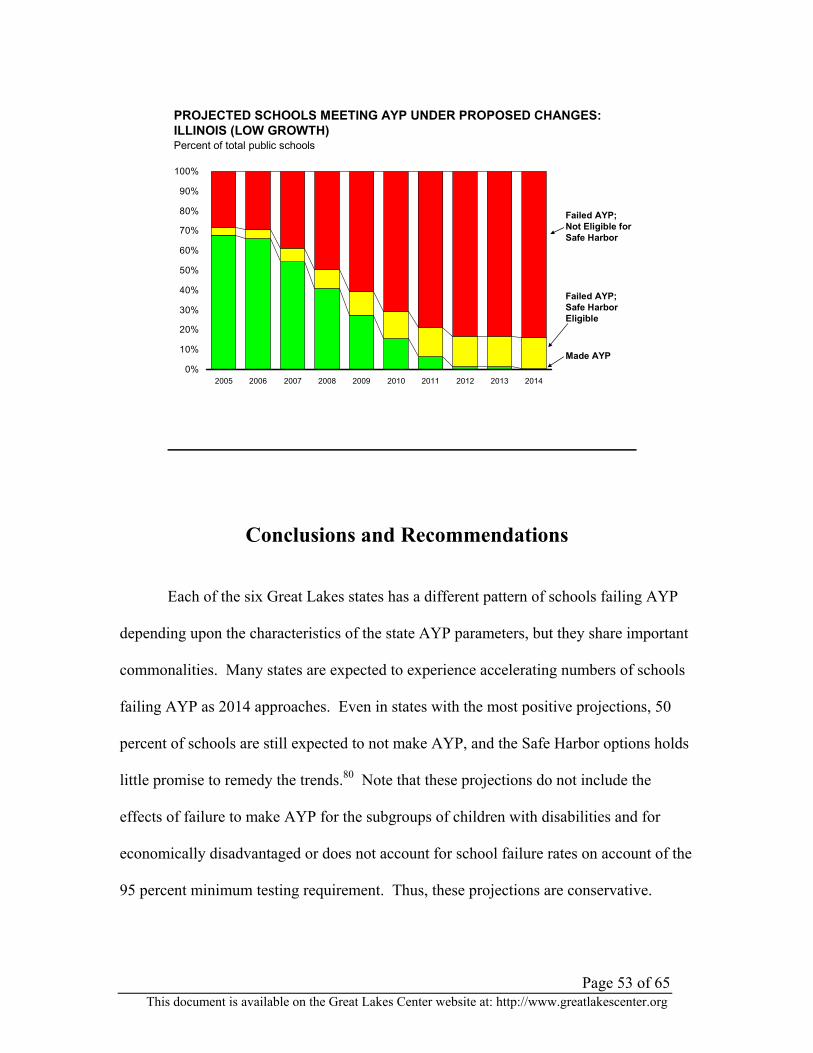
Page 53 of 65 This document is available on the Great Lakes Center website at: http://www.greatlakescenter.org
0%
10%
20%
30%
40%
50%
60%
70%
80%
90%
100%
2005 2006 2007 2008 2009 2010 2011 2012 2013 2014
Made AYP
Failed AYP; Safe Harbor Eligible
Failed AYP; Not Eligible for Safe Harbor
PROJECTED SCHOOLS MEETING AYP UNDER PROPOSED CHANGES: ILLINOIS (LOW GROWTH) Percent of total public schools
Conclusions and Recommendations
Each of the six Great Lakes states has a different pattern of schools failing AYP
depending upon the characteristics of the state AYP parameters, but they share important
commonalities. Many states are expected to experience accelerating numbers of schools
failing AYP as 2014 approaches. Even in states with the most positive projections, 50
percent of schools are still expected to not make AYP, and the Safe Harbor options holds
little promise to remedy the trends.80 Note that these projections do not include the
effects of failure to make AYP for the subgroups of children with disabilities and for
economically disadvantaged or does not account for school failure rates on account of the
95 percent minimum testing requirement. Thus, these projections are conservative.
Page 54 of 65 This document is available on the Great Lakes Center website at: http://www.greatlakescenter.org
Some hope that this grim prognosis can be mitigated if Secretary Spellings grants
significant and meaningful flexibility to states. In a May 2005 decision, she granted
Florida flexibility on the size of subgroups and in shifting from a stair-step to a linear
AYP model. A decision on Florida’s request for a gain model was postponed.81 Little
can be interpreted from the Florida request because the changes were no more than what
had already been granted to other states. The federal government has signaled a
willingness to consider more fundamental changes, such as the use of gain or value-added
models or following the same group of students. Certainly such models would address
one of the existing problems with the AYP requirements, but it would also introduce a
new set of problems regarding equating scores across grade levels.
Of relevance to this report is whether the announced flexibility will make a
meaningful difference to the projections presented here. As shown using Illinois’ request
for flexibility under AYP as an example, if the end goal is still all children in all groups
reaching test standards by 2014, the end result remains unchanged. Schools will continue
to fail, at a minimum, at the rates projected in this study. Secretary Spellings has
pronounced that the “bright line” of non-negotiable flexibility is annual testing. This was
reaffirmed in the denial of Connecticut’s request for alternate-year testing.82 Final
growth expectations are defined in the law. If testing and growth expectations remain in
their current form, then flexibility pronouncements will be cosmetic rather than
meaningful.
There is considerable speculation about the shape of the law as a result of the
reauthorization process in 2007. Such scenarios involve extensive political
prognostication, however, and are well beyond the scope of this paper. But if the end
Page 55 of 65 This document is available on the Great Lakes Center website at: http://www.greatlakescenter.org
goal of AYP requires all groups and subgroups to reach proficiency by 2014, the
estimates of massive proportions of schools failing AYP in this report remain valid.
The education of all children to high standards is a moral imperative. This
requirement has been embraced by educators and policy makers across the political
spectrum. Perhaps the single greatest attribute of NCLB is that it has brought this issue
to the forefront. While the lower performance of poor and minority populations has been
well known among educators and researchers for the last century, there has been a lesser
will in political circles to fund and support equal educational opportunities for all
children. This is well-exemplified in Ohio’s DeRolph case and in countless other court
cases across the land.83
In the minds of some, NCLB is a purposeful effort to declare the public school
system a failure and replace it with a privatized system of education. Needless to say,
such a massive shift would have incalculable effects on society, education, and
democracy. Whether such a purpose was intended resides in the minds of those who
crafted and approved the law. Nevertheless, based on these projections and assuming
states use the forced re-organization requirements of NCLB to contract with private
companies, the effect will be to force the public education system into a privatized model
or, at least, one that broadens the role of private service providers in public education.
Groups such as the Center on Education Policy, the American Association of
School Administrators, the National Council of State Legislatures, and the National
Education Association have made recommendations to improve NCLB. While such
recommendations vary considerably, all groups find the AYP system unrealistic or
unworkable.

Page 56 of 65 This document is available on the Great Lakes Center website at: http://www.greatlakescenter.org
This report includes broad conclusions and recommendations, as well as, specific
recommendations to improve the AYP requirements.
Broad conclusions and recommendations:
• Schools are not capable of closing the achievement gap without resolving the
social problems that underlie this gap. While schools, as well as all other
institutions, must continuously strive for maximum efficiency, the
fundamental assumption of NCLB is that schools can solely resolve the
inequities in our society. As these models demonstrate, there is simply no
empirical rationale for this assumption. Closing the achievement gap requires
the strengthening and inclusion of families, community, health providers,
childcare, early education, summer, after school activities, and technical
education among other vital and essential services.
• Adequate funding for remediation and social infrastructure is essential to meet
the proposed goals. Many of the current estimates of NCLB funding levels
commonly include only the costs of the administrative and bureaucratic
procedures for implementing the law. Large investments in both remedial
opportunities and social opportunities are necessary to overcome disparities
and meet student educational needs. The median cost of adequacy studies,
which project the costs to bring all children to standards, indicate an
additional national investment of $138 billion is needed.84
• The AYP system does not measure the quality of a school’s academic
programs. The system of annual goals as required in NCLB inevitably
identifies nearly all schools as failing AYP, even if the school makes
Page 57 of 65 This document is available on the Great Lakes Center website at: http://www.greatlakescenter.org
exceptional growth. School evaluation is necessary to assure educational
quality, but it must be based on realistic and comprehensive expectations.
• The multiple purposes of education are not properly measured through a test-
based accountability system. It is essential that other measures of school and
student success also be used in state accountability systems. For example, the
social and democratizing goals of American education are neglected in the
AYP and NCLB systems.
Specific conclusions and recommendations on the AYP process include:
• Standard Setting: The standards themselves are pivotal in any test-based
accountability system. Not only must standards be realistic, they must
accurately reflect both the skills and the attributes needed by citizens in
society. Standards in the Great Lakes states as well as other states are not
linked to external expectations.
• Gain Models: AYP requirements must include gain models that accurately
credit student achievement over time. Despite technical problems, gain or
value-added models are a great improvement over the current system.
Comparing different student cohorts introduces unacceptable levels of error.
• Realistic Growth Expectations: The goal of all students achieving standards
by 2014 is a political construction. The goal is not grounded in research. As
demonstrated with the Great Lakes states, the growth expectations in NCLB
are unrealistic, regardless of the rates of growth. Growth expectations must be
recalibrated empirically in order to set reasonable expectations. Further, the
Page 58 of 65 This document is available on the Great Lakes Center website at: http://www.greatlakescenter.org
greatest gains are required from those schools with the greatest challenges in
reaching standards. The result is inevitable failure regardless of the quality of
educational programs.
• Confidence Intervals and subgroup sizes: While NCLB is still based on
unrealistic rates of growth, immediate damage to schools from false labeling
can be partially and temporarily averted by the aggressive use of confidence
intervals and subgroup sizes.
• Unique subgroup issues: The rules applied to special education, English
language learners, and schools with migratory populations are particularly
troublesome and will result in great over-identification regardless of the
quality of the schools’ educational programs. Standards and growth
expectations for these groups must be modified or eliminated if a fair and
reasonable system is desired.
The projections for schools in the Great Lakes states warn against the
sustainability of NCLB as the AYP requirements are currently constructed. The
projections for the Great Lakes states are applicable nationwide. Many states have AYP
parameters similar to the Great Lakes states and their schools are facing a similar fate.
Thus, the entire country faces tremendous failure rates even under a conservative
estimate with a number of forgiving assumptions.
Page 59 of 65 This document is available on the Great Lakes Center website at: http://www.greatlakescenter.org
Notes & References
1 Elmore, R.F. (2002). Unwarranted Intrusion. Education Next, 2(1).
www.educationnext.org/20021/30.html 2 Staples, B. (2005, April 18). Editorial observer: On the sidelines of the most important Civil Rights
battle since Brown [Opinion Column]. New York Times. 3 Center on Education Policy (2005). From the Capital to the Classroom: Year 3 of the No Child Left
Behind Act. Washington, DC: Author. Retrieved March 25, 2003, from http://www.cep-dc.org/pubs/nclby3/
4 Mathis, W. J., Fleming, K., & Lecker, W.C. (2005, March 18). The NCLB rebellion: Money, politics and student learning. Paper presented at the American Education Finance Association’s Annual Meeting. Louisville, KY: Author. Retrieved May 26, 2005, from http://www.rnesu.k12.vt.us/superpub/bill_papers/nclb/The%20NCLB%20Rebellion_%20Money%20Politics%20and%20Student%20Learning05.pdf
5 Ibid. 6 National Conference of State Legislatures. (2005). Task Force on No Child Left Behind: Final Report
(ISBN 1-580924-383-5). Denver, CO: Author, pp. 6-7. Retrieved May 26, 2005, from http://www.ncsl.org/programs/press/2005/NCLB_exec_summary.htm
7 Paige, R. (2003, October 29). It’s not about the money [Opinion Article]. Wall Street Journal.
See also:
Spellings, M. (2005, May 1). Growing pains won’t sidetrack No Child Left Behind [Opinion Column]. USA Today.
8 Hargreaves, A. (2004, April 12). Standardization and the end of the knowledge society. Paper presented at the Annual Meeting of the American Educational Research Association. San Diego, CA: Author.
9 Center on Education Policy (2005). From the Capital to the Classroom: Year 3 of the No Child Left Behind Act. Washington, DC: Author, p. 109. Retrieved March 25, 2003, from http://www.cep-dc.org/pubs/nclby3/
10 Levin, H. (2004) Multiple ‘choice’ questions: The road ahead. In N. Epstein (Ed.) Who’s in charge here? The tangled web of school governance and policy. Washington, DC: Brookings Institution.
11 Paige, R. (2003, October 29). It’s not about the money [Opinion Article]. Wall Street Journal.
See also:
Spellings, M. (2005, May 1). Growing pains won’t sidetrack No Child Left Behind [Opinion Column]. USA Today.
12 Mathis, W. (2005). The cost of implementing the federal No Child Left Behind Act: Different assumptions, different answers. Peabody Journal of Education, 80(2), 91-120.
13 Center on Education Policy (2005). From the Capital to the Classroom: Year 3 of the No Child Left Behind Act. Washington, DC: Author. Retrieved March 25, 2003, from http://www.cep-dc.org/pubs/nclby3/
14 National Conference of State Legislatures. (2005). Task Force on No Child Left Behind: Final Report (ISBN 1-580924-383-5). Denver, CO: Author, pp. 6-7. Retrieved May 26, 2005, from http://www.ncsl.org/programs/press/2005/NCLB_exec_summary.htm
15 Mathis, W. (2005). The cost of implementing the federal No Child Left Behind Act: Different assumptions, different answers. Peabody Journal of Education, 80(2), 91-120.
Page 60 of 65 This document is available on the Great Lakes Center website at: http://www.greatlakescenter.org
See also:
Hunter, M. (2004, September 15). Status of school funding litigation in the 50 states. New York, NY: ACCESS, Campaign for Fiscal Equity. Retrieved May 20, 2005, from http://www.schoolfunding.info/litigation/adequacydecisions12-7-04.pdf
16 Cronin, J., Kingsbury, G.G., McCall, M.S., & Bowe, B. (2005, April). The impact of the No Child Left Behind Act on student achievement and growth: 2005 edition. Lake Oswego, OR: Northwest Evaluation Association. Retrieved May 1, 2005, from www.nwea.org/research/nclbstudy.asp
17 Rothstein, R. (2004). Class and schools: Using social economic and educational reform to close the achievement gap. Washington, DC: Economic Policy Institute.
18 Roschevsky, A (2002, October 12). Symposium on the costs of educational adequacy in rural environments. Manchester NH.: Rural School and Community Trust.
For a summary of the symposium, see:
Mathis, W.J. (2003, summer). Financial challenges, adequacy, and equity in rural schools and communities. Journal of Education Finance, 29, 119-136.
19 Plank. D. N. (2004, May 21). Failing the NCLB challenge: How public policies handicap high-Poverty schools. [Powerpoint Presentation] East Lansing, MI: Education Policy Center, Michigan State University. Retrieved May 26, 2005, from www.epc.msu.edu/events/files/MPLP.ppt
20 Mathis, W.J., Fleming, K., & Lecker, W.C. (2005, March 18). The NCLB rebellion: Money, politics and student learning. Paper presented at the American Education Finance Association’s Annual Meeting. Louisville, KY: Author. Retrieved May 26, 2005, from http://www.rnesu.k12.vt.us/superpub/bill_papers/nclb/The%20NCLB%20Rebellion_%20Money%20Politics%20and%20Student%20Learning05.pdf
21 Linn, R.L., Baker, E.L., & Betebenner, D.W. (2002, August/September). Accountability systems: Implications of the No Child Left Behind Act of 2001. Educational Researcher, 31(6), 3-16.
Also see:
Linn, R.L., Baker, E.L., & Betebenner, D.W. (2005). Accountability systems: Ramifications of the No Child Left Behind Act of 2001. Denver, CO: Education Commission of the States Issue Paper. Retrieved March 27, 2005, from http://www.ecs.org/clearinghouse/35/65/3565.htm
22 Kingsbury, G.G., Olson, A., Cronin, J., Hauser, C. & Hauser, R. (2003, November 24). The state of state standards. Lake Oswego, OR: Northwest Evaluation Association. http://www.nwea.org/assets/research/national/State%20of%20State%20standards%20-%20complete%20report.pdf
23 Mathis, W.J., Fleming, K., & Lecker, W.C. (2005, March 18). The NCLB rebellion: Money, politics and student learning. Paper presented at the American Education Finance Association’s Annual Meeting. Louisville, KY: Author. Retrieved May 26, 2005, from http://www.rnesu.k12.vt.us/superpub/bill_papers/nclb/The%20NCLB%20Rebellion_%20Money%20Politics%20and%20Student%20Learning05.pdf
24 Linn, R. (2003). Accountability: Responsibility and reasonable expectations. Educational Researcher, 32(7), 3-13.
Also see:
Linn, R. L. (2004, July 28) Rethinking the No Child Left Behind accountability system. Paper prepared for a forum on No Child Left Behind. Washington, DC: Center on Education Policy.
Linn, R.L., Baker, E.L., & Betebenner, D.W. (2005). Accountability systems: Ramifications of the No Child Left Behind Act of 2001. Denver, CO: Education Commission of the States Issue Paper. Retrieved March 27, 2005, from http://www.ecs.org/clearinghouse/35/65/3565.htm
Page 61 of 65 This document is available on the Great Lakes Center website at: http://www.greatlakescenter.org
25 Linn, R.L., Baker, E.L., & Betebenner, D.W. (2005). Accountability systems: Ramifications of the No
Child Left Behind Act of 2001. Denver, CO: Education Commission of the States Issue Paper. Retrieved March 27, 2005, from http://www.ecs.org/clearinghouse/35/65/3565.htm
26 Haney, W. (2002). Lake Woebeguaranteed: Misuse of test scores in Massachusetts: Part I. Education Policy Analysis Archives, (10)42. Retrieved May 26, 2005, from http://epaa.asu.edu
Also see:
Lee, J. (2002, November 3-6) Evaluating rural progress in mathematics achievement: Is adequate yearly progress (AYP) feasible, valid, reliable and fair? Paper prepared for the ACCLAIM Conference, SUNY-Buffalo. Buffalo, NY: Author.
27 Cronin, J., Kingsbury, G.G., McCall, M.S., & Bowe, B. (2005, April). The impact of the No Child Left Behind Act on student achievement and growth: 2005 edition. Lake Oswego, OR: Northwest Evaluation Association. Retrieved May 1, 2005, from www.nwea.org/research/nclbstudy.asp
28 Packer, J. (2004, July 28). No Child Left Behind and adequate yearly progress fundamental flaws: A forecast for failure. Paper presented at Center for Education Policy Forum on Ideas to Improve the Accountability Provisions. Washington, DC.
29 Rose, L. (2002). Hard Facts regarding adequate yearly progress (AYP) under the No Child Left Behind Act. Indianapolis, IN: Indiana Urban Schools Association.
See also:
Packer, J. (2004, July 28). No Child Left Behind and adequate yearly progress fundamental flaws: A forecast for failure. Paper presented at Center for Education Policy Forum on Ideas to Improve the Accountability Provisions. Washington, DC.
30 Kim, J. & Sunderman, G.L. (2004, February). Large mandates and limited resources: State response to the No Child Left Behind Act and implications for accountability. Cambridge, MA: Harvard Civil Rights Project.
31 Berliner, D. (2005, April 12). Invited presidential address at the American Educational Research Association’s annual meeting, Montreal.
Shepard, L. (2002, April 8). Invited presidential address at the American Educational Research Association’s Annual meeting, Montreal.
Linn, R.L., Baker, E.L., & Betebenner, D.W. (2005). Accountability Systems: Ramifications of the No Child Left Behind Act of 2001. Education Commission of the States Issue Paper. Retrieved March 27, 2005, from http://www.ecs.org/clearinghouse/35/65/3565.htm
Popham, W.J. (2004). America’s Failing Schools. Routledge/Taylor & Francis, New York. 32 Popham, W.J. (2004). America’s Failing Schools. Routledge/Taylor & Francis, New York. 33 Education Policy Center at Michigan State University. (2000, December). Accountability and
accreditation (Data Brief 3). East Lansing, MI: Author. Retrieved May 27, 2005, from http://www.epc.msu.edu/publications/databrief/databrief3.pdf
34 Kim, J. & Sunderman, G.L. (2004, February). Large mandates and limited resources: State response to the No Child Left Behind Act and implications for accountability. Cambridge, MA: Harvard Civil Rights Project.
35 Kane, T.J. & Staiger, D.O. (2001). Volatility in school test scores: Implications for school based accountability systems. Unpublished paper. Stanford, CA: Hoover Institution, Stanford University.
36 Linn, R.L., Baker, E.L., & Betebenner, D.W. (2005). Accountability systems: Ramifications of the No Child Left Behind Act of 2001. Denver, CO: Education Commission of the States Issue Paper. Retrieved March 27, 2005, from http://www.ecs.org/clearinghouse/35/65/3565.htm
Page 62 of 65 This document is available on the Great Lakes Center website at: http://www.greatlakescenter.org
Also see:
National Conference of State Legislatures. (2005). Task Force on No Child Left Behind: Final Report (ISBN 1-580924-383-5). Denver, CO: Author, pp. 6-7. Retrieved May 26, 2005, from http://www.ncsl.org/programs/press/2005/NCLB_exec_summary.htm
37 Tucker, A. (2004, August 11). In Testing, How Reliable are Year-to-Year Comparisons? [Commentary]. Education Week.
38 Nichols, S.L. & Berliner, D.C. (2005). The inevitable corruption of indicators and educators through high-stakes testing (EPSL-0503-101-EPRU). Tempe, AZ: Education Policy Research Unit, Educational Policy Studies Laboratory, Arizona State University. Retrieved May 26, 2005, from http://www.asu.edu/educ/epsl/EPRU/documents/EPSL-0503-101-EPRU.pdf
Also see:
Ryan, J.E. (2004, July 2). The perverse incentives of the No Child Left Behind Act. New York University Law Review, 79, 932-989.
39 Ziebarth, T. (2004, December) State policies for school restructuring. State Notes: Accountability. Denver, CO: Education Commission of the States. Retrieved May 2, 2005, from www.ecs.org/clearinghouse/57/02/5702.doc
40 Ziebarth, T. (2005). Critical mass. Denver, CO: Education Commission of the States. Retrieved March 9, 2005, from http://www.ecs.org/clearinghouse/59/68/5968.doc
41 Education Funding Advisory Board. (2002, October). Recommendations for systemic reform of funding for elementary and secondary education in Illinois. Chicago, IL: Author. Retrieved May 27, 2005, from http://www.isbe.state.IL.US/EFAB/Archive/PDFs/FinalReport1002.pdf
42 Augenblick & Myers, Inc. (2001). A procedure for calculating a base cost figure and an adjustment for at-risk pupils that could be used in the Illinois School Finance System. A report prepared for the Illinois Education Funding Advisory Board. Denver, CO: Author. Retrieved May 2, 2005, from http://www.isbe.state.IL.us/EFAB/archive/PDFs/fullreport.pdf
43 Mathis, W.J., Fleming, K., & Lecker, W.C. (2005, March 18). The NCLB rebellion: Money, politics and student learning. Paper presented at the American Education Finance Association’s Annual Meeting. Louisville, KY: Author. Retrieved May 26, 2005, from http://www.rnesu.k12.vt.us/superpub/bill_papers/nclb/The%20NCLB%20Rebellion_%20Money%20Politics%20and%20Student%20Learning05.pdf
44 Pierce, J. (2003). Minimum size of subgroups for adequate yearly progress (AYP). State Notes: No Child Left Behind. Denver, CO: Education Commission of the States. Retrieved March 27, 2005, from http://www.ecs.org/clearinghouse/49/76/4976.htm
45 Ziebarth, T. (2004, December). State Policies for School Restructuring. State Notes: Accountability. Denver, CO: Education Commission of the States. Retrieved May 2, 2005, from http://www.ecs.org/clearinghouse/57/02/5702.doc
46 Olson, L. (2004, September 8). Data show schools making progress on federal goals. Education Week, 24(2), 24-28.
47 Augenblick & Myers, Inc. (2002, September). Calculation of an adequate education in Indiana in 2001-2002 using the professional judgment approach. A report prepared for the Indiana State Teachers’ Association. Denver, CO: Author. Retrieved March 5, 2005, from http://www.apaconsulting.net/Flash/papers/INDIANAFINALREPORT.pdf
48 Indiana State Budget Agency and Legislative Services Agency. (2003, December 3). Fiscal impact of No Child Left Behind [Power-point presentation to the Legislature].
Page 63 of 65 This document is available on the Great Lakes Center website at: http://www.greatlakescenter.org
49 Pierce, J. (2003). Minimum size of subgroups for adequate yearly progress (AYP). State Notes: No Child
Left Behind. Denver, CO: Education Commission of the States. Retrieved March 27, 2005, from http://www.ecs.org/clearinghouse/49/76/4976.htm
50 Reimann, C.B. & Lee, K. (2004, June). Can Michigan meet the NCLB challenge? Interpreting the 2004 Priority Schools List (Policy Report No. 21). East Lansing, MI: Education Policy Center, Michigan State University. Retrieved March 4, 2005, from http://www.epc.msu.edu/publications/REPORT/report21.pdf
See also:
Plank, D.N. & Ray, L.M. (2001, September). School performance and accountability in Michigan: Results from the 2001 state of the state survey (Policy report No. 5). East Lansing, MI: Education Policy Center, Michigan State University. Retrieved May 25, 2005, http://www.epc.msu.edu/publications/REPORT/Report5.pdf
51 Ziebarth, T. (2005). Critical mass. Denver, CO: Education Commission of the States. Retrieved March 9, 2005, from http://www.ecs.org/clearinghouse/59/68/5968.doc
52 Reimann, C.B. & Lee, K. (2004, June). Can Michigan meet the NCLB challenge? Interpreting the 2004 Priority Schools List (Policy Report No. 21). East Lansing, MI: Education Policy Center, Michigan State University. Retrieved March 4, 2005, from http://www.epc.msu.edu/publications/REPORT/report21.pdf
53 Addonzio, M.F. (2005, March). Michigan school finance 2004: Running on empty. State of the State paper presented at the American Education Finance Association meeting, Louisville, KY.
54 Ibid. 55. Plank, D.N. (2004, May 21). Failing the NCLB challenge: How public policies handicap high-poverty
schools [Power-point presentation]. East Lansing, MI: Education Policy Center, Michigan State University. Retrieved March 2, 2005, from http://www.epc.msu.edu/events/files/MPLP.ppt
56 Pierce, J. (2003). Minimum size of subgroups for adequate yearly progress (AYP). State Notes: No Child Left Behind. Denver, CO: Education Commission of the States. Retrieved March 27, 2005, from http://www.ecs.org/clearinghouse/49/76/4976.htm
57 State of Minnesota, Office of the Legislative Auditor, Evaluation Division. (2004, March). Evaluation report: No Child Left Behind program Evaluation (Report No. 04-04). St. Paul, MN: Author.
58 Olson, L. (2004, September 8). Data show schools making progress on federal goals. Education Week, 24(2), 24-28.
59 Coleman, T (2005, February 25). Bill asks more U.S. flexibility on testing. St Paul Pioneer Press. Retrieved February 25, 2005, from www.twincities.com/mld/twincities/news/politics
60 Young, S. (2005, April 28). No Child Left Behind quick facts: 2005 legislative activity. Washington, DC: National Conference of State Legislatures.
61 Pierce, J. (2003). Minimum size of subgroups for adequate yearly progress (AYP). State Notes: No Child Left Behind. Denver, CO: Education Commission of the States. Retrieved March 27, 2005, from http://www.ecs.org/clearinghouse/49/76/4976.htm
62 Ziebarth, T. (2004, December). State Policies for School Restructuring. State Notes: Accountability. Denver, CO: Education Commission of the States. Retrieved May 2, 2005, from http://www.ecs.org/clearinghouse/57/02/5702.doc
63 Olson, L. (2004, September 8). Data show schools making progress on federal goals. Education Week, 24(2), 24-28.
Page 64 of 65 This document is available on the Great Lakes Center website at: http://www.greatlakescenter.org
64 Driscoll, W. & Fleeter, H. (2003, December 12). Projected costs of implementing the federal No Child
Left Behind Act in Ohio: A detailed financial analysis prepared for the Ohio Department of Education Pursuant to House Bill 3. Columbus, OH: Levin, Driscoll, and Fleeter. Retrieved June 8, 2004, from http://www.ohea.org/documents/Bulletin%20Driscoll%20and%20Fleeter%20Report.pdf
65 Sweetland, S.R. (2005, March 18). Ohio’s ‘new’ law of the land and the ‘cresting’ fiscal environment for public school districts. Paper presented at the American Education Finance Association’s Annual Meeting, Louisville, KY.
66 Bohner, J. (2004, February 12). New national analysis shows states profiting financially from No Child Left Behind Act [Press release]. Committee on Education and the Workforce, U.S. House of Representatives. Retrieved July 25, 2004, from http://edworkforce.house.gov/press/press108/second/02feb/nclb021204.htm
67 Pierce, J. (2003). Minimum size of subgroups for adequate yearly progress (AYP). State Notes: No Child Left Behind. Denver, CO: Education Commission of the States. Retrieved March 27, 2005, from http://www.ecs.org/clearinghouse/49/76/4976.htm
68 Olson, L. (2004, September 8). Data show schools making progress on federal goals. Education Week, 24(2), 24-28.
69 Reschovsky, A. & Imazeki, J. (2000, October). Achieving educational adequacy through school finance reform (CPRE Research report RR-045). Madison, WI: Consortium for Policy Research in Education, University of Wisconsin-Madison.
70 Norman, J. (2002). Funding our future: An adequacy model for Wisconsin school finance. Milwaukee, WI: Institute for Wisconsin’s Future.
71 Lautenchlager, P.A. (2004, May 12). Letter from the Attorney General to Senator Risser regarding Wisconsin’s obligation to implement without full funding the 2002 revisions to the elementary and secondary education act.
72 Pierce, J. (2003). Minimum size of subgroups for adequate yearly progress (AYP). State Notes: No Child Left Behind. Denver, CO: Education Commission of the States. Retrieved March 27, 2005, from http://www.ecs.org/clearinghouse/49/76/4976.htm
73 Cronin, J., Kingsbury, G.G., McCall, M.S., & Bowe, B. (2005, April). The impact of the No Child Left Behind Act on student achievement and growth: 2005 edition. Lake Oswego, OR: Northwest Evaluation Association. Retrieved May 1, 2005, from www.nwea.org/research/nclbstudy.asp
74 Center on Education Policy. (2005, March 23). School officials say student achievement is improving, but that they lack the capacity to reach all students in need of support under No Child Left Behind [Press release]. Retrieved May 21, 2005, from http://www.ctredpol.org/pubs/nclby3/press/nclb3press.pdf
75 Center on Education Policy (2005). From the Capital to the Classroom: Year 3 of the No Child Left Behind Act, pp. 70-74. Washington, DC: Author. Retrieved March 25, 2003, from http://www.cep-dc.org/pubs/nclby3/
76 Olson, L. (2004, September 8). Data show schools making progress on federal goals. Education Week, 24(2), 24-28.
77 Popham, W.J. (2004). America’s Failing Schools. Routledge/Taylor & Francis, New York.
See also:
Mathis, W.J. (2005, April 20). Statement at NEA press conference, Washington, DC. Available online at: http://www.rnesu.k12.vt.us/superpub/bill_papers/nclb/NCLB-FilingStatement4.20.05.pdf
Page 65 of 65 This document is available on the Great Lakes Center website at: http://www.greatlakescenter.org
78 Samuels, C.A. & Davis, M.R. (2005, March 23). Spellings hints at more flexibility on NCLB. Education
Week. Retrieved May 22, 2005, from http://www.edweek.org/ew/articles/2005/03/23/28nclb.h24.html?querystring=NCLB
79 Banchero, S. (2005, May 16). Educators ask U.S. for break on No Child Left Behind. Chicago Tribune. Retrieved May 27, 2005, from http://www.chicagotribune.com/news/nationworld/chi-0505160168may16
80 Linn, R.L. (2004, July 28). Rethinking the No Child Left Behind accountability system. Paper prepared for a forum on No Child Left Behind sponsored by the Center on Education Policy, Washington, DC.
81 Fineout, G. (2005, May 17). Eased schools standards OK'd. Miami Herald. Retrieved May 23, 2005, from http://www.miami.com/mldmiamiherald/11663913.htm 82 Spellings on Bright Line and CT denial 83 New Jersey Supreme Court orders mediation in ongoing Abbott proceedings. (2004, November 15).
ACCESS, Campaign for Fiscal Equity. Retrieved May 15, 2005, from www.schoolfunding.info/news/litigation/11-15-04njspecialmaster.php3.
See also:
Litigation Update: Kansas, Arkansas, Nebraska, New York, North Carolina, South Carolina, and Maryland. (2005, April 21). ACCESS, Campaign for Fiscal Equity. Retrieved May 15, 2005, from www.schoolfunding.infor/news/litigation/4-21-05litigationupdate.php3
84 Mathis, W. (2005, April). Bridging the achievement gap: A bridge too far? Phi Delta Kappan, 86(8), pp. 590-593.