2013 adequate yearly progress report - cde.ca.gov · pdf file2012–13 accountability...
TRANSCRIPT

2012–13 Accountability Progress Reporting System
2013 Adequate Yearly Progress
Report
Information Guide
August 2013
Prepared by the California Department of Education
Available online at: http://www.cde.ca.gov/ta/ac/ay/

2 0 1 3 A D E Q U A T E Y E A R L Y P R O G R E S S R E P O R T I N F O R M A T I O N G U I D E
Table of Contents Preface ................................................................................................................................. 1 Key Changes to the 2013 AYP and 2013–14 PI Reports ..................................................2 Adequate Yearly Progress
What is AYP? .......................................................................................................................5 ESEA ............................................................................................................................... 5
Title I........................................................................................................................... 5
Title III ......................................................................................................................... 5 California’s Definition of AYP ...........................................................................................6 Sources of Data Used in AYP Calculations .....................................................................6
Assessment Results Used in 2013 AYP Calculations ................................................7
Considerations Regarding Assessment Results ..............................................................7
Variations, Accommodations, and Modifications ........................................................8
CAPA in AYP ..............................................................................................................8
CMA in AYP................................................................................................................9 What is Included in AYP Reports? ...................................................................................10
County and LEA Lists of Schools ...................................................................................10
School and LEA Reports ...............................................................................................10
Statewide Data Files ......................................................................................................11 Accountability Reporting Timeline ..................................................................................12
Who Receives an AYP Report?........................................................................................13 Schools and LEAs ..........................................................................................................13 Charter Schools .............................................................................................................13
Student Groups .................................................................................................................14 Definitions of Student Groups Used in AYP ...................................................................15 Reclassified Fluent English Proficient ............................................................................15 ELs First Enrolled in U.S. Schools .................................................................................15 Students with Disabilities ...............................................................................................16 Race and Ethnicity Categories .......................................................................................16
California Department of Education August 2013 i

2 0 1 3 A D E Q U A T E Y E A R L Y P R O G R E S S R E P O R T I N F O R M A T I O N G U I D E
Table of Contents (continued)
Adequate Yearly Progress (continued)
AYP Criteria .......................................................................................................................18
2013 AYP Criteria Flowchart ..........................................................................................19
AYP Targets, 2002–2014 ...............................................................................................20
School Type for AYP Purposes......................................................................................23
How School Type is Determined ..............................................................................23
AYP Criteria Summary ...................................................................................................25
2013 AYP Targets, Standard Criteria .......................................................................25
2013 AYP Targets, Small School/LEA/Student Group Criteria .................................26
AYP Criteria Details .......................................................................................................27
Requirement 1: Participation Rate ............................................................................27 Standard Criteria .................................................................................................27 Small School/LEA/Student Group Criteria ...........................................................27 Exclusions ...........................................................................................................27 Student Groups ...................................................................................................27 Alternative Methods ............................................................................................28
Requirement 2: Percent Proficient—AMOs...............................................................28 Standard Criteria .................................................................................................29 Small School/LEA/Student Group Criteria ...........................................................29 Confidence Interval Adjusted AMO Table for 2013 .............................................31 Exclusions ...........................................................................................................32 Student Groups ...................................................................................................32 Alternative Methods ............................................................................................32
Requirement 3: API as an Additional Indicator .........................................................33 Standard AYP Criteria for API .............................................................................33
Requirement 4: Graduation Rate as an Additional Indicator .....................................34 Standard Graduation Rate Criteria ......................................................................34 Fixed Growth Target Rate ...................................................................................34 Variable Growth Target Rate ...............................................................................35
California Department of Education August 2013 ii

2 0 1 3 A D E Q U A T E Y E A R L Y P R O G R E S S R E P O R T I N F O R M A T I O N G U I D E
Table of Contents (continued) Adequate Yearly Progress (continued)
Calculating the Four-Year Cohort AYP Graduation Rate ....................................35 Four-Year Cohort Graduation Rate Formula for ESEA .......................................36 Three Options for Meeting 2013 AYP Graduation Rate Criteria ..........................36 Alternative Method for Meeting Graduation Rate Criteria ....................................38 Graduation Rate Rules ........................................................................................39
Safe Harbor ................................................................................................................... 40 Example of Safe Harbor for an Elementary School ..................................................42
Alternative Methods and Special Conditions ..................................................................43 Alternative Method Descriptions ...............................................................................43 Alternative Method Codes ........................................................................................45 Special Condition Descriptions .................................................................................45 Special Condition Codes ..........................................................................................46
AYP Appeals Process ....................................................................................................46 Criteria for Appeals of the AYP Determination..........................................................47
Percent Proficient Caps for LEAs ....................................................................................48
CAPA 1.0 Percent Cap ..................................................................................................48 Automatic Exception for COEs and Small LEAs .......................................................48 How the Percent Proficient Rate is Calculated .........................................................48
CMA 2.0 Percent Cap ....................................................................................................49 Automatic Exemption for Small LEAs .......................................................................49 How the Percent Proficient Rate is Calculated .........................................................50
Flexibility in the 1.0 and 2.0 Percent Caps .....................................................................50
How to Calculate the CMA Cap .....................................................................................50 Five Examples of Applying 1.0, 2.0, and 3.0 Percent Caps ......................................51
Reassignment of Scores Exceeding the Caps ...............................................................52 Reassignment of Scores Exceeding 1.0 or 2.0 Percent Caps ..................................52 Example of Reassignment ........................................................................................53
Inclusion/Exclusion and Adjustment Rules ....................................................................56
Tools for Using the Flowchart ........................................................................................57
California Department of Education August 2013 iii
2 0 1 3 A D E Q U A T E Y E A R L Y P R O G R E S S R E P O R T I N F O R M A T I O N G U I D E
Table of Contents (continued)
Adequate Yearly Progress (continued)
Inclusion/Exclusion and Adjustment Rules Flowchart ....................................................58
Testing Codes Considered in AYP Calculations ............................................................64
CAHSEE Matching Rules ..............................................................................................66
Program Improvement
School Accountability .......................................................................................................67
Identification of Schools for PI .......................................................................................67
PI Identification Criteria for Title I Schools ................................................................67
Four Examples of PI Identification of Title I Schools .................................................68
Schools Already in PI .....................................................................................................69 Advancing in PI.........................................................................................................69 Maintaining PI Status ................................................................................................69 Exiting PI ..................................................................................................................69
LEA Accountability ...........................................................................................................70
Identification of LEAs for PI ............................................................................................70
PI Identification Criteria for Title I LEAs ....................................................................70
LEA PI Identification Alternative Methods .................................................................70
Four Examples of PI Identification of Title I LEAs .....................................................71
LEAs Already in PI .........................................................................................................73 Advancing in PI.........................................................................................................73 Maintaining PI Status ................................................................................................74 Exiting PI ..................................................................................................................74
School and LEA Accountability .......................................................................................75
Breaks in Title I Funding ................................................................................................75
Changes to PI Status .....................................................................................................75
CDE Contacts and Related Internet Pages .....................................................................76
Acronyms...........................................................................................................................78
California Department of Education August 2013 iv

2 0 1 3 A D E Q U A T E Y E A R L Y P R O G R E S S R E P O R T I N F O R M A T I O N G U I D E
Preface This information guide provides technical information about Adequate Yearly Progress (AYP) and Program Improvement (PI) reports. The guide is intended for accountability coordinators at local educational agencies (LEAs) to use in administering their academic accountability programs to meet the requirements of the Elementary and Secondary Education Act (ESEA).
The California Department of Education (CDE) provides AYP and PI reports as part of its Accountability Progress Reporting (APR) system. The APR system provides an integrated approach to reporting results for state and federal accountability requirements and includes information about the state, LEAs, schools (including charter schools), and numerically significant student groups:
2012–13 APR System
State AccountabilityRequirements
(Public Schools Accountability Act of 1999)
Federal AccountabilityRequirements
(Elementary and Secondary Education Act)
2012 Base Academic PerformanceIndex (API) Reports(release June 2013)
2013 Growth API Reports(release August 2013)
2013 AYP Reports(release August 2013)
2013–14 PI Reports(release August 2013)
This guide is not intended to serve as a substitute for state and federal laws or regulations or to detail all of an accountability coordinator’s responsibilities in applying accountability requirements to an LEA or school. The guide should be used in conjunction with academic accountability information provided through the CDE AYP Web page at http://www.cde.ca.gov/ayp/ and from e-mail and correspondence disseminated by the CDE to accountability coordinators. For information about being added to the CDE accountability coordinators listing, please visit the Accountability Listserv Web page at http://www.accountabilityinfo.org/ or contact the Academic Accountability Unit (AAU) at 916-319-0863 or by e-mail at [email protected]. This guide is produced by the CDE’s AAU and Evaluation, Research, and Analysis Unit (ERAU) in the Analysis, Measurement, and Accountability Reporting Division (AMARD). Questions about API or AYP calculations, or AYP appeals, should be addressed to the AAU at the phone number or e-mail address listed above. Questions about school and LEA ESEA accountability data, PI determinations, and PI reports should be addressed to the ERAU by phone at 916-322-3245 or by e-mail at [email protected].
Material in this publication is not copyrighted and may be reproduced.
California Department of Education August 2013 1

2 0 1 3 A D E Q U A T E Y E A R L Y P R O G R E S S R E P O R T I N F O R M A T I O N G U I D E
Key Changes to the 2013 AYP and 2013–14 PI Reports
AYP Targets Increase for 2013
The AYP targets for schools and LEAs increased in 2013 (changes in bold).
The required percentage of students proficient or above for elementaryschools, middle schools, and elementary school districts in English-languagearts (ELA) is 89.2, in mathematics 89.5.
The required percentage of students proficient or above for high schools andfor high school districts that have students in any of grades nine throughtwelve in ELA is 88.9, in mathematics 88.7.
The required percentage of students proficient or above for unified schooldistricts, for high school districts, and for county offices of education (COEs)that have students in any of grades two through eight and nine through twelvein ELA is 89.0, in mathematics 89.1.
To meet the API requirement for AYP purposes, an LEA or school mustdemonstrate a growth of at least 1 point or a minimum API score of at least770.
The AYP targets for percent proficient or above and the API will continue to increase annually until 2014. The AYP targets for graduation rate increase until 2019 if the school or LEA has a graduation rate below 90 percent.
Accountability Workbook
The importance of stronger accountability was emphasized by the federalrequirement for states to complete an Accountability Workbook as the firstcomponent of its Consolidated State Application. California’s workbook describes itsplan for complying with the assessment and accountability requirements of ESEA.The development and continued maintenance of the workbook is based upon aseries of action items adopted by the State Board of Education (SBE) and approvedby the U.S. Department of Education (ED). Each year since 2003, the SBE hasapproved and submitted a package of workbook amendments to the ED. Following aperiod of negotiation, the ED has approved an amended Accountability Workbook forCalifornia each year.
In January 2012, the SBE adopted new regulations that established a definition ofcontinuous enrollment for the API. In order to maintain alignment between the stateand federal accountability systems, the Accountability Workbook was revised in
California Department of Education August 2013 2

2 0 1 3 A D E Q U A T E Y E A R L Y P R O G R E S S R E P O R T I N F O R M A T I O N G U I D E
2012 to incorporate the definition of continuous enrollment contained in the California Code of Regulations (CCR), Title 5, Section 1039.2:
A student is “continuously enrolled” if the student was enrolled from FallCensus Day (First Wednesday in October) to the first of day of testing withouta gap in enrollment of more than 30 consecutive calendar days.
In 2013, the Accountability Workbook was revised to establish a baseline extended-year cohort graduation rate (i.e., five-year cohort graduation rate) as an alternative method to meeting the graduation rate requirement in 2013 AYP determinations. This alternative method will only be applied for LEAs, schools, or student groups that did not make the state goal or the annual growth target for the four-year cohort graduation rate. Meeting the state goal or the annual target for either the four-year or five-year graduation rate would qualify the LEA, school, or student group to meet the graduation rate criteria for AYP.
Changes to the Graduation Rate
For the 2013 AYP, the four-year cohort graduation rate will be used. The school orLEA and all numerically significant student groups at the school or LEA will berequired to meet the graduation criteria for an LEA or school to make AYP in 2013.
The fixed four-year rate growth schedule, effective for 2013 AYP determinations, isbased on the difference between the school’s or LEA’s 2009–10 four-year cohortgraduation rate and the 90 percent goal divided by the number of years remainingbefore the 2019 AYP (i.e., eight years). The difference was used to establish eightequal graduation rate targets which will remain in place until 2019.
In addition to producing the four-year cohort graduation rate for the 2013 AYPdeterminations, the CDE is also producing a five-year cohort graduation rate. The2010–11 five-year cohort graduation rate will become the new baseline fordetermining five-year graduation rate growth targets for AYP and for establishing anew five-year fixed growth graduation rate schedule. Beginning with 2013 AYPdeterminations, the five-year cohort graduation rate will be used as an alternativemethod for meeting the AYP graduation rate criteria under specific circumstances.
Exclusion of the Writing Portion of the CST in ELA
Beginning in 2013, the writing portion of the English-language arts (ELA) tests forgrades four and seven will be reported separately from the ELA scale scores for theCalifornia Standards Test (CST) and California Modified Assessment (CMA). This isto allow for faster turn-around of student performance data on the CSTs and CMAwhich is a priority of the State Superintendent of Public Instruction (SSPI) as well asthe SBE. As a result, the writing portion will not be included in the calculation of theAYP.
California Department of Education August 2013 3

2 0 1 3 A D E Q U A T E Y E A R L Y P R O G R E S S R E P O R T I N F O R M A T I O N G U I D E
California Department of Education August 2013 4
Updates to Processing Continuous EnrollmentStarting with the 2011–12 accountability reporting cycle, the CDE began usingenrollment and exit data from the California Longitudinal Pupil Achievement DataSystem Operational Data Store (CALPADS ODS) to determine which students werecontinuously enrolled. In instances where the statewide student identifier (SSID) onthe Standardized Testing and Reporting (STAR) Program or California High SchoolExit Examination (CAHSEE) student answer document were missing or did notmatch a student record in CALPADS ODS, continuous enrollment information fromthe STAR or CAHSEE student answer document (California Basic Educational DataSystem [CBEDS] field) was used.
Starting with the 2013 assessments, the STAR and CAHSEE student answerdocument no longer contains the CBEDS field. Thus, for the 2012–13 accountabilityreporting cycle, continuous enrollment will be determined solely from CALPADSODS data. Students will be considered as continuously enrolled if:
• Data retrieved from the CALPADS ODS reflected enrollment from FallCensus Day (first Wednesday in October) to the first day of testing without agap in enrollment of more than 30 consecutive calendar days, or
• SSIDs on the STAR or CAHSEE student answer documents are missing, or
• SSIDs on the STAR or CAHSEE student answer documents do not matchagainst the SSIDs in CALPADS
Use of CALPADS for Demographic Data
Starting with the 2012–13 reporting cycle, all demographic data (e.g., race/ethnicity,students with disabilities (SWD) status, English learner (EL) status, eligible for theNational School Lunch Program (NSLP), parent education level, etc.) will be takenfrom the CALPADS ODS. In prior years, these data were obtained from the STARstudent answer document.
For the production of the 2013 AYP, if the SSID on the STAR or CAHSEE studentanswer document was missing or did not match a student record in CALPADS ODS,those students’ race/ethnicity will be reported as “Two or More Races.” In addition,these students will not be included in any of the special programs (i.e., SWD, EL, orsocioeconomically disadvantaged [SED]).

2 0 1 3 A D E Q U A T E Y E A R L Y P R O G R E S S R E P O R T I N F O R M A T I O N G U I D E
What is AYP? AYP is a series of annual academic performance goals established for each school, LEA, and the state as a whole. Schools, LEAs, and the state are determined to have met AYP if they meet or exceed each year’s goals (AYP targets and criteria).
ESEA
AYP is required under Title I of the federal ESEA. States commit to the goals of ESEA by participating in Title I, a program under ESEA that provides funding to help educate low-income children. The primary goal of Title I is for all students to be proficient in ELA and mathematics, as determined by state assessments, by 2014.
Title ISchools, LEAs, and the state must meet all AYP criteria in order to meet federalESEA accountability requirements. Currently, the consequences of not meetingAYP criteria apply only to those schools and LEAs that receive federal Title Ifunds. Schools and LEAs that receive Title I funds face ESEA PI requirements ifthey do not meet AYP criteria.
PI is a formal designation for Title I-funded schools and LEAs. A Title I school orLEA is identified for PI if it does not meet AYP criteria for two consecutive years inthe same subject area or for two consecutive years on the same indicator. If aschool or an LEA is designated PI, it must provide certain types of requiredservices and/or interventions during each year it is identified as PI. A school or anLEA is eligible to exit PI if it makes AYP for two consecutive years.
The ESEA contains four education reform principles: (1) stronger accountabilityfor results, (2) increased flexibility and local control, (3) expanded options forparents or guardians, and (4) an emphasis on scientifically-based effectiveteaching methods. This information guide describes California’s implementationof the first principle under Title I of the ESEA. More information about ESEA islocated on the ED Web site at http://www.ed.gov/esea.
Title IIITitle III of the ESEA provides supplemental funding to LEAs and consortia toimplement programs designed to help ELs and immigrant students attain Englishproficiency and meet the state’s academic and content standards. Title IIIrequires that each state:
Establish English language proficiency standards
Conduct an annual assessment of English language proficiency
California Department of Education August 2013 5

2 0 1 3 A D E Q U A T E Y E A R L Y P R O G R E S S R E P O R T I N F O R M A T I O N G U I D E
Define two annual measurable achievement objectives (AMAOs) forincreasing the percentage of EL students’ developing and attainingEnglish proficiency
Include a third AMAO relating to meeting AYP for the EL student group atthe LEA or consortium level
Hold LEAs and consortia accountable for meeting the three AMAOs (ESEASection 3122)
Specific information about Title III accountability is located in the 2012–13 Title III Accountability Report Information Guide on the CDE Title III Accountability Web page at http://www.cde.ca.gov/ta/ac/t3/.
California’s Definition of AYP
Under California’s criteria for ESEA, schools and LEAs are required to meet or exceed requirements within each of the following four areas in order to make AYP annually:
Requirement 1: Participation Rate Requirement 2: Percent Proficient—Annual Measurable Objectives (AMOs) Requirement 3: API as an Additional Indicator Requirement 4: Graduation Rate
If a school or an LEA misses one or more requirements, it does not make AYP and may be identified for PI. The “AYP Criteria” section describes the specifics for each of the four requirements.
Sources of Data Used in AYP Calculations
The information that forms the basis for AYP participation rate and percent proficient calculations (Requirements 1 and 2) comes from assessment results of the STAR Program and the CAHSEE. More information about these testing programs is located on the CDE Testing and Accountability Web page at http://www.cde.ca.gov/ta/. ESEA mandates that all students tested on statewide assessments in ELA and mathematics perform at the proficient level or above on these assessments by 2014. The following chart shows the assessment results that were used in 2013 AYP calculations.
California Department of Education August 2013 6

2 0 1 3 A D E Q U A T E Y E A R L Y P R O G R E S S R E P O R T I N F O R M A T I O N G U I D E
Assessment Results Used in 2013 AYP Calculations
Standardized Testing and Reporting (STAR) Program
California Standards Tests (CSTs)
• California English-Language Arts Standards Test (CST in ELA)Grades two through eight, (writing assessment results in grades four and seven are not included)
• California Mathematics Standards Test (CST in mathematics)Grades two through seven and the following course-specific tests for grade eight:
- General mathematics - Algebra I - Geometry - Algebra II - Integrated mathematics 1, 2, or 3
Students in grade seven may take the Algebra I test if they completed an Algebra I course.
California Alternate Performance Assessment (CAPA)
• English-language arts and mathematicsGrades two through eight and ten
California Modified Assessment (CMA)
• English-language artsGrades three through eight
• MathematicsGrades three through seven
• Algebra I (end-of-course, available in grades seven and eight)
California High School Exit Examination (CAHSEE) CAHSEE (administered in February and March and May for make-ups)
• English-language arts, including a writing component, and mathematicsGrade ten
Requirement 3 uses the API as an additional indicator of AYP. For Requirement 3, the 2012 Base and 2013 Growth API results are used to determine if a school, an LEA, or the state made AYP for 2013. The API is the cornerstone of the state’s academic accountability requirements. It measures the performance and growth of schools based upon results of statewide tests at grades two through twelve. More information about the API and the assessments included in the API is located on the CDE API Web page at http://www.cde.ca.gov/ta/ac/ap/.
For Requirement 4, the number of high school graduates and four years of dropout data are used to calculate the graduation rate for a school, an LEA, and the state. Data used to calculate the graduation rate come from student-level data maintained in the CALPADS.
Considerations Regarding Assessment Results
Special considerations or adjustments are made in AYP calculations for statewide
California Department of Education August 2013 7

2 0 1 3 A D E Q U A T E Y E A R L Y P R O G R E S S R E P O R T I N F O R M A T I O N G U I D E
assessment results of students who take the tests using varied test administrations or who take the tests based on alternate standards.
Variations, Accommodations, and Modifications
Students who take exams in the STAR Program and CAHSEE may be provided certain test variations, accommodations, and/or modifications. Test administration variations and accommodations do not result in changes to AYP calculations. Modifications, however, do result in changes. Scores for students tested with modifications are counted as not participating in statewide testing (which impacts the participation rate indicator), with one exception. If the student used a calculator on the mathematics portion of the CAHSEE, the student’s results are counted as tested and are considered in percent proficient determinations. Changes due to modifications are made to accountability reporting only and do not affect the individual student's score report. The student receives an individual score report with his or her actual score.
Students Who Use Calculators on CAHSEE MathematicsSWDs who used calculators on the mathematics portion of the CAHSEE in accordance with their Individualized Education Programs (IEPs) or Section 504 Plans are counted as participants. The students’ scores will be counted as proficient if the scale score was 388 or above for the February administration, or 387 or above for the March administration, or 385 or above for the May administration.
CAPA in AYP
In response to federal requirements of the Individuals with Disabilities Education Act (IDEA), Amendments of 1997, and the ESEA, California developed the CAPA, an alternate assessment for students with significant cognitive disabilities who cannot participate in the general STAR Program assessments, even with accommodations or modifications. A student’s IEP or Section 504 Plan specifies whether the student should take the CAPA. Students taking the CAPA work toward achieving selected state academic standards using alternate achievement standards to measure their progress.
The alternate assessment population is made up of a relatively small number of students with significant cognitive disabilities. In California, less than one percent of the total number of students statewide take the CAPA. Since examiners may adapt the CAPA based on students' instruction mode, accommodations and
California Department of Education August 2013 8

2 0 1 3 A D E Q U A T E Y E A R L Y P R O G R E S S R E P O R T I N F O R M A T I O N G U I D E
modifications do not apply to the CAPA.
For AYP reporting, the CAPA performance level the student receives (advanced, proficient, basic, below basic, or far below basic) is the level that is included in the AYP calculations. The CAPA is not treated as a separate test for accountability, because the CAPA is an “alternate” to the CSTs. The same basic calculation rules used for the CST also apply to the CAPA in AYP calculations.
CMA in AYP
In April 2007, the ED enacted regulations to require an alternate assessment based on modified achievement standards. The CDE, in response to the federal regulations, developed the CMA, an alternate assessment of California’s content standards based on modified achievement standards for students with IEPs or Section 504 Plans who meet the SBE-adopted eligibility criteria. The purpose of the CMA is to allow students to demonstrate achievement of the content standards in ELA, mathematics, and science.
The CMA was first administered statewide in 2008 to SWDs for ELA and mathematics (grades three through five) and for science (grade five). These assessments in ELA and mathematics were incorporated into the 2008 AYP. In the spring of 2009, the CMA was expanded to include ELA (grades six through eight), mathematics (grades six and seven), and science (grade eight). These assessments in ELA and mathematics were incorporated into the 2009 AYP. In the spring of 2010, the CMA was expanded to include ELA (grade nine), Algebra I (end-of-course, available for grades seven through eleven), and science (grade ten). The CMA for Algebra I (end-of-course, available for grades seven and eight) was incorporated into the 2010 AYP. CMA results from grades three through eight in ELA and mathematics (but not science) are used in AYP calculations.
As with the CAPA results in AYP reporting, the performance level the student received on the CMA (advanced, proficient, basic, below basic, or far below basic) is the level that is included in the AYP calculations. The same calculation rules used for the CST also apply to the CMA.
California Department of Education August 2013 9

2 0 1 3 A D E Q U A T E Y E A R L Y P R O G R E S S R E P O R T I N F O R M A T I O N G U I D E
What is Included in AYP Reports? The AYP reports provide federal accountability information about schools, LEAs, and the state. These reports are accessed on the CDE AYP Web page at http://www.cde.ca.gov/ta/ac/ay/. This section describes the type of information included in AYP reports.
County and LEA Lists of Schools
The County List of Schools and LEA List of Schools summarize selected AYP information for each school and LEA. The reports have the same basic structure as the prior year reports. Both the County and LEA List of Schools contain the following information about each school or LEA:
Whether AYP criteria were met for:
All components
ELA Participation Rate and AMO
Mathematics Participation Rate and AMO
API indicator
Graduation Rate indicator
PI Status of the school or LEA
School and LEA Reports
The school and LEA reports have the same basic structure as the prior year reports. The brown navigation bar in the middle of the page allows users to easily move between results for the state API, federal AYP, and federal PI requirements. The selection links at the top right side of the page allows users to navigate various reports.
The Summary report is located on the far left of the brown navigation bar(middle of the page). It contains the key state and federal overall results that arealso provided in the List of Schools reports. For AYP, information on bothparticipation rate and percent proficient is provided for each content area.
The AYP section on the brown navigation bar contains the remaining AYPreports. Once the user clicks on the AYP section, the selection links at the topright side of the page shows the links to the remaining reports.
The 2012–13 AYP Five-Year Cohort Graduation Rates and Targets report can beaccessed by clicking on the link at the top right of the AYP reports (for schoolsthat graduate grade twelve students). This report contains the baseline 2010–11five-year cohort graduation rate and the targets required to meet the graduation
California Department of Education August 2013 10
2 0 1 3 A D E Q U A T E Y E A R L Y P R O G R E S S R E P O R T I N F O R M A T I O N G U I D E
rate criteria for 2013 AYP determinations for LEAs, schools, and numerically significant student groups.
Statewide Data Files
The data files of statewide AYP and PI results are provided in both DBF and ASCII text formats and are downloadable from the CDE AYP Data Files Web page at http://www.cde.ca.gov/ta/ac/ay/aypdatafiles.asp. Record layout, data definitions, and download instructions are also provided on this Web page.
California Department of Education August 2013 11

2 0 1 3 A D E Q U A T E Y E A R L Y P R O G R E S S R E P O R T I N F O R M A T I O N G U I D E
Accountability Reporting Timeline August 2013 The 2013 Growth API, 2013 AYP, and 2013–14 PI reports are released in
August 2013 on the CDE APR Web page at http://www.cde.ca.gov/ta/ac/ar/.
The Title III Accountability Report is released on the CDE Title III Accountability Web page at http://www.cde.ca.gov/ta/ac/t3/.
The appeals deadline for the August 2013 AYP results is September 13.
September/ October 2013
Data review process for LEAs to examine and make corrections to demographic data in the CALPADS ODS. Demographic data corrections can be made through the end of business on October 31, 2013. The CDE will extract demographic data, enrollment and exit data, and special program data (e.g., EL, SWD, and socioeconomically disadvantaged students) from the CALPADS ODS on November 1, 2013. Additionally, corrections to other data, such as accommodations, modifications, or fields specific to the testing administration process will need to be made through Educational Testing Service (ETS). (To view when data will be extracted from the CALPADS ODS for accountability purposes, as well as CALPADS Snapshot collection windows and certification deadlines, please go the CDE CALPADS Calendar Web page at http://www.cde.ca.gov/ds/sp/cl/rptcalendar.asp.)
October 2013 Updated 2013 Growth API, 2013 AYP, and 2013 PI reports are released. These updated reports will incorporate AYP appeal decisions.
January 2014 Updated 2013 Growth API, 2013 AYP, and 2013–14 PI reports are released on the CDE APR Web page. These reports will reflect final data corrections made through CALPADS ODS.
May 2014 The 2013–14 Academic Performance Index Reports Information Guide is posted on the CDE API Web page at http://www.cde.ca.gov/ta/ac/ap/.
The 2013 Base API reports are released on the CDE APR Web page at http://www.cde.ca.gov/ta/ac/ar/. These reports will include the 2013 Base API, growth targets, student group data, demographic data, statewide ranks, and similar schools ranks.
For more information about API and AYP reports, trainings, data reviews, AYP appeals, and correction processes, contact the AAU by phone at 916-319-0863 or by e-mail at [email protected].
For more information about PI reports and PI determinations, contact the ERAU by phone at 916-322-3245 or by e-mail at [email protected] (PI determinations and PI reports). For Title III Accountability Reports, contact the ERAU by phone at 916-323-9071 or by e-mail at [email protected].
California Department of Education August 2013 12

2 0 1 3 A D E Q U A T E Y E A R L Y P R O G R E S S R E P O R T I N F O R M A T I O N G U I D E
Who Receives an AYP Report? Schools and LEAs
All schools, LEAs, and the state receive an AYP report. Schools and LEAs that receive federal Title I funds receive a PI status. An LEA, for AYP reporting, is defined as a school district, a COE, or a statewide benefit charter.
A school must have a county-district-school (CDS) code, and an LEA must have a county-district (CD) code at the time of testing to receive a report. Information about CDS code assignments is located on the CDE Schools and Districts Web page at http://www.cde.ca.gov/ds/si/ds/.
Charter Schools
Charter schools that are locally funded (funded through the LEA) and charters that are their own LEA (direct funded charter schools) are subject to the same AYP requirements of the ESEA that apply to all public schools. If the charter school receives Title I funds, the PI accountability provisions under Section 1116 of Title I under ESEA also apply. For accountability purposes, a statewide benefit charter is considered an LEA, and each of its school sites is considered a school.
Although a direct funded charter school is considered to be its own LEA (California Education Code [EC] Section 47636[a][1]), the school is treated as a school for Title I purposes and receives the school report only. In addition, a direct funded charter school is subject to the PI provisions that apply to schools and not LEAs.
A direct funded charter school with no valid test scores for assessments used in AYP calculations is assigned the percent proficient results of its authorizing charter agency. If results of the authorizing agency are absent, results of the county as a whole are used.
AYP results from direct funded charter schools will not be counted in the AYP results of the sponsoring school district or COE. The CAPA 1.0 and CMA 2.0 percent caps apply to LEAs, including direct funded charter schools.
California Department of Education August 2013 13
2 0 1 3 A D E Q U A T E Y E A R L Y P R O G R E S S R E P O R T I N F O R M A T I O N G U I D E
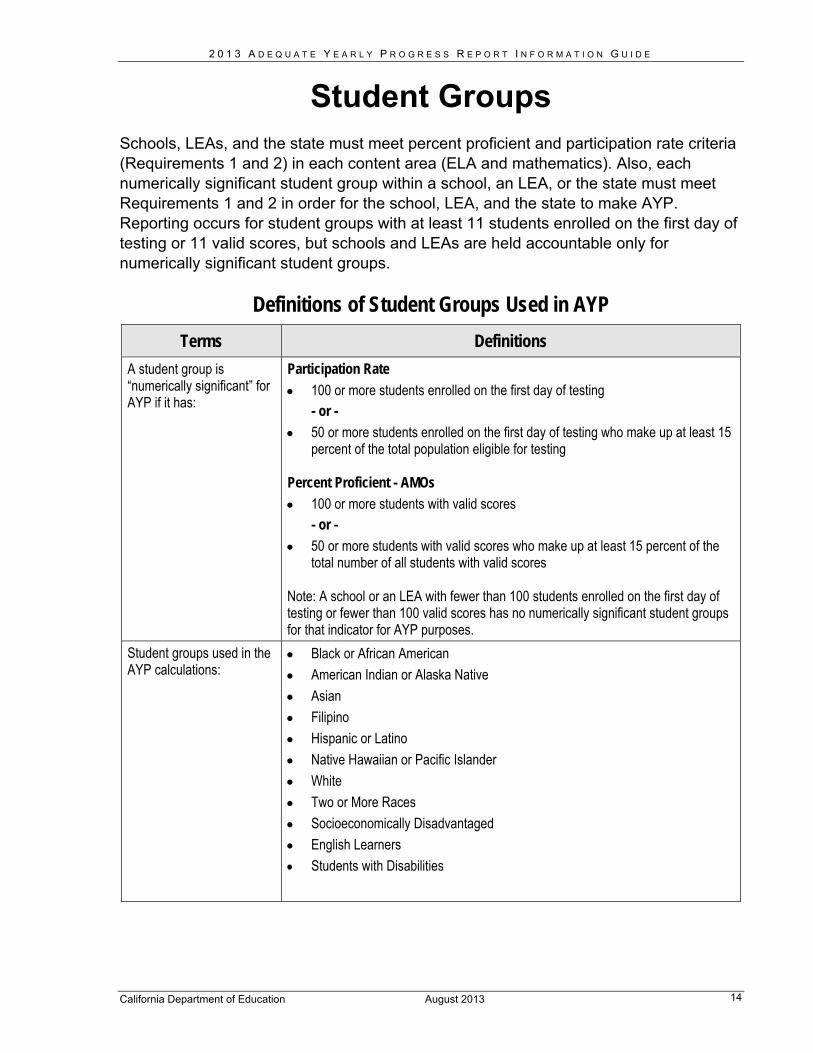
Student Groups Schools, LEAs, and the state must meet percent proficient and participation rate criteria (Requirements 1 and 2) in each content area (ELA and mathematics). Also, each numerically significant student group within a school, an LEA, or the state must meet Requirements 1 and 2 in order for the school, LEA, and the state to make AYP. Reporting occurs for student groups with at least 11 students enrolled on the first day of testing or 11 valid scores, but schools and LEAs are held accountable only for numerically significant student groups.
Definitions of Student Groups Used in AYP
Terms Definitions
A student group is Participation Rate “numerically significant” for AYP if it has:
100 or more students enrolled on the first day of testing- or -
50 or more students enrolled on the first day of testing who make up at least 15percent of the total population eligible for testing
Percent Proficient - AMOs
100 or more students with valid scores- or -
50 or more students with valid scores who make up at least 15 percent of thetotal number of all students with valid scores
Note: A school or an LEA with fewer than 100 students enrolled on the first day of testing or fewer than 100 valid scores has no numerically significant student groups for that indicator for AYP purposes.
Student groups used in the Black or African American AYP calculations: American Indian or Alaska Native
Asian Filipino Hispanic or Latino Native Hawaiian or Pacific Islander White Two or More Races Socioeconomically Disadvantaged English Learners Students with Disabilities
California Department of Education August 2013 14
2 0 1 3 A D E Q U A T E Y E A R L Y P R O G R E S S R E P O R T I N F O R M A T I O N G U I D E
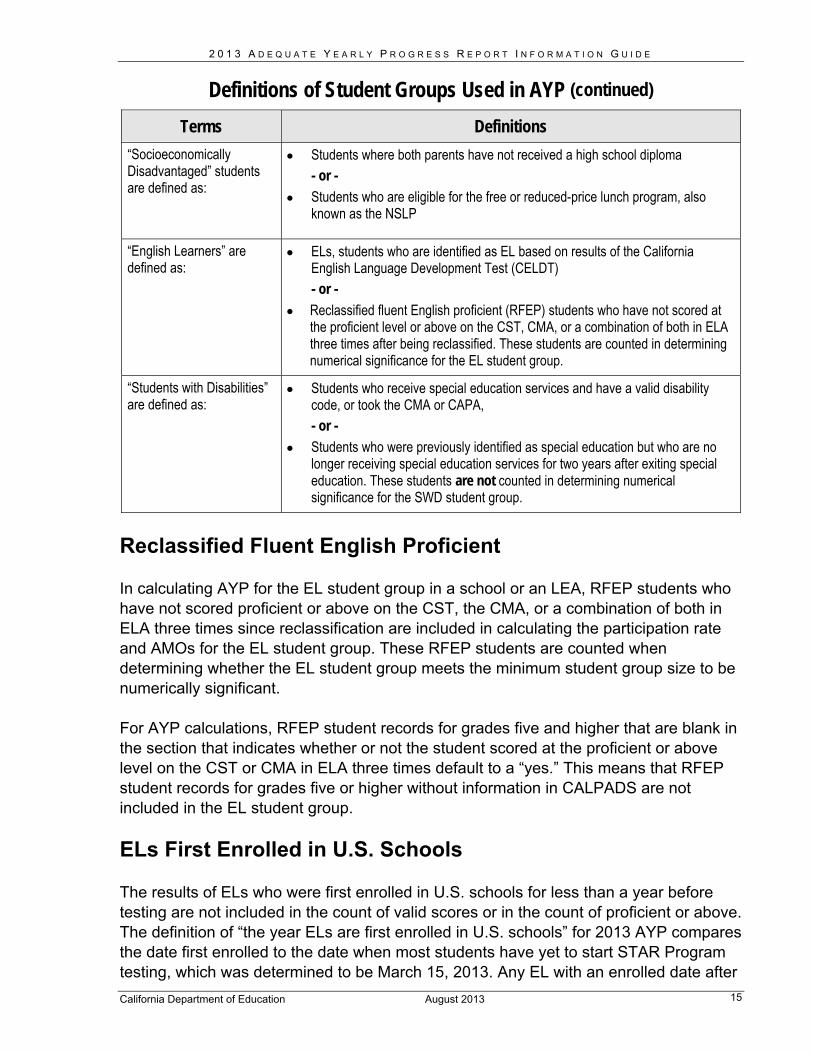
Definitions of Student Groups Used in AYP (continued)
Terms Definitions
“Socioeconomically Disadvantaged” students are defined as:
Students where both parents have not received a high school diploma- or -
Students who are eligible for the free or reduced-price lunch program, alsoknown as the NSLP
“English Learners” are ELs, students who are identified as EL based on results of the Californiadefined as: English Language Development Test (CELDT)
- or -
Reclassified fluent English proficient (RFEP) students who have not scored atthe proficient level or above on the CST, CMA, or a combination of both in ELAthree times after being reclassified. These students are counted in determiningnumerical significance for the EL student group.
“Students with Disabilities” Students who receive special education services and have a valid disability are defined as: code, or took the CMA or CAPA,
- or -
Students who were previously identified as special education but who are nolonger receiving special education services for two years after exiting special education. These students are not counted in determining numerical significance for the SWD student group.
Reclassified Fluent English Proficient
In calculating AYP for the EL student group in a school or an LEA, RFEP students who have not scored proficient or above on the CST, the CMA, or a combination of both in ELA three times since reclassification are included in calculating the participation rate and AMOs for the EL student group. These RFEP students are counted when determining whether the EL student group meets the minimum student group size to be numerically significant.
For AYP calculations, RFEP student records for grades five and higher that are blank in the section that indicates whether or not the student scored at the proficient or above level on the CST or CMA in ELA three times default to a “yes.” This means that RFEP student records for grades five or higher without information in CALPADS are not included in the EL student group.
ELs First Enrolled in U.S. Schools
The results of ELs who were first enrolled in U.S. schools for less than a year before testing are not included in the count of valid scores or in the count of proficient or above. The definition of “the year ELs are first enrolled in U.S. schools” for 2013 AYP compares the date first enrolled to the date when most students have yet to start STAR Program testing, which was determined to be March 15, 2013. Any EL with an enrolled date after California Department of Education August 2013 15
2 0 1 3 A D E Q U A T E Y E A R L Y P R O G R E S S R E P O R T I N F O R M A T I O N G U I D E
California Department of Education August 2013 16
March 15, 2012, is considered as enrolled in a U.S. school less than a year before STAR Program or CAHSEE testing and is not included in the count of valid scores or the count of proficient or above. (These students, however, are included in the AYP participation rate.) Students with Disabilities
All student records reflecting a valid disability code in CALPADS are included in the SWD student group. In addition, the scores of students who were previously identified under Section 602(3) of the IDEA, and received special education services within the last two years are included in the SWD student group. Any student record with a special education exit date after March 15, 2011, is considered to have received special education services within the past two years and is included in the SWD student group. These students, however, are not counted when determining whether the SWD student group meets the minimum group size to be numerically significant. This rule matches the rule used in API calculations. All students that take the CAPA or CMA are considered as receiving special education services, even if the disability code is blank. A student with a disability, with a valid district of residence code on the student answer document, is included in the district of residence accountability results. A student with a disability, who is placed in a private school by an LEA, is included in the assessment and accountability system in the following ways:
• The student is required to participate in the state’s academic assessment system.
• The assessment results are included in the LEA and statewide AYP decisions.
• The student counts towards the LEA’s 1.0 percent CAPA cap and 2.0 percent CMA cap.
Race and Ethnicity Categories Federal guidance requires states to ask respondents a two-part question. The first question addresses ethnicity and asks whether the respondent is Hispanic or Latino. The second question addresses race, which all respondents (including Hispanic or Latino respondents) are required to answer. It requests the respondent to select one or more races from a list of racial categories. Respondents who indicate they are Hispanic or Latino are reported as Hispanic or Latino, regardless of their response to the race question. AYP reports data on eight race and ethnicity categories: Black or African American, American Indian or Alaska Native, Asian, Filipino, Hispanic or Latino, Native Hawaiian

2 0 1 3 A D E Q U A T E Y E A R L Y P R O G R E S S R E P O R T I N F O R M A T I O N G U I D E
or Pacific Islander, White, and Two or More Races. The subcategories for Asian (i.e., Chinese, Japanese, Korean, Vietnamese, Asian Indian, Laotian, Cambodian, Other Asian, or Hmong) are counted as Asian. The subcategories for Native Hawaiian or Pacific Islander (i.e., Native Hawaiian, Guamanian, Samoan, or Tahitian) are counted as Native Hawaiian or Pacific Islander. If multiple subcategories are marked in the same racial category (e.g., Chinese and Korean), the student is classified as that category (e.g., Asian), not Two or More Races.
The following steps determine in which race/ethnicity student group AYP a student’s test results are included:
1. If the CALPADS student record shows Hispanic or Latino in any field, thestudent’s results are included in the Hispanic or Latino student group
2. If the CALPADS student record shows non-Hispanic or Latino and only one race,the student’s results are included in the student group of that racial category.
3. If the CALPADS student record shows non-Hispanic or Latino and more than onerace, the student’s results are included in the Two or More Races student group
4. If the CALPADS student record shows blank in all fields, the student’s results areincluded in the schoolwide and districtwide data but not in any race/ethnicitystudent group
5. If the STAR or CAHSEE student answer document cannot be matched to astudent record in CALPADS, the student will be included in the Two or MoreRaces student group
California Department of Education August 2013 17

2 0 1 3 A D E Q U A T E Y E A R L Y P R O G R E S S R E P O R T I N F O R M A T I O N G U I D E
AYP Criteria This section describes the details of AYP criteria for California. Schools and LEAs are required to meet or exceed criteria annually in the following four areas in order to make AYP:
Requirement 1: Participation Rate
Requirement 2: Percent Proficient—AMOs
Requirement 3: API as an Additional Indicator
Requirement 4: Graduation Rate
Requirements 1, 2, and 4 apply at the school, LEA, and student group levels. Requirement 3 applies only at the school and LEA levels.
If a school, an LEA, or a student group misses any one criterion of AYP, the school or LEA does not make AYP and could be identified for PI. Potentially, a school or an LEA may have up to 50 different criteria to meet in order to make AYP.
Requirements may be applied using standard criteria or small school/LEA/student group criteria. Standard criteria were established for schools, LEAs, or student groups with sufficient numbers of test results or data. Small school/LEA/student group criteria using alternative methods and/or special conditions are for schools, LEAs, or student groups with small numbers of test results or data. Criteria details are provided in the “AYP Criteria Details” section on pages 27 through 40.
California Department of Education August 2013 18

2 0 1 3 A D E Q U A T E Y E A R L Y P R O G R E S S R E P O R T I N F O R M A T I O N G U I D E
California Department of Education August 2013 19
2013 AYP Criteria Flowchart This chart illustrates the process of determining whether a school or an LEA makes AYP.
School or LEA
Tested at least 95%
SL and in each NSS?
Met % proficient SL
and in each NSS in both ELA and
Math?
Met API SL criteria?
Is this a school or
an LEA with high school students?
yes
no
no
no
no
yes
yes
Met graduation rate criteria in
SL and in each NSS?
no
yes
yes
Did not make AYP
yes
Met all safe harbor Did not make AYP
criteria? no
Did not make AYP
Made AYP
Did not make AYP
Made AYP
API = Academic Performance Index AYP = Adequate Yearly Progress ELA = English-language arts LEA = Local educational agency (school
district, COE, or statewide benefit charter)
NSS = Numerically significant student group SL = Schoolwide or LEA-wide

2 0 1 3 A D E Q U A T E Y E A R L Y P R O G R E S S R E P O R T I N F O R M A T I O N G U I D E
AYP Targets, 2002–2014 Elementary Schools, Middle Schools,
and Elementary School Districts
Participation Rate – 95 percent (schoolwide/LEA-wide and student groups) Percent Proficient – AMOs (schoolwide/LEA-wide and student groups)
English-Language Arts
78.4%67.6%
56.8%
35.2%46.0%
13.6%24.4%
10
0.0%10.0%20.0%30.0%40.0%50.0%60.0%70.0%80.0%90.0%
100.0%
2001
-02
2002
-03
2003
-04
2004
-05
2005
-06
2006
-07
2007
-08
2008
-09
2009
-10
2010
-11
2011
-12
2012
-13
2013
-14
Perc
ent P
rofic
ient
89.2%
0.0% 10.0% 20.0% 30.0% 40.0% 50.0% 60.0% 70.0% 80.0% 90.0%
100.0%
2001
-02
20
Perc
ent P
rofic
ient
89.2%
0.0%
English-Language Arts
78.4% 67.6%
56.8%
35.2% 46.0%
13.6% 24.4%
100.0%
02-03
2003
-04
2004
-05
2005
-06
2006
-07
2007
-08
2008
-09
2009
-10
2010
-11
2011
-12
2012
-13
2013
-14
89.2%
Mathematics10
26.5%16.0%
47.5%37.0%
58.0%68.5%
79.0%
0.0%10.0%20.0%30.0%40.0%50.0%60.0%70.0%80.0%90.0%
100.0%
2001
-02
2002
-03
2003
-04
2004
-05
2005
-06
2006
-07
2007
-08
2008
-09
2009
-10
2010
-11
2011
-12
2012
-13
2013
-14Pe
rcen
t Pro
ficie
nt
0.0% 10.0% 20.0% 30.0% 40.0% 50.0% 60.0% 70.0% 80.0% 90.0%
100.0%
2001
-02
20Pe
rcen
t Pro
ficie
nt
0.0%
89.5%
Mathematics 100.0%
26.5% 16.0%
47.5% 37.0%
58.0% 68.5%
79.0% 89.5%
02-03
2003
-04
2004
-05
2005
-06
2006
-07
2007
-08
2008
-09
2009
-10
2010
-11
2011
-12
2012
-13
2013
-14
89.5%
Additional Indicator – Growth in the API of at least one point OR a minimum API score(schoolwide/LEA-wide)
Additional Indicator
770740
710680
620650
560
590
800
500
550
600
650
700
750
800
2001
-02
2002
-03
2003
-04
2004
-05
2005
-06
2006
-07
2007
-08
2008
-09
2009
-10
2010
-11
2011
-12
2012
-13
2013
-14
API
770
-
2001
-02
2002
-03
2003
-04
2004
-05
2005
-06
2006
-07
2007
-08
2008
-09
2009
-10
2010
-11
2-14
Additional Indicator 800
800
750
700
650
600
550
500
560
590
740 710
680
620 650
770
API
011-12
2012
13
2013
Note: AMO targets are level at two time intervals between 2002 and 2007 and then increase yearly to 2014. This pattern was established to reflect the expectation that the strongest academic gains in schools and LEAs are likely to occur in later years (after alignment of instruction with state content standards, after schools and LEAs have the opportunity for increased capacity, and after a highly-qualified teacher is in every classroom).
California Department of Education August 2013 20

2 0 1 3 A D E Q U A T E Y E A R L Y P R O G R E S S R E P O R T I N F O R M A T I O N G U I D E
AYP Targets, 2002–2014 High Schools and High School Districts
(with students in any grades nine through twelve)
Participation Rate – 95 percent (schoolwide/LEA-wide and student groups) Percent Proficient – AMOs (schoolwide/LEA-wide and student groups)
English-Language Arts
22.3%11.2%
44.5%33.4%
55.6%66.7%
77.8%
0.0%10.0%20.0%30.0%40.0%50.0%60.0%70.0%80.0%90.0%
100.0%
2001
-02
2002
-03
2003
-04
2004
-05
2005
-06
2006
-07
2007
-08
2008
-09
2009
-10
2010
-11
2011
-12
2012
-13
2013
-14
Perc
ent P
rofic
ient
88.9%
-20
01-02
2002
-03
2003
-04
2004
-05
2005
-06
2006
-07
2007
-08
2008
-09
2009
-10
2010
-11
14
English-Language Arts 100.0% 100.0% 100.0%
90.0% 88.9%
11.2% 22.3%
44.5% 33.4%
55.6% 66.7%
77.8% 88.9% 80.0%
Perc
ent P
rofic
ient
70.0% 60.0% 50.0% 40.0% 30.0% 20.0% 10.0% 0.0%
2011
-12
2012
13
2013
-
Mathematics
77.4%
66.1%
54.8%
32.2%
43.5%
9.6%
20.9%
0.0%10.0%20.0%30.0%40.0%50.0%60.0%70.0%80.0%90.0%
100.0%
2001
-02
2002
-03
2003
-04
2004
-05
2005
-06
2006
-07
2007
-08
2008
-09
2009
-10
2010
-11
2011
-12
2012
-13
2013
-14Pe
rcen
t Pro
ficie
nt
88.7%
-20
01-02
2002
-03
2003
-04
2004
-05
2005
-06
2006
-07
2007
-08
2008
-09
2009
-10
2010
-11
14
Mathematics 100.0%100.0%100.0%
90.0% 88.7%
9.6%
20.9%
77.4%
66.1%
54.8%
32.2%
43.5%
88.7% 80.0%
Perc
ent P
rofic
ient
70.0% 60.0% 50.0% 40.0% 30.0% 20.0% 10.0% 0.0%
2011
-12
2012
13
2013
-
Additional Indicator – Growth in the API of at Minimum graduation rate OR fixed growthleast one point OR a minimum API score target OR variable growth target(schoolwide/LEA-wide) (schoolwide/LEA-wide and student groups)
Additional Indicator
770740
710680
620650
560
590
800
500
550
600
650
700
750
800
2001
-02
2002
-03
2003
-04
2004
-05
2005
-06
2006
-07
2007
-08
2008
-09
2009
-10
2010
-11
2011
-12
2012
-13
2013
-14
API
770
20
01-02
2002
-03
2003
-04
2004
-05
2005
-06
2006
-07
2007
-08
2008
-09
2009
-10
2010
-11
201
4
Additional Indicator 800
800
560
590
740 710
680
620 650
770750
700
650
600
550
500
API
1-12
2012
-13
2013
-1
Minimum Graduation Rate
2013 AYP graduation rate of at least 90.00
- or -
2013 fixed growth target rate for a school, anLEA, or a student group- or -
2013 variable growth target rate for a school,an LEA, or a student group
Note: AMO targets are level at two time intervals between 2002 and 2007 and then increase yearly to 2014. This pattern was established to reflect the expectation that the strongest academic gains in schools and LEAs are likely to occur in later years (after alignment of instruction with state content standards, after schools and LEAs have the opportunity for increased capacity, and after a highly-qualified teacher is in every classroom).
California Department of Education August 2013 21

2 0 1 3 A D E Q U A T E Y E A R L Y P R O G R E S S R E P O R T I N F O R M A T I O N G U I D E
AYP Targets, 2002–2014 Unified School Districts, High School Districts,
and County Offices of Education (with students in any grades two through eight and nine through twelve)
Participation Rate – 95 percent (schoolwide/LEA-wide and student groups) Percent Proficient – AMOs (schoolwide/LEA-wide and student groups)
English-Language Arts100.0
23.0%12.0%
45.0%34.0%
56.0%
67.0%78.0%
89.0
0.0%10.0%20.0%30.0%40.0%50.0%60.0%70.0%80.0%90.0%
100.0%
2001
-02
2002
-03
2003
-04
2004
-05
2005
-06
2006
-07
2007
-08
2008
-09
2009
-10
2010
-11
2011
-12
2012
-13
2013
-14
Perc
ent P
rofic
ient
89.0
2001
-02
2002
-03
2003
-04
2004
-05
2005
-06
2006
-07
2007
-08
2008
-09
2009
-10
2010
-11
201
14
English-Language Arts 100.0% %100.0%
90.0% % %
12.0% 23.0%
45.0% 34.0%
56.0%
67.0% 78.0%
89.0% 80.0%
Perc
ent P
rofic
ient
70.0% 60.0% 50.0% 40.0% 30.0% 20.0% 10.0% 0.0%
1-12
2012
-13
2013
-
Mathematics
89.78.2%
67.3%56.4%
34.6%
45.5%
12.8%
23.7%
100.
0.0%10.0%20.0%30.0%40.0%50.0%60.0%70.0%80.0%90.0%
100.0%
2001
-02
2002
-03
2003
-04
2004
-05
2005
-06
2006
-07
2007
-08
2008
-09
2009
-10
2010
-11
2011
-12
2012
-13
2013
-14
Perc
ent P
rofic
ient
89.1%
201
2001
-02
2002
-03
2003
-04
2004
-05
2005
-06
2006
-07
2007
-08
2008
-09
2009
-10
2010
-11
20-14
Mathematics 100.0%0%100.0%
90.0%1%
12.8%
23.7%
78.2% 67.3%
56.4%
34.6%
45.5%
89.1% 80.0%
Perc
ent P
rofic
ient
70.0% 60.0% 50.0% 40.0% 30.0% 20.0% 10.0% 0.0%
11-12 2-13
2013
Additional Indicator – Growth in the API of at Minimum graduation rate OR fixed growthleast one point OR a minimum API score target OR variable growth target(schoolwide/LEA-wide) (schoolwide/LEA-wide and student groups)
Additional Indicator
770740
710680
620650
560
590
800
500
550
600
650
700
750
800
2001
-02
2002
-03
2003
-04
2004
-05
2005
-06
2006
-07
2007
-08
2008
-09
2009
-10
2010
-11
2011
-12
2012
-13
2013
-14
API
770
20
01-02
2002
-03
2003
-04
2004
-05
2005
-06
2006
-07
2007
-08
2008
-09
2009
-10
2010
-11
14
API
Additional Indicator 800
800
560
590
740 710
680
620 650
770750
700
650
600
550
500
2011
-12
2012
-13
2013
-
Minimum Graduation Rate
2013 AYP graduation rate of at least 90.00
- or -
2013 fixed growth target rate for a school, anLEA, or a student group- or -
2013 variable growth target rate for a school,an LEA, or a student group
Note: AMO targets are level at two time intervals between 2002 and 2007 and then increase yearly to 2014. This pattern was established to reflect the expectation that the strongest academic gains in schools and LEAs are likely to occur in later years (after alignment of instruction with state content standards, after schools and LEAs have the opportunity for increased capacity, and after a highly-qualified teacher is in every classroom).
22California Department of Education August 2013

2 0 1 3 A D E Q U A T E Y E A R L Y P R O G R E S S R E P O R T I N F O R M A T I O N G U I D E
School Type for AYP Purposes
The AYP targets for percent proficient vary by school type (elementary, middle, and high) and by LEA type (elementary, high, unified, and COE). School type designations of elementary, middle, and high are determined using the same methodology in determining school type for the API ranks. LEA type is determined from the California Public School Directory database.
How School Type is Determined
This section describes the basic steps the CDE used in determining school typefor 2013 AYP.
Step 1: Grade span is used to assign school type.
In the California Public School Directory database, the CDE lists a school’s gradespan according to the lowest and highest grade in which student enrollment wasreported in the most recent certified CALPADS data collection. For most schoolsassigned a grade span, the AYP school type can be determined according to thefollowing table:
Grade Span Criteriafor AYP School Type Classification
School Type Assigned for
AYP Grade Span Served
Elementary K-K, K-1, K-2, K-3, K-4, K-5, K-6, K-7, K-8 1-1, 1-2, 1-3, 1-4, 1-5, 1-6, 1-7, 1-8 2-2, 2-3, 2-4, 2-5, 2-6, 2-7, 2-8 3-3, 3-4, 3-5, 3-6, 3-7, 3-8 4-4, 4-5, 4-6, 4-7 5-5, 5-6 6-6
Middle 4-8 5-7, 5-8 6-7, 6-8, 6-9 7-7, 7-8, 7-9 8-8, 8-9
High 7-10, 7-11, 7-12 8-10, 8-11, 8-12 9-9, 9-10, 9-11, 9-12 10-10, 10-11, 10-12 11-11, 11-12 12-12
California Department of Education August 2013 23

2 0 1 3 A D E Q U A T E Y E A R L Y P R O G R E S S R E P O R T I N F O R M A T I O N G U I D E
Step 2: Enrollment is used to assign school type.
Some schools have grade spans that are much broader than those listed in Step 1. For example, a kindergarten through grade twelve school serves elementary,middle, and high school students.
School Type Determined by Enrollment School Type Assigned for
AYP Grade Span Served
Determined by Enrollment
K–9, K–10, K–11, K–12 1–9, 1–10, 1–11, 1–12 2–9, 2–10, 2–11, 2–12 3–9, 3–10, 3–11, 3–12 4–9, 4–10, 4–11, 4–12 5–9, 5–10, 5–11, 5–12 6–10, 6–11, 6–12
In these cases, school type is determined according to the school's enrollment pattern. School type based on enrollment is determined according to "core" grade spans:
Core Grade Spans for Determining AYP School Type
School Type Core Grade Span Served Elementary K–5
Middle 7–8 High 9–12
Note: Grade six is left out of the core grade span designations. Because some schools view grade six as “elementary” while others view it as “middle,” the process remains neutral on whether grade six is considered one or the other.
Schools with a grade span that crosses three core spans (e.g., kindergarten through grade twelve or kindergarten through grade ten) are assigned a school type according to the largest enrollment in a core grade span. For example, a school with grades kindergarten through twelve has enrollment of 106 students in the kindergarten through grade five span; 192 students in the seven and eight span; and 52 students in the nine through twelve span. Since the enrollment in grades seven and eight is the largest of the three core grade spans, the school is assigned a "middle" school type. If the enrollment for two core grade spans is equal, the school type is equal to the previous year’s AYP school type.
Step 3: School name or characteristics is used to assign school type.
In a very small number of cases, a school may not have a current grade span or enrollment on file at the CDE. In these situations, the school type may be assigned
California Department of Education August 2013 24

2 0 1 3 A D E Q U A T E Y E A R L Y P R O G R E S S R E P O R T I N F O R M A T I O N G U I D E
based on the name or characteristics of the school. Absent the pertinent indicators used to determine a school’s type, a school type of elementary will be assigned for AYP purposes. If the school is new and has no test results for the year of the AYP, the school does not receive an AYP report.
AYP Criteria Summary
The following two tables summarize the AYP criteria for 2013. The first table displays the standard criteria for most schools, and the second table displays the criteria for a small school, an LEA, or a student group.
2013 AYP Targets, Standard Criteria These criteria apply to schools, LEAs, and numerically significant student groups that have 100 or more students enrolled on the first day of testing and/or at least 100 valid scores. Student groups are excluded from Requirement 3. API criteria apply to schools and LEAs with 50 or more valid API test scores. Graduation rate criteria apply to schools, LEAs, or student groups with grade twelve data and with 50 or more students in the graduation rate denominator (graduates plus non-graduates) of the current and prior year calculation.
Requirement 1: Requirement 2: Requirement 3: Requirement 4:
Type of School or LEA
Participation Rate
Percent Proficient –
AMOs
API as an Additional Indicator
Graduation Rate (Applies only to schools, LEAs, and student groups with grade twelve
enrollment or at least one graduate in the cohort)
ElementarySchoolsMiddle SchoolsElementarySchool Districts
ELA: 95% Math: 95%
(rounded to nearest whole number)
ELA: 89.2% Math: 89.5%
(rounded to the nearest tenth)
770 API or
1 point growth N/A
(wigrades 9–12)
High SchoolsHigh SchoolDistricts
th students in any
ELA: 95% Math: 95%
(rounded to nearest whole number)
ELA: 88.9% Math: 88.7%
(rounded to the nearest tenth)
770 API or
1 point growth
Meet at least one: 90.00% Fixed growth target rate Variable growth target rate
Unified SchoolDistricts
High SchoolDistricts
COEs(with students in any
ELA: 95% Math: 95%
(rounded to nearest whole number)
ELA: 89.0% Math: 89.1%
(rounded to the nearest tenth)
770 API or
1 point growth
Meet at least one: 90.00% Fixed growth target rate Variable growth target rate
grades 2–8 and 9–12)
Note: Not all schools contain grades or results for each AYP requirement, and alternative methods and/or special conditions are applied in some cases to ensure that all schools and LEAs receive an AYP report. These methods and codes are described in the “Alternative Methods and Special Conditions” section on pages 43 through 46.
California Department of Education August 2013 25

2 0 1 3 A D E Q U A T E Y E A R L Y P R O G R E S S R E P O R T I N F O R M A T I O N G U I D E
2013 AYP Targets, Small School/LEA/Student Group Criteria These criteria apply to schools, LEAs, and numerically significant student groups with fewer than 100 students enrolled on the first day of testing and/or fewer than 100 valid scores. To be considered numerically significant under Requirement 2, the student group must be in a school or an LEA that has at least 100 valid scores. If not, none of the student groups are considered numerically significant, and Requirement 2 would not apply. Student groups are excluded from Requirement 3. API criteria apply to schools and LEAs with 50 or more valid API test scores. Graduation rate criteria apply to schools, LEAs, or student groups with grade twelve data and with 50 or more students in the graduation rate denominator (graduates plus non-graduates) of the current and prior year calculation.
Size of School, LEA, or
Student Group
Requirement 1:
Participation Rate
Requirement 2:
Percent Proficient – AMOs
Requirement 3:
API as an Additional Indicator
Requirement 4:
Graduation Rate
51–99 students
ELA: 95% Math: 95%
(rounded up to nearest whole
number)
For a school or an LEA: Confidence Interval
Adjusted AMO Table (see page 31)
For a numerically significant student group:
Standard Criteria (see table on page 29)
770 API or
1 point growth
Meet at least one: 90.00% Fixed growth target
rate Variable growth target
rate
50 students Must test at least
47 students
For a school or an LEA: Confidence Interval
Adjusted AMO Table (see page 31)
For a numerically significant student group:
Standard Criteria (see table on page 29)
770 API or
1 point growth
Meet at least one: 90.00% Fixed growth target
rate Variable growth target
rate
11–49 students N/A
For a school or an LEA: Confidence Interval
Adjusted AMO Table (see page 31)
For a numerically significant student group: N/A
N/A N/A
Fewer than 11 students N/A
For a school or an LEA: Confidence Interval
Adjusted AMO Table (see page 31)
For a numerically significant student group: N/A
N/A N/A
Note: Not all schools contain grades or results for each AYP requirement, and alternative methods and/or special conditions are applied in some cases to ensure that all schools and LEAs receive an AYP report. These methods and codes are described in the “Alternative Methods and Special Conditions” section on pages 43 through 46.
California Department of Education August 2013 26
2 0 1 3 A D E Q U A T E Y E A R L Y P R O G R E S S R E P O R T I N F O R M A T I O N G U I D E
AYP Criteria Details
The specific details of Requirements 1 through 4 are described under the next four bulleted items.
Requirement 1: Participation RateESEA requires a 95 percent participation rate in the percentage of studentstaking statewide assessments in order to make AYP. This requirement is appliedseparately for schools, LEAs, and numerically significant student groups for eachcontent area (ELA and mathematics).
Standard Criteria
A participation rate of 95 percent, rounded to the nearest whole number, isrequired of a school, an LEA, or a numerically significant student group with 100or more students enrolled on the first day of testing.
Small School/LEA/Student Group Criteria
For small schools, LEAs, and student groups, alternative criteria are applied. Ifthe school or LEA has 49 or fewer students enrolled on the first day of testing,the participation rate requirement does not apply. If the school, LEA, or studentgroup has 50 students enrolled on the first day of testing, at least 47 studentsmust be tested to meet the participation rate criterion. If the school, LEA, orstudent group has between 51 to 99 students enrolled on the first day of testing,the participation rate requirement is 95 percent, rounded up to the nearest wholenumber.
Exclusions
Students who are absent from testing due to a significant medical emergency areexcluded from the participation rate. (Student records marked as “not tested dueto significant medical emergency” will not be counted for or against the school orLEA in the participation rate.)
ELs during their first year of enrollment in U.S. schools are included in theparticipation rate.
Student Groups
A numerically significant student group for participation rate calculations isdefined as having 100 or more students enrolled on the first day of testing or 50or more students enrolled on the first day of testing who make up at least 15percent of the total student population. If the school or LEA has 100 or morestudents enrolled on the first day of testing, the participation rate is calculated forstudent groups that are numerically significant. If the school or LEA has fewer
California Department of Education August 2013 27

2 0 1 3 A D E Q U A T E Y E A R L Y P R O G R E S S R E P O R T I N F O R M A T I O N G U I D E
than 100 students enrolled on the first day of testing, none of the student groups are considered numerically significant.
Alternative Methods
Schools where LEA data are used to determine the percent proficient or above level (i.e., use of pair and share alternative method) do not have a participation rate calculation.
A two-year and three-year average participation rate will be considered for schools, LEAs, and numerically significant student groups that have not met the 2013 participation rate criteria using a one-year participation rate calculation. Averages are determined by aggregating enrollments over two or three years. First, the one-year participation rate is calculated. This is the only rate that is printed on all reports. If a school, an LEA, or a student group does not meet the minimum 95 percent participation rate using the one-year participation rate calculation, the two-year participation rate is calculated. If a school, an LEA, or a student group does not meet the minimum 95 percent participation rate using the two-year participation rate calculation, the three-year participation rate is calculated.
Two-Year and Three-Year Formula
Two-Year Participation Rate
Number Tested in 2013 + Number Tested in 2012
divided by
Enrollment on the First Day of Testing 2013 + Enrollment on the First Day of Testing 2012
Three-Year Participation Rate
Number Tested in 2013 + Number Tested in 2012 + Number Tested in 2011
divided by
Enrollment on the First Day of Testing 2013 + Enrollment on the First Day of Testing 2012 + Enrollment on the First Day of Testing 2011
Requirement 2: Percent Proficient—AMOs
ESEA mandates that all students perform at the proficient or above level onstatewide assessments in ELA and mathematics by 2014. California’s AMOs arethe minimum percentages of students who are required to meet or exceed theproficient level on the state assessments used for AYP. The AMOs will continueto rise every year so that by 2014, 100 percent of students in all schools, LEAs,and numerically significant student groups must score at the proficient or abovelevel.
California Department of Education August 2013 28

2 0 1 3 A D E Q U A T E Y E A R L Y P R O G R E S S R E P O R T I N F O R M A T I O N G U I D E
Standard Criteria
The following table shows California’s 2013 percent proficient standard criteria for schools or LEAs with 100 or more valid test scores or for numerically significant student groups that have 50 or more students with valid scores. It is important to note that the percent proficient criteria for schools in a unified school district differ from the school district’s criteria. The percent proficient criteria for the state are the same as for a unified school district. The percent proficient rates are rounded to the nearest tenth.
Standard Criteria for AMOs These criteria apply to schools or LEAs that have 100 or more students with valid scores or numerically significant student groups that have 50 or more students with valid scores.
Percent Proficient or Above on the CST, CAHSEE, CMA, and CAPA for 2013
Standard Schools English–Language Arts Mathematics
Elementary and MiddleSchools 89.2 89.5
High Schools 88.9 88.7
Standard LEAs English–Language Arts Mathematics
Elementary School Districts 89.2 89.5
High School Districts(with grades 9–12) 88.9 88.7
Unified School Districts, High School Districts, and COEs
(with grades 2–8 and 9–12)
89.0 89.1
Small School/LEA/Student Group Criteria Different AMO criteria are applied to small schools, LEAs, and student groups in AYP calculations.
Small Schools and Small LEAs
All schools and LEAs receive an AYP report, including those eligible in theAlternative Schools Accountability Model (ASAM), small schools, smallschool districts, and small COEs. Schools and LEAs with fewer than 100valid scores have adjusted AMOs to account for the small number of testscores. These schools and LEAs must meet the adjusted percent
California Department of Education August 2013 29

2 0 1 3 A D E Q U A T E Y E A R L Y P R O G R E S S R E P O R T I N F O R M A T I O N G U I D E
proficient criteria for under 100 valid test scores. The AMOs are adjusted using a confidence interval methodology.
The table on page 31 shows the number of scores a school or an LEA need at the proficient or above level in order to meet the adjusted AMO criteria for 2013. This table was generated by using the standard error of the proportion to construct a confidence interval around the school’s observed proportion (“proficient or above”), based on a 99 percent confidence interval for each school. This confidence interval covers 2.33 standard deviation units above the school’s observed proportion. If the percent proficient falls within this range, it cannot be considered statistically different enough from the school’s observed proportion; therefore, the school is considered to have scored high enough to meet the AMO. The percent proficient has been converted into the number of proficient or above scores to facilitate the use of the table. Finally, the table has been adjusted to smooth the transition at the upper range of valid scores so that there is not an abrupt jump in the percent proficient targets when moving from 99 to 100 valid scores.
Since the ESEA mandates that by 2014 LEAs, schools, and numerically significant student groups meet the 100 percent proficiency target, a 2014 table identifying adjusted AMOs using the confidence interval is not applicable and therefore is not provided.
California Department of Education August 2013 30

2 0 1 3 A D E Q U A T E Y E A R L Y P R O G R E S S R E P O R T I N F O R M A T I O N G U I D E
Confidence Interval Adjusted AMO Table for 2013 To use the following table, determine the number of valid scores available in a content area. Then reference the appropriate percent proficient, or AMO criteria, at the top of the table to determine the number of scores at or above the proficient level that are needed to meet the criterion. Refer to the AMOs on pages 20 through 22 for the appropriate percent proficient for your school or LEA.
Number of Valid Scores
88.7%* 88.9%* 89.0%* 89.1%* 89.2%* 89.5%*
1 0 0 0 0 0 0 2 0 0 0 0 0 0 3 1 1 1 1 1 1 4 2 2 2 2 2 2 5 2 2 2 2 2 3 6 3 3 3 3 3 3 7 4 4 4 4 4 4 8 5 5 5 5 5 5 9 5 5 5 5 5 6
10 6 6 6 6 6 6 11 7 7 7 7 7 7 12 8 8 8 8 8 8 13 8 8 9 9 9 9 14 9 9 9 9 9 9 15 10 10 10 10 10 10 16 11 11 11 11 11 11 17 12 12 12 12 12 12 18 12 12 12 13 13 13 19 13 13 13 13 13 13 20 14 14 14 14 14 14 21 15 15 15 15 15 15 22 16 16 16 16 16 16 23 16 16 17 17 17 17 24 17 17 17 17 17 18 25 18 18 18 18 18 18 26 19 19 19 19 19 19 27 20 20 20 20 20 20 28 20 21 21 21 21 21 29 21 21 21 21 22 22 30 22 22 22 22 22 22 31 23 23 23 23 23 23 32 24 24 24 24 24 24 33 25 25 25 25 25 25 34 25 25 26 26 26 26 35 26 26 26 26 26 27 36 27 27 27 27 27 27 37 28 28 28 28 28 28 38 29 29 29 29 29 29 39 30 30 30 30 30 30 40 30 30 31 31 31 31 41 31 31 31 31 31 32 42 32 32 32 32 32 32 43 33 33 33 33 33 33 44 34 34 34 34 34 34 45 34 35 35 35 35 35 46 35 35 36 36 36 36 47 36 36 36 36 36 37 48 37 37 37 37 37 38 49 38 38 38 38 38 39 50 39 39 39 39 39 40
Number of Valid Scores
88.7%* 88.9%* 89.0%* 89.1%* 89.2%* 89.5%*
51 40 40 40 40 40 41 52 41 41 41 41 41 42 53 42 42 42 42 42 43 54 43 43 43 43 43 44 55 44 44 44 44 44 45 56 45 45 45 45 45 46 57 46 46 46 46 46 47 58 47 47 47 47 47 48 59 48 48 48 48 48 49 60 49 49 49 49 49 50 61 50 50 50 50 50 51 62 51 51 51 51 51 52 63 52 52 52 52 52 53 64 53 53 53 53 53 54 65 54 54 54 54 54 55 66 55 55 55 55 55 56 67 56 56 56 56 56 57 68 57 57 57 57 57 58 69 58 58 58 58 58 59 70 59 59 59 59 59 60 71 60 60 60 60 60 61 72 61 61 61 61 61 62 73 62 62 62 62 62 63 74 63 63 63 63 63 64 75 64 64 64 64 64 65 76 65 65 65 65 65 66 77 66 66 66 66 66 67 78 67 67 67 67 67 68 79 68 68 68 68 68 69 80 69 69 69 69 69 70 81 70 70 70 70 70 71 82 71 71 71 71 71 72 83 72 72 72 72 72 73 84 73 73 73 73 73 74 85 74 74 74 74 74 75 86 75 75 75 75 75 76 87 76 76 76 76 76 77 88 77 77 77 77 77 78 89 78 78 78 78 78 79 90 79 79 79 79 79 80 91 80 80 80 80 80 81 92 81 81 81 81 81 82 93 82 82 82 82 82 83 94 83 83 83 83 83 84 95 84 84 84 84 84 85 96 85 85 85 85 85 86 97 86 86 86 86 86 87 98 87 87 87 87 87 88 99 88 88 88 88 88 89 100 89 89 89 89 89 90
* Percent proficient (AMO) criteria
California Department of Education August 2013 31

2 0 1 3 A D E Q U A T E Y E A R L Y P R O G R E S S R E P O R T I N F O R M A T I O N G U I D E
Small Student Groups
The school or LEA must have at least 100 valid scores for the studentgroup to be considered numerically significant for the AMO. If the schoolor LEA has fewer than 100 valid scores, none of the student groups areconsidered numerically significant and Requirement 2 would not apply.For example, a student group with 99 valid scores in a school with 99 validscores would not be considered numerically significant.
If the numerically significant student group is in a school or an LEA with atleast 100 valid scores, the standard criteria for AMOs are applied if thestudent group has between 50 to 99 valid scores. Student groups with 49or fewer valid scores are not numerically significant, and AMOs would notapply.
Exclusions
Students who are absent from testing due to a significant medical emergency are excluded from the percent proficient calculations. (Student records marked as “not tested due to significant medical emergency” are not counted for or against the school or LEA in the percent proficient.)
ELs during their first year of enrollment in U.S. schools are excluded from the percent proficient calculations.
Student Groups
If the school or LEA has 100 or more valid test scores, the percent proficient is calculated for numerically significant student groups. A numerically significant student group for percent proficient calculations is defined as having 100 or more students with valid scores or 50 or more students with valid scores who make up at least 15 percent of the total number of students with valid scores. If the school or LEA has fewer than 100 valid scores, none of the student groups are considered numerically significant.
Alternative Methods A two-year and three-year average percent at the proficient or above level will be considered for schools, LEAs, and numerically significant student groups that have not met the 2013 AMOs using a one-year formula. Averages are determined by aggregating results over two or three years. First, the one-year percentage is calculated. This is the only percentage that is printed on all reports. If a school, an LEA, or a student group does not meet its AMO target using the one-year method, the two-year method is used. If a school, an LEA, or a student group does not meet its AMO target using the two-year method, the three-year method is used.
California Department of Education August 2013 32

2 0 1 3 A D E Q U A T E Y E A R L Y P R O G R E S S R E P O R T I N F O R M A T I O N G U I D E
Two-Year and Three-Year Formula
Two-Year Percent Proficient Three-Year Percent Proficient
Number Proficient or Above in 2013
+ Number Proficient or Above in 2012 divided by
Number of Valid Scores in 2013 + Number of Valid Scores in 2012
Number Proficient or Above in 2013
+ Number Proficient or Above in 2012 + Number Proficient or Above in 2011
divided by
Number of Valid Scores in 2013 + Number of Valid Scores in 2012 + Number of Valid Scores in 2011
Requirement 3: API as an Additional Indicator
ESEA requires that each state adopt an “additional” indicator for AYP. Californiahas chosen to use the API as an additional indicator for all schools and LEAs.Progress on the API is defined differently for AYP requirements than for the stateAPI requirements. A school or an LEA that had its API invalidated also fails tomake AYP.
The group size of 50 is used for the API as the additional indicator for AYP.Having a minimum group size for both the API and graduation rate for AYP willprovide consistency in California’s accountability system. The minimum groupsize for the API would only apply in AYP determinations. Schools or LEAs areexempt from the API requirement for AYP if they have fewer than 50 validscores.
Standard AYP Criteria for API These criteria apply to schools and LEAs that have 50 or more students with valid scores.
Type Criteria
Standard Schools and LEAs
To meet API requirements for the 2013 AYP, the school or LEA must:
Show growth of at least one point for 2012–13– or –
Have a 2013 Growth API of at least 770
For example, a school with a Base API of 712 and a Growth API of 715 would meet the API criteria for the additional indicator under AYP. These requirements apply at the school and LEA levels but do not apply to student groups.
California Department of Education August 2013 33

2 0 1 3 A D E Q U A T E Y E A R L Y P R O G R E S S R E P O R T I N F O R M A T I O N G U I D E
The state’s CCR and California EC specify what constitutes a valid API for state accountability. A school or an LEA with an invalid Growth API does not meet the API as an additional indicator criterion (Requirement 3) under AYP, and the school or LEA would not make AYP.
Requirement 4: Graduation Rate as an Additional Indicator
ESEA requires that the state use the graduation rate as an additional indicator forall schools and LEAs with grade twelve students. In 2008, the ED published itsfinal guidance regarding the requirement for all states to use a four-year cohortgraduation rate beginning with the 2012 AYP determinations. The four-yearcohort graduation rate for AYP purposes is defined according to the year of AYPreporting (e.g., four-year rate for 2013). On other CDE reports, the graduationrate is defined as the school year of the graduating class (e.g., Class of 2011–12). Note that the AYP cohort graduation rate data on the report are one yearolder (e.g., 2011–12) than other data on the AYP report (e.g., 2012–13). This ispermissible under federal guidance.
Data used to calculate the graduation rate come from student–level datamaintained in the CALPADS.
Schools and LEAs with grade twelve enrollment or at least one graduate in thecohort of the graduation rate will have their 2013 graduation rate calculated usingthe cohort graduation rate formula. The graduation rate goal for all schools,LEAs, and student groups is 90 percent. The graduation growth target structurerequires all schools, LEAs, and student groups to meet the 90 percent goal by2019 AYP.
Standard Graduation Rate Criteria
Type Criteria
Schools and LEAs with grade twelve enrollment and at
least one graduate in cohort
To meet graduation rate criteria for AYP the school, LEA, or student group must: Have a four–year graduation rate of at least 90.00
– or – Meet its four–year graduation rate fixed growth target rate
– or – Meet its four–year graduation rate variable growth target rate
Fixed Growth Target Rate
The fixed growth four-year cohort graduation rate schedule was established in 2011 based on the difference between the school’s, LEA’s, or student group’s baseline four-year cohort graduation rate (i.e., 2011 AYP graduation rate) and
California Department of Education August 2013 34

2 0 1 3 A D E Q U A T E Y E A R L Y P R O G R E S S R E P O R T I N F O R M A T I O N G U I D E
the 90 percent goal divided by the number of years remaining before the 2019 AYP (i.e., eight years). This difference was used to establish eight equal four-year graduation rate targets and will not be recalculated again.
For a school with a 2009–10 four-year cohort graduation rate of 70 percent, the fixed target schedule would be 2.50 percentage points per year. The target is calculated by subtracting 70 percent (i.e., baseline 2009–10 four-year cohort graduation rate) from 90 percent (i.e., the graduation rate goal) and dividing by eight (i.e., the number of years until 2019 AYP). The target is used to calculate the schedule of targets for the next eight years (e.g., 72.50, 75.00, 77.5 and so on).
Variable Growth Target Rate
The variable growth four-year cohort graduation rate is established based on the difference between the school’s, LEA’s, or student group’s current graduation rate and the 90 percent goal divided by the number of years remaining before the 2019 AYP. The variable four-year graduation rate target is calculated annually for each school, LEA, and student group. The variable growth target rate changes each year according to the school’s current four-year cohort graduation rate. The 2013 AYP variable four-year target rate was calculated using the 2010–11 four-year cohort graduation rate.
A school with a 2012 AYP four-year cohort graduation rate of 60 percent would have a variable target of 3.3 percentage points for the 2013 AYP. If this same school has a 2013 four-year cohort graduation rate of 62 percent, its variable target for the 2014 AYP would be 3.5 percentage points.
Calculating the AYP Four-Year Cohort Graduation Rate
The cohort graduation rate methodology is based on the definitions established by the ED. The four-year cohort graduation rate formula is used for the 2013 AYP determinations.
California Department of Education August 2013 35

2 0 1 3 A D E Q U A T E Y E A R L Y P R O G R E S S R E P O R T I N F O R M A T I O N G U I D E
California Department of Education August 2013 36
Four–Year Cohort Graduation Rate Formula for ESEA
Four–Year Cohort Graduation Rate for 2013
Number of cohort members who earn a regular high school diploma by the end of 2011–12
divided by
Number of first–time grade nine students in 2008–09 plus students who transfer in, minus students who transfer out, emigrate, or die during school years 2008–09, 2009–10, 2010–11, and 2011–12.
Three Options for Meeting 2013 AYP Graduation Rate Criteria
Three options for meeting 2013 AYP graduation rate criteria are shown below and on the next page.
Option 1: Four–Year Cohort Graduation Rate of 90.00 or Above
Option 1 Example Nort
Must have minimum Four-Year Cohort Graduation Rate of 90.00 to meet requirement
h Star High School
537 / 575 = 93.39% Graduates / (Graduates + Non-graduates) = Rate
Met requirement
In this example, North Star High School met its 2013 AYP criteria for the four–year cohort graduation rate under Option 1 because the rate for 2013 was 93.39, which exceeds the goal of 90.00.

2 0 1 3 A D E Q U A T E Y E A R L Y P R O G R E S S R E P O R T I N F O R M A T I O N G U I D E
California Department of Education August 2013 37
Option 2: Meet Fixed Growth Target Rate
Option 2 Example Polaris Unified School District
Four-Year Cohort Graduation Rate for 2011
1,601 / 2,015 = 79.45% Graduates / (Graduates + Non-graduates) = Rate
Fixed Growth Target Rate Based on the 2011 Four-Year Graduation Rate
(90.00% – 79.45) / 8 = 1.32% (annual increase)
2013 Fixed Growth Target Rate
79.45% + 2.64% (annual x 2) = 82.09%
Must meet fixed growth target rate to meet requirement
Four-Year Cohort Graduation Rate for 2013
1,543 / 1,863 = 82.82% Graduates / (Graduates + Non-graduates) = Rate
82.82% exceeds 82.09%
Meets requirement
In this example, Polaris Unified School District met its 2013 AYP criteria for the graduation rate under Option 2 because its 2013 four-year graduation rate of 82.82 percent exceeded the fixed growth target rate of 82.09 percent, which was calculated using the four-year cohort graduation rate schedule determined in 2011.
Option 3: Meet Variable Growth Target Rate
Option 3 Example Saturn High School
Four-Year Cohort Gra duation Rate for 2012
498 / 602 = 82.72% Graduates / (Graduates + Non-graduates) = Rate
Variable Growth Target
(90.00% - 82.72 %) / 7 = 1.04%
Variable Growth Target Rate
82.72% + 1.04% = 83.76%
Must meet variable growth target rate to meet requirement
Four-Year Cohort Gra duation Rate for 2013
498 / 612 = 81.37% Graduates / (Graduates + Non-graduates) = Rate
81.37% is less than 83.76%
Did not meet requirement
In this example, Saturn High School did not meet its 2013 AYP criteria for the four-year graduation rate under Option 3 because the school’s 2013 graduation

2 0 1 3 A D E Q U A T E Y E A R L Y P R O G R E S S R E P O R T I N F O R M A T I O N G U I D E
rate of 81.37 percent is less than its variable growth target rate of 83.76 percent.
Alternative Method for Meeting Graduation Rate Criteria
Beginning with the 2013 AYP, schools and LEAs that meet certain criteria will be eligible to use a five-year cohort graduation rate as an alternative method to meeting the graduation rate criteria.
The five-year cohort graduation rate will be applied to LEAs, schools, and students groups in the same way as the four-year cohort graduation rate is applied. LEAs, schools, and students groups will have three ways to meet the five-year cohort graduation rate target: (1) meet or exceed the goal of 90 percent, (2) exceed the four-year cohort graduation rate variable target by one percentage point, or (3) exceed the four-year cohort graduation rate fixed growth target by one percentage point.
Five-Year Cohort Graduation Rate Formula for 2013
Number of 2010–11 four-year cohort members who earn a regular high school diploma by the end of 2011–12 school year
divided by
Number of first-time grade nine students in 2007–08 plus students who transfer in, minus students who transfer out, emigrate, or die during school years 2007–08, 2008–09, 2009–10, 2010–11, and
2011–12
The alternative method of the five-year cohort graduation rate will only be applied for LEAs, schools, or student groups that did not make the state goal or the annual growth target for the four-year cohort graduation rate. In addition, LEAs, schools, or student groups must also meet the following eligibility criterion to have the alternative five-year cohort graduation rate used in determining if the AYP graduation rate criteria are met:
The number of graduates in the five-year cohort rate must contain at least one additional graduate.
If the above criterion is met, then the five-year graduation rate will be considered. The five-year graduation rate target will be 1.0 percentage point higher than the four-year graduation rate target.
Meeting the state goal or the annual growth target for either the four-year or the five-year cohort graduation rate would qualify the LEA, school, or student group as meeting the graduation rate criteria for AYP.
California Department of Education August 2013 38

2 0 1 3 A D E Q U A T E Y E A R L Y P R O G R E S S R E P O R T I N F O R M A T I O N G U I D E
Information on the five-year cohort graduation rate and the 2013 AYP five-year graduation rate targets for LEAs, schools, and numerically significant student groups will be provided within the “Cohort Graduation Rate” section in the 2013 AYP reports.
Graduation Rate Rules
1. The four-year cohort graduation rate data used to determine AYP arealways lagged. For example, the 2013 AYP determination compares the2011–12 graduation rate to the 2010–11 graduation rate to determine ifthe 90 percent goal or growth targets were met.
2. Graduation rate criteria apply to all schools, LEAs, and student groupsunless the school, LEA, or student group:
a. Does not have any grade twelve enrollment or graduates in the cohortin either the prior or current graduation rate years
b. Has fewer than 50 students in the cohort in either the prior or currentgraduation rate years
3. All direct funded charter schools, regardless of whether they are ASAM orcounty run schools, with 50 or more students in both the prior and currentyear’s graduation rate have their own graduation rate calculated.
4. Countywide graduation rates are assigned to the following entities whenthe four-year cohort has 50 or more students in both the prior and currentyear’s graduation rate:
a. COEs
b. Schools that are run by COEs and are not direct funded charterschools
c. State special schools (i.e., schools for the deaf and blind)
5. LEA-wide graduation rates are assigned to the following entities when thefour-year cohort has 50 or more students in both the prior and currentyear’s graduation rate:
a. LEAs
b. ASAM schools that are run by an LEA and are not direct fundedcharter schools
California Department of Education August 2013 39

2 0 1 3 A D E Q U A T E Y E A R L Y P R O G R E S S R E P O R T I N F O R M A T I O N G U I D E
6. All students’ cohort data are rolled up to the LEA, including students inschools without grade twelve enrollment and students in schools that donot receive a graduation rate. This excludes direct funded charter schoolsand State Special Schools.
Safe Harbor
ESEA contains a “safe harbor” provision for meeting AMOs in some circumstances and is applied in the AYP reports when these circumstances occur. Safe harbor is an alternate method of meeting the AMOs. Currently, if a school, an LEA, or a student group does not meet its AMO criteria in either or both content areas but shows progress in moving students from scoring below the proficient level to the proficient level or above on the assessments, it may make AYP if all of the following conditions are met:
The percentage of students in the school, LEA, or student group performingbelow the proficient level in either ELA or mathematics decreased by at least 10percent from the preceding school year; and
The school, LEA, or student group had a “Yes” or blank in the “Met 2013 AYPCriteria” column for participation rate for the assessments in ELA andmathematics; and
The school, LEA, or student group demonstrated at least a one-point growth inthe API or had a Growth API of 770 or more; and
The school, LEA, or student group met graduation rate criteria, if applicable.
In order to apply safe harbor, the school, LEA, or student group current year’s percent proficient or above level must be higher than the previous year’s percent proficient or above level. Safe harbor for LEAs is applied for both grade spans and numerically significant student groups within grade spans of an LEA. A confidence interval adjustment of 75 percent is applied to safe harbor calculations. Safe harbor is one of the alternative methods approved by the ED for meeting AMO targets. (See the “Alternative Methods and Special Conditions” section on pages 43 through 46.) Like the other alternative methods, there is no limit on how many times a school or LEA may make AYP using safe harbor. No distinction is made regarding how schools and LEAs make AYP, only whether or not AYP is met. Therefore, schools and LEAs may exit PI if they meet AYP for two consecutive years, even if AYP was made using safe harbor or another alternative method.
Example of Safe Harbor
In the example of safe harbor shown on the following page, the elementary school shows 64.3 percent of its students scoring at the proficient level or above schoolwide in 2012 in ELA (shown as PP12 in row D, column A).
California Department of Education August 2013 40

2 0 1 3 A D E Q U A T E Y E A R L Y P R O G R E S S R E P O R T I N F O R M A T I O N G U I D E
In 2013, the school’s percent at the proficient or above level in ELA increased to 76.8 percent (shown as PP13 in row D, column B). Except for ELA, the school met all the other criteria for making AYP. (It met its AMO in mathematics, its API was above the target, and it had a “Yes” or blank in the “Met 2013 AYP Criteria” column for participation rate in ELA and mathematics.)
The school would not ordinarily make AYP in 2013 because 76.8 percent is below the AMO of 89.2 percent for ELA. However, the school’s percentage at the below proficient level in ELA decreased by the safe harbor requirement of at least 10 percent with the 75 percent confidence interval adjustment (shown in the calculation steps in rows E through I). According to safe harbor rules, the school meets AYP because the percentage of students below the proficient level decreased by at least 10 percent from the preceding school year in ELA, the content area in which AMO was not met, and it met its other AYP criteria.
The 75 percent confidence interval provides an extra margin of error in the calculations to enhance accuracy in determining whether or not schools meet the safe harbor criteria.
The safe harbor calculations are automatically applied to schools and LEAs that fail to meet one or more of their AMOs. The process includes an LEA grade span analysis used to determine if an LEA is identified for PI.
California Department of Education August 2013 41

2 0 1 3 A D E Q U A T E Y E A R L Y P R O G R E S S R E P O R T I N F O R M A T I O N G U I D E
Example of Safe Harbor for an Elementary School The school met its 2013 AMO in mathematics schoolwide but missed its 2013 AMO in ELA schoolwide. Also in 2013, the school had a “Yes” in the “Met 2013 AYP Criteria” column for participation rate in both ELA and mathematics and had a growth of six points on the 2013 Growth API. The school had no numerically significant student groups in either 2012 or 2013.
Step (A)
2012 ELA
(B)2013 ELA
(C)Calculation
A. Number Proficient or Above (NP) 258 (NP12)
307 (NP13) (enter from AYP report)
B. Number Below Proficient (NBP) 143 (NBP12)
93 (NBP13) (TN – NP = NBP)
C. Total Number of Valid Scores (TN) 401 (TN12)
400 (TN13) (enter from AYP report)
D. Percent Proficient or Above (PP) 64.3 (PP12)
76.8 (PP13) (NP/TN) x 100
E. Percent Below Proficient (PBP) The 2013 rate should decrease by at least 10 percent from the 2012 rate to meet safe harbor criteria.
35.7 (PBP12)
23.3 (PBP13) 100 – PP
F. Maximum Percent Below Proficient (MPBP) This is the maximum percent below proficient for 2013 to meet safe harbor criteria.
(Blank) 32.1 (MPBP) 0.9 x PBP12
G. Minimum Percent Proficient Safe Harbor (PPSH) This is the minimum 2013 percent proficient or above necessary to meet safe harbor criteria in 2013.
(Blank) 67.9 (PPSH) 100 – MPBP
H. 75 Percent Confidence Interval (CI) This is the extra margin of error provided to the 2013 percent proficient or above.
(Blank) 2.273 (CI)
0.68 x SQRT (PP12 x PBP12/TN12 +PPSH x MPBP/TN13)
I. 2013 Percent Proficient for 2013 Safe Harbor with 75 Percent Confidence Interval (PPCI) If this rate is higher than the minimum PPSH for 2013, the safe harbor criteria were met.
(Blank) 79.023 (PPCI)
PP13 + CI If PPCI > PPSH, criteria met.
This school met the safe harbor criteria for the AMO in ELA because the “2013 Percent Proficient for 2013 Safe Harbor with 75 Percent Confidence Interval” (79.023) is greater than the “Minimum Percent Proficient Safe Harbor for 2013 (67.9 percent).
California Department of Education August 2013 42

2 0 1 3 A D E Q U A T E Y E A R L Y P R O G R E S S R E P O R T I N F O R M A T I O N G U I D E
Alternative Methods and Special Conditions
The ESEA requires that all schools be included in AYP reporting. Not all schools contain grades or results for which AYP data are collected. A number of alternate methodologies to combine and report data are required to ensure all schools and LEAs receive an AYP report. Only schools and LEAs with 2013 CST, CMA, or CAPA results in grades two through eight and/or CAHSEE or CAPA results in grade ten were processed for participation rates, percent proficient, and API according to the standard procedures. Other schools and LEAs were evaluated using other methodologies.
Alternative Method Descriptions
Alternative Method Description
CA = County average
For schools without test results, calculations were based on the school district averages. If school district values are not available, countywide averages were used. For LEAs (school districts and COEs) without test results, countywide averages were used. For COEs that oversee schools that serve high school students, countywide average graduation rates were used for both the schools and the COEs.
CI = Passed using confidence intervals
Small schools and LEAs with less than 100 valid scores have adjusted AMOs to account for the small number of test scores. These schools and LEAs met the adjusted percent proficient criteria using a confidence interval methodology. Small schools and LEAs with less than 50 valid scores have adjusted API criteria to account for the small number of test scores.
DA = District average For schools without test results used in AYP, calculations were based on the school district averages. ASAM schools with grade twelve students and that are administered by a school district have districtwide graduation rates.
EN = Enrollment less than 50 Schools or LEAs with less than 50 students enrolled do not have participation rate criteria, and “Yes” is shown for schoolwide or LEA-wide in the “Met 2013 AYP Criteria” column on the report.
ER = Enrollment 50 to 99
Small schools and LEAs with 50 to 99 students enrolled have slightly adjusted participation rate criteria to account for the small numbers. These adjusted criteria also apply to numerically significant student groups in a school or an LEA that has at least 100 students enrolled. Schools, LEAs, or student groups with 50 students enrolled meet participation rate criteria by having at least 47 students tested. Schools, LEAs, or student groups that have between 51 and 99 students enrolled meet participation rate criteria by having a participation rate of at least 95 percent, with the rate rounded up to the nearest whole number.
5Y = 5-yr graduation rate
The five-year cohort graduation rate was used as an alternative to meeting the graduation rate criteria for LEAs, schools, or student groups that did not make the state goal or the annual growth target for the four-year cohort graduation rate. To have this alternative method applied, LEAs, schools, or student groups must meet the following: (1) the number of graduates in the five-year cohort rate contained at least one additional graduate and (2) the five-year graduation rate target was 1.0 percentage point higher than the four-year graduation rate target.
California Department of Education August 2013 43

2 0 1 3 A D E Q U A T E Y E A R L Y P R O G R E S S R E P O R T I N F O R M A T I O N G U I D E
Alternative Method Descriptions (continued)
Alternative Method Description
G9 = Grade 9 only For high schools without grade ten CAHSEE and CAPA results, grade nine CST results are used if available. If the school fails the participation rate in mathematics for grade nine, then grade eleven CST results are used.*
G1 = Grade 11 only
For high schools without grade ten CAHSEE and CAPA results, and where these schools failed grade nine participation rate in mathematics, grade eleven CST results are used if available. If the school fails the participation rate in mathematics for grade eleven, then the district average is used.*
OT = Other In very rare cases, special calculations may be used due to unique situations.
PS = Pair and share
California testing begins in grade two. For schools with only kindergarten and/or grade one, the second grade scores of the schools to which these students matriculate will be used. This is referred to as “pairing and sharing.” For schools that do not supply pair and share data, the school district or county values are used (DA or CA).
SH = Passed by safe harbor
The school, LEA, or student group met the criteria for safe harbor, which is an alternate method of meeting the AMO if a school, an LEA, or a student group shows progress in moving students from scoring at the below proficient level to the proficient level.
Y2 = Passed by using 2-year average
Schools, LEAs, or student groups that have not met AYP participation rate or percent proficient (AMO) criteria using a one-year formula met the participation rate or AMO using a two-year formula.
Y3 = Passed by using 3-year average
Schools, LEAs, or student groups that have not met AYP participation rate or percent proficient (AMO) criteria using a one- or two-year formula met the participation rate or AMO using a three-year formula.
Note: The original data for the school, LEA, or student group are shown on the AYP report, even though the alternative method is used as the criterion, unless the school, LEA, or student group had no results for enrollment, valid scores, and/or graduation rate. In those cases, the alternative data are shown on the report.
* Because high school students are not required to take a mathematics course in a specific grade, failure to meet themathematics participation rate triggers the use of the grade 11 CST results to make an AYP determination. If the school fails the participation rate for grade 11 mathematics, the school is assigned the district average.
California Department of Education August 2013 44

2 0 1 3 A D E Q U A T E Y E A R L Y P R O G R E S S R E P O R T I N F O R M A T I O N G U I D E
California Department of Education August 2013 45
Alternative Method Codes The alternative methods may apply to one or more of the four areas of AYP requirements (participation rate, AMO, API, and graduation rate). The following chart shows whether each method applies to the AYP areas and whether the method is applicable to a school, an LEA, or a student group.
Alternative Method Participation
Rate AMO API Graduation
Rate CA = County average N/A SL SL SL/NSS CI = Passed using confidence intervals N/A SL SL N/A DA = District average N/A SL SL SL/NSS EN = Enrollment less than 50 SL/NSS N/A N/A N/A
ER = Enrollment 50 to 99 SL/NSS N/A N/A N/A
5Y = 5-year graduation rate N/A N/A N/A SL/NSS G9 = Grade 9 only SL/NSS SL/NSS N/A N/A
G1 = Grade 11 only SL/NSS SL/NSS N/A N/A
OT = Other SL/NSS SL/NSS SL N/A PS = Pair and share N/A SL SL N/A SH = Passed by safe harbor N/A SL/NSS N/A N/A Y2 = Passed by using 2-year average SL/NSS SL/NSS N/A N/A Y3 = Passed by using 3-year average SL/NSS SL/NSS N/A N/A
SL = Schoolwide or LEA–wide; NSS = Numerically significant student group
Special Condition Descriptions
Special Condition Description
Growth API is not reported for this school because there was a 20 or more DE = Data Error percentage points decrease in students continuously enrolled from the 2012 Base
API to the 2013 Growth API or the LEA reported a potential data error in this area.
NC = Non certified CALPADS data Data was not certified through CALPADS (used for graduation rate).
NG12 = No grade 12 data Schools without grade twelve enrollment or at least one graduate in the cohort, either in the prior or current year, do not have a graduation rate reported. Schools, LEAs, or student groups that have fewer than 50 students in the
U50 = Graduation less than 50 graduation rate denominator (graduates plus non-graduates) in either the prior or current year’s graduation data do not have a graduation rate reported.
YMA = Yes, met on appeal The school, LEA, or student group met criteria because its appeal was approved.

2 0 1 3 A D E Q U A T E Y E A R L Y P R O G R E S S R E P O R T I N F O R M A T I O N G U I D E
Special Condition Codes Special conditions may apply to one or more of the four areas of AYP requirements (participation rate, AMO, API, and graduation rate). The following chart shows whether each condition applies to the AYP areas and whether the condition is applicable to a school, an LEA, or a student group.
Special Condition Participation
Rate AMO API Graduation
Rate DE = Data error N/A* N/A* SL N/A* NC = Data not certified in CALPADS N/A* N/A* N/A* SL/NSS NG12 = No grade 12 data N/A* N/A* N/A* SL UE = Passed by one point growth N/A* N/A* SL N/A* U50 = Less than 50 in graduation rate N/A* N/A* N/A* SL/NSS YMA = Yes, met on appeal SL/NSS SL/NSS SL SL/NSS
SL = Schoolwide or LEA–wide; NSS = Numerically significant student group N/A* = Not Applicable
AYP Appeals Process
An LEA on its own behalf or on behalf of its schools may appeal AYP results. Appeals are accepted after the initial release and after each AYP update. A separate appeal form must be submitted for the LEA and each school. The appeal form is posted on the CDE AYP Web page at http://www.cde.ca.gov/ta/ac/ay/. The CDE will accept appeals of updated AYP results only if the AYP status of the school or LEA changed as a result of the updated AYP report.
The results of an AYP appeal could impact the PI status of any Title I-funded school or LEA that will potentially enter, advance in, or exit from PI. Therefore, it is essential that LEAs submit all appeals by the deadline indicated on the appeal form. Schools or LEAs making an appeal will remain in the same AYP and PI status until final decisions are reached on all appeals.
California Department of Education August 2013 46

2 0 1 3 A D E Q U A T E Y E A R L Y P R O G R E S S R E P O R T I N F O R M A T I O N G U I D E
Criteria for Appeals of the AYP Determination This table lists the only reasons appeals of the AYP determination will be accepted by the CDE.
Reason for Appeal Description
Substantive reason An example would be a natural disaster that prevented the LEA from administering the applicable assessment. Supporting documentation should establish the unique character of the substantive reason.
Medical emergency A significant medical emergency prevented the student from taking the originally scheduled state assessment(s) as well as the make–up assessment(s) used for establishing AYP (STAR for grades two through eight, CAHSEE for grade ten, CAPA for grades two through eight and ten), and the schoolwide and/or numerically significant student group participation rate has been affected.
Pair and share The AYP determination was based on results from other students, schools, or LEAs. (The AYP was based on pairing and sharing the results of other schools or of the school district or county in which the school is located.) In this instance, the LEA or school must submit test results or other data that are a more valid measure of the LEA’s or school’s performance than the information that appears on the AYP report.
Appeal results will be incorporated into the revised AYP reports scheduled for release in November 2013. Appeal results of the November release will be incorporated into the revised AYP reports to be released in January 2014.
Each appeal must include appropriate documentation supporting the appeal criteria and a detailed description of the issue and how its resolution would modify the AYP determination. Failure to submit appropriate documentation will result in denial of the appeal.
The appeal process is separate from the data correction process. Appeals based on the submission of erroneous data by schools or LEAs will not be considered by the CDE. These errors should be corrected by the school or LEA.
Questions about the AYP appeals process may be directed to the AAU by phone at 916-319-0863 or by e-mail at [email protected].
California Department of Education August 2013 47
2 0 1 3 A D E Q U A T E Y E A R L Y P R O G R E S S R E P O R T I N F O R M A T I O N G U I D E
Percent Proficient Caps for LEAs This section describes the criteria and methodology for meeting the requirements of the federal ESEA regulations concerning alternate and modified assessment in determining AYP based on statewide testing. It explains the rules for the CAPA 1.0 percent cap, CMA percent 2.0 cap, flexibility in the application of the CAPA and CMA caps, and the method for reassignment of scores.
CAPA 1.0 Percent Cap
On December 9, 2003, federal regulations were adopted that set a cap of 1.0 percent on the percentage of students in LEAs, including direct funded charter schools, whose scores can be counted as proficient or above based on an alternate assessment using alternate achievement standards. The alternate assessment used in California for students with severe cognitive disabilities is the CAPA. The 1.0 percent cap may be exceeded in cases where the LEA provides adequate justification to the state. Absent an approved exception from the CDE, proficient or advanced level scores above the cap must be counted as not proficient in AYP calculations.
All LEAs were notified of the process to apply for an exception. Exception requests are reviewed and processed by the CDE. The official AYP determination of LEAs that are over the 1.0 percent cap is included in the initial release of the AYP reports. Questions regarding the application for exception to the 1.0 percent cap should be addressed to Assessment, Evaluation, and Support Unit of the Special Education Division, by phone at 916-445-4628.
Automatic Exception for COEs and Small LEAsAll COEs and any LEA with ten or fewer valid CAPA scores in a content area(ELA or mathematics) or five or fewer valid proficient and advanced CAPAscores in a content area receive an automatic exception.
How the Percent Proficient Rate is CalculatedThe CAPA percent proficient rate is calculated using the following formula:
Numerator = Number of 2013 CAPA scores in the proficient and advancedlevels in grades two through eight and ten by content area from studentswho were continuously enrolled in the LEA since the Fall Census Day (i.e.,the first Wednesday in October).
Denominator = 2013 STAR enrollment on the first day of testing in gradestwo through eight and 2013 CAHSEE enrollment on the first day of testingin grade ten for students who were continuously enrolled in the LEA sincethe Fall Census Day.
California Department of Education August 2013 48

2 0 1 3 A D E Q U A T E Y E A R L Y P R O G R E S S R E P O R T I N F O R M A T I O N G U I D E
The example below shows how the percentage is calculated for determining if an LEA is above the 1.0 percent cap. The rate is calculated separately for ELA and mathematics. The example shows the calculation for ELA only.
Example of CAPA Percent Proficient Rate for ELA
Polaris Unified School District The school district shows the following data: 5,060 students enrolled on the first day of testing 60 of those students were not continuously enrolled since the Fall Census Day 56 students with CAPA scores at proficient or advanced level in ELA 5 of those students were not continuously enrolled since the Fall Census Day
Numerator
Proficient and advanced on CAPA in ELA for students
continuously enrolled 56 - 5 = 51
Denominator
STAR enrollment on the first day of testing for students
continuously enrolled 5,060 - 60 = 5,000
Rate
CAPA percent proficient rate for ELA:
51 ÷ 5,000 = 1.02%
The LEA in this example is above the CAPA 1.0 percent rate for ELA because 1.02 percent is greater than 1.0 percent. The numerator only includes CAPA scores used to calculate the percent proficient or above and the denominator includes all students in the grades assessed. There is no rounding in determining the percent (e.g., 1.04 is not 1.0, and since this exceeds the cap, one proficient student would be reassigned as not proficient).
CMA 2.0 Percent Cap
On April 9, 2007, federal regulations were adopted that set a cap of 2.0 percent on the percentage of students in LEAs, including direct funded charter schools, whose scores can be counted as proficient or above based on an assessment using modified achievement standards. The modified assessment used in California is the CMA, which is designed for students with mild to moderate disabilities. The proficient and advanced level scores above the cap must be counted as not proficient in AYP calculations. This 2.0 percent cap may be exceeded if the LEA is below the CAPA 1.0 percent cap.
Automatic Exemption for Small LEAsThe only exemption for exceeding the CMA cap is provided to small LEAs. AnyLEA with ten or fewer valid CMA scores in a content area (ELA or mathematics)or five or fewer valid proficient and advanced CMA scores in a content areareceives an automatic exemption.
California Department of Education August 2013 49

2 0 1 3 A D E Q U A T E Y E A R L Y P R O G R E S S R E P O R T I N F O R M A T I O N G U I D E
How the Percent Proficient Rate is Calculated
The percent proficient rate for CMA follows the same calculation rules as the ratefor CAPA. The CMA percent proficient rate is calculated using the followingformula:
Numerator = Number of 2013 CMA scores in the proficient and advancedlevels in grades three through eight in ELA or three through eight inmathematics from students who were continuously enrolled in the LEAsince the Fall Census Day.
Denominator = 2013 STAR enrollment on the first day of testing in gradesthree through eight in ELA or three through eight in mathematics forstudents who were continuously enrolled in the LEA since the Fall CensusDay.
The rate is calculated separately for ELA and mathematics. The numerator only includes scores used to calculate the percent proficient or above, and the denominator includes all students in the grades assessed. There is no rounding in determining the percent (i.e., 1.09 is not 1.1).
Flexibility in the 1.0 and 2.0 Percent Caps
The federal regulations provide LEAs some flexibility in applying the 1.0 and 2.0 percent caps by allowing a combined cap of 3.0 percent. An LEA may exceed the 3.0 percent cap if granted a CAPA 1.0 percent cap exception. The following table summarizes the circumstances when an LEA can exceed the caps but avoid reassignment of scores.
When Can an LEA Exceed the 1.0, 2.0, and 3.0 Percent Caps? CAPA – 1% Cap CMA – 2% Cap CAPA and CMA – 3% Cap
Only if granted an exception by the State.
Only if LEA is below 1% cap. If not below 1% cap, never.
Only if granted an exception to the 1% cap by the State, and only by the
amount of the exception.
How to Calculate the CMA Cap
The CMA cap may vary according to the extent to which an LEA is above or below the CAPA 1.0 percent cap. The table on the following page shows five examples of how the flexibility rules are applied and how the CMA cap is determined based on an LEA’s percent proficient or above on CAPA.
California Department of Education August 2013 50

2 0 1 3 A D E Q U A T E Y E A R L Y P R O G R E S S R E P O R T I N F O R M A T I O N G U I D E
Five Examples of Applying 1.0, 2.0, and 3.0 Percent Caps
Example LEAs
Percent Proficient and Above
Scores
on CAPA
Percent CAPA Cap
Percent Proficient and Above
Scores
on CMA
Percent CMA Cap
Percent Proficient and Advanced
Scores Reassigned asNot Proficient
LEA A Exceeds the 2.0% cap 0.9 1.0 2.6 2.1 0.5 CMA scores
LEA B Exceeds the 2.0% cap 0.7 1.0 2.3 2.3 0
LEA C Exceeds the 1.0% cap, not granted exception
1.4 1.0 1.5 2.0 0.4 CAPA scores
LEA D Exceeds both the 1.0% and 2.0% caps, not granted CAPA exception
1.3 1.0 2.6 2.0 0.3 CAPA scores 0.6 CMA scores
LEA E
Exceeds the 1.0% cap and granted exception
1.3 1.0 2.0 2.0 0
The description for each example LEA is provided below:
Description for LEA A:This LEA does not exceed the 1.0 percent CAPA cap; it is 0.1 percent under thecap. However, LEA A exceeds the 2.0 percent CMA cap by 0.6 percent. Since anLEA may exceed the 2.0 percent cap by the amount it is below the 1.0 percentcap, the LEA only needs 0.5 percent of its proficient and advanced scoresreassigned to not proficient (0.9 percent + 2.6 percent = 3.5 percent – 3.0percent = 0.5 percent).
Description for LEA B:This LEA is under the 1.0 percent CAPA cap by 0.3 percent and over the 2.0percent CMA cap by 0.3 percent. An LEA may exceed the 2.0 percent cap aslong as it does not have more than a total of 3.0 percent proficient and advancedscores from both assessments. In this case, LEA B does not exceed that 3.0percent limit so it does not need any scores reassigned.
California Department of Education August 2013 51

2 0 1 3 A D E Q U A T E Y E A R L Y P R O G R E S S R E P O R T I N F O R M A T I O N G U I D E
Description for LEA C:This LEA exceeds the 1.0 percent CAPA cap by 0.4 percent, but is under the 2.0percent CMA cap by 0.5 percent. An LEA may not exceed the 1.0 percent cap(unless the LEA is granted an exception), even if it has less than 2.0 percent ofproficient and advanced scores on the CMA. Therefore, LEA C has 0.4 percentof its proficient and advanced scores from the CAPA that must be reassigned tonot proficient.
Description for LEA D:This LEA exceeds both the 1.0 percent and 2.0 percent caps (by 0.3 and 0.6percent, respectively). Therefore, LEA D has 0.9 percent of its proficient andadvanced scores from its assessments that must be reassigned to not proficient.(1.3 percent + 2.6 percent = 3.9 percent - 3.0 percent = .9 percent). Note that 0.3percent must be from CAPA scores since LEA D was 0.3 percent over the 1.0percent cap and 0.6 percent must be from CMA scores.
Description for LEA E:This LEA exceeds the 1.0 percent CAPA cap by 0.3 percent. However, the LEAis granted a CAPA exception by the State. Because the LEA has an exceptionand has only 2.0 percent of proficient and advanced CMA scores, it does notneed any scores reassigned.
Reassignment of Scores Exceeding the Caps
Without an approved CAPA exception, proficient and advanced alternate assessment scores that exceed the 1.0 or 2.0 percent caps must be counted as not proficient in the AYP calculations for the applicable schools and LEAs. An equitable and efficient method to identify the particular student records to be reassigned in an LEA was developed to address this issue. Reassignment in this section refers to the process of identifying and changing student scores from proficient or advanced to not proficient. It should be noted the reassignments are only applicable to AYP calculations at the school and LEA levels; individual student scores do not change. Reassignment of scores for AYP purposes do not affect scores used to calculate the API. Reassignments are done separately for ELA and mathematics.
Reassignment of Scores Exceeding 1.0 or 2.0 Percent Caps
The same procedure is used to reassign scores that exceed the 1.0 percentCAPA cap or the 2.0 percent CMA cap in an LEA. In order to accomplish thereassignment process, records of students who took the CAPA or CMA in anLEA are reassigned separately by test (CAPA or CMA) and by content area (ELAand mathematics). For each test and content area in the LEA, the number ofscores that must be reassigned is determined. The number of scores that mustbe reassigned is the number in excess of the 1.0 or 2.0 percent cap. (See “Howthe Percent Proficient Rate is Calculated” on page 50.) Next, the advanced and
California Department of Education August 2013 52

2 0 1 3 A D E Q U A T E Y E A R L Y P R O G R E S S R E P O R T I N F O R M A T I O N G U I D E
proficient scores in the LEA are identified. Reassignment of those advanced and proficient scores then occurs in the following order:
1. Student scores in the school district program are reassigned first. Thesestudent records show a school code of ‘0000001.’
2. Student scores that have not been enrolled in a school continuously sincethe Fall Census Day are reassigned next.
3. Student scores with records that show a blank district of residence code orshow a CD code that is the same as the CD code where the student wastested are reassigned next.
4. Scores of all other students are reassigned last.
Within each of the four groups above, scores of advanced students are reassigned first, and scores of proficient students are reassigned second. The reassignments are done in priority order from the highest to the lowest scale score. In the event that there are several students with the same scale score, reassignment occurs in the following order:
1. Student records showing a missing date of birth are reassigned first.
2. Student records with the most recent date of birth are reassigned first,followed by the next most recent date of birth, and so on, until the leastrecent date of birth is reassigned.
3. Student records with the lowest Statewide Student Identifier (SSID) arereassigned first, followed by the next highest SSID, and so on, until thehighest SSID is reassigned.
Example of Reassignment
An example of the method for reassigning scores is described in this section. Thechart on the following page shows an LEA’s percent proficient rate for the CAPAin ELA and the number of scores that must be reassigned.
California Department of Education August 2013 53

2 0 1 3 A D E Q U A T E Y E A R L Y P R O G R E S S R E P O R T I N F O R M A T I O N G U I D E
Saturn Unified School District
Numerator
Proficient and advanced on CAPA in ELA for students
continuously enrolled: 160 – 10 = 150
STAR enrollment on the first day of testing for students
continuously enrolled: 11,000 – 1,000 = 10,000
Denominator Rate
CAPA percent proficient rate for ELA:
150 ÷ 10,000 = 1.5%
The LEA shows the following data: 11,000 students enrolled on the first day of testing 1,000 of those students not continuously enrolled since the Fall Census Day 160 students with CAPA scores at proficient or advanced in ELA 10 of those students were not continuously enrolled since the Fall Census Day
50 scores to be reassigned(i.e., changed from proficient or advanced to not proficient)
In the chart on the previous page, 150 students were continuously enrolled in the LEA and scored proficient or advanced on the CAPA in ELA. These 150 students represent the total pool of students whose scores may be reassigned. Scores from 50 of the total pool of 150 students in the LEA must be reassigned from proficient or advanced to not proficient.
Reassignments in this example LEA are done as follows:
1. Of the 150 students, two students were in the school district program andare reassigned first.
2. Twenty students have not been enrolled in a school continuously since theFall Census Day and are reassigned next.
3. Twenty more students had a blank district of residence code and arereassigned after that.
4. The remaining eight reassignments are made among all other studentrecords in the LEA who have not yet been reassigned and who werecontinuously enrolled and scored proficient or advanced on the CAPA inELA. The following paragraph describes how the remaining eightreassignments are made.
To reassign the remaining eight student scores, it is necessary to examine the remaining pool of scores. Of the 150 total pool of students, 42 of the scores have
California Department of Education August 2013 54
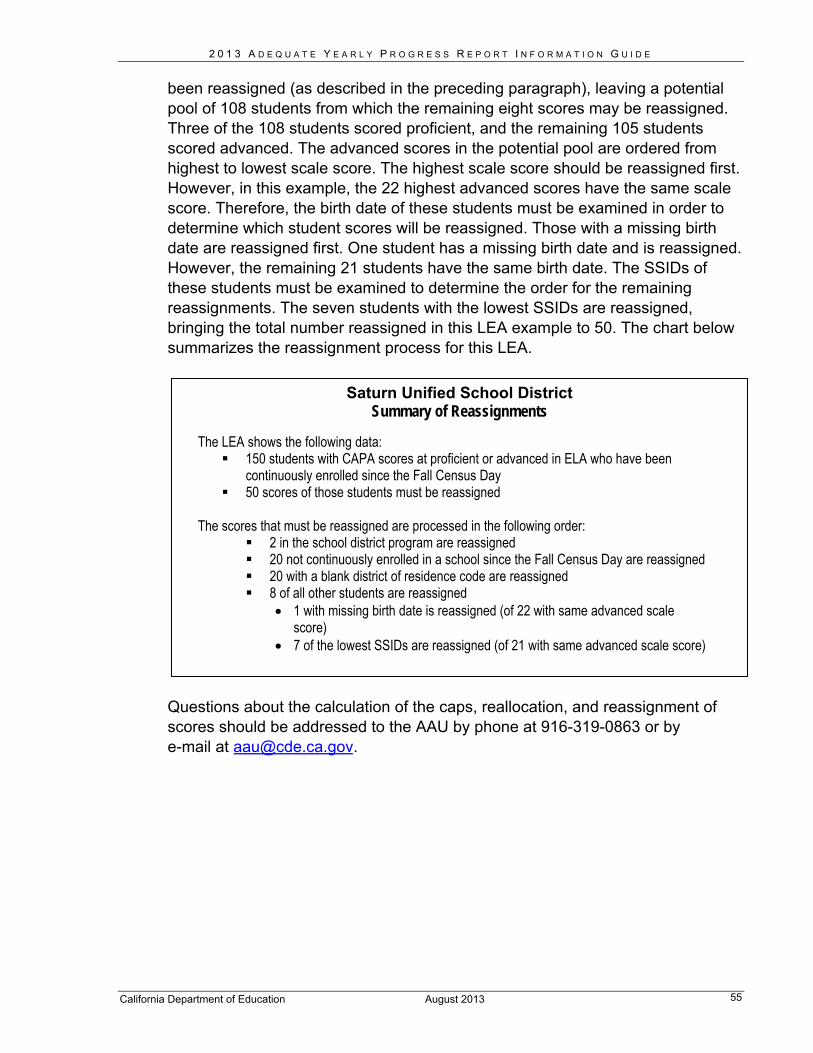
2 0 1 3 A D E Q U A T E Y E A R L Y P R O G R E S S R E P O R T I N F O R M A T I O N G U I D E
been reassigned (as described in the preceding paragraph), leaving a potential pool of 108 students from which the remaining eight scores may be reassigned. Three of the 108 students scored proficient, and the remaining 105 students scored advanced. The advanced scores in the potential pool are ordered from highest to lowest scale score. The highest scale score should be reassigned first. However, in this example, the 22 highest advanced scores have the same scale score. Therefore, the birth date of these students must be examined in order to determine which student scores will be reassigned. Those with a missing birth date are reassigned first. One student has a missing birth date and is reassigned. However, the remaining 21 students have the same birth date. The SSIDs of these students must be examined to determine the order for the remaining reassignments. The seven students with the lowest SSIDs are reassigned, bringing the total number reassigned in this LEA example to 50. The chart below summarizes the reassignment process for this LEA.
Saturn Unified School District Summary of Reassignments
The LEA shows the following data: 150 students with CAPA scores at proficient or advanced in ELA who have been
continuously enrolled since the Fall Census Day 50 scores of those students must be reassigned
The scores that must be reassigned are processed in the following order: 2 in the school district program are reassigned 20 not continuously enrolled in a school since the Fall Census Day are reassigned 20 with a blank district of residence code are reassigned 8 of all other students are reassigned
1 with missing birth date is reassigned (of 22 with same advanced scalescore)
7 of the lowest SSIDs are reassigned (of 21 with same advanced scale score)
Questions about the calculation of the caps, reallocation, and reassignment of scores should be addressed to the AAU by phone at 916-319-0863 or by e-mail at [email protected].
California Department of Education August 2013 55
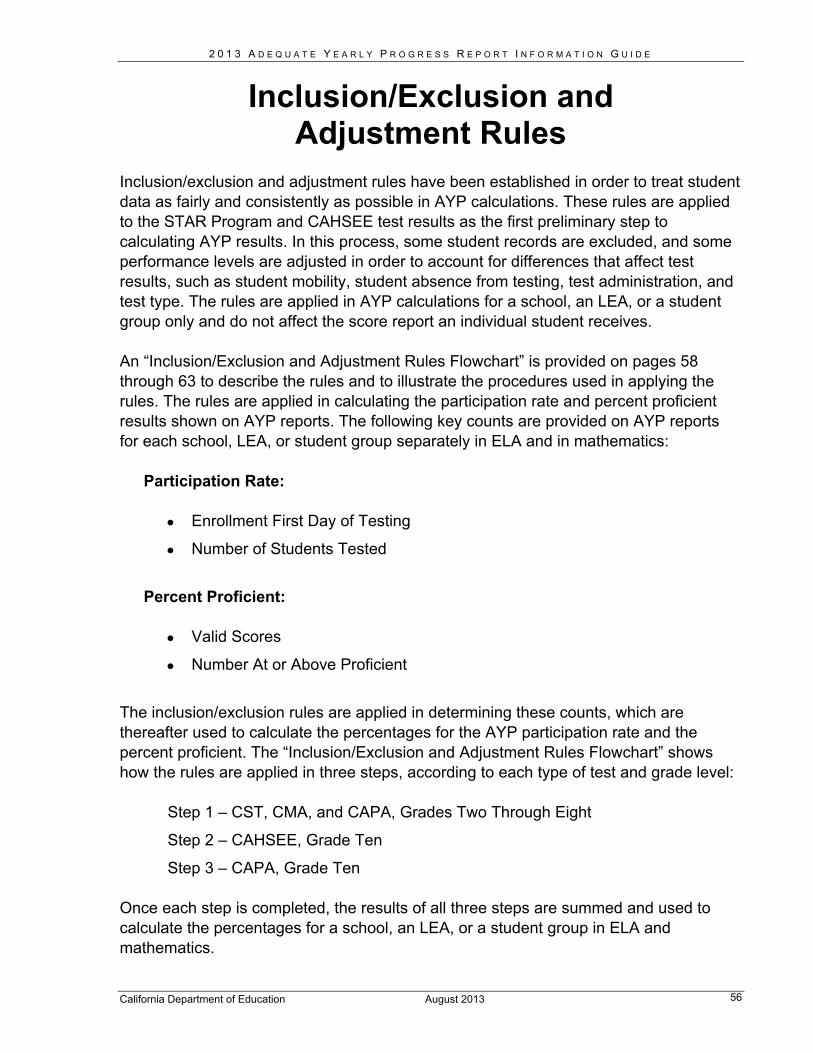
2 0 1 3 A D E Q U A T E Y E A R L Y P R O G R E S S R E P O R T I N F O R M A T I O N G U I D E
Inclusion/Exclusion and Adjustment Rules
Inclusion/exclusion and adjustment rules have been established in order to treat student data as fairly and consistently as possible in AYP calculations. These rules are applied to the STAR Program and CAHSEE test results as the first preliminary step to calculating AYP results. In this process, some student records are excluded, and some performance levels are adjusted in order to account for differences that affect test results, such as student mobility, student absence from testing, test administration, and test type. The rules are applied in AYP calculations for a school, an LEA, or a student group only and do not affect the score report an individual student receives.
An “Inclusion/Exclusion and Adjustment Rules Flowchart” is provided on pages 58 through 63 to describe the rules and to illustrate the procedures used in applying the rules. The rules are applied in calculating the participation rate and percent proficient results shown on AYP reports. The following key counts are provided on AYP reports for each school, LEA, or student group separately in ELA and in mathematics:
Participation Rate:
Enrollment First Day of Testing
Number of Students Tested
Percent Proficient:
Valid Scores
Number At or Above Proficient
The inclusion/exclusion rules are applied in determining these counts, which are thereafter used to calculate the percentages for the AYP participation rate and the percent proficient. The “Inclusion/Exclusion and Adjustment Rules Flowchart” shows how the rules are applied in three steps, according to each type of test and grade level:
Step 1 – CST, CMA, and CAPA, Grades Two Through Eight
Step 2 – CAHSEE, Grade Ten
Step 3 – CAPA, Grade Ten
Once each step is completed, the results of all three steps are summed and used to calculate the percentages for a school, an LEA, or a student group in ELA and mathematics.
California Department of Education August 2013 56

2 0 1 3 A D E Q U A T E Y E A R L Y P R O G R E S S R E P O R T I N F O R M A T I O N G U I D E
Tools for Using the Flowchart
The following flowcharts include references to testing codes and CAHSEE census/makeup matching that are considered when applying inclusion/exclusion rules. Reference information is located in separate sections:
“Testing Codes Considered in AYP Calculations” are provided onpages 64 and 65.
“CAHSEE Matching Rules” are provided on page 66.
“Score” in the flowchart refers to a performance level of advanced, proficient, basic, below basic, or far below basic on the CSTs, CMA, or the CAPA. For AYP, proficient or above on the CAHSEE is a scale score of at least 380 for ELA or mathematics, except if a SWD took the mathematics test with a calculator. These students are counted as tested and in the number of valid scores, but their score results are counted as proficient only if the scale score was 388 or above for the February administration, or 387 or above for the March administration, or 385 or above for the May administration. Inclusion/exclusion and adjustment rules for AYP calculations may not always match the procedures used for the API or generating the STAR Program or CAHSEE summary reports.
California Department of Education August 2013 57
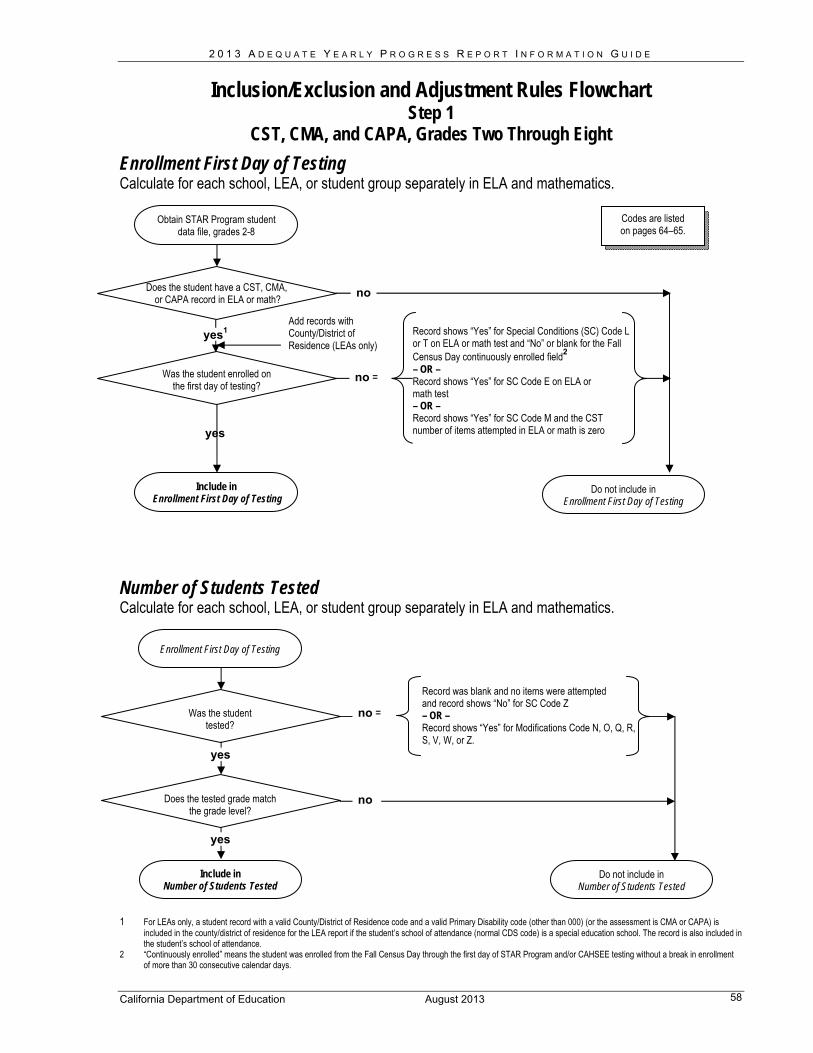
2 0 1 3 A D E Q U A T E Y E A R L Y P R O G R E S S R E P O R T I N F O R M A T I O N G U I D E
Inclusion/Exclusion and Adjustment Rules Flowchart Step 1
CST, CMA, and CAPA, Grades Two Through Eight
Enrollment First Day of Testing Calculate for each school, LEA, or student group separately in ELA and mathematics.
California Department of Education August 2013 58
Codes are listed on pages 64–65.
Record shows “Yes” for Special Conditions (SC) Code L or T on ELA or math test and “No” or blank for the Fall Census Day continuously enrolled field2
– OR – Record shows “Yes” for SC Code E on ELA or math test – OR – Record shows “Yes” for SC Code M and the CST number of items attempted in ELA or math is zero
yes1
yes
no =
no
Add records with County/District of Residence (LEAs only)
Does the student have a CST, CMA, or CAPA record in ELA or math?
Obtain STAR Program student data file, grades 2-8
Was the student enrolled on the first day of testing?
Do not include in Enrollment First Day of Testing
Include in Enrollment First Day of Testing
Number of Students Tested Calculate for each school, LEA, or student group separately in ELA and mathematics.
Enrollment First Day of Testing
1 For LEAs only, a student record with a valid County/District of Residence code and a valid Primary Disability code (other than 000) (or the assessment is CMA or CAPA) is included in the county/district of residence for the LEA report if the student’s school of attendance (normal CDS code) is a special education school. The record is also included in the student’s school of attendance.
2 “Continuously enrolled” means the student was enrolled from the Fall Census Day through the first day of STAR Program and/or CAHSEE testing without a break in enrollment of more than 30 consecutive calendar days.
Was the student tested?
yes
yes
Does the tested grade match the grade level?
Include in Number of Students Tested
no
Do not include in Number of Students Tested
no =
Record was blank and no items were attempted and record shows “No” for SC Code Z – OR – Record shows “Yes” for Modifications Code N, O, Q, R, S, V, W, or Z.

2 0 1 3 A D E Q U A T E Y E A R L Y P R O G R E S S R E P O R T I N F O R M A T I O N G U I D E
Inclusion/Exclusion and Adjustment Rules Flowchart Step 1 (continued)
CST, CMA, and CAPA, Grades Two Through Eight Valid Scores Calculate for each school, LEA, or student group separately in ELA and mathematics.
Codes are listed on pages 64–65.
Number of Students Tested
Do not include in Valid Scores
No3 =
CALPADS record shows (1) student enrolled after Fall Census Day or (2) student enrolled before Fall Census Day with a break in enrollment of more than 30 consecutive calendar days – OR – If the student was an EL, record shows the student was first enrolled in a U.S. school after March 15 of the year prior to testing
Include in Valid Scores
Yes4
Was the student continuously enrolled for a full academic year?
Number At or Above Proficient Calculate for each school, LEA, or student group separately in ELA and mathematics.
Is the performance level proficient or above?
yes
yes
Valid Scores
Is the record free of testing irregularities?
Include in Number At or Above Proficient
no =
Do not include in Number At or Above Proficient
no
Record shows “Yes” for adult testing irregularities, inappropriate test preparation, and/or SC Code C
3 If the SSID on the student answer document is missing or the SSID on the student answer document does not match to an SSID in CALPADS, the student will be considered continuously enrolled.
4 Mobility/Continuous Enrollment Rule: If the student has been continuously enrolled in a school, the student is counted in the school AYP. If the student has been continuously enrolled in the LEA, the student is counted in the LEA AYP.
California Department of Education August 2013 59

2 0 1 3 A D E Q U A T E Y E A R L Y P R O G R E S S R E P O R T I N F O R M A T I O N G U I D E
Inclusion/Exclusion and Adjustment Rules Flowchart Step 2
CAHSEE, Grade Ten Enrollment First Day of Testing Calculate for each school, LEA, or student group separately in ELA and mathematics.
Obtain CAHSEE student data file with student records.5
Codes are listed on pages 64–65.
Is this a tested makeup record from March or May
matched to an untested census record?6
Does the student have a CAHSEE record in ELA or math?
yes
yes
yes
Is this a grade 10 record?
Is this a census record from February or March?
Do not include in Enrollment First Day of Testing
Include in Enrollment First Day of Testing
no = Record is grade 11 or 12
yes
Was the student enrolled for CAHSEE testing? no = Record shows “Yes” for CAHSEE Code E, M, R, or T
no7
no
no
Number of Students Tested Calculate for each school, LEA, or student group separately in ELA and mathematics.
Was the student tested?
Enrollment First Day of Testing
Do not include in Number of Students Tested
No8 =
Record was blank and no items were attempted – OR – Record shows “Yes” for CAHSEE Code A, X, or I – OR – Record shows student took CAPA
Include in Number of Students Tested
yes
5 The number of CAHSEE census student answer documents, grade ten, is used to determine enrollment for students who take CAHSEE and CAPA. 6 The tested makeup record takes the place of the untested census record when they are matched by SSID. A tested makeup record does not show
CAHSEE Code A, E, M, R, or T. An untested census record shows CAHSEE Code A or E. If a record has no census or makeup flag, it is treated as census. If a school has no February or March records marked as census, then all records are treated as census.
7 This record is either a census record tested in May or a makeup only record and is not included in enrollment. 8 If the student record shows that a calculator was used for mathematics, it is not considered a modification (CAHSEE Code I).
California Department of Education August 2013 60
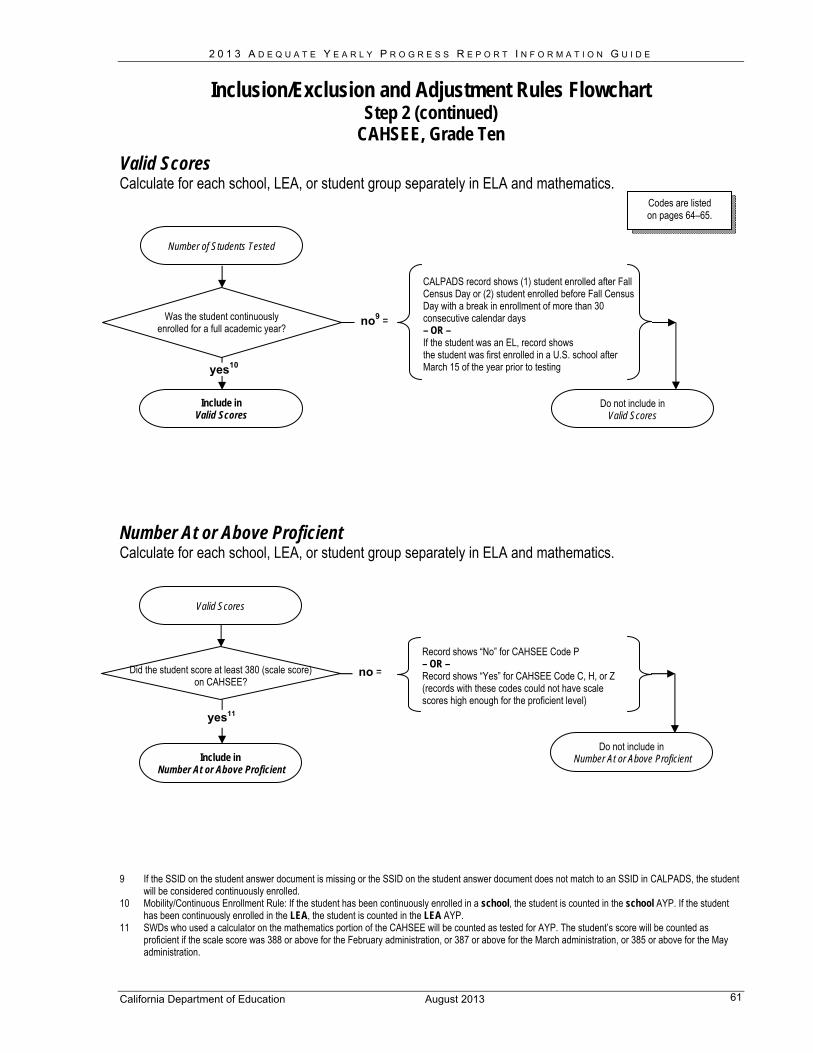
2 0 1 3 A D E Q U A T E Y E A R L Y P R O G R E S S R E P O R T I N F O R M A T I O N G U I D E
Inclusion/Exclusion and Adjustment Rules Flowchart Step 2 (continued)
CAHSEE, Grade Ten Valid Scores Calculate for each school, LEA, or student group separately in ELA and mathematics.
Codes are listed on pages 64–65.
Was the student continuously enrolled for a full academic year?
Number of Students Tested
Do not include in Valid Scores
no9 =
CALPADS record shows (1) student enrolled after Fall Census Day or (2) student enrolled before Fall Census Day with a break in enrollment of more than 30 consecutive calendar days – OR – If the student was an EL, record shows the student was first enrolled in a U.S. school after March 15 of the year prior to testing
Include in Valid Scores
yes10
Number At or Above Proficient Calculate for each school, LEA, or student group separately in ELA and mathematics.
Did the student score at least 380 (scale score) on CAHSEE?
Valid Scores
Do not include in Number At or Above Proficient Include in
Number At or Above Proficient
no = Record shows “No” for CAHSEE Code P – OR – Record shows “Yes” for CAHSEE Code C, H, or Z (records with these codes could not have scale scores high enough for the proficient level)
yes11
9 If the SSID on the student answer document is missing or the SSID on the student answer document does not match to an SSID in CALPADS, the student will be considered continuously enrolled.
10 Mobility/Continuous Enrollment Rule: If the student has been continuously enrolled in a school, the student is counted in the school AYP. If the student has been continuously enrolled in the LEA, the student is counted in the LEA AYP.
11 SWDs who used a calculator on the mathematics portion of the CAHSEE will be counted as tested for AYP. The student’s score will be counted as proficient if the scale score was 388 or above for the February administration, or 387 or above for the March administration, or 385 or above for the May administration.
California Department of Education August 2013 61

2 0 1 3 A D E Q U A T E Y E A R L Y P R O G R E S S R E P O R T I N F O R M A T I O N G U I D E
Inclusion/Exclusion and Adjustment Rules Flowchart Step 3
CAPA, Grade Ten Enrollment First Day of Testing Calculate for each school, LEA, or student group separately in ELA and mathematics.
The number of CAHSEE census student answer documents, grade 10, are used to determine enrollment
both for students who take CAHSEE and for students who take CAPA. The enrollment on the first day of testing for
CAPA students is included in Enrollment First Day of Testing, shown under Step 2 on page 60.
Number of Students Tested Calculate for each school, LEA, or student group separately in ELA and mathematics.
California Department of Education August 2013 62
Obtain CAPA student data file, grade 10
yes
Was the student tested?
Record was blank and no items were attempted Do not include in – AND – Number of Students Tested no = Student was not marked as present with no questions answered
Include in Number of Students Tested

2 0 1 3 A D E Q U A T E Y E A R L Y P R O G R E S S R E P O R T I N F O R M A T I O N G U I D E
Inclusion/Exclusion and Adjustment Rules Flowchart Step 3 (continued) CAPA, Grade Ten
Valid Scores Calculate for each school, LEA, or student group separately in ELA and mathematics.
Codes are listed on pages 64–65.
Was the student continuously enrolled for a full academic year?
yes13
Number of Students Tested
Do not include in Valid Scores
no12 =
CALPADS record shows (1) student enrolled after Fall Census Day or (2) student enrolled before Fall Census Day with a break in enrollment of more than 30 consecutive calendar days – OR – If the student was an EL, record shows the student was first enrolled in a U.S. school after March 15 of the year prior to testing
Include in Valid Scores
Number At or Above Proficient Calculate for each school, LEA, or student group separately in ELA and mathematics.
Is the performance level proficient or above?
yes
yes
Valid Scores
Is the record free of testing irregularities?
Include in Number At or Above Proficient
no =
Do not include in Number At or Above Proficient
no14
Record shows “Yes” for adult testing irregularities, inappropriate test preparation, and/or SC Code C
12 If the SSID on the student answer document is missing or the SSID on the student answer document does not match to an SSID in CALPADS, the student will be considered continuously enrolled.
13 Mobility/Continuous Enrollment Rule: If the student has been continuously enrolled in a school, the student is counted in the school AYP. If the student has been continuously enrolled in the LEA, the student is counted in the LEA AYP.
14 Results of records counted as tested but without a valid performance level are counted as not proficient for the content area.
California Department of Education August 2013 63

2 0 1 3 A D E Q U A T E Y E A R L Y P R O G R E S S R E P O R T I N F O R M A T I O N G U I D E
Testing Codes Considered in AYP Calculations
The following listing shows the STAR Program and CAHSEE testing codes that are considered in AYP calculations. STAR Program accommodations codes are not listed because records with those codes would have no AYP adjustments.
STAR Program Special Conditions Codes
(C) Student observed cheating(E) Not tested due to significant medical emergency(L) Enrolled after first day and was tested(M) Took some tests but moved before these tests were administered(T) Enrolled during testing and tested at previous school(Z) Tested but marked no answers
STAR Program Modifications Codes (CSTs only)
(N) Student used a dictionary(O) Test examiner used Manually Coded English or American Sign Language
(ASL) to present test questions to student(Q) Student used a calculator(R) Student used an arithmetic table(S) Student used math manipulatives(T) Student used word processing software with spelling and grammar check
tools enabled(U) Student dictated responses to a scribe that provided all spelling and
language conventions(V) Student used assistive device that interfered with the independent work of
the student(W) Student used an unlisted modification(Z) Student heard test examiner read test questions or text in Writing Prompt
aloud (audio CD presentation not used)
California Department of Education August 2013 64

2 0 1 3 A D E Q U A T E Y E A R L Y P R O G R E S S R E P O R T I N F O R M A T I O N G U I D E
The following codes are considered for each content area (for the CSTs only):
ELA = N, O, P, V, W, Z Mathematics = N, Q, R, S, V, W
Irregularities
There were adult testing irregularities (Box A1–Scoring Use Only–Row 1)
There was inappropriate test preparation (Box A1–Scoring Use Only–Row 2)
Special Testing Conditions Code (C) Student observed cheating
CAHSEE Codes (Grade Ten Census Only)
CAHSEE Codes and Inclusions/Exclusions for AYP
Codes Enrolled First
Day of Testing**
Tested** Valid Scores**
Percent Proficient**
(A) Absent Yes No No No (C) Score invalidated (cheating) Yes Yes Yes No (E) Not tested due to significant
medical emergency No No No No
(H) Pending (on hold or cancelled) Yes Yes Yes No (I) Modified (modification used) Yes No* No* No* (M) Moved day of testing No No No No (N) Not passed Yes Yes Yes No
(P) Passed Yes Yes Yes Yes, with scale score of at least
380* (R) Previously satisfied requirement No No No No (X) Not attempted Yes No, unless
items attempted No No (T) Tested before No No No No (Z) Not attempted (0 responses) Yes Yes Yes No
* Exception: An SWD with a CAHSEE Code I (modification used) who used a calculator on CAHSEE mathematics will be countedas tested and in the number of valid scores. The student’s score will be counted as proficient if the scale score was 388 or abovefor the February administration, or 387 or above for the March administration, or 385 or above for the May administration.(Passing scores vary by test administration dates.)
** Included in AYP calculations
California Department of Education August 2013 65
2 0 1 3 A D E Q U A T E Y E A R L Y P R O G R E S S R E P O R T I N F O R M A T I O N G U I D E
CAHSEE Matching Rules
CAHSEE census and makeup records have the following matching rules:
Rule 1: Same District; Two Different Schools; Same SSID
A tested make-up record from School B is matched with an untested census record at School A in the same district. The untested census record is dropped from School A and the make-up record is counted as March census at School B. No district adjustment is needed.
Rule 2: Two Different Districts; Same SSID
A make-up record from District E is matched with an untested census record at a District F. The untested census record is dropped from District F (and from the District F school) and the make-up record is counted as March census at District E (and at the District E school). Both district and school level adjustments are made.
Rule 3: Same CDS Code; Same SSID (Duplicate Records)
A tested census record is matched with a second tested census record or with a tested make-up record from the same school or district in the same content area. The first tested record is counted and the duplicate record is dropped.
California Department of Education August 2013 66

2 0 1 3 A D E Q U A T E Y E A R L Y P R O G R E S S R E P O R T I N F O R M A T I O N G U I D E
Program Improvement
School Accountability Identification of Schools for PI
The ESEA requires that all schools annually meet AYP criteria. Schools that receive Title I funds will be identified for PI if they do not meet AYP criteria for two consecutive years in the same subject area or for two consecutive years on the same indicator. (Note: Failing in a subject area at the school level or in any student group means that the school failed to make AYP in the subject area. For example, if a school fails to meet the AYP criteria in ELA for one student group one year and fails ELA for a different student group in the subsequent year, the school is considered to have failed to make AYP in ELA for two consecutive years.)
The PI requirements of ESEA do not apply to schools that do not receive Title I funds. A school must receive Title I funds for two consecutive years before it is considered for PI identification. PI determinations are based on the prior two years of Title I funding. For example, 2013–14 PI determinations are based on receipt of Title I funds during the 2012–13 and 2011–12 school years. Schools in PI that are no longer receiving Title I funds in the current year (i.e., 2013–14) are not required to implement PI activities.
LEAs have the primary responsibility to identify PI schools and to notify parents or guardians of students enrolled in the school of the school’s PI status. LEAs should identify Title I schools as either PI or not PI based on their 2013 AYP results and the 2012–13 PI identification criteria shown in the table below. Examples of PI identification are also provided on the following page for clarification. The 2013–14 PI status of schools (and LEAs) based on 2012 and 2013 AYP results may be confirmed by consulting the 2013–14 PI report. The following table shows the PI identification criteria for Title I schools.
PI Identification Criteria for Title I Schools
A Title I school will be identified for PI when, for each of two consecutive years, the school:
Does not make AYP in the same content area (ELA or mathematics)
– or –
Does not make AYP on the same indicator (API or graduation rate)
California Department of Education August 2013 67

2 0 1 3 A D E Q U A T E Y E A R L Y P R O G R E S S R E P O R T I N F O R M A T I O N G U I D E
Four Examples of PI Identification of Title I Schools
Content Area
Example 1
Little Dipper Elementary
Met all criteria except percent proficient
(AMO) in ELA
Met all criteria except participation rate
in ELA
2012 2013
Was the same content area
Identified if percent proficient (AMO) or
participation rate not met for two
consecutive years in the same
content area Identified for PI
Example 2
Big Dipper Elementary
Met all criteria except percent proficient
(AMO) in ELA
Met all criteria except percent proficient
(AMO) in mathematics
2012 2013
Was not the same content area
Identified if percent proficient (AMO) or
participation rate not met for two
consecutive years in the same
content area Not Identified for PI
Indicator
California Department of Education August 2013 68
Example 3
North Star High
Met all criteria except API requirement
Met all criteria except graduation rate
requirement
2012 2013
Was not the same indicator
Identified if same indicator (API or graduation rate) not met for two
consecutive years Not Identified for PI
Example 4
Jupiter High
Met all criteria except graduation rate requirement
Met all criteria except graduation rate
requirement
2012 2013
Was the same indicator
Identified if same indicator (API or graduation rate) not met for two
consecutive years Identified for PI

2 0 1 3 A D E Q U A T E Y E A R L Y P R O G R E S S R E P O R T I N F O R M A T I O N G U I D E
Schools Already in PI
Three options for schools that have been identified for PI are as follows:
Advancing in PI
A school that begins the school year in PI and does not meet all AYP criteria (i.e., participation rate, AMOs, API as an additional indicator, and graduation rate, if applicable) for that school year will advance to the next year of PI. For example, a school that implemented Year 1 of PI during the 2012–13 school year and did not meet all 2013 AYP criteria will advance to Year 2 of PI during 2013–14. This school must continue the interventions that began during Year 1 and begin those interventions required in Year 2.
Maintaining PI Status
A school that begins the school year in PI and meets all AYP criteria (i.e., participation rate, AMOs, API as an additional indicator, and graduation rate, if applicable) for that school year will maintain the same PI status for the next school year. For example, a school that implemented Year 1 of PI during the 2012–13 school year and met all 2013 AYP criteria will maintain Year 1 of PI during 2013–14. This school must continue the same interventions begun during Year 1.
Exiting PI
A school will exit PI if it makes AYP for two consecutive years. A school that has exited PI will not be subject to Title I corrective actions or other ESEA sanctions in the school year following PI exit. For example, a school that was in PI during the 2012–13 school year and met all 2012 and 2013 criteria will exit PI at the end of the 2012–13 academic year and is not subject to Title I corrective action or other ESEA sanctions during the 2013–14 academic year.
California Department of Education August 2013 69

2 0 1 3 A D E Q U A T E Y E A R L Y P R O G R E S S R E P O R T I N F O R M A T I O N G U I D E
LEA Accountability Identification of LEAs for PI
ESEA requires the CDE to annually review the performance of each LEA receiving Title I funds. The CDE must identify for PI any LEA that has not made AYP for two consecutive years in the same subject area and in each grade span, or for two consecutive years on the same indicator. The requirements of ESEA to identify LEAs for PI do not apply to LEAs that do not receive Title I funds. An LEA must receive Title I funds for two consecutive years before it is considered for PI identification. PI determinations are based on the prior two years of Title I funding. For example, 2013– 14 PI determinations are based on receipt of Title I funds during the 2012–13 and 2011–12 school years. LEAs in PI that are no longer receiving Title I funds in the current year (i.e., 2013–14) are not required to implement PI activities.
Currently, school districts, direct funded charter schools, and COEs are LEAs that are eligible to receive Title I funds. However, single school districts and direct funded charter schools are treated as schools (not as LEAs) for AYP and PI identification purposes. For these school districts and charter schools, refer to information about school PI identification on pages 67 through 69. PI information for LEAs is included in the 2013–14 PI reports.
PI Identification Criteria for Title I LEAs
An LEA receiving Title I funds will be identified for PI status when, for each of two consecutive years, the LEA:
Does not make AYP in the same content area (ELA or mathematics) and does not meet AYPcriteria in the same content area in each grade span (grades two through five, grades six througheight, and grade ten)– or –
Does not make AYP on the same indicator (API for all school types or graduation rate for highschools)
LEA PI Identification Alternative Methods
LEA PI identification uses alternative methods for grade spans. The CDE uses the same alternative methods when calculating AYP at the grade span level as it uses in determining whether or not a school or an LEA has made AYP. These include:
SH = Passed by safe harbor: The application of safe harbor for grade spans. Aconfidence interval of 75 percent is applied to safe harbor calculations.
California Department of Education August 2013 70

2 0 1 3 A D E Q U A T E Y E A R L Y P R O G R E S S R E P O R T I N F O R M A T I O N G U I D E
CI = Passed using confidence intervals: The use of a 99 percent confidenceinterval in the overall AYP determination for grade spans with fewer than 100valid scores, but not for numerically significant student groups within grade spanswith fewer than 100 valid scores.
Y2 = Passed by using 2-year average: The use of two-year averaging indetermining whether a grade span or numerically significant student group withina grade span has met the participation rate or the percentage proficient criteria.
Y3 = Passed by using 3-year average: The use of three-year averaging indetermining whether a grade span or numerically significant student group withina grade span has met the participation rate or the percentage proficient criteria.
Four Examples of PI Identification of Title I LEAs
Identifying LEAs for PI is a two-step test. First, Test 1 is applied. Under Test 1, achievement data of LEAs that receive Title I funds are aggregated to the LEA level to determine which LEAs missed AYP in the same content area or on the same additional indicator for two consecutive years. Only LEAs that missed criteria for the same content area or indicator over two consecutive years would be identified for PI, as shown in examples 1 and 2. In the case of example 1, Test 2 would not apply. In example 2, LEAs that missed criteria for the same additional indicator for two consecutive years are identified for PI. In this case, Test 2 also would not apply.
Indicator
Example 1
Orion Unified School District
Test 1
Met all criteria except API requirement
Met all criteria except percent proficient for all students in ELA
2012 2013
Was not the same indicator
Not Identified for PI
Example 2
Jupiter County Office of Education
Test 1
Met all criteria except graduation rate requirement
Met all criteria except graduation rate
requirement
2012 2013
Was the same indicator
Identified for PI (Test 2 does not apply)
Examples 1 and 2 show LEAs that did not require Test 2. The following page, however, shows examples 3 and 4 in which Test 2 is applied. Example 3 illustrates an LEA that
California Department of Education August 2013 71

2 0 1 3 A D E Q U A T E Y E A R L Y P R O G R E S S R E P O R T I N F O R M A T I O N G U I D E
missed the same content area (ELA) for two consecutive years. In this case, the process moves from Test 1 to Test 2. Under Test 2, the LEA results are disaggregated by grade spans. LEAs that missed some content area criteria, but not for all grade spans, over two consecutive years are not identified for PI, as shown in example 3. LEAs that missed the content area criteria are identified for PI if all grade spans missed AYP in the same content area for two consecutive years, as shown in example 4.
The AMO targets for grade spans two through five and six through eight are the same as those used for elementary and middle schools (shown on page 20). The AMO targets for grade ten are the same as those used for high schools (shown on page 21).
Content Area
California Department of Education August 2013 72
2011 2012
2011 2012
Example 3
Mars High School District
Test 1
Test 2
Met all criteria except participation
rate in ELA
Met all criteria except percent proficient
in ELA
Was the same content area
Move to Test 2
All grade spans missed participation
rate in ELA
Elementary and middle grade spans missed percent proficient in
ELA, but high school grade span made
participation rate and percent proficient in
ELA
One grade span made AYP in same
content area
Not identified as PI
2012
2012
2013
2013
Example 4
Galaxy Unified School District
Test 1
Test 2
Met all criteria except participation
rate in ELA
Met all criteria except percent proficient
in ELA
2012 2013
Move to Test 2
All grade spans missed participation
rate in ELA
Elementary grade span missed percent
proficient in ELA, and middle and high school
grade spans missed participation rates
in ELA
2012 2013
Missed the same content area for all grade spans in both
years
Identified as PI
Was the same content area

2 0 1 3 A D E Q U A T E Y E A R L Y P R O G R E S S R E P O R T I N F O R M A T I O N G U I D E
The following two tables summarize the results of example 4:
Example 4 LEA PI Identification Summary
Test 1: Overall LEA Performance
Year Met AYP for ELA Met AYP for Mathematics 2012 No Yes 2013 No Yes
The LEA missed AYP for two consecutive years in ELA. Proceed to Test 2.
Test 2: Grade Span Performance
Grade Level 2012 Met AYP for ELA 2012 Met AYP for Mathematics
Grades 2–5 No Yes
Grades 6–8 No No
Grade 10 No Yes
Grade Level 2013 Met AYP for ELA 2013 Met AYP for Mathematics
Grades 2–5 No Yes
Grades 6–8 No No
Grade 10 No Yes
All grade spans missed AYP in ELA for two consecutive years. Therefore, the LEA is identified for PI because the LEA and all grade spans missed AYP for two consecutive years in ELA. (If the “Met AYP for ELA” column had “Yes” for one or more grade spans, the LEA would not be identified for PI.)
LEAs Already in PI
Similar to schools identified for PI, LEAs that are identified for PI have three options: advancing in PI, maintaining PI status, and exiting PI. The grade span criteria only is applied when initially identifying LEAs for PI and is not applied when determining if LEAs advance in their PI status, maintain their PI status, or exit PI.
Advancing in PI
An LEA that begins the school year in PI and does not meet all AYP criteria (i.e.,participation rate, AMOs, API as an additional indicator, and graduation rate, if
California Department of Education August 2013 73

2 0 1 3 A D E Q U A T E Y E A R L Y P R O G R E S S R E P O R T I N F O R M A T I O N G U I D E
applicable) for that school year will advance to the next year of PI status. For example, an LEA that implemented Year 1 of PI during the 2012–13 school year and did not meet all 2013 AYP criteria will advance to Year 2 of PI during 2013– 14. This LEA must continue to implement the plan developed in Year 1.
Maintaining PI Status
An LEA that begins the school year in PI and meets all AYP criteria (i.e.,participation rate, AMOs, API as an additional indicator, and graduation rate, ifapplicable) for that school year will maintain the same PI status for the nextschool year. For example, an LEA that implemented Year 1 of PI during the2012–13 school year and met all 2013 AYP criteria will maintain Year 1 statusduring 2013–14. This LEA must continue to implement the plan developed inYear 1.
Exiting PI
An LEA will exit PI if it makes AYP for two consecutive years. An LEA that hasexited PI will not be subject to Title I corrective actions or other ESEA sanctions.For example, an LEA that was in PI during the 2012–13 school year and met all2012 and 2013 criteria will exit PI at the end of the 2012–13 academic year andis not subject to Title I corrective action or other ESEA sanctions during the2013–14 academic year.
California Department of Education August 2013 74
2 0 1 3 A D E Q U A T E Y E A R L Y P R O G R E S S R E P O R T I N F O R M A T I O N G U I D E
School and LEA Accountability Breaks in Title I Funding
Normally, schools and LEAs receive Title I federal funding on a continual basis to meet the educational needs of low–achieving students in California's highest–poverty schools. However, occasionally, schools or LEAs may have a break in their funding and regain funding in a subsequent year. Beginning with the 2007–08 school year, the CDE began tracking breaks in Title I funding.
A school or an LEA must receive Title I funds for two consecutive years before it is considered for PI identification. If a school or LEA is in PI, but subsequently has a break in Title I funding, the school or LEA is not required to continue PI activities during the period in which no funds are received. If a school or LEA is in PI, during the initial year of a break in Title I funding, the school or LEA will continue being reported as “In PI” because the PI status and placement are based on the prior year’s AYP and Title I funding data. When a school or LEA regains Title I funding after a break, it will retain the same PI placement that was last reported. For example, a school that was last reported with a PI placement of Year 1 prior to a break in Title I funding would retain the same Year 1 PI placement upon regaining Title I funding. A school with a PI placement of Year 2 would retain Year 2 PI placement upon regaining Title I funding; and so on. This rule is applicable for up to three years only, unless the school or LEA makes AYP for two consecutive years. If a school or LEA makes AYP for two consecutive years, it will exit PI when it regains funding. A school or an LEA with a break in funding of three years or longer would begin with a designation of “Not in PI” once it regains Title I funding, regardless of the PI status and placement prior to the break in funding. Thus, a school or LEA could not be identified for PI again until it missed AYP for two consecutive years.
Changes to PI Status
Each year, various data review and correction processes are provided for LEAs to correct demographic data errors that occur as part of statewide testing and the subsequent reporting of accountability data. The CDE revises the accountability reports after demographic corrections are made. In addition, updates and corrections to accountability reports also occur due to other reasons, such as late testing by LEAs, appeal decisions, or other testing and accountability processes. When data are re-released, the appeal window opens for schools or LEAs with changes in AYP or PI status. Some schools or LEAs may be identified for PI after the initial AYP release. In these cases, the school or LEA must immediately implement the required PI activities.
California Department of Education August 2013 75

2 0 1 3 A D E Q U A T E Y E A R L Y P R O G R E S S R E P O R T I N F O R M A T I O N G U I D E
CDE Contacts and Related Internet Pages
California Department of Education August 2013 76
Topics Contact Offices Web Pages
• API and AYP Calculations, andAYP Appeals
• PI Data and ASAM
• Title III Accountability
• STAR Program – CST, CMA,CAPA, and STS
• CAHSEE
• Awards Programs
Analysis, Measurement, and Accountability Reporting Division 916-319-0869
Academic Accountability Unit [email protected]
Evaluation, Research, and Analysis Unit 916-322-3245
Title III Accountability [email protected]
Assessment Development and Administration Division 916-319-0572
STAR Program and Assessment Transition Office [email protected]
High School and Physical Fitness Assessment Office [email protected]
Awards Unit [email protected]
http://www.cde.ca.gov/ta/ac/ap/
http://www.cde.ca.gov/ta/ac/ay/
http://www.cde.ca.gov/ta/ac/ay/tidatafiles.asp http://www.cde.ca.gov/ta/ac/am/
http://www.cde.ca.gov/ta/ac/t3/
http://www.startest.org/sts.html
http://www.cde.ca.gov/ta/tg/hs/
http://www.cde.ca.gov/ta/sr/

Topics Contact Offices Web Pages
• ESEA Requirements for PI andTechnical Assistance for Schoolsand LEAs in PI
• Quality Education Investment Act(QEIA)
• Information on CALPADS
• Access to DataQuest
• Educational Options
• Special Education ProgrammaticIssues Related to Assessment
• Charter Schools
Improvement and Accountability Division
District Innovation and Improvement Office 916-319-0836
School Turnaround Office 916-319-0833
Educational Data Management Division 916-324-1214
CALPADS/CBEDS/CDS Operations Office [email protected]
Data Reporting Office 916-327-0193
Coordinated Student Support and Adult Education Division
Educational Options, Student Support, and American Indian Office 916-323-2183
Special Education Division
Assessment, Evaluation, and Support Office 916-445-4628
Charter Schools Division
http://www.cde.ca.gov/ta/lp/qe/
http://www.cde.ca.gov/ds/sp/cl/index.asp
http://dq.cde.ca.gov/dataquest/
http://www.cde.ca.gov/sp/eo/
http://www.cde.ca.gov/sp/se/
http://www.cde.ca.gov/sp/cs/
2 0 1 3 A D E Q U A T E Y E A R L Y P R O G R E S S R E P O R T I N F O R M A T I O N G U I D E
California Department of Education August 2013 77

2 0 1 3 A D E Q U A T E Y E A R L Y P R O G R E S S R E P O R T I N F O R M A T I O N G U I D E
Acronyms AAU Academic Accountability Unit
AMAO Annual Measurable Achievement Objective Analysis, Measurement, and Accountability Reporting AMARD Division
AMO Annual Measurable Objective
API Academic Performance Index
APR Accountability Progress Reporting
ASAM Alternative Schools Accountability Model
AYP Adequate Yearly Progress
CAHSEE California High School Exit Examination
CALPADS California Longitudinal Pupil Achievement Data System
CAPA California Alternate Performance Assessment
CBEDS California Basic Educational Data System
CCR California Code of Regulations
CDE California Department of Education
CD Code County-District Code
CDS Code County-District-School Code
CELDT California English Language Development Test
CMA California Modified Assessment
COE County Office of Education
CST California Standards Test
EC Education Code
ED U.S. Department of Education
EL English Learner
ELA English-language arts
ERAU Evaluation, Research, and Analysis Unit
ESEA Elementary and Secondary Education Act
IDEA Individuals with Disabilities Education Act
IEP Individualized Education Program
LEA Local Educational Agency
California Department of Education August 2013 78

2 0 1 3 A D E Q U A T E Y E A R L Y P R O G R E S S R E P O R T I N F O R M A T I O N G U I D E
Acronyms (Continued)NSLP National School Lunch Program
NSS Numerically Significant Student Group
ODS Operational Data Store
PI Program Improvement
RFEP Reclassified Fluent English Proficient
SBE State Board of Education
SC Special Conditions
SED Socioeconomically Disadvantaged
SL Schoolwide or LEA-wide
SSID Statewide Student Identifier
STAR Program Standardized Testing and Reporting Program
SWD Students with Disabilities
California Department of Education August 2013 79