how adequate yearly progress (ayp) is determined using 2012-13 data
DESCRIPTION
The New York State Education Department. How Adequate Yearly Progress (AYP) Is Determined Using 2012-13 Data. July 11, 2013. Accountability Measures. - PowerPoint PPT PresentationTRANSCRIPT
How Adequate Yearly Progress (AYP) Is Determined
Using 2012-13 Data
The New York State Education Department
July 11, 2013
2
Accountability Measures
At the elementary/middle level, New York State reports student proficiency in 1) English language arts (ELA), 2) mathematics, and 3) science. At the secondary level, New York State reports student proficiency in 1) ELA, 2) mathematics, and 3) graduation rate.
3
Accountability GroupsFor each accountability measure, New York State reports data on the following “accountability” groups:• All Students• American Indian or Alaska Native Students• Black or African American Students• Hispanic or Latino Students• Asian or Native Hawaiian/Other Pacific Islander Students• White Students• Multiracial Students• Students with Disabilities*• Limited English Proficient (LEP) Students (also known as English Language Learners – ELLs)*• Economically Disadvantaged Students*
*Students are included in the Students with Disabilities, LEP Students, or Economically Disadvantaged Students group if they were reported to the Department in the Student Information Repository System (SIRS) as being a member of the group at any time during the reporting year.
4
Non-AYP GroupsNew York State also reports data on the following “non-AYP” groups (i.e., groups for which AYP is not determined but for whom data are used to make some accountability determinations):
• Not American Indian or Alaska Native Students• Not Black or African American Students• Not Hispanic or Latino Students• Not Asian or Native Hawaiian/Other Pacific Islander Students• Not White Students• Not Multiracial Students• General-Education Students• English Proficient Students• Not Economically Disadvantaged Students• Male Students• Female Students• Migrant Students• Not Migrant Students
5
Adequate Yearly Progress: Participation and Performance
Schools and districts must meet pre-defined participation and performance criteria on New York State’s accountability measures to make Adequate Yearly Progress (AYP).
6
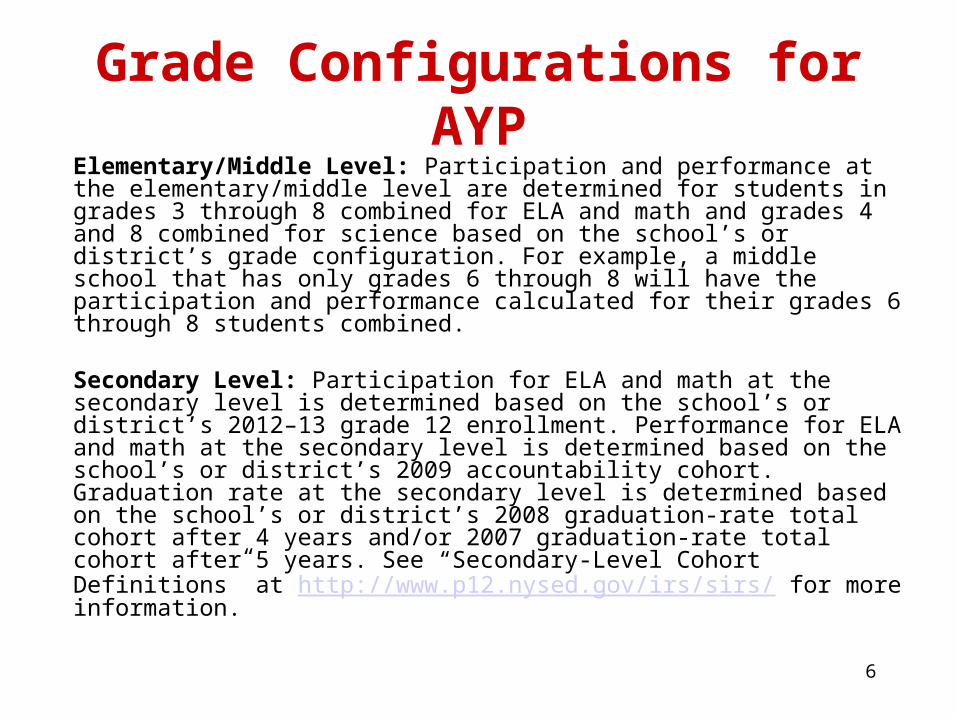
Grade Configurations for AYPElementary/Middle Level: Participation and performance at the elementary/middle level are determined for students in grades 3 through 8 combined for ELA and math and grades 4 and 8 combined for science based on the school’s or district’s grade configuration. For example, a middle school that has only grades 6 through 8 will have the participation and performance calculated for their grades 6 through 8 students combined.
Secondary Level: Participation for ELA and math at the secondary level is determined based on the school’s or district’s 2012–13 grade 12 enrollment. Performance for ELA and math at the secondary level is determined based on the school’s or district’s 2009 accountability cohort. Graduation rate at the secondary level is determined based on the school’s or district’s 2008 graduation-rate total cohort after 4 years and/or 2007 graduation-rate total cohort after 5 years. See “Secondary-Level Cohort Definitions” at http://www.p12.nysed.gov/irs/sirs/ for more information.
7
Participation Criterion
8
Participation CriterionElementary/Middle Level
For an accountability group with 40 or more students enrolled during the test administration period to meet the participation criterion in English language arts (ELA) or mathematics, 95 percent of these students must have valid scores on an appropriate assessment.
For an accountability group with 40 or more students enrolled during the test administration period to meet the participation criterion in science, 80 percent of these students must have valid scores on an appropriate assessment.
9
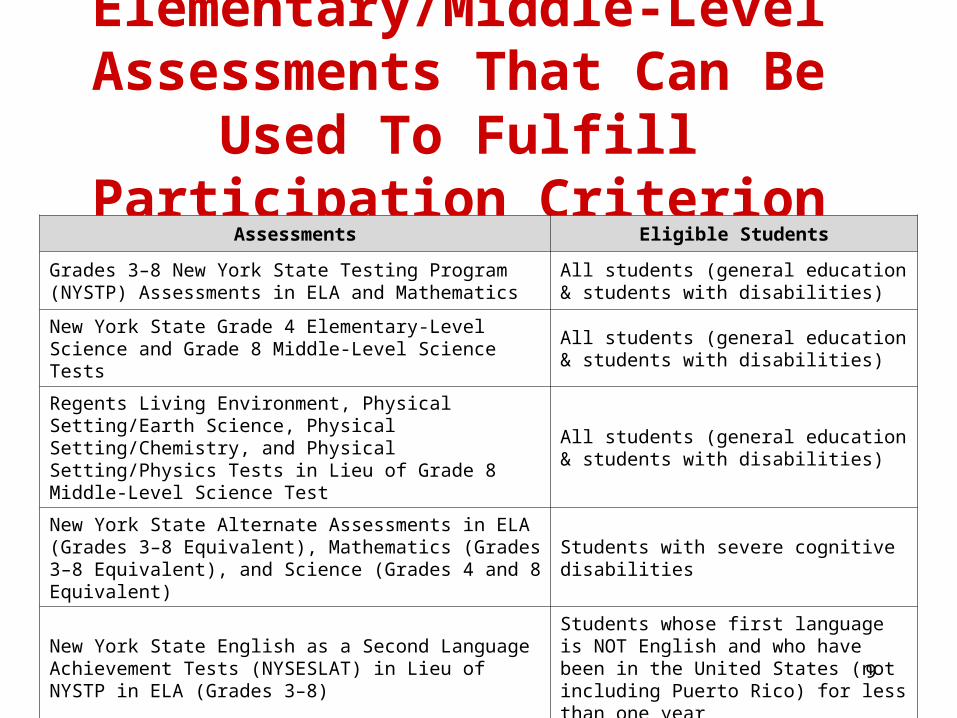
Elementary/Middle-Level Assessments That Can Be Used To Fulfill Participation Criterion
Assessments Eligible Students
Grades 3–8 New York State Testing Program (NYSTP) Assessments in ELA and Mathematics
All students (general education & students with disabilities)
New York State Grade 4 Elementary-Level Science and Grade 8 Middle-Level Science Tests
All students (general education & students with disabilities)
Regents Living Environment, Physical Setting/Earth Science, Physical Setting/Chemistry, and Physical Setting/Physics Tests in Lieu of Grade 8 Middle-Level Science Test
All students (general education & students with disabilities)
New York State Alternate Assessments in ELA (Grades 3–8 Equivalent), Mathematics (Grades 3–8 Equivalent), and Science (Grades 4 and 8 Equivalent)
Students with severe cognitive disabilities
New York State English as a Second Language Achievement Tests (NYSESLAT) in Lieu of NYSTP in ELA (Grades 3–8)
Students whose first language is NOT English and who have been in the United States (not including Puerto Rico) for less than one year
10
Participation CriterionSecondary Level
For an accountability group with 40 or more 12th graders to meet the participation criterion in English language arts (ELA) or mathematics, 95 percent of the 12th graders must have valid scores on Regents examinations (or approved alternatives), Regents competency tests (or approved alternatives), or New York State Alternate Assessments.
11
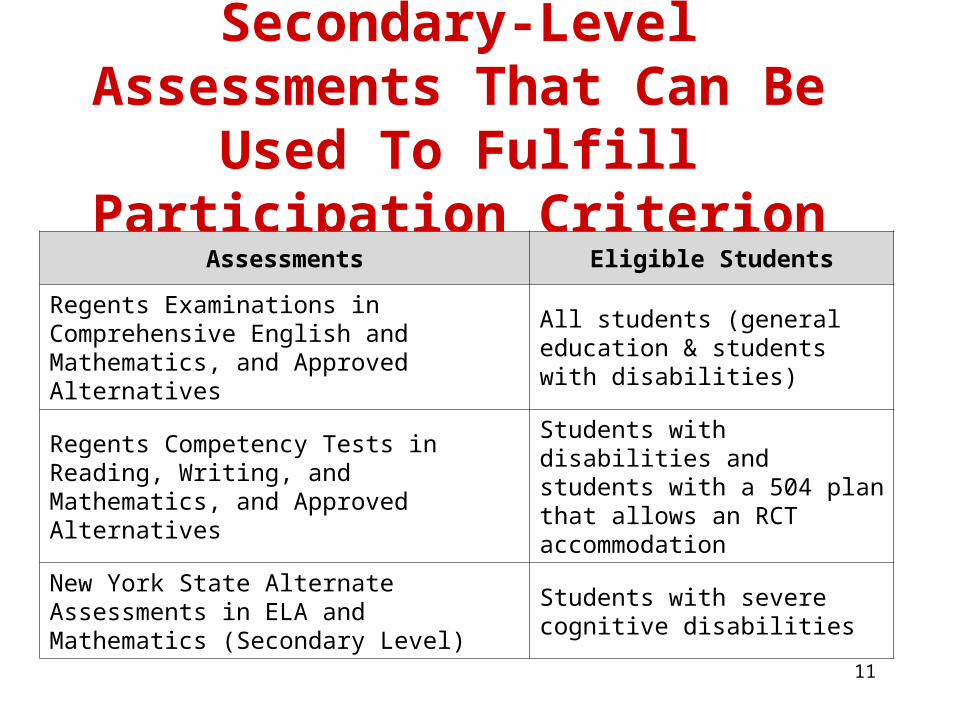
Secondary-Level Assessments That Can Be Used To Fulfill
Participation CriterionAssessments Eligible Students
Regents Examinations in Comprehensive English and Mathematics, and Approved Alternatives
All students (general education & students with disabilities)
Regents Competency Tests in Reading, Writing, and Mathematics, and Approved Alternatives
Students with disabilities and students with a 504 plan that allows an RCT accommodation
New York State Alternate Assessments in ELA and Mathematics (Secondary Level)
Students with severe cognitive disabilities
12
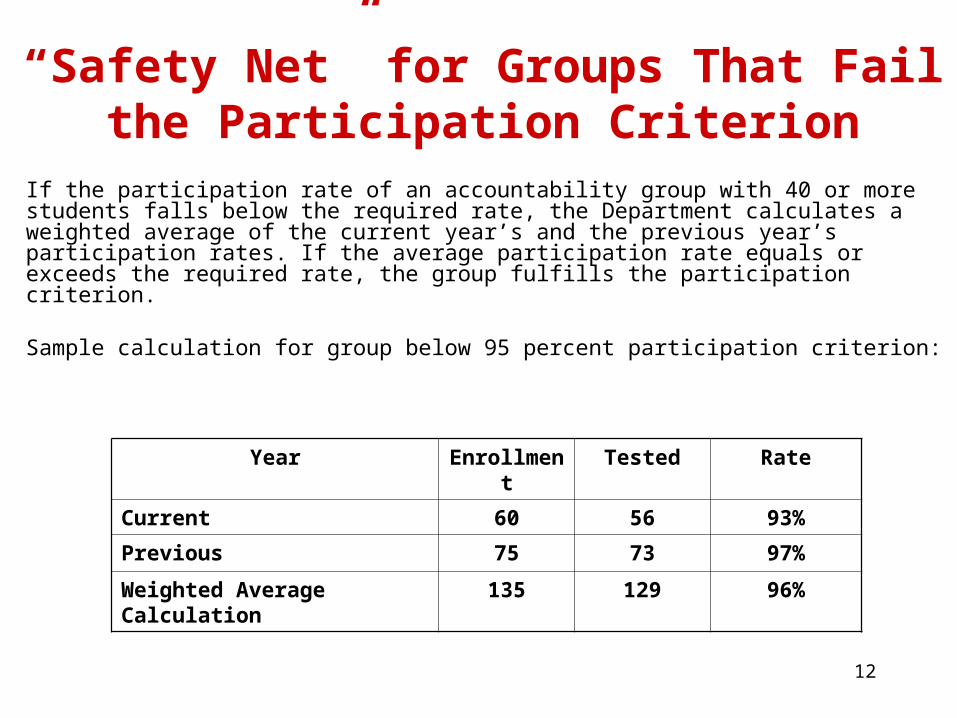
“Safety Net” for Groups That Fail the Participation Criterion
If the participation rate of an accountability group with 40 or more students falls below the required rate, the Department calculates a weighted average of the current year’s and the previous year’s participation rates. If the average participation rate equals or exceeds the required rate, the group fulfills the participation criterion.
Sample calculation for group below 95 percent participation criterion:
Year Enrollment Tested Rate
Current 60 56 93%
Previous 75 73 97%
Weighted Average Calculation 135 129 96%
13
Medically Excused
If a student in grades 3 through 8 is incapacitated by illness or injury during the entire test administration and make-up period for elementary/middle-level English language arts, mathematics, or science, the student is not counted in the numerator or the denominator when participation rates are calculated. To use this flexibility, the district must have on file documentation from a medical practitioner that the student was too incapacitated to be tested. This option is not applicable at the secondary level.
14
Performance Criterion:Performance Indices
15
Performance Index (PI)
A Performance Index (PI) is a value from 0 to 200 that is assigned to an accountability group, indicating how that group performed on a required State test (or approved alternative) in English language arts, mathematics, or science. PIs are determined using the performance levels and equations on the following slides.
16
Performance Levels Elementary/Middle-Level
ELA and MathematicsStudent performance in elementary/middle-level ELA and mathematics is determined using a Performance Index (PI) calculation. This calculation uses six levels of student achievement:
Level 1 On Track = Basic and On Track to ProficientLevel 1 Not On Track = Basic and NOT On Track to ProficientLevel 2 On Track = Basic Proficient and On Track to ProficientLevel 2 Not On Track = Basic Proficient and NOT On Track to ProficientLevel 3 = ProficientLevel 4 = Advanced
17
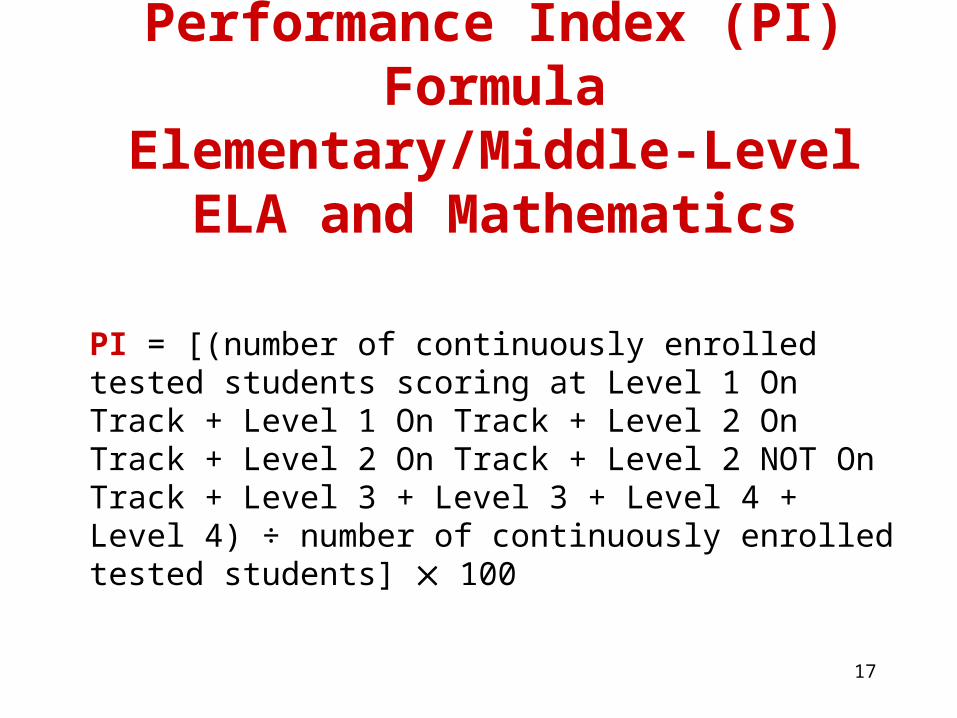
Performance Index (PI) FormulaElementary/Middle-Level
ELA and Mathematics
PI = [(number of continuously enrolled tested students scoring at Level 1 On Track + Level 1 On Track + Level 2 On Track + Level 2 On Track + Level 2 NOT On Track + Level 3 + Level 3 + Level 4 + Level 4) ÷ number of continuously enrolled tested students] 100
18
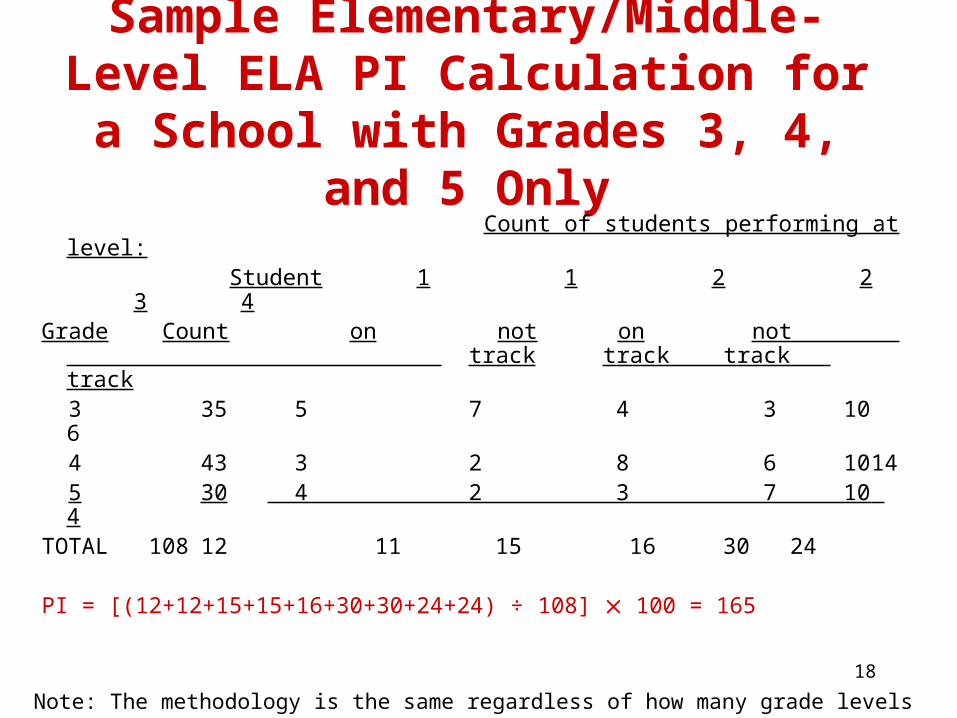
Sample Elementary/Middle-Level ELA PI Calculation for a School with
Grades 3, 4, and 5 Only Count of students performing at level: Student 1 1 2 2 3 4 Grade Count on not on not
track track track track 3 35 5 7 4 3 10 6 4 43 3 2 8 6 10 14 5 30 4 2 3 7 10 4TOTAL 108 12 11 15 16 30 24
PI = [(12+12+15+15+16+30+30+24+24) ÷ 108] 100 = 165
Note: The methodology is the same regardless of how many grade levels (3-8) a school serves.
19
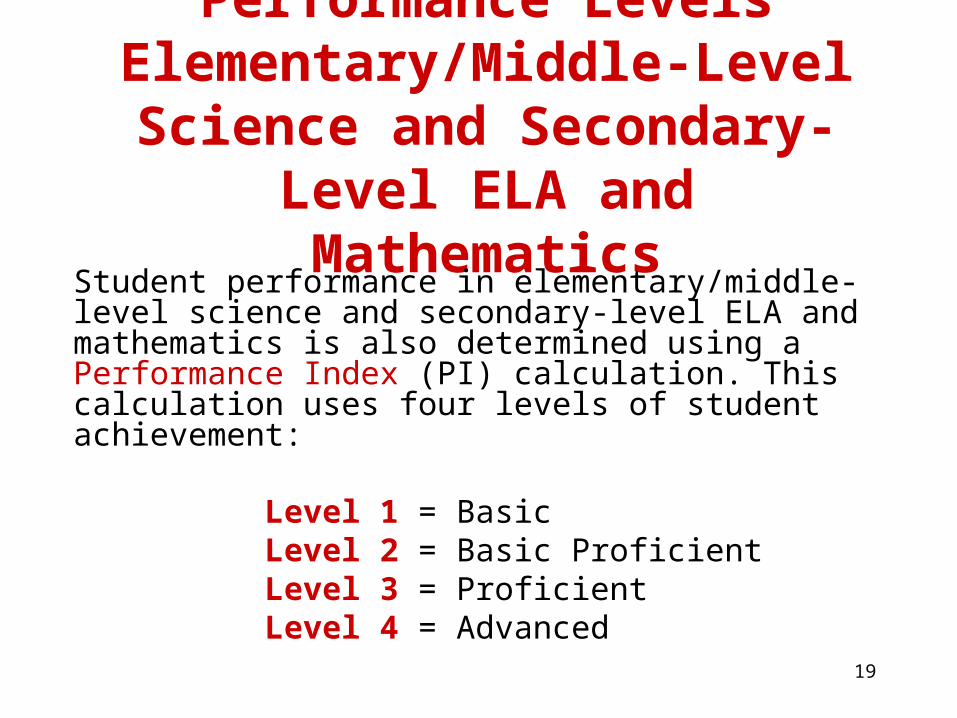
Performance Levels Elementary/Middle-Level
Science and Secondary-Level ELA and Mathematics
Student performance in elementary/middle-level science and secondary-level ELA and mathematics is also determined using a Performance Index (PI) calculation. This calculation uses four levels of student achievement:
Level 1 = BasicLevel 2 = Basic ProficientLevel 3 = ProficientLevel 4 = Advanced
20
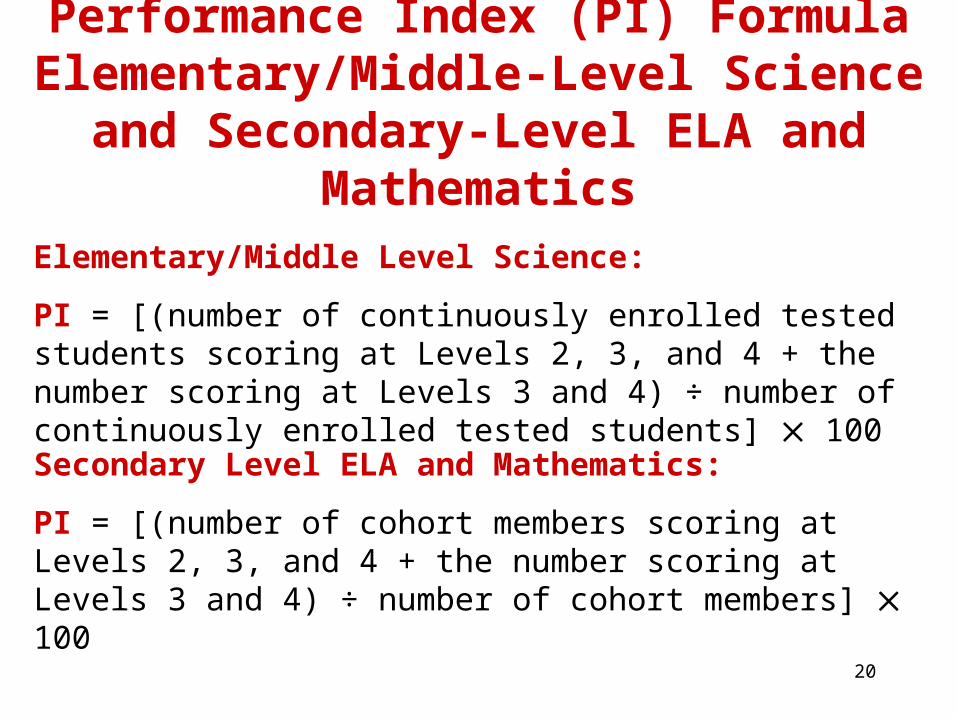
Performance Index (PI) FormulaElementary/Middle-Level Science and
Secondary-Level ELA and Mathematics
Elementary/Middle Level Science:
PI = [(number of continuously enrolled tested students scoring at Levels 2, 3, and 4 + the number scoring at Levels 3 and 4) ÷ number of continuously enrolled tested students] 100
Secondary Level ELA and Mathematics:
PI = [(number of cohort members scoring at Levels 2, 3, and 4 + the number scoring at Levels 3 and 4) ÷ number of cohort members] 100
21
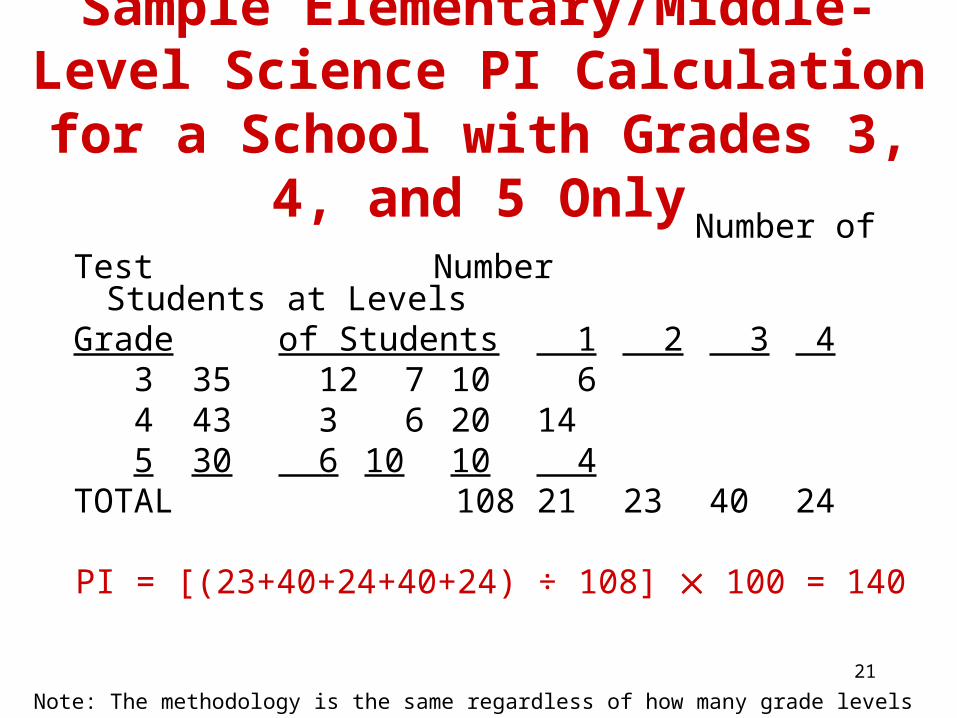
Sample Elementary/Middle-Level Science PI Calculation for a School
with Grades 3, 4, and 5 Only Number of Test Number Students at Levels Grade of Students 1 2 3 4 3 35 12 7 10 6 4 43 3 6 20 14 5 30 6 10 10 4TOTAL 108 21 23 40 24
PI = [(23+40+24+40+24) ÷ 108] 100 = 140
Note: The methodology is the same regardless of how many grade levels (3-8) a school serves.
22
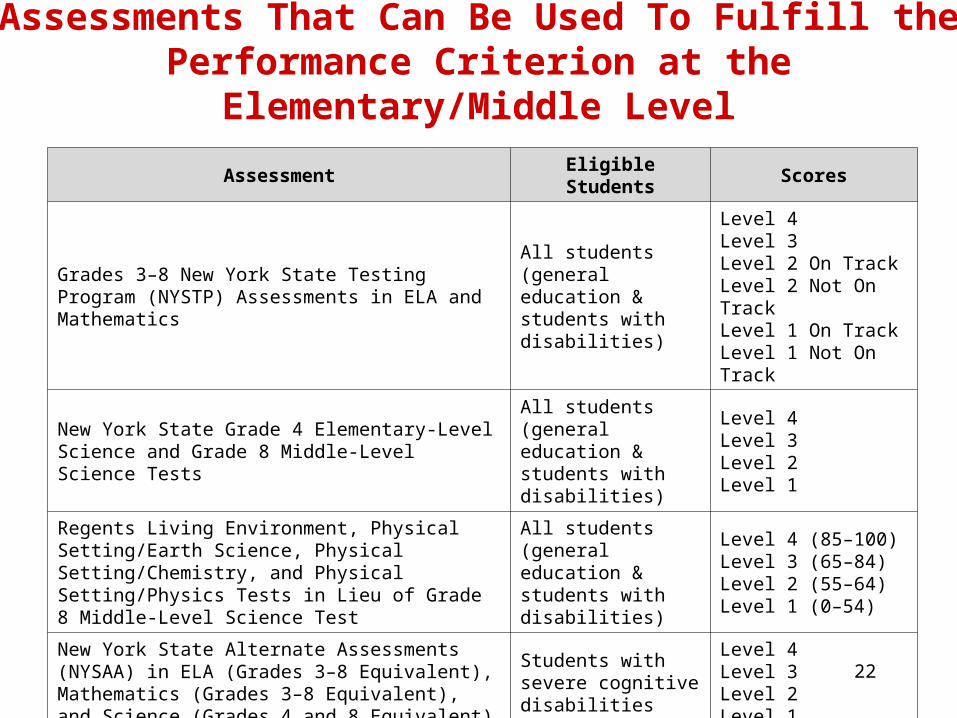
Assessments That Can Be Used To Fulfill the Performance Criterion at the Elementary/Middle Level
Assessment Eligible Students Scores
Grades 3–8 New York State Testing Program (NYSTP) Assessments in ELA and Mathematics
All students (general education & students with disabilities)
Level 4Level 3Level 2 On TrackLevel 2 Not On TrackLevel 1 On TrackLevel 1 Not On Track
New York State Grade 4 Elementary-Level Science and Grade 8 Middle-Level Science Tests
All students (general education & students with disabilities)
Level 4Level 3Level 2Level 1
Regents Living Environment, Physical Setting/Earth Science, Physical Setting/Chemistry, and Physical Setting/Physics Tests in Lieu of Grade 8 Middle-Level Science Test
All students (general education & students with disabilities)
Level 4 (85–100)Level 3 (65–84)Level 2 (55–64)Level 1 (0–54)
New York State Alternate Assessments (NYSAA) in ELA (Grades 3–8 Equivalent), Mathematics (Grades 3–8 Equivalent), and Science (Grades 4 and 8 Equivalent)
Students with severe cognitive disabilities
Level 4Level 3Level 2Level 1
23
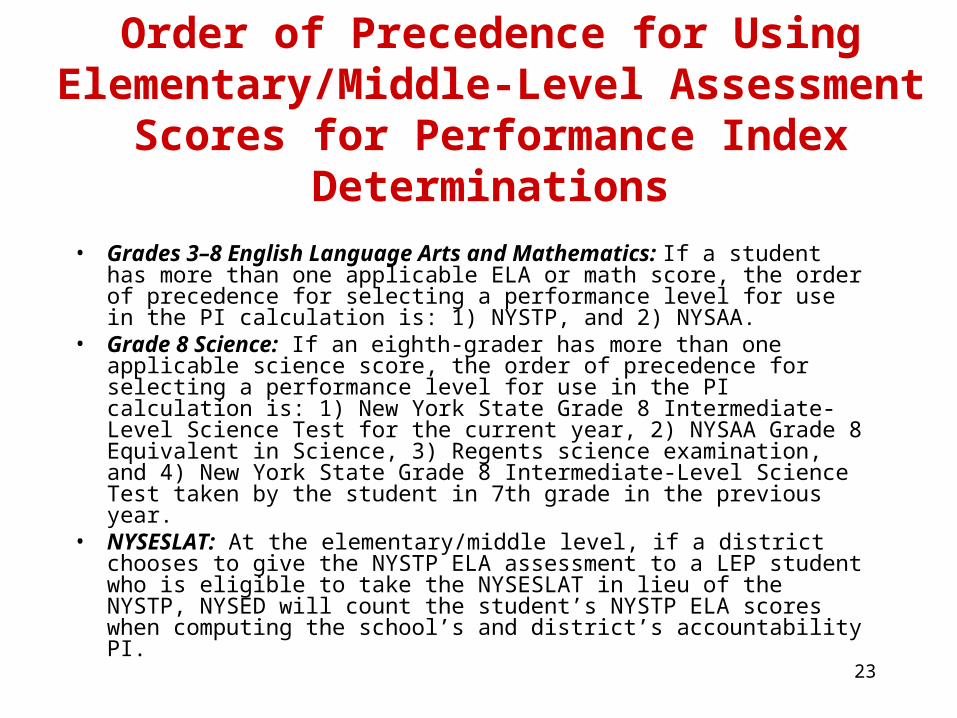
Order of Precedence for Using Elementary/Middle-Level Assessment
Scores for Performance Index Determinations
• Grades 3–8 English Language Arts and Mathematics: If a student has more than one applicable ELA or math score, the order of precedence for selecting a performance level for use in the PI calculation is: 1) NYSTP, and 2) NYSAA.
• Grade 8 Science: If an eighth-grader has more than one applicable science score, the order of precedence for selecting a performance level for use in the PI calculation is: 1) New York State Grade 8 Intermediate-Level Science Test for the current year, 2) NYSAA Grade 8 Equivalent in Science, 3) Regents science examination, and 4) New York State Grade 8 Intermediate-Level Science Test taken by the student in 7th grade in the previous year.
• NYSESLAT: At the elementary/middle level, if a district chooses to give the NYSTP ELA assessment to a LEP student who is eligible to take the NYSESLAT in lieu of the NYSTP, NYSED will count the student’s NYSTP ELA scores when computing the school’s and district’s accountability PI.
24
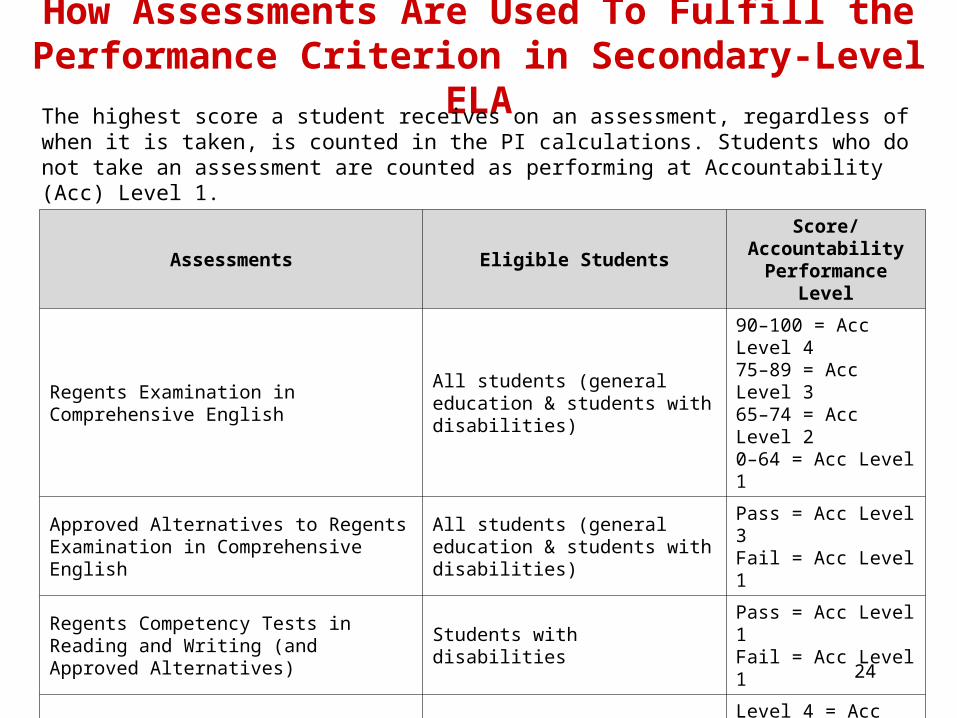
How Assessments Are Used To Fulfill the Performance Criterion in Secondary-Level ELA
The highest score a student receives on an assessment, regardless of when it is taken, is counted in the PI calculations. Students who do not take an assessment are counted as performing at Accountability (Acc) Level 1.
Assessments Eligible StudentsScore/
Accountability Performance Level
Regents Examination in Comprehensive English
All students (general education & students with disabilities)
90–100 = Acc Level 475–89 = Acc Level 365–74 = Acc Level 20–64 = Acc Level 1
Approved Alternatives to Regents Examination in Comprehensive English
All students (general education & students with disabilities)
Pass = Acc Level 3Fail = Acc Level 1
Regents Competency Tests in Reading and Writing (and Approved Alternatives)
Students with disabilitiesPass = Acc Level 1Fail = Acc Level 1
New York State Alternate Assessment in ELA (Secondary Level)
Students with severe cognitive disabilities
Level 4 = Acc Level 4Level 3 = Acc Level 3Level 2 = Acc Level 2Level 1 = Acc Level 1
25
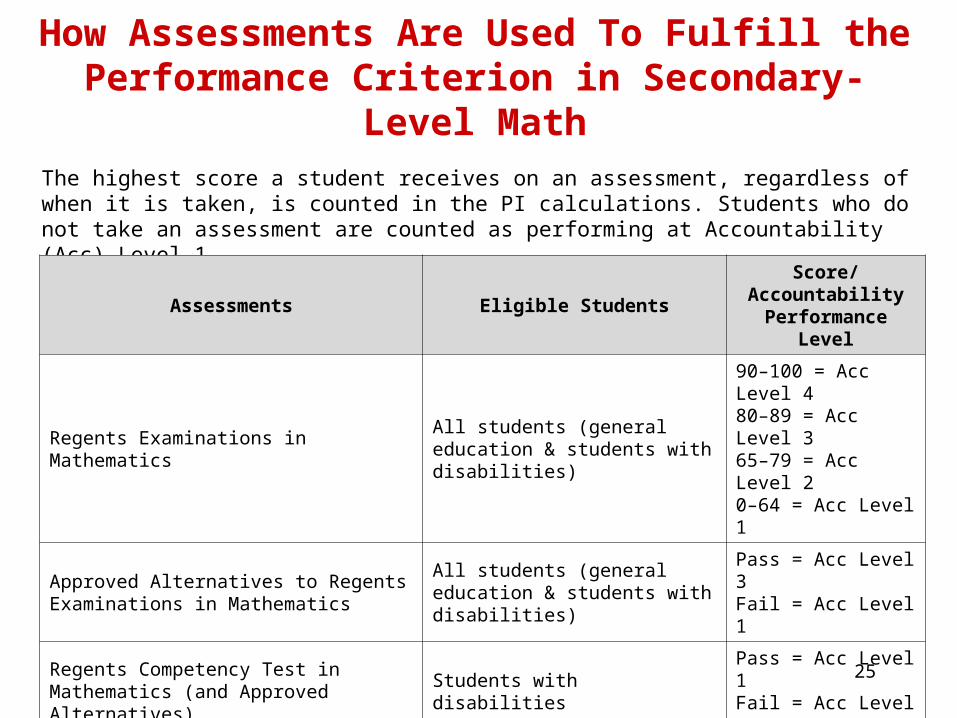
How Assessments Are Used To Fulfill the Performance Criterion in Secondary-Level Math
The highest score a student receives on an assessment, regardless of when it is taken, is counted in the PI calculations. Students who do not take an assessment are counted as performing at Accountability (Acc) Level 1.
Assessments Eligible StudentsScore/
Accountability Performance Level
Regents Examinations in MathematicsAll students (general education & students with disabilities)
90–100 = Acc Level 480–89 = Acc Level 365–79 = Acc Level 20–64 = Acc Level 1
Approved Alternatives to Regents Examinations in Mathematics
All students (general education & students with disabilities)
Pass = Acc Level 3Fail = Acc Level 1
Regents Competency Test in Mathematics (and Approved Alternatives)
Students with disabilitiesPass = Acc Level 1Fail = Acc Level 1
New York State Alternate Assessment in Mathematics (Secondary Level)
Students with severe cognitive disabilities
Level 4 = Acc Level 4Level 3 = Acc Level 3Level 2 = Acc Level 2Level 1 = Acc Level 1
26
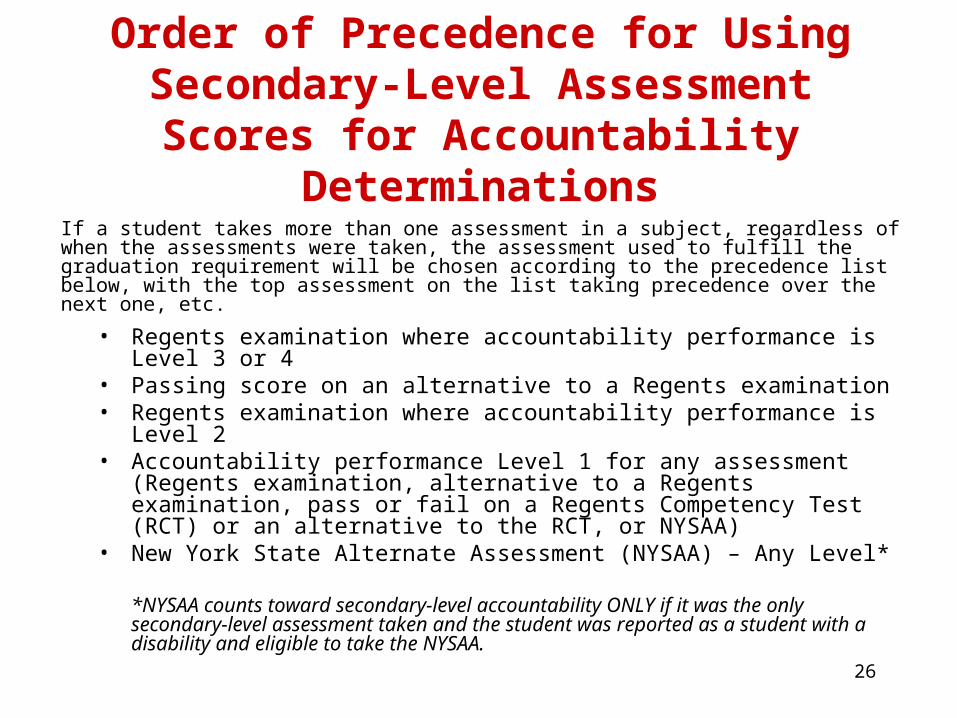
Order of Precedence for Using Secondary-Level Assessment Scores
for Accountability Determinations
• Regents examination where accountability performance is Level 3 or 4• Passing score on an alternative to a Regents examination• Regents examination where accountability performance is Level 2• Accountability performance Level 1 for any assessment (Regents
examination, alternative to a Regents examination, pass or fail on a Regents Competency Test (RCT) or an alternative to the RCT, or NYSAA)
• New York State Alternate Assessment (NYSAA) – Any Level*
*NYSAA counts toward secondary-level accountability ONLY if it was the only secondary-level assessment taken and the student was reported as a student with a disability and eligible to take the NYSAA.
If a student takes more than one assessment in a subject, regardless of when the assessments were taken, the assessment used to fulfill the graduation requirement will be chosen according to the precedence list below, with the top assessment on the list taking precedence over the next one, etc.
27
Performance Criterion:Effective AMOs, State Standards, Safe Harbor Targets, and
Progress Targets
28
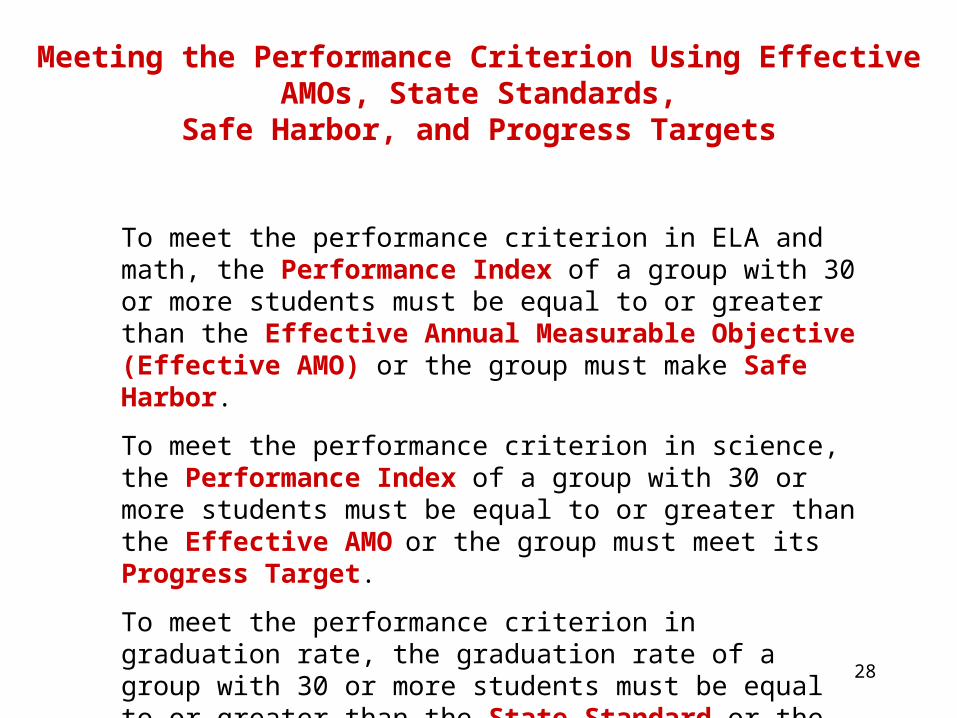
Meeting the Performance Criterion Using Effective AMOs, State Standards,
Safe Harbor, and Progress Targets
To meet the performance criterion in ELA and math, the Performance Index of a group with 30 or more students must be equal to or greater than the Effective Annual Measurable Objective (Effective AMO) or the group must make Safe Harbor.
To meet the performance criterion in science, the Performance Index of a group with 30 or more students must be equal to or greater than the Effective AMO or the group must meet its Progress Target.
To meet the performance criterion in graduation rate, the graduation rate of a group with 30 or more students must be equal to or greater than the State Standard or the group must meet its Progress Target.
29
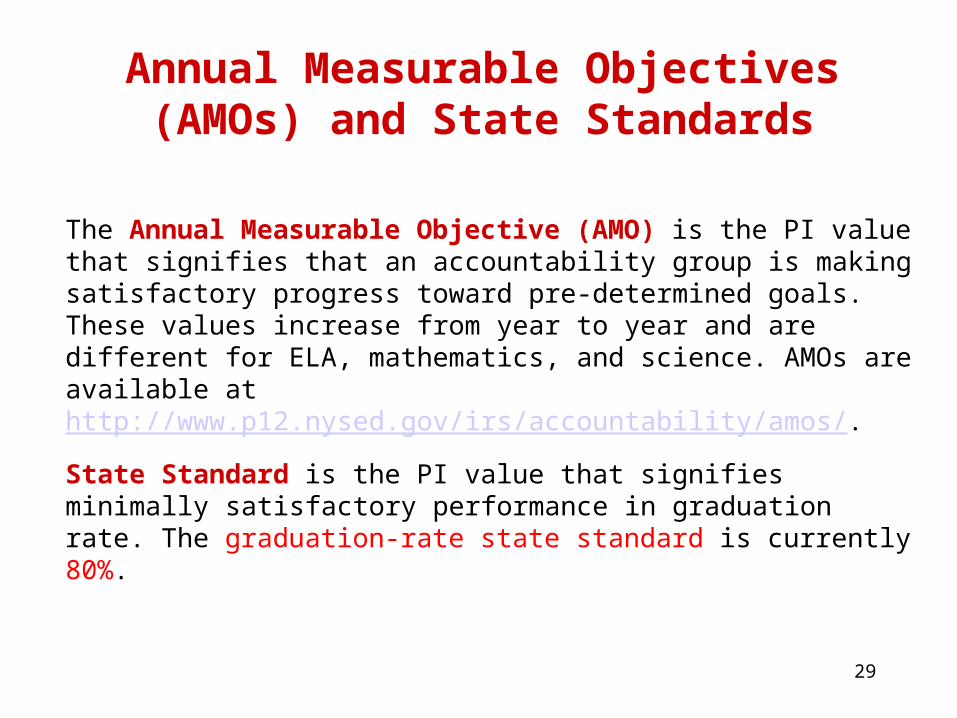
Annual Measurable Objectives (AMOs) and State Standards
The Annual Measurable Objective (AMO) is the PI value that signifies that an accountability group is making satisfactory progress toward pre-determined goals. These values increase from year to year and are different for ELA, mathematics, and science. AMOs are available at http://www.p12.nysed.gov/irs/accountability/amos/.
State Standard is the PI value that signifies minimally satisfactory performance in graduation rate. The graduation-rate state standard is currently 80%.
30
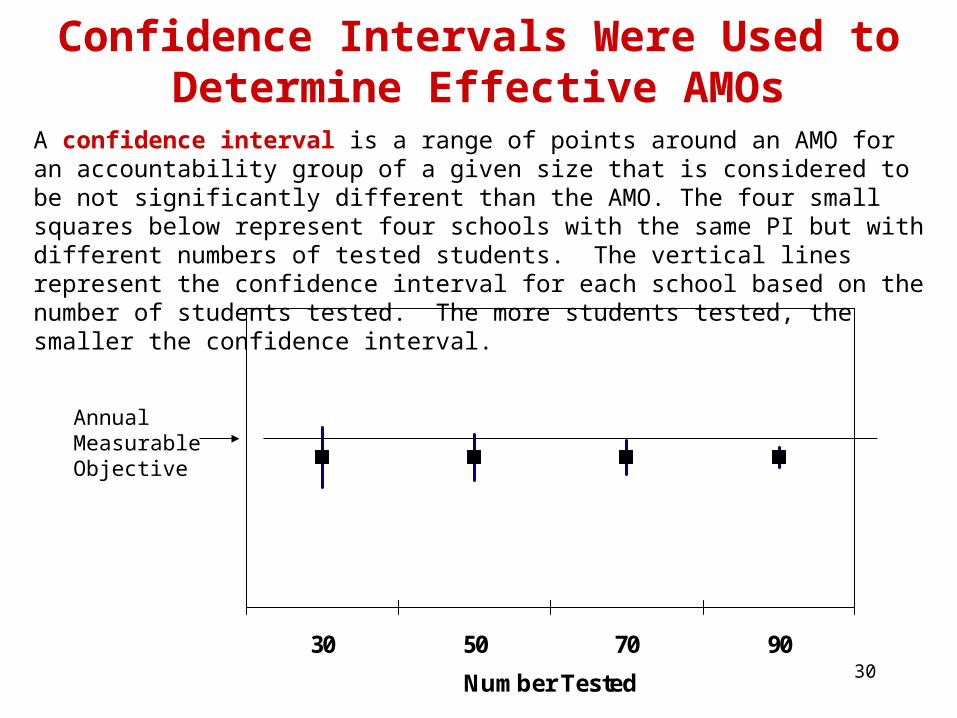
Confidence Intervals Were Used toDetermine Effective AMOs
30 50 70 90
Number Tested
Annual Measurable Objective
A confidence interval is a range of points around an AMO for an accountability group of a given size that is considered to be not significantly different than the AMO. The four small squares below represent four schools with the same PI but with different numbers of tested students. The vertical lines represent the confidence interval for each school based on the number of students tested. The more students tested, the smaller the confidence interval.
31
An Effective AMO (EAMO) is the lowest PI that an accountability group of a given size can achieve in a subject for the group’s PI not to be considered significantly different from the AMO for that subject. If an accountability group's PI equals or exceeds the EAMO and the group meets its participation requirement, the group is considered to have made AYP. EAMOs are available at http://www.p12.nysed.gov/irs/accountability/amos/.
Effective AMOs
32
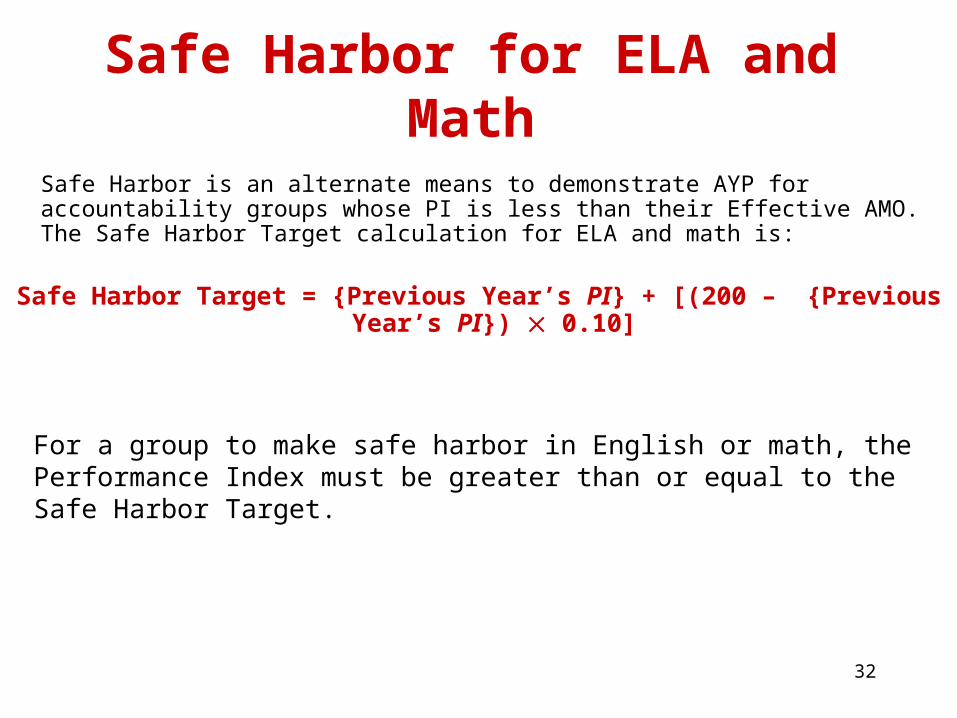
Safe Harbor for ELA and Math
Safe Harbor is an alternate means to demonstrate AYP for accountability groups whose PI is less than their Effective AMO. The Safe Harbor Target calculation for ELA and math is:
Safe Harbor Target = {Previous Year’s PI} + [(200 – {Previous Year’s PI}) 0.10]
For a group to make safe harbor in English or math, the Performance Index must be greater than or equal to the Safe Harbor Target.
33
Safe Harbor Target Calculations for Elementary/Middle-Level Groups With Fewer than 30
Students in the Previous Year
For elementary/middle-level ELA and mathematics, if in the current year a district or school has an accountability group with 30 or more students but did not have 30 or more students in the previous year, student scores for the previous two years are combined to calculate a Safe Harbor Target for the current year. If in the combined years, there are still not 30 or more students with valid test scores in the group, the group is assigned a Safe Harbor Target of 20.
34
Safe Harbor Target Calculations for Cohorts With
Fewer than 30 Members
For secondary-level ELA and mathematics, if in the current year a district or school has an accountability group with 30 or more cohort members but did not have 30 or more cohort members in the previous year, student scores for the previous two cohorts are combined to calculate a Safe Harbor Target for the current year. If in the combined years, there are still not 30 or more cohort members in the group, the group is assigned a Safe Harbor Target of 20.
35
Science and Graduation-Rate Progress Targets
Progress Targets are determined in science for groups whose PI is less than their EAMO in science and in graduation rate for groups whose graduation rate is less than the State Standard.
The Progress Target in science is determined by adding one point to the previous year’s PI.
The Progress Target for the 2008 four-year cohort is a 10% gap reduction (one percentage point minimum) over the previous year’s graduation rate.
2008 Four-Year Cohort Progress Target = ((80 – 2007 Graduation-Rate Total Cohort Graduation Rate) 0.10) + 2007 Graduation-Rate Total Cohort Graduation Rate
The Progress Target for the 2007 five-year cohort is a 20% gap reduction (one percentage point minimum) over the previous year’s graduation rate.
2007 Five-Year Cohort Progress Target = ((80 – 2006 Graduation-Rate Total Cohort Graduation Rate) 0.20) + 2006 Graduation-Rate Total Cohort Graduation Rate
36
Progress Target Calculations for Elementary/Middle-Level Science
Groups with Fewer than 30 Students in the Previous Year
For elementary/middle-level science, if in the current year a district or school has an accountability group with 30 or more students but did not have 30 or more students in the previous year, student scores for the previous two years are combined to calculate a Progress Target for the current year. If in the combined years, there are still not 30 or more students with valid test scores in the group, the group is assigned a Progress Target of 1.
37
Progress Target Calculations for Cohorts with Fewer than 30 Members
For secondary-level graduation rate, if in the current year a district or school has an accountability group with 30 or more cohort members but did not have 30 or more cohort members in the previous year, student scores for the previous two cohorts are combined to calculate a Progress Target for the current year. If in the combined years, there are still not 30 or more 4-year cohort members in the group, the group is assigned a Progress Target of 8. If in the combined years, there are still not 30 or more 5-year cohort members in the group, the group is assigned a Progress Target of 16.
38
Performance for Schools/Districts with Fewer Than 30 Students
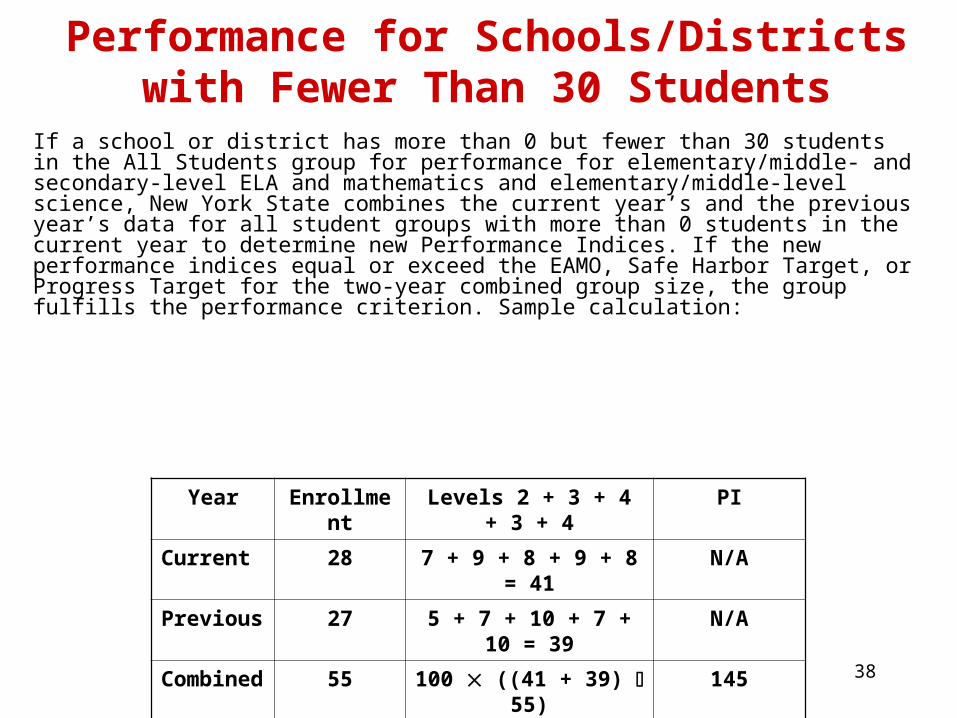
If a school or district has more than 0 but fewer than 30 students in the All Students group for performance for elementary/middle- and secondary-level ELA and mathematics and elementary/middle-level science, New York State combines the current year’s and the previous year’s data for all student groups with more than 0 students in the current year to determine new Performance Indices. If the new performance indices equal or exceed the EAMO, Safe Harbor Target, or Progress Target for the two-year combined group size, the group fulfills the performance criterion. Sample calculation:
Year Enrollment Levels 2 + 3 + 4 + 3 + 4 PI
Current 28 7 + 9 + 8 + 9 + 8 = 41 N/A
Previous 27 5 + 7 + 10 + 7 + 10 = 39 N/A
Combined 55 100 ((41 + 39) 55) 145
39
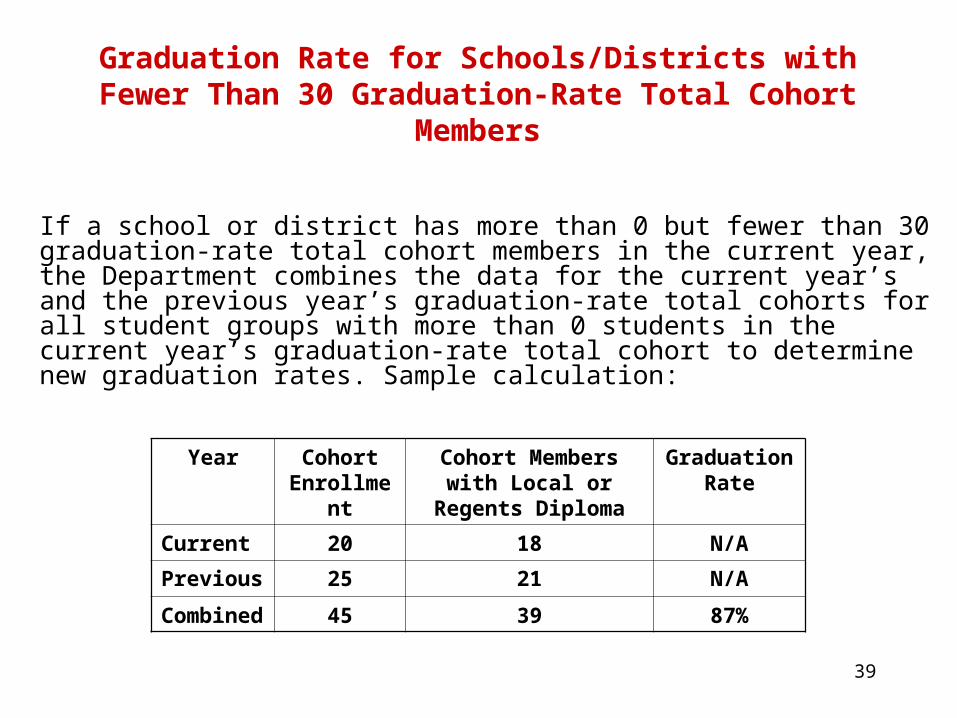
Graduation Rate for Schools/Districts with Fewer Than 30 Graduation-Rate Total Cohort Members
If a school or district has more than 0 but fewer than 30 graduation-rate total cohort members in the current year, the Department combines the data for the current year’s and the previous year’s graduation-rate total cohorts for all student groups with more than 0 students in the current year’s graduation-rate total cohort to determine new graduation rates. Sample calculation:
Year Cohort Enrollment
Cohort Members with Local or Regents
Diploma
Graduation Rate
Current 20 18 N/A
Previous 25 21 N/A
Combined 45 39 87%
40
Former Limited English Proficient (LEP) Students
If the count of LEP students for performance is equal to or greater than 30, former LEP students are also included in the performance calculations.
A former LEP student is one who was previously identified as LEP but achieved proficiency on all modalities of the New York State English as a Second Language Achievement Test (Listening, Speaking, Reading and Writing) during one of the previous two school years.
41
Former Students with Disabilities
If the count of students with disabilities for performance is equal to or greater than 30, former students with disabilities are also included in the performance calculations.
A former student with disabilities is one who is not identified in the current school year as a student with disabilities but was previously identified as a student with disabilities in at least one of the previous two school years.
42
Graduation Rate Calculation
The graduation rate for a group is determined by dividing the number of graduation-rate total cohort members who graduated with a local or Regents diploma by the number of graduation-rate total cohort members, and multiplying the result by 100.
For example:Graduation-rate total cohort members = 178Graduation-rate total cohort members with local or Regents diplomas = 146Graduation rate = (146 178) 100 = 82.02247 or 82%
43
Making Adequate Yearly Progress (AYP)
44
Determining Adequate Yearly Progress (AYP)
To determine AYP for an accountable group, calculations are made in the following order:
1. The participation rate for the group based on the current year’s data is determined.
2. If the participation rate for the group based on the current year’s data is below the required rate, the current and previous year’s data are combined to determine a participation rate.
3. If the participation rate criterion is not met, the group fails to make AYP, regardless of the performance.
4. If the participation rate criterion is met, the PI is compared to the Effective AMO for ELA, math, and science. For graduation rate, the graduation rate is compared with the State Standard.
5. If the PI is equal to or greater than the Effective AMO in ELA, math, and science, the group makes AYP. If the graduation rate is equal to or greater than the State Standard the group makes AYP in graduation rate.
6. If the criteria in #5 are not met, the PI is compared to the Safe Harbor Target (ELA and math) or Progress Target (science), or the graduation rate is compared to the Progress Target (graduation rate).
45
Determining Adequate Yearly Progress (AYP) (continued)
7. For ELA and math, if the PI is greater than or equal to the Safe Harbor Target, the group makes AYP. If the PI is less than Safe Harbor Target, the group does not make AYP.
8. For science, if the PI is greater than or equal to the Progress Target, the group makes AYP. If the PI is less than the Progress Target, the group does not make AYP.
9. For graduation rate, if the graduation rate is greater than or equal to the Progress Target, the group makes AYP. If the graduation rate is less than the Progress Target, the group does make AYP. (Note that the school or district can make AYP for the group in graduation rate as long as makes AYP for either the 4-year or the 5-year cohort.)
46
Accountability for Limited English Proficient (LEP) Students
All LEP students in grades K–12 must take the New York State English as a Second Language Achievement Test (NYSESLAT) annually.
LEP students in grades 3 through 8 enrolled in U.S. schools (not including Puerto Rico) for less than one year may take the NYSESLAT in lieu of the NYSTP in ELA to fulfill the testing requirement for accountability. The one-year window does not have to be 12 consecutive months. In addition, students enrolled anytime during a month, including July and August, are considered enrolled for that month.
Eligible students may be exempt from taking the NYSTP in ELA for the first year in which they are enrolled during the NYSTP ELA test administration period. Such students may not be exempt in subsequent years, even if they have been enrolled in a United States school for less than 12 months.
LEP students in grades 3 through 8 who did not take the ELA assessment, were enrolled in U.S. schools (not including Puerto Rico) for less than one year, have valid scores on all modalities of the NYSESLAT (Listening, Speaking, Reading and Writing), and were reported in the Student Information Repository System (SIRS) with a Program Service code of 0242 (NYSESLAT-eligible) will meet the ELA participation requirement.
NYSESLAT performance levels will not be used in calculating the Performance Index. LEP students meeting the criteria to use the NYSESLAT in lieu of the ELA will not be included in the Performance Index calculation.
Districts receiving Title III funding must identify each participating student in the SIRS.
47
Accountability for Students with Disabilities
48
New York State Alternate Assessment (NYSAA)
NYSAA performance levels are counted the same as general assessment (NYSTP, Regents, etc.) levels when determining PIs for English, mathematics, and science.
No Child Left Behind (NCLB) regulations allow a maximum of one percent of scores used in calculating the PI for each accountability measure for a district to be based on proficient and advanced proficient scores on the NYSAA, unless the district has a waiver to exceed the one percent.
To meet this requirement, districts that have more than one percent of their continuously enrolled tested students performing at Levels 3 and 4 on the NYSAA must have some of these students counted at Level 2 when determining PIs. If these students attend schools within the district, this reduction may impact the schools as well. Districts must report the performance levels as received by the students. NYSED will make the adjustments for PI calculations only.
49
Testing UngradedStudents with Disabilities
The CSE must determine that a student meets the criteria specified by the New York State Education Department.
Students must be administered the correct test for their age, as specified in the SIRS Manual at www.p12.nysed.gov/irs/sirs.
50
Accountability for Schools with Special
Circumstances
51
If an elementary or middle school does not test 30 continuously enrolled students in the current year, the scores of continuously enrolled tested students in the current and the prior year in all accountability groups are combined to determine the PI.
If a high school does not have 30 students in its current year accountability cohort, the current year’s and previous year’s accountability cohorts in all accountability groups are combined to determine the PI.
If a school still does not have 30 students on which to base a decision, the school is subject to special procedures for determining AYP.
If the “All Students” group includes at least 30 students in the current year, results for the current year and the previous year will NOT be combined for the other accountability groups. This is true even if there are fewer than 30 tested students in the other accountability groups.
Small Districts and Schools
52
For accountability groups that include 30 students in the current year but did not include 30 students in the previous year, the scores of continuously enrolled tested students in that group in the previous two years are combined to determine the current year’s safe harbor and progress targets.
For accountability groups that do not include 30 current year cohort members, the cohorts for the previous two years are combined to determine the current year’s safe harbor and progress targets.
If, after combining two years of data, the group still does not have 30 students to determine a safe harbor or progress target, the school or group is given credit for having made safe harbor or progress target.
Small Districts and Schools (continued)
53
Schools that serve only students below grade 3 and, consequently, do not participate in State assessments are called “feeder” schools.
Accountability decisions for feeder schools that serve grade 1 and/or grade 2 are based either on
1) the performance of schools with grade 3 in the same district, or
2) a procedure called “backmapping.”
Accountability for Schools That Serve Only Students Below Grade 3
54
Feeder schools that are required to do backmapping are those whose highest grade is grade 1 or grade 2 (schools with grades 1, 2, 1–2, K–1, or K–2 only).
These schools are required to submit data to the Department through the Student Information Repository System (SIRS). If they do not submit data to the Department through SIRS, they are considered not to have made AYP.
Accountability for Feeder Schools That Do Not Submit Data for Backmapping
55
If all district elementary schools with grade 3 enrollment make AYP in ELA or math, the feeder schools in the district are considered to have made AYP in the measure(s).
This only applies if the feeder schools submit data to the Department through the Student Information Repository System (SIRS). If feeder schools do not submit data to the Department, they are considered not to have made AYP.
Accountability for FeederSchools in Districts Where All Elementary Schools Make AYP
56
Feeder schools with grades 1 and/or 2 are accountable for the performance of their former students when these students take the grade 3 assessments in another school within the district. Feeder schools are responsible for the performance of students who were continuously enrolled in the feeder school’s highest grade (grade 1 or 2). The students’ grade 3 repository records must identify the feeder school attended by the student in the Service Provider field. To determine if the feeder school made AYP, the ELA and math PIs of students enrolled in the feeder school are calculated and compared with the Effective AMOs and/or Safe Harbor Targets.
For schools serving only kindergarten, special evaluation processes are used to determine AYP.
Accountability for FeederSchools in Districts Where
Some Elementary Schools DoNot Make AYP: Backmapping
57
Since these schools do not have a grade 12, assessment and graduation-rate data for cohort members after four years of high school cannot be collected. As such, judgments as to whether the school made AYP must be made using special procedures.
Accountability for Schools with Enrollments Only in Grades 9, 10, and/or 11
1) If all district secondary schools with grade 12 enrollment make AYP in ELA or math, the schools with enrollment only in grades 9, 10, and/or 11 in the district are considered to have made AYP in the measure(s).
2) If one or more district schools with grade 12 enrollment do not make AYP in ELA or math, the schools with enrollment only in grades 9, 10, and/or 11 are subject to special evaluation procedures to determine AYP.
58
Accountability for Alternative High School Cohorts
Section 100.2(p)(16)(iii) of Commissioner’s Regulations allows schools in which more than half the students enrolled have previously been enrolled in another high school or in which more than half the enrollment is receiving special education services to voluntarily submit the performance of an alternative high school cohort. The alternative cohort in any given year consists of those students enrolled in the high school on the first Wednesday of October three years previously who were still enrolled in the school on the first Wednesday of October two years previously. For the alternate cohort AYP results to be considered, the school needs to make alternate cohort AYP for all groups in both ELA and mathematics.

59
Most new schools begin in Good Standing. Exceptions include those that reconfigure but maintain much of the same student population or those that merged with other schools that were previously identified. The Department reviews these schools on an individual basis. The Commissioner determines what the schools’ starting status should be based on these Department evaluations.
Accountability for New Schools
60
Accountability: the Office of Accountability at accountinfo.mail.nysed.gov
The New York State Accountability Report and data collection and reporting for New York State: the Information and Reporting Services Office at [email protected]
New York State assessments: the Office of Assessment Policy, Development and Administration at www.p12.nysed.gov/apda
Elementary and Secondary Education Act (ESEA): the United States Department of Education at www.ed.gov
Whom to Contactfor Further Information