the aging of the homeless population: fourteen-year trends in san francisco judy hahn, margot...
TRANSCRIPT

The Aging of the Homeless Population:
Fourteen-year Trends in San Francisco
Judy Hahn, Margot Kushel, David Bangsberg, Elise Riley, Andrew Moss

BackgroundChanges in homelessness in the US• 1930’s
– Young transient men in search of work
• 1950’s to 1970’s: – “Skid row”, single older low income white men, unstable housing
(flophouses, SROs, missions)
• 1980’s onward: – Loss of SRO hotels and affordable housing in urban centers– Shelter capacities nationwide increased– More families and minorities, younger– Poorer living conditions compared to Skid row
Rossi, American Psychologist 1990

Background
In San Francisco,• Continued decline in the number of low cost housing
and SRO units in the 1990s– Units lost due to earthquakes, fires and gentrification
• The response to homelessness– Establishment of emergency shelters and soup kitchens and
large shelters with services (1980s)– Policing programs (mid 1990s)– Supportive housing (some late 1990s, most starting 2004),
leveraging Federal $
Ilene Lelchuk, San Francisco Chronicle September 7, 2003.

Objectives
• We have studied HIV and TB in the homeless and marginally housed in San Francisco from 1990 to 2003.
• In this analysis, we sought to examine changes in the homeless population over time in:– Demographics – age, race, sex– Housing– Health status– Health service utilization– Drug use

Methods
Wave 2:
1996-1997
Wave 1:
1990-1994
Wave 3:
1998-2000
Wave 4:
2003
• Four cross sectional studies (“waves”) conducted at shelters and free meal programs
• Over the entire study period we conducted sampling at a total of 13 shelters and 8 free meal programs

Methods
• Inclusion criterion: Age 18 and older
• 45 minute interviewer-administered survey
• HIV antibody testing and counseling, TB
testing (waves 1 and 2)
• $10-$20 remuneration for participating
• Anonymous

Analysis
We included in this analysis:• Shelters and meal programs that were sampled in
at least ¾ of the “waves” – 4 shelters and 2 free meal programs (78% of those
sampled)
• Study participants who were “literally homeless” in the prior year – 87% of those sampled

RESULTSDemographics (n=3534)
Male 77%
Race
African American 52%
Caucasian 33%
Other, or mixed race 15%
Veterans (of the men)33%

Substance use and mental illness
Psychiatric hospitalization, ever 23%
Crack use, ever63%
Injection drug use, ever 38%
Heavy alcohol use, prior 30 days 35%
At least one of the above 80%
Two or more of the above 49%
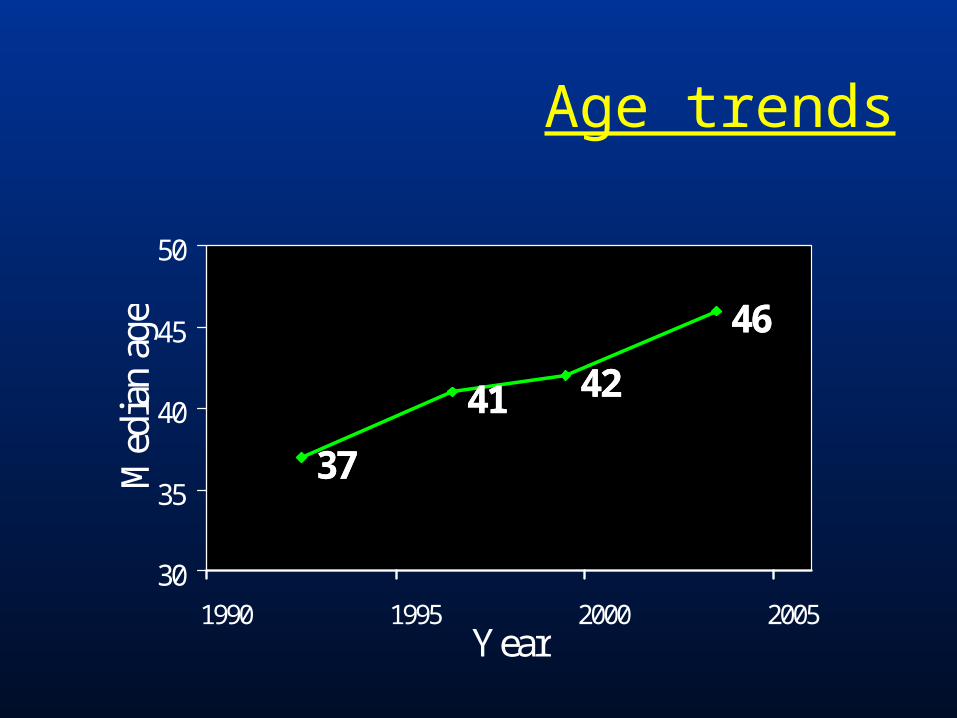
3737
4141 4242
4646
30
35
40
45
50
1990 1995 2000 2005Year
Med
ian
age
Age trends

38%
22%15% 15%
50%
60%65%
52%
11% 18% 20%32%
0%
20%
40%
60%
80%
100%
1990-1994 1996-1997 1998-2000 2003
Age >=50
Age 35-49
Age <35
Age trends by group
1% overall >= age 65

Demographics
53%49%
56%
47%
36%
28%31%
0%
10%
20%
30%
40%
50%
60%
1990 1995 2000 2005
African American
Veterans (% ofmales)
Women

Housing
12
24
30
40
0
6
12
18
24
30
36
42
48
1990 1995 2000 2005
Months
0%
10%
20%
30%
40%
50%
60%
Median durationever homeless
Lived on street,prior year
Lived in own apt,prior year

Self-reported health
21%
15%14%
8%6%
10%10%
0%
5%
10%
15%
20%
25%
1990 1993 1995 1998 2001 2004
Hypertension
Psychiatrichospitalizations
Diabetes
Emphysema

Hospital utilization
52%
42%43%
31%
21%21%
0%
10%
20%
30%
40%
50%
60%
1995 2000 2005
Visitedemergencydepartment
Admitted tohospital
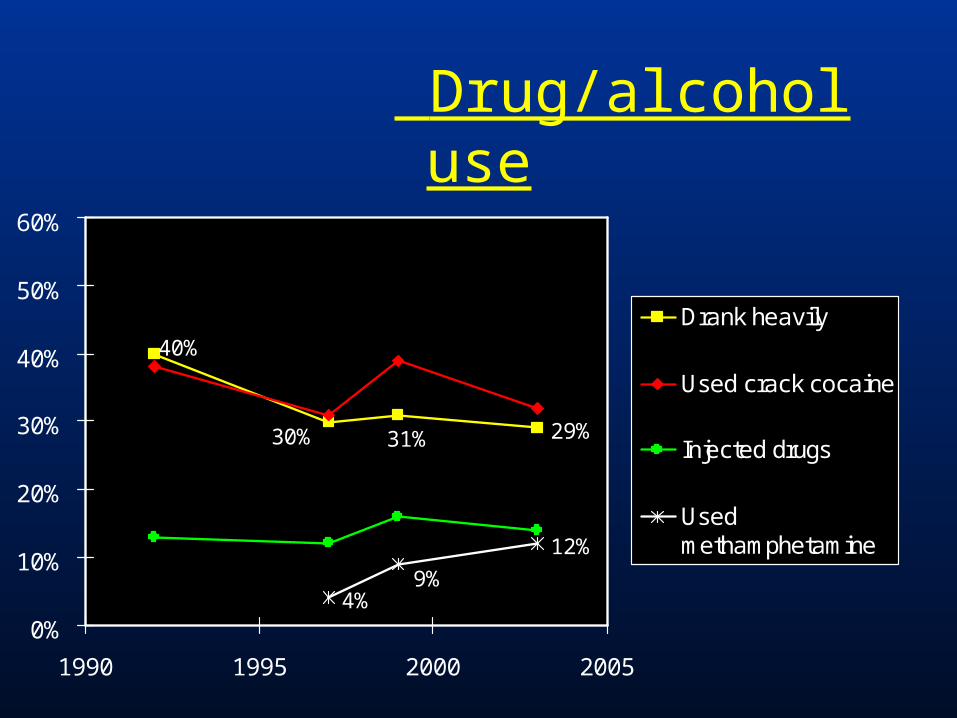
Drug/alcohol use
29%31%30%
40%
4%
12%
9%
0%
10%
20%
30%
40%
50%
60%
1990 1995 2000 2005
Drank heavily
Used crack cocaine
Injected drugs
Usedmethamphetamine
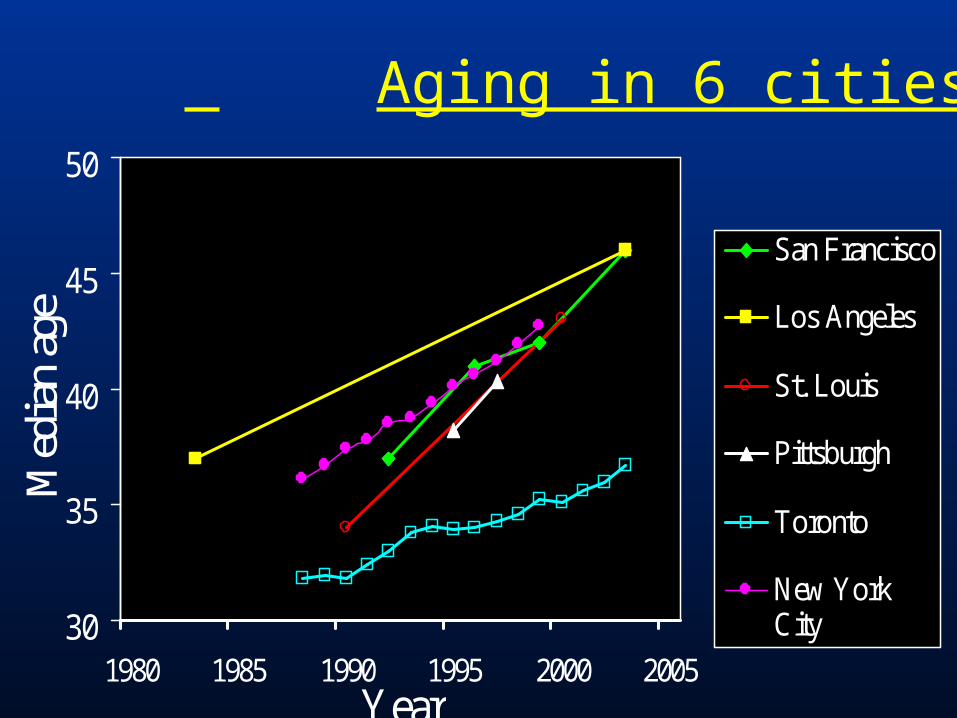
30
35
40
45
50
1980 1985 1990 1995 2000 2005Year
Med
ian
age
San Francisco
Los Angeles
St. Louis
Pittsburgh
Toronto
New YorkCity
Aging in 6 cities

Conclusions and Implications
• The homeless population is getting older.
• This aging indicates that the homeless population is static and not regenerating itself in time.– A dynamic population would have as many new young people
joining the population as old people leaving the population and would have a constant age over time.
• Good news: resources spent on housing the homeless now may be finite.

Conclusions and Implications
• Of concern: the homeless will increasingly need health care services -- either to control their chronic disease or to treat the more serious outcomes of unmanaged chronic disease.
• Control of chronic disease will be very difficult to deliver to persons not in housing.

Recommendations
• Provide supportive housing with onsite medical services for those age 50 and older in order to intervene in the course of chronic disease early
• Base on the model of San Francisco Department of Public Health’s Direct Access to Housing– Houses 1000 people in 12 buildings– 3 buildings dedicated to seniors– Psychiatrists, nurses, physicians assistants– Case worker : resident ratio: 1:20– 80% stay at least 1 year

AcknowledgmentsREACH field staff and study participants
Grants: NIH 5R01DA004363, 1R01MH054907, R01DA010164, and K08HS11415.
Contact info: Judy Hahn, Ph.D.Assistant ProfessorEPI-Center, Department of Medicine University of California, San FranciscoSan Francisco, CA [email protected]


Bonus data!
Younger vs. older homeless2003 data wave
Age<50 (n=384) Age50 (n=140)
Median age (IQR) 40 (33-45) 53 (51-58)
Sex=Female* 25% 15%
Race/ethnicity*
African American
Caucasian
Mixed/other
43%
34%
23%
55%
28%
17%
*p<0.05

Younger vs. older homelessHousing
Age<50 (n=384) Age50 (n=140)
Median total months homeless (IQR)*
36 (9-76) 48 (18-108)
Median years since first homeless (IQR)*
6 (1.5-12.5) 7 (3-16)
Lived on streets/outdoors, prior year 51% 50%
Lived in shelter, prior year 82% 87%
Lived in SRO, prior year 40% 46%
Lived in own apt, prior year* 23% 10%
*p<0.05

Younger vs. older homeless Health
Health issue, prior year Age<50 (n=384) Age50 (n=140)
Visited ED 49% 44%
Admitted to hospital 29% 26%
Mental health admission 8% 5%
Any days ill (prior 30) 35% 36%
Chronic health problem
Heart disease* 3% 10%
Hypertension* 14% 34%
Diabetes 6% 6%
Emphysema* 3% 9%
Asthma 13% 15%
*p<0.05

Younger vs. older homeless Substance use
30 day use Age<50 (n=384) Age50 (n=140)
Heavy drinking 28% 23%
Injected drugs* 18% 9%
Drugs used:
Crack cocaine 32% 29%
Powder cocaine 7% 4%
Heroin 13% 8%
Methamphetamine* 18% 8%
*p<0.05

Summary of bonus data
• Many older homeless persons are using drugs or drinking heavy amounts of alcohol, though somewhat fewer than younger homeless persons
• Older homeless persons have the same rate of ED visits and inpatient hospitalizations though higher rates of chronic disease