supplementary information for - media.nature.com · supplementary information for: predictive...
TRANSCRIPT

Supplementary Information for:
Predictive combinatorial design of mRNA translation initiation regions for systematic
optimization of gene expression levels
Sang Woo Seo1, Jae-Seong Yang1, Han-Saem Cho, Jina Yang, Seong Cheol Kim, Jong Moon
Park, Sanguk Kim2, Gyoo Yeol Jung2
1 These authors contributed equally to this work.
2 To whom correspondence should be addressed.
E-mail: [email protected] (G. Y. J.); [email protected] (S. K.)
Contents:
Supplementary Figures S1-S8
Supplementary Tables S1-S5
Supplementary Methods
1

Supplementary Figures
Generate initialsequen ce sets
Take a sequencewith mediumexpr.
Input Logic
Mutate thesequen ce
Take the maxexpr. sequen ce
Constraints for designing (25NT)(default : NNNNNNNNNNNNNNNNNNNNNNNNN)
maxexpr.
desired
Desired Max Expression Level(default : 102672.55)
Desired Min Expression Level(default : 1002.55)
Take the minexpr. sequen ce
YES
YES
NO
NO
Expression-level intermediates(default : 16 sequences)
Template 5’-UTR sequence (25NT)(default : NNNNNNNNNNAAAGGAGCATCNNNN)
> max x 0.8
minexpr.
desired>min x 1.2
Analyze positionaleffects on expression
Mutate library seq ininfluential position
Select a seq nearestdesired max expr.
Reach toexp-level intermediates
YES
NO
Show library seqand expressions
Supplementary Figure S1. Detailed flowchart of UTR Library Designer. The program takes a 5’-UTR template sequence and initially generates randomized sequences. From these, the program selects a medium-expressed sequence. Applying user-defined design constraints, the program then mutates sequences to generate a library that reaches minimum and maximum expression values using a genetic algorithm. If the program finds minimally and maximally expressed sequences, it starts to fit user-defined the number of expression-level intermediates to generate the library. If the number of sequence generated is less than the query, the program gradually adds less influential mutations until it is satisfied. In the opposite situation, the program gradually removes less influential mutations until it is satisfied.
2

Supplementary Figure S2. Distribution of expression fold-changes in a random library of gfp with 16 expression-level intermediates. The utility of UTR Library Designer was compared with that of random trials using gfp as a target. We attempted to obtain a library containing 50,000 different sets of sequences that satisfied minimum and maximum expressions of 40 and 200,000, respectively, with 16 expression-level intermediates. Our desired expression fold-change was 5,000 (200,000/40), a goal effectively out of reach of the random approach. The red arrow indicates the average value of 10 trials using UTR Library Designer.
3
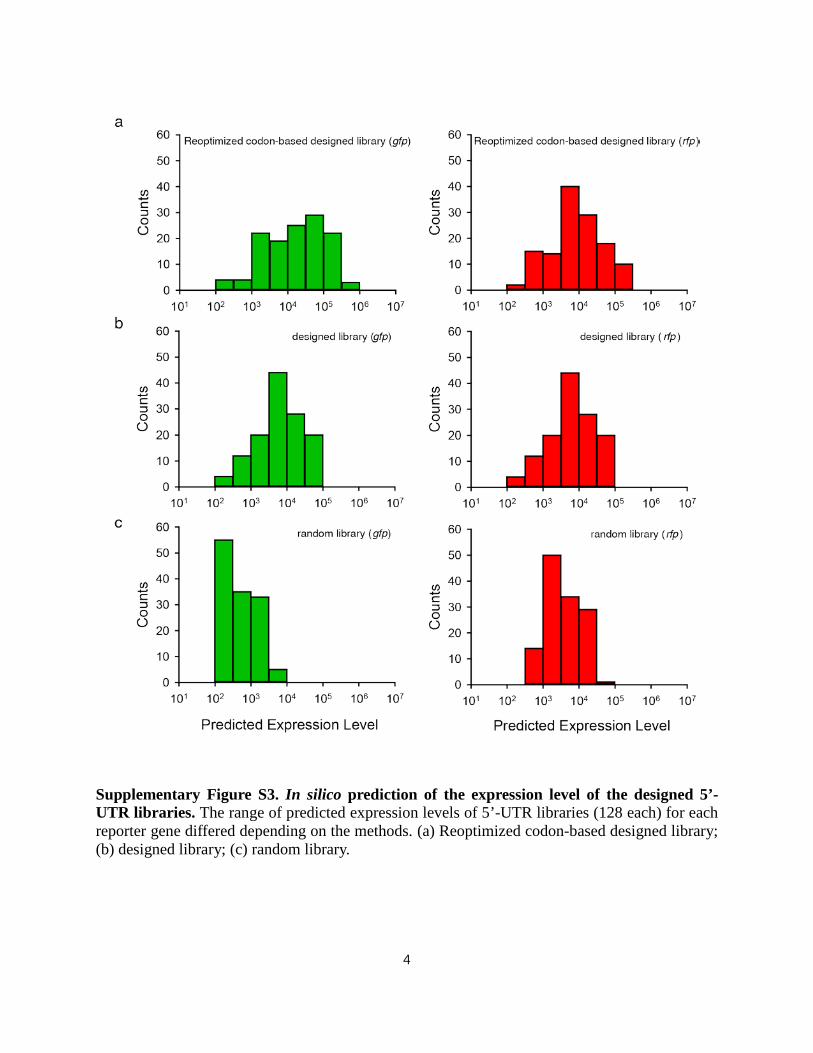
Supplementary Figure S3. In silico prediction of the expression level of the designed 5’-UTR libraries. The range of predicted expression levels of 5’-UTR libraries (128 each) for each reporter gene differed depending on the methods. (a) Reoptimized codon-based designed library; (b) designed library; (c) random library.
4

Supplementary Figure S4. In vivo validation of the designed 5’-UTR libraries by FACS. The range of the expression levels of designed variants was similar to the in silico-predicted range of expression level for each design method. (a) random library; (b) designed library; (c) reoptimized codon-based designed library.
5

Predicted Expression Level100 101 102 103 104 105 106 107 108 109
Cou
nts
0
20
40
60
80
Supplementary Figure S5. The distribution of predicted expression levels of the designed 5’-UTR library for the expression of ppc. The designed 5’-UTR library for ppc (256 variants) was predicted to show more than a 105-fold range in expression level. The enriched variant for lysine production belongs to the bar, which was hardly able to be found using a random search.
6

Supplementary Figure S6. Pathway optimization for hydrogen production by changing gapA expression. (a) The predicted expression level of the designed 5’-UTR library for gapA expression. (b) The linear correlation between the predicted expression level and specific enzymatic activity. (c) The amount of hydrogen evolved by each variant. H0 control stands for the wild-type gapA expression from chromosome of W3110 with native regulatory system but has empty vectors.
7

Supplementary Figure S7. Distribution of expression fold-changes in a random library of ppc with 256 expression-level intermediates. The utility of UTR Library Designer was compared with that of random trials using ppc as a target. We attempted to obtain a library containing 10,000 different sets of sequences that satisfied minimum and maximum expressions of 50 and 10,000,000, respectively, with 256 expression-level intermediates. Our desired expression fold-change was 200,000 (10,000,000/50), a goal effectively out of reach of the random approach. The red arrow indicates the value obtained by UTR Library Designer for ppc optimization.
8

Supplementary Figure S8. Distribution of expression fold changes in a random library of gapA with 8 expression-level intermediates. The utility of UTR Library Designer was compared with that of random trials using gapA as a target. We attempted to obtain a library containing 10,000 different sets of sequences that satisfied minimum and maximum expressions of 5,000 and 500,000, respectively, with 8 expression-level intermediates. Our desired expression fold-change was 100 (500,000/5,000), a goal effectively out of reach of the random approach. The red arrow indicates the value obtained by UTR Library Designer for gapA optimization.
9

Supplementary Tables Supplementary Table S1. Statistics for the output of UTR Library Designer to obtain a 5,000-fold change in expression level with 16 expression-level intermediates. Red colors indicate variants tested in vivo as shown in Fig. 2.
Input Output Template 5'-UTR
Sequence
Additional Constraints
Protein Coding
Sequence (N-term 35NT)
Min. Expr.
Max. Expr.
Expression- level
intermediates
Library UTR
Sequence
# of trial
Min. Expr.
Max. Expr.
Expression- level
intermediates
Output URL
NNNNNNNNNNAAAGGAGCATC
NNNN
NNNNNNNNNNNNNNNNNNNNNNNN
N
ATGGCTAGCAAGGGCGAGGAGCTGTTCACC
GGGGT
40 200,000 16
CCTRTTGTCTAAAGKAGSATCGC
CM
119 36.83 197,107.41 16
http://sbi.postech.ac.kr/utr_library/job/1368054392-370/
NNNNNNNNNNAAAGGAGCATC
NNNN
NNNNNNNNNNNNNNNNNNNNNNNN
N
ATGGCTAGCAAGGGCGAGGAGCTGTTCACC
GGGGT
40 200,000 16
CGATTGCCCYWAAGSAGSATCG
CGG
96 48.71 186,385.82 16
http://sbi.postech.ac.kr/utr_library/job/1368075996-140/
NNNNNNNNNNAAAGGAGCATC
NNNN
NNNNNNNNNNNNNNNNNNNNNNNN
N
ATGGCTAGCAAGGGCGAGGAGCTGTTCACC
GGGGT
40 200,000 16
CGAACCGTCSAAAGSA
GSAKCTCCA
150 46.06 268,101.01 16
http://sbi.postech.ac.kr/utr_library/job/1368075972-090/
NNNNNNNNNNAAAGGAGCATC
NNNN
NNNNNNNNNNNNNNNNNNNNNNNN
N
ATGGCTAGCAAGGGCGAGGAGCTGTTCACC
GGGGT
40 200,000 16
GTCCATGTGCAAAKSAGSATCC
GMG
169 48.71 186,385.82 16
http://sbi.postech.ac.kr/utr_library/job/13681380
90-80/ NNNNNNNNNNAAAGGAGCATC
NNNN
NNNNNNNNNNNNNNNNNNNNNNNN
N
ATGGCTAGCAAGGGCGAGGAGCTGTTCACC
GGGGT
40 200,000 16
GCTGMCAGAGAAAGS
AGCRTCMTTG
134 38.95 226,687.82 16
http://sbi.postech.ac.kr/utr_library/job/13680759
10

19-820/
NNNNNNNNNNAAAGGAGCATC
NNNN
NNNNNNNNNNNNNNNNNNNNNNNN
N
ATGGCTAGCAAGGGCGAGGAGCTGTTCACC
GGGGT
40 200,000 16
TTTCTTCGCCAAAGSAGSWWC
GCGC
142 34.82 375,006.67 16
http://sbi.postech.ac.kr/utr_library/job/1368139207-580/
NNNNNNNNNNAAAGGAGCATC
NNNN
NNNNNNNNNNNNNNNNNNNNNNNN
N
ATGGCTAGCAAGGGCGAGGAGCTGTTCACC
GGGGT
40 200,000 16
CKTTTCCCTTAWAGSAGSATCCGG
G
99 41.19 166,660.5 16
http://sbi.postech.ac.kr/utr_library/job/1368139202-450/
NNNNNNNNNNAAAGGAGCATC
NNNN
NNNNNNNNNNNNNNNNNNNNNNNN
N
ATGGCTAGCAAGGGCGAGGAGCTGTTCACC
GGGGT
40 200,000 16
TACGGGCTCAAAWGSAGCMTCM
CAC
163 38.95 95,264.65 16
http://sbi.postech.ac.kr/utr_library/job/1368139193-570/
NNNNNNNNNNAAAGGAGCATC
NNNN
NNNNNNNNNNNNNNNNNNNNNNNN
N
ATGGCTAGCAAGGGCGAGGAGCTGTTCACC
GGGGT
40 200,000 16
CGWCGCGCCCAAAGKAGSATCMCCG
173 41.19 149,022.73 16
http://sbi.postech.ac.kr/utr_library/job/1368138910-210/
NNNNNNNNNNAAAGGAGCATC
NNNN
NNNNNNNNNNNNNNNNNNNNNNNN
N
ATGGCTAGCAAGGGCGAGGAGCTGTTCACC
GGGGT
40 200,000 16
GCTTGGTCGCAAAGSAGSAMCGRGA
102 32.93 570,446.18 16
http://sbi.postech.ac.kr/utr_library/job/1368139113-830/
11

Supplementary Table S2. Statistics for random mutations to obtain a 5,000-fold change in expression level with 16 expression-level intermediates
# of Trials for library to have >5,000-fold changes
Min Expression Obtained
Max Expression Obtained
Fold Change
Expression- level
intermediates 12912 18.37 104182.78 5672.71 16
Not found (within 80,000 trials) - - - 16 43936 12.73 166660.50 13096.95 16
Not found (within 80,000 trials) - - - 16 Not found (within 80,000 trials) - - - 16
14512 3.40 19219.82 5660.03 16 Not found (within 80,000 trials) - - - 16 Not found (within 80,000 trials) - - - 16
23696 3.30 16730.54 5061.02 16 Not found (within 80,000 trials) - - - 16
12

Supplementary Table S3. Statistics for random mutations to obtain a 2,000-fold change in expression level with 16 expression-level intermediates
# of Trials for library to have >2,000-fold changes
Min Expression Obtained
Max Expression Obtained
Fold Change
Expression- level
intermediates 12928 18.37 104182.78 5672.71 16 75200 76.45 318858.31 4170.57 16 43952 12.73 166660.50 13096.95 16 38496 7.41 18502.57 2497.66 16 41728 20.02 72024.68 3598.07 16 14528 3.40 19219.82 5660.03 16 54896 86.72 237415.88 2737.64 16 23360 0.59 2051.85 3494.93 16 19312 11.81 26064.61 2207.69 16 5328 8.23 29976.19 3643.99 16
13

Supplementary Table S4. Strains and plasmids used in this study.
Name Relevant characteristics Source Strains
Mach1-T1R F- φ80(lacZ)ΔM15 ΔlacX74 hsdR(r
K
-m
K
+)
ΔrecA1398 endA1 tonA Invitrogen
DH5α F- φ80lacZ∆M15 ∆(lacZYA-argF) U169 recA1 endA1 hsdR17 (rk
-, mk+) gal- phoA
supE44 λ-thi-1 gyrA96 relA1 Invitrogen
HC101 BL21(DE3) ∆ldhA::FRT ∆sthA::FRT ∆hyaB::hydAE-FRT ∆hybC::hydFG-FRT Ref. 12
HC102 HC101 ∆gapA::FRT This study
H0 HC101 with pCDF-Fd-NFOR, pACYCDuet, pETDuet This study
H1 HC102 with pCDF-Fd-NFOR, pA2221, pETDuet-gapA1 This study
H2 HC102 with pCDF-Fd-NFOR, pA2221, pETDuet-gapA2 This study
H3 HC102 with pCDF-Fd-NFOR, pA2221, pETDuet-gapA3 This study
H4 HC102 with pCDF-Fd-NFOR, pA2221, pETDuet-gapA4 This study
H5 HC102 with pCDF-Fd-NFOR, pA2221, pETDuet-gapA5 This study
H6 HC102 with pCDF-Fd-NFOR, pA2221, pETDuet-gapA6 This study
H7 HC102 with pCDF-Fd-Nfor, pA2221, pETDuet-gapA7 This study
H8 HC102 with pCDF-Fd-NFOR, pA2221, pETDuet-gapA8 This study
W3110 F- λ- rph-1 IN(rrnD, rrnE)1 ATCC 27325
WL3
W3110 lysC::BBa_J23100_lysCfbr PdapA::BBa_J23100 PdapB::BBa_J23100 PlysA::BBa_J23100 lacZYA::BBa_J23100-ddh ΔmetL ΔthrA ΔiclR ΔiclR
Ref. 9
WLR4 WL3 Δppc with LysRibo Ref. 9 WLREU WLR4 with pCDF-WLREUppc This study
Plasmids pKD46 Red recombinase expression vector; AmpR Ref. 18 pCP20 FLP expression vector; AmpR Ref. 18 pACYCDuet Expression vector, CmR, p15A ori Novagen pCDFDuet Expression vector, SmR, cloDF13 ori Novagen pETDuet Expression vector, AmpR, ColE1 ori Novagen
14

pKAN pET101/D-TOPO with KanR-cassette Ref. 12 pACYC-sgfp R14 Ref. 5 pACYC-sgfpOpt R20 Ref. 5 pCDF-mCherry pCDFm-XbaI-mCherry-SphI This study pCDF-mCherryOpt pCDFm-XbaI-mCherryOpt-SphI This study pCDF-fd-nfor pCDFm-XbaI-fd-XhoI-nfor-BamHI This study pETDuet-gapA pETm-XbaI-gapA-SphI This study pA2221 pACYDDuet-1 with mutant2221 GAPDH Ref. 12
pETDuet-gapA1 pETm-XbaI-GTTTACACTCAAAGGAGCATATTAC-gapA-SphI
This study
pETDuet-gapA2 pETm-XbaI-BBa_J23100-GTTTACACTCAAAGGAGCATCTTAC-gapA-SphI
This study
pETDuet-gapA3 pETm-XbaI-BBa_J23100-GTTTCCACTCAAAGGAGCATATTAC-gapA-SphI
This study
pETDuet-gapA4 pETm-XbaI-BBa_J23100-GTTTCCACTCAAAGGAGCATCTTAC-gapA-SphI
This study
pETDuet-gapA5 pETm-XbaI-BBa_J23100-GTTTACACTCAAAGAAGCATATTAC-gapA-SphI
This study
pETDuet-gapA6 pETm-XbaI-BBa_J23100-GTTTACACTCAAAGAAGCATCTTAC-gapA-SphI
This study
pETDuet-gapA7 pETm-XbaI-BBa_J23100-GTTTCCACTCAAAGAAGCATATTAC-gapA-SphI
This study
pETDuet-gapA8 pETm-XbaI-BBa_J23100-GTTTCCACTCAAAGAAGCATCTTAC-gapA-SphI
This study
LysRibo pACYCDuet-KpnI-BBa_J23100-lysC UTR-tetA-SacI Ref. 9
pCDF-ppc pCDFDuet-KpnI-ppc-SacI Ref. 9
pCDF-WLREUppc pCDFDuet-KpnI-BBa_J23100-TATCTGCGAAAACTCGGAGCTACAC-ppc-SacI
This study
a Red letters indicate the region of variations in 5’-UTR sequences.
15
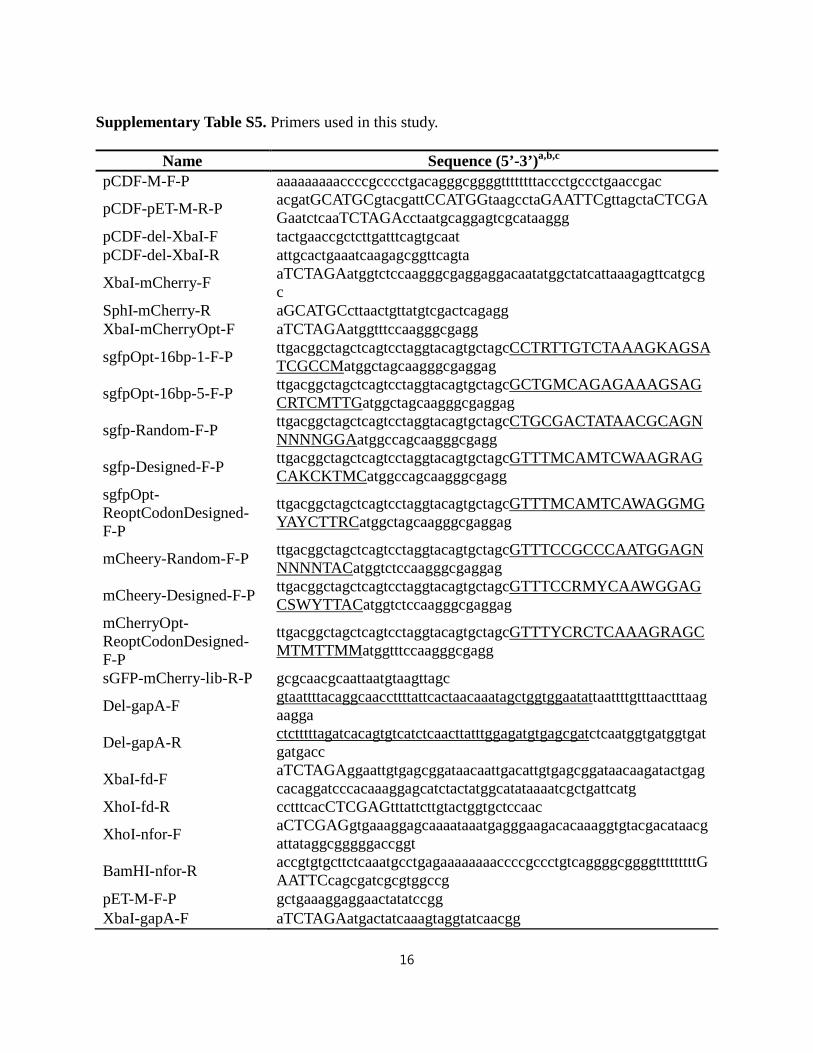
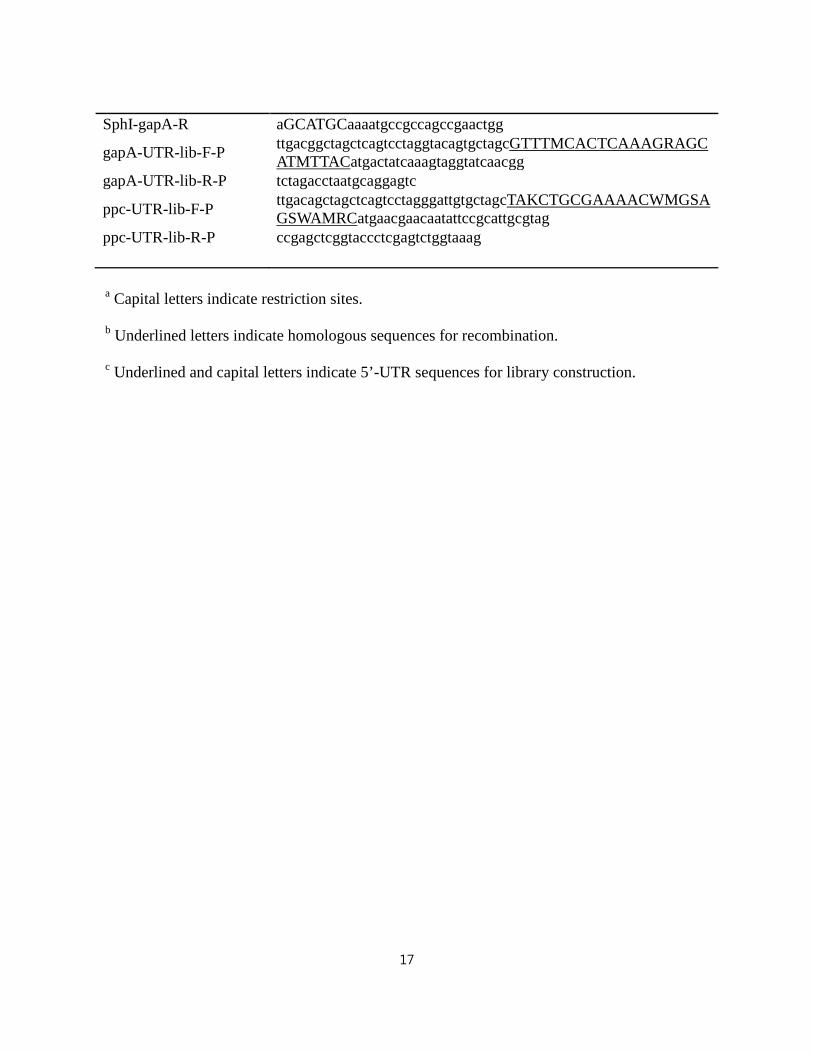
Supplementary Table S5. Primers used in this study.
Name Sequence (5’-3’)a,b,c pCDF-M-F-P aaaaaaaaaccccgcccctgacagggcggggttttttttaccctgccctgaaccgac
pCDF-pET-M-R-P acgatGCATGCgtacgattCCATGGtaagcctaGAATTCgttagctaCTCGAGaatctcaaTCTAGAcctaatgcaggagtcgcataaggg
pCDF-del-XbaI-F tactgaaccgctcttgatttcagtgcaat pCDF-del-XbaI-R attgcactgaaatcaagagcggttcagta
XbaI-mCherry-F aTCTAGAatggtctccaagggcgaggaggacaatatggctatcattaaagagttcatgcgc
SphI-mCherry-R aGCATGCcttaactgttatgtcgactcagagg XbaI-mCherryOpt-F aTCTAGAatggtttccaagggcgagg
sgfpOpt-16bp-1-F-P ttgacggctagctcagtcctaggtacagtgctagcCCTRTTGTCTAAAGKAGSATCGCCMatggctagcaagggcgaggag
sgfpOpt-16bp-5-F-P ttgacggctagctcagtcctaggtacagtgctagcGCTGMCAGAGAAAGSAGCRTCMTTGatggctagcaagggcgaggag
sgfp-Random-F-P ttgacggctagctcagtcctaggtacagtgctagcCTGCGACTATAACGCAGNNNNNGGAatggccagcaagggcgagg
sgfp-Designed-F-P ttgacggctagctcagtcctaggtacagtgctagcGTTTMCAMTCWAAGRAGCAKCKTMCatggccagcaagggcgagg
sgfpOpt-ReoptCodonDesigned-F-P
ttgacggctagctcagtcctaggtacagtgctagcGTTTMCAMTCAWAGGMGYAYCTTRCatggctagcaagggcgaggag
mCheery-Random-F-P ttgacggctagctcagtcctaggtacagtgctagcGTTTCCGCCCAATGGAGNNNNNTACatggtctccaagggcgaggag
mCheery-Designed-F-P ttgacggctagctcagtcctaggtacagtgctagcGTTTCCRMYCAAWGGAGCSWYTTACatggtctccaagggcgaggag
mCherryOpt-ReoptCodonDesigned-F-P
ttgacggctagctcagtcctaggtacagtgctagcGTTTYCRCTCAAAGRAGCMTMTTMMatggtttccaagggcgagg
sGFP-mCherry-lib-R-P gcgcaacgcaattaatgtaagttagc
Del-gapA-F gtaattttacaggcaaccttttattcactaacaaatagctggtggaatattaattttgtttaactttaagaagga
Del-gapA-R ctctttttagatcacagtgtcatctcaacttatttggagatgtgagcgatctcaatggtgatggtgatgatgacc
XbaI-fd-F aTCTAGAggaattgtgagcggataacaattgacattgtgagcggataacaagatactgagcacaggatcccacaaaggagcatctactatggcatataaaatcgctgattcatg
XhoI-fd-R cctttcacCTCGAGtttattcttgtactggtgctccaac
XhoI-nfor-F aCTCGAGgtgaaaggagcaaaataaatgagggaagacacaaaggtgtacgacataacgattataggcgggggaccggt
BamHI-nfor-R accgtgtgcttctcaaatgcctgagaaaaaaaaccccgccctgtcaggggcggggtttttttttGAATTCcagcgatcgcgtggccg
pET-M-F-P gctgaaaggaggaactatatccgg XbaI-gapA-F aTCTAGAatgactatcaaagtaggtatcaacgg
16
SphI-gapA-R aGCATGCaaaatgccgccagccgaactgg
gapA-UTR-lib-F-P ttgacggctagctcagtcctaggtacagtgctagcGTTTMCACTCAAAGRAGCATMTTACatgactatcaaagtaggtatcaacgg
gapA-UTR-lib-R-P tctagacctaatgcaggagtc
ppc-UTR-lib-F-P ttgacagctagctcagtcctagggattgtgctagcTAKCTGCGAAAACWMGSAGSWAMRCatgaacgaacaatattccgcattgcgtag
ppc-UTR-lib-R-P ccgagctcggtaccctcgagtctggtaaag
a Capital letters indicate restriction sites.
b Underlined letters indicate homologous sequences for recombination.
c Underlined and capital letters indicate 5’-UTR sequences for library construction.
17

Supplementary Materials and Methods
Comparison of UTR Library Designer with random trials
We tested how fast UTR Library Designer could reach a desired gene expression range
compared to a random search using gfp as a target. We ran UTR Library Designer 10 times under
16 expression-level intermediates conditions, setting 40 and 200,000 as minimum and maximum
expression levels, respectively. In random searches, we changed 5’-UTR sequences to allow
mutations to create 16 sequences. Ten different test sets with 5,000 trials in each set were
conducted in parallel (50,000 trials for random searches). Statistics for UTR Library Designer
and random trials are depicted in Supplementary Figure S2 and summarized in Supplementary
Tables S1, S2, and S3. We also tested random trials using other genes (ppc and gapA) that were
targets for pathway optimization, applying the same constraints as used for UTR Library
Designer (Supplementary Figure S7 and S8).
18