quake supplementary information - media.nature.com · sp0766 603 superoxide dismutase,...
TRANSCRIPT
nature | methods
An in vitro microfluidic approach to generating protein-
interaction networks
Doron Gerber, Sebastian J Maerkl & Stephen R Quake
Supplementary figures and text:
Supplementary Figure 1 Experimental design
Supplementary Figure 2 GFP calibration curve
Supplementary Figure 3 PING has sensitivity of about 1 �M
Supplementary Figure 4 Protein interaction histogram
Supplementary Table 1 Description of Streptococcus pneumoniae clones
Supplementary Table 2 Statistical significance of the interactions
Supplementary Table 3 List of interactions found by PING
Supplementary Table 4 Expression levels do not bias the interactions.
Supplementary Methods
Note: Supplementary Data is available on the Nature Methods website.
Nature Methods: doi:10.1038/nmeth.1289

Supplementary Figure 1. Experimental design. (a) ORF was PCR amplified for 30 cycles and extended to overlap with the 5’ and 3’ UTRs
(Blue and Red primers) directly from bacteria, avoiding the need for plasmid purification. A
second PCR step (10 cycles) assembled the ORF with the UTRs (step2) to produce an expression
ready template. The template was then amplified for 30 cycles using final primers (yellow). A
cy3 label was added to allow for quality control of the programmed devices. Hi Fi PCR (Roche)
was used to maintain the fidelity of the amplified DNA. (b) An example of a DNA array printed
on an epoxy glass slide ready for chip mounting. DNA is labeled with Cy3. (c) A photograph of
a typical device aligned on a glass substrate. Control and flow lines are illustrated with food
dyes. (d) Pull down / detection scheme for on-chip protein interactions assay. Bait c-terminal tag
is used for pull down. Cy3 labeled anti c-myc is used to detect protein expression and Alexa647
labeled antibody is used to detect prey interaction.
Prey
Bait
Prey
Bait
vector vectorORF
5’ UTR 3’ UTR
Cy3
1st PCR
2nd PCRStep 2
2nd PCRStep 1
ORF5’ UTR 3’ UTRCy3 Finalproduct
ORF+
+
5’ UTR 3’ UTRORF+
vector vectorORFvector vectorORF
5’ UTR 3’ UTR5’ UTR 3’ UTR
Cy3Cy3
1st PCR
2nd PCRStep 2
2nd PCRStep 1
ORF5’ UTR 3’ UTRCy3 ORF5’ UTR 3’ UTRCy3 Finalproduct
ORFORF+
+
5’ UTR 3’ UTRORF5’ UTR5’ UTR 3’ UTR3’ UTRORFORF+
Bait only
Prey only
Bait only
Prey onlyPrey only
a
b d
c
Nature Methods: doi:10.1038/nmeth.1289
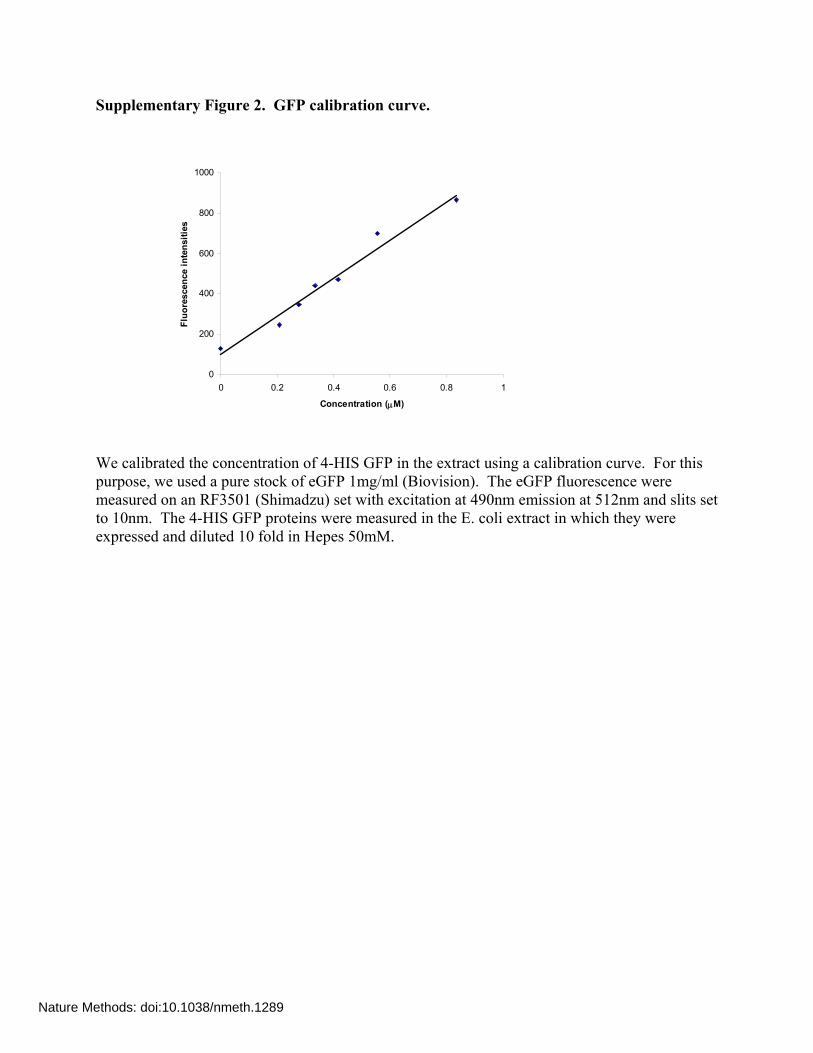
Supplementary Figure 2. GFP calibration curve.
We calibrated the concentration of 4-HIS GFP in the extract using a calibration curve. For this purpose, we used a pure stock of eGFP 1mg/ml (Biovision). The eGFP fluorescence were measured on an RF3501 (Shimadzu) set with excitation at 490nm emission at 512nm and slits set to 10nm. The 4-HIS GFP proteins were measured in the E. coli extract in which they were expressed and diluted 10 fold in Hepes 50mM.
0
200
400
600
800
1000
0 0.2 0.4 0.6 0.8 1
Concentration (μM)
Fluo
resc
ence
inte
nsiti
es
Nature Methods: doi:10.1038/nmeth.1289

Supplementrary Figure 3. PING has sensitivity of about 1 μM.
We measured binding of 4-HIS tagged eGFP to the Penta-HIS antibody (Qiagen). A non-linear least square fitting was used to calculate the binding constant Kd = 884 ± 158 nM (R2 = 0.99; P value < 0.003). Each data point represents between 10-20 replicates.
0
1000
2000
3000
4000
5000
0 1 2 3
Concentration (μM)
Fluo
resc
ence
inte
nsiti
es
Nature Methods: doi:10.1038/nmeth.1289
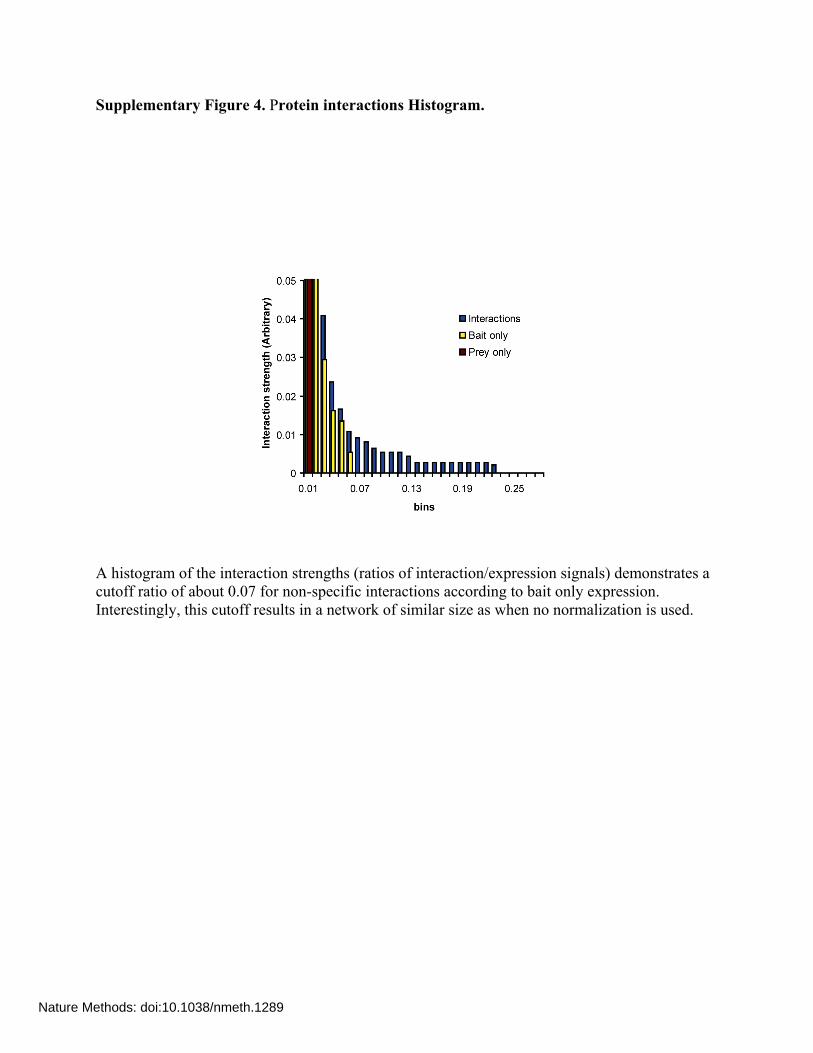
Supplementary Figure 4. Protein interactions Histogram.
A histogram of the interaction strengths (ratios of interaction/expression signals) demonstrates a cutoff ratio of about 0.07 for non-specific interactions according to bait only expression. Interestingly, this cutoff results in a network of similar size as when no normalization is used.
Nature Methods: doi:10.1038/nmeth.1289
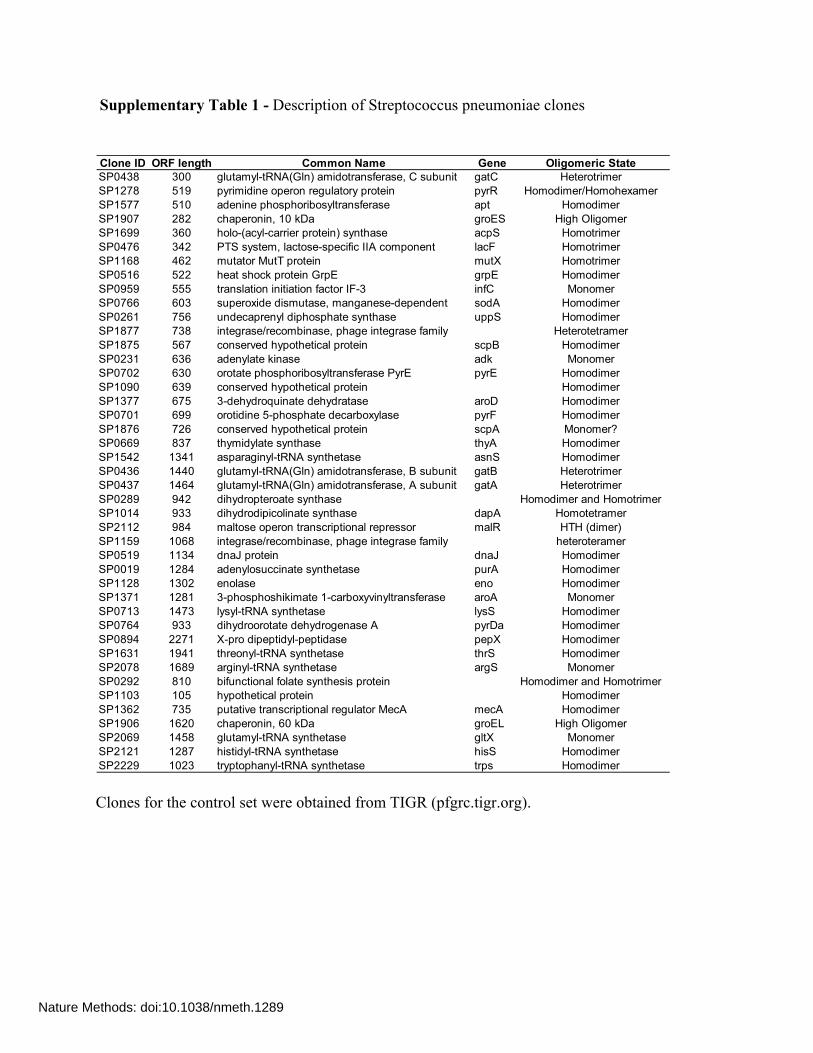
Supplementary Table 1 - Description of Streptococcus pneumoniae clones Clones for the control set were obtained from TIGR (pfgrc.tigr.org).
Clone ID ORF length Common Name Gene Oligomeric StateSP0438 300 glutamyl-tRNA(Gln) amidotransferase, C subunit gatC HeterotrimerSP1278 519 pyrimidine operon regulatory protein pyrR Homodimer/HomohexamerSP1577 510 adenine phosphoribosyltransferase apt HomodimerSP1907 282 chaperonin, 10 kDa groES High OligomerSP1699 360 holo-(acyl-carrier protein) synthase acpS HomotrimerSP0476 342 PTS system, lactose-specific IIA component lacF HomotrimerSP1168 462 mutator MutT protein mutX HomotrimerSP0516 522 heat shock protein GrpE grpE HomodimerSP0959 555 translation initiation factor IF-3 infC MonomerSP0766 603 superoxide dismutase, manganese-dependent sodA HomodimerSP0261 756 undecaprenyl diphosphate synthase uppS HomodimerSP1877 738 integrase/recombinase, phage integrase family HeterotetramerSP1875 567 conserved hypothetical protein scpB HomodimerSP0231 636 adenylate kinase adk MonomerSP0702 630 orotate phosphoribosyltransferase PyrE pyrE HomodimerSP1090 639 conserved hypothetical protein HomodimerSP1377 675 3-dehydroquinate dehydratase aroD HomodimerSP0701 699 orotidine 5-phosphate decarboxylase pyrF HomodimerSP1876 726 conserved hypothetical protein scpA Monomer?SP0669 837 thymidylate synthase thyA HomodimerSP1542 1341 asparaginyl-tRNA synthetase asnS HomodimerSP0436 1440 glutamyl-tRNA(Gln) amidotransferase, B subunit gatB HeterotrimerSP0437 1464 glutamyl-tRNA(Gln) amidotransferase, A subunit gatA HeterotrimerSP0289 942 dihydropteroate synthase Homodimer and HomotrimerSP1014 933 dihydrodipicolinate synthase dapA HomotetramerSP2112 984 maltose operon transcriptional repressor malR HTH (dimer)SP1159 1068 integrase/recombinase, phage integrase family heteroteramerSP0519 1134 dnaJ protein dnaJ HomodimerSP0019 1284 adenylosuccinate synthetase purA HomodimerSP1128 1302 enolase eno HomodimerSP1371 1281 3-phosphoshikimate 1-carboxyvinyltransferase aroA MonomerSP0713 1473 lysyl-tRNA synthetase lysS HomodimerSP0764 933 dihydroorotate dehydrogenase A pyrDa HomodimerSP0894 2271 X-pro dipeptidyl-peptidase pepX HomodimerSP1631 1941 threonyl-tRNA synthetase thrS HomodimerSP2078 1689 arginyl-tRNA synthetase argS MonomerSP0292 810 bifunctional folate synthesis protein Homodimer and HomotrimerSP1103 105 hypothetical protein HomodimerSP1362 735 putative transcriptional regulator MecA mecA HomodimerSP1906 1620 chaperonin, 60 kDa groEL High OligomerSP2069 1458 glutamyl-tRNA synthetase gltX MonomerSP2121 1287 histidyl-tRNA synthetase hisS HomodimerSP2229 1023 tryptophanyl-tRNA synthetase trps Homodimer
Nature Methods: doi:10.1038/nmeth.1289

Supplementary Table 2 - Statistical significance of the interactions
n1 n2 U P (two-tailed) P (one-tailed) 1273 25 31299 <2 x10-06* <1 x 10-06*
Normal approximation z=8.29 1.13 x 10-16* 5.67 x 10-17* * These values are approximate.
Nature Methods: doi:10.1038/nmeth.1289
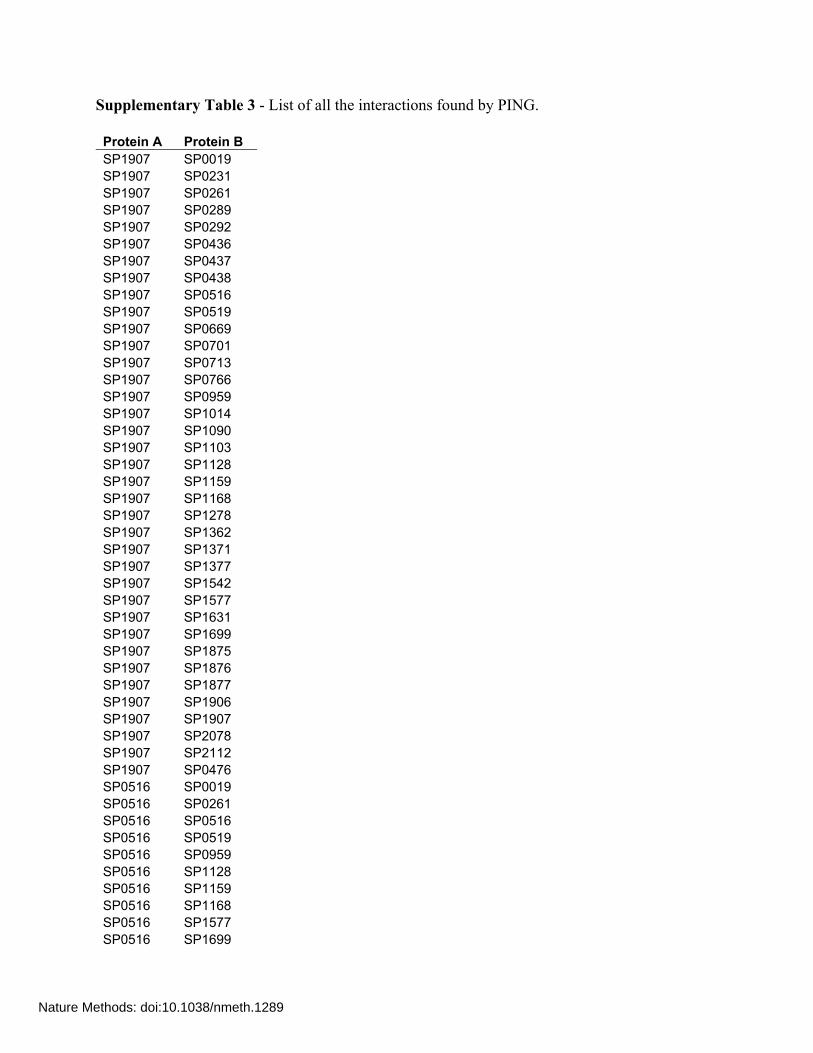
Supplementary Table 3 - List of all the interactions found by PING. Protein A Protein B SP1907 SP0019 SP1907 SP0231 SP1907 SP0261 SP1907 SP0289 SP1907 SP0292 SP1907 SP0436 SP1907 SP0437 SP1907 SP0438 SP1907 SP0516 SP1907 SP0519 SP1907 SP0669 SP1907 SP0701 SP1907 SP0713 SP1907 SP0766 SP1907 SP0959 SP1907 SP1014 SP1907 SP1090 SP1907 SP1103 SP1907 SP1128 SP1907 SP1159 SP1907 SP1168 SP1907 SP1278 SP1907 SP1362 SP1907 SP1371 SP1907 SP1377 SP1907 SP1542 SP1907 SP1577 SP1907 SP1631 SP1907 SP1699 SP1907 SP1875 SP1907 SP1876 SP1907 SP1877 SP1907 SP1906 SP1907 SP1907 SP1907 SP2078 SP1907 SP2112 SP1907 SP0476 SP0516 SP0019 SP0516 SP0261 SP0516 SP0516 SP0516 SP0519 SP0516 SP0959 SP0516 SP1128 SP0516 SP1159 SP0516 SP1168 SP0516 SP1577 SP0516 SP1699
Nature Methods: doi:10.1038/nmeth.1289

SP0519 SP0019 SP0519 SP0261 SP0519 SP0519 SP0669 SP1877 SP0669 SP0669 SP1014 SP1014 SP1875 SP1876 SP1875 SP1875 SP1875 SP1377 SP1875 SP1103 SP1875 SP0766 SP1875 SP0261 SP1875 SP0231 SP0766 SP1875 SP0766 SP0766 SP1876 SP1875 SP1128 SP0519 SP1128 SP2069 SP1128 SP1542 SP1128 SP1371 SP1128 SP1159 SP1128 SP1128 SP1128 SP0713 SP1128 SP0437 SP1128 SP0436 SP1128 SP0261 SP1128 SP0019 SP0701 SP1876 SP0701 SP1377 SP0701 SP0701 SP0701 SP0437 SP0701 SP0261 SP0701 SP0019 SP0702 SP0702 SP2112 SP0519 SP2112 SP2112 SP2112 SP1159 SP2112 SP0261 SP0289 SP2112 SP0289 SP0289 SP0437 SP1876 SP0437 SP0438 SP0436 SP1577 SP0436 SP0764 SP0436 SP0261 SP0436 SP0231 SP0438 SP1907 SP0438 SP0516 SP0438 SP0519 SP0438 SP0476
Nature Methods: doi:10.1038/nmeth.1289

SP0438 SP2112 SP0438 SP2078 SP0438 SP1875 SP0438 SP1699 SP0438 SP1577 SP0438 SP1542 SP0438 SP1377 SP0438 SP1371 SP0438 SP1362 SP0438 SP1278 SP0438 SP1168 SP0438 SP1159 SP0438 SP1128 SP0438 SP1103 SP0438 SP1090 SP0438 SP1014 SP0438 SP0959 SP0438 SP0766 SP0438 SP0713 SP0438 SP0702 SP0438 SP0701 SP0438 SP0669 SP0438 SP0438 SP0438 SP0437 SP0438 SP0436 SP0438 SP0261 SP0438 SP0231 SP0476 SP1362 SP0476 SP0476 SP0476 SP0261 SP1090 SP1877 SP1090 SP1090 SP1278 SP0519 SP1278 SP1577 SP1278 SP1278 SP1278 SP1128 SP1278 SP1103 SP1278 SP0764 SP1278 SP0438 SP1278 SP0261 SP1577 SP1906 SP1577 SP1577 SP1577 SP1362 SP1577 SP1159 SP1577 SP0436 SP1577 SP0261 SP1377 SP0519 SP1377 SP1577 SP1377 SP0261 SP0261 SP1090
Nature Methods: doi:10.1038/nmeth.1289

SP0261 SP0959 SP0261 SP0261 SP1168 SP0519 SP1168 SP0261 SP1699 SP0519 SP1699 SP1699 SP1699 SP0261 SP0019 SP0519 SP0019 SP0261 SP0019 SP0019 SP0894 - SP2121 - SP2229 -
The last 3 are proteins with no interacting partners.
Nature Methods: doi:10.1038/nmeth.1289

Supplementary Table 4 - Expression levels do not bias the interactions.
Clone High end Clone Low
end SP0019 5 SP1278 11 SP1159 3 SP0959 4 SP1168 3 SP1577 10 SP0436 2 SP0894 0 SP0437 5 SP2121 0 SP1014 0 SP0764 2 SP0231 5 SP1876 5 SP0702 6 SP2229 0 SP0289 7 SP1377 7 SP0669 6 SP1362 3 Average 4.2 4.2 STD 2.2 4.0 We compared the average number of interactions per protein for 10 proteins from the low end and 10 proteins from the high end of the protein expression distribution. The average number of interactions per protein is the same.
Nature Methods: doi:10.1038/nmeth.1289
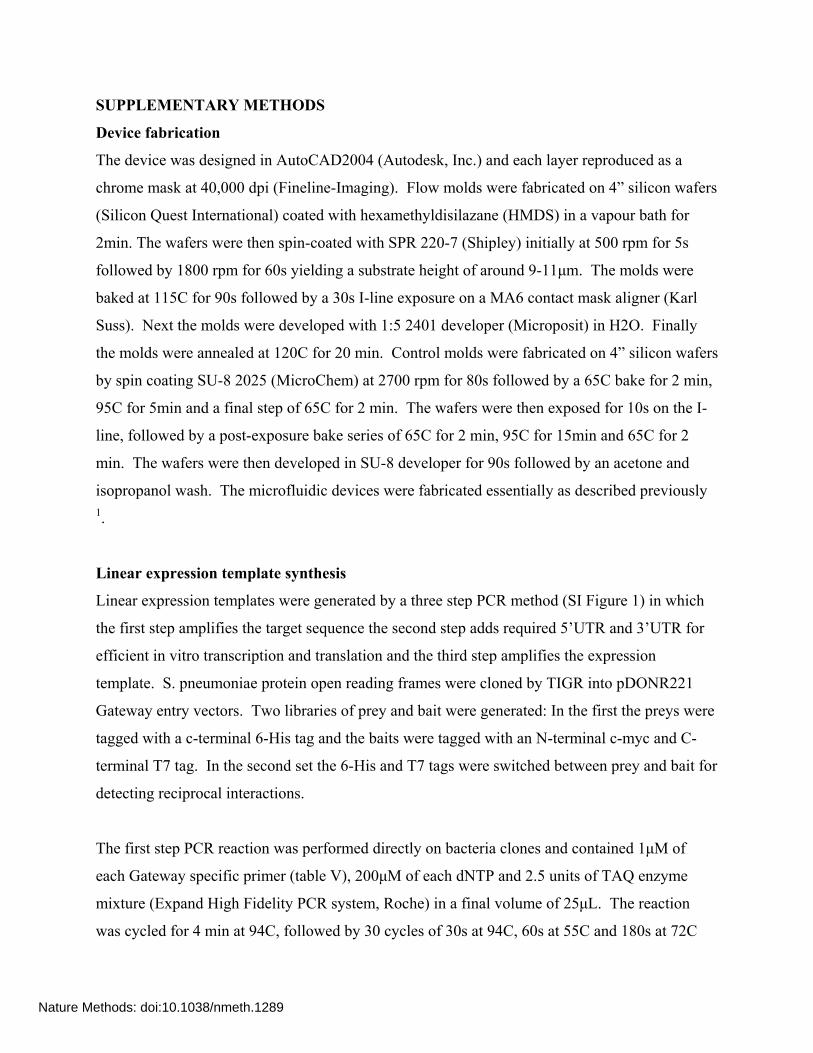
SUPPLEMENTARY METHODS
Device fabrication
The device was designed in AutoCAD2004 (Autodesk, Inc.) and each layer reproduced as a
chrome mask at 40,000 dpi (Fineline-Imaging). Flow molds were fabricated on 4” silicon wafers
(Silicon Quest International) coated with hexamethyldisilazane (HMDS) in a vapour bath for
2min. The wafers were then spin-coated with SPR 220-7 (Shipley) initially at 500 rpm for 5s
followed by 1800 rpm for 60s yielding a substrate height of around 9-11μm. The molds were
baked at 115C for 90s followed by a 30s I-line exposure on a MA6 contact mask aligner (Karl
Suss). Next the molds were developed with 1:5 2401 developer (Microposit) in H2O. Finally
the molds were annealed at 120C for 20 min. Control molds were fabricated on 4” silicon wafers
by spin coating SU-8 2025 (MicroChem) at 2700 rpm for 80s followed by a 65C bake for 2 min,
95C for 5min and a final step of 65C for 2 min. The wafers were then exposed for 10s on the I-
line, followed by a post-exposure bake series of 65C for 2 min, 95C for 15min and 65C for 2
min. The wafers were then developed in SU-8 developer for 90s followed by an acetone and
isopropanol wash. The microfluidic devices were fabricated essentially as described previously 1.
Linear expression template synthesis
Linear expression templates were generated by a three step PCR method (SI Figure 1) in which
the first step amplifies the target sequence the second step adds required 5’UTR and 3’UTR for
efficient in vitro transcription and translation and the third step amplifies the expression
template. S. pneumoniae protein open reading frames were cloned by TIGR into pDONR221
Gateway entry vectors. Two libraries of prey and bait were generated: In the first the preys were
tagged with a c-terminal 6-His tag and the baits were tagged with an N-terminal c-myc and C-
terminal T7 tag. In the second set the 6-His and T7 tags were switched between prey and bait for
detecting reciprocal interactions.
The first step PCR reaction was performed directly on bacteria clones and contained 1μM of
each Gateway specific primer (table V), 200μM of each dNTP and 2.5 units of TAQ enzyme
mixture (Expand High Fidelity PCR system, Roche) in a final volume of 25μL. The reaction
was cycled for 4 min at 94C, followed by 30 cycles of 30s at 94C, 60s at 55C and 180s at 72C
Nature Methods: doi:10.1038/nmeth.1289
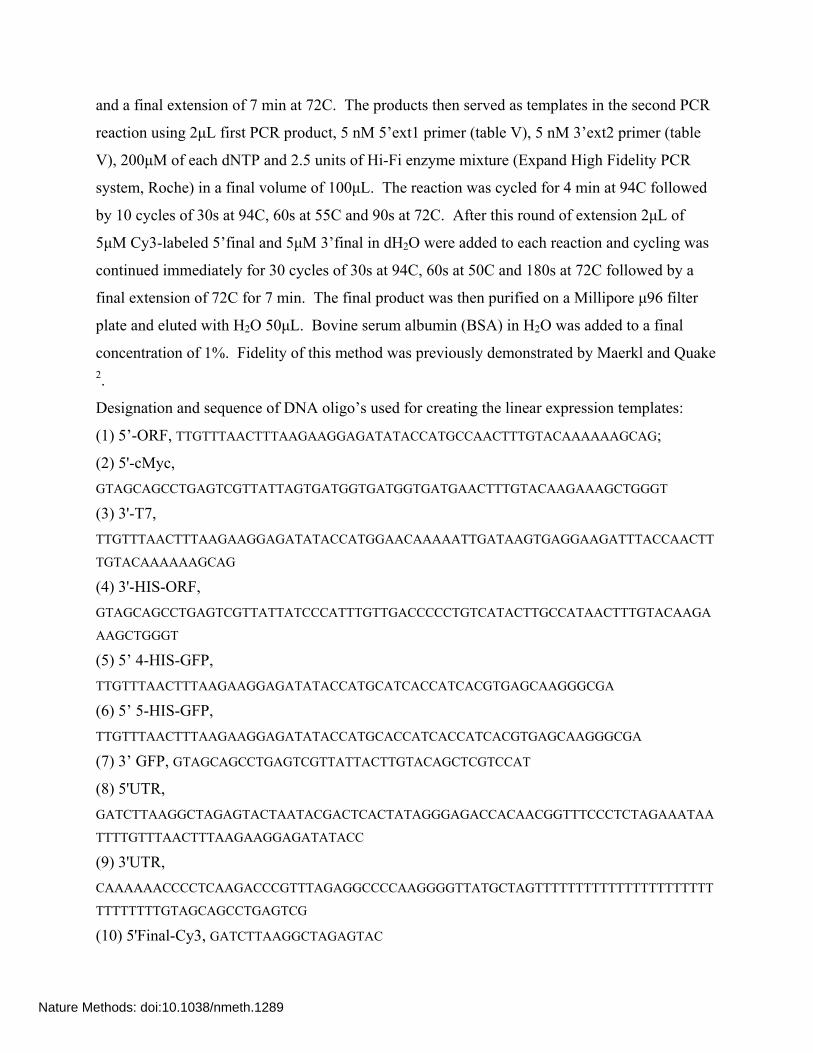
and a final extension of 7 min at 72C. The products then served as templates in the second PCR
reaction using 2μL first PCR product, 5 nM 5’ext1 primer (table V), 5 nM 3’ext2 primer (table
V), 200μM of each dNTP and 2.5 units of Hi-Fi enzyme mixture (Expand High Fidelity PCR
system, Roche) in a final volume of 100μL. The reaction was cycled for 4 min at 94C followed
by 10 cycles of 30s at 94C, 60s at 55C and 90s at 72C. After this round of extension 2μL of
5μM Cy3-labeled 5’final and 5μM 3’final in dH2O were added to each reaction and cycling was
continued immediately for 30 cycles of 30s at 94C, 60s at 50C and 180s at 72C followed by a
final extension of 72C for 7 min. The final product was then purified on a Millipore μ96 filter
plate and eluted with H2O 50μL. Bovine serum albumin (BSA) in H2O was added to a final
concentration of 1%. Fidelity of this method was previously demonstrated by Maerkl and Quake 2.
Designation and sequence of DNA oligo’s used for creating the linear expression templates:
(1) 5’-ORF, TTGTTTAACTTTAAGAAGGAGATATACCATGCCAACTTTGTACAAAAAAGCAG;
(2) 5'-cMyc, GTAGCAGCCTGAGTCGTTATTAGTGATGGTGATGGTGATGAACTTTGTACAAGAAAGCTGGGT (3) 3'-T7, TTGTTTAACTTTAAGAAGGAGATATACCATGGAACAAAAATTGATAAGTGAGGAAGATTTACCAACTT
TGTACAAAAAAGCAG (4) 3'-HIS-ORF, GTAGCAGCCTGAGTCGTTATTATCCCATTTGTTGACCCCCTGTCATACTTGCCATAACTTTGTACAAGA
AAGCTGGGT (5) 5’ 4-HIS-GFP, TTGTTTAACTTTAAGAAGGAGATATACCATGCATCACCATCACGTGAGCAAGGGCGA (6) 5’ 5-HIS-GFP, TTGTTTAACTTTAAGAAGGAGATATACCATGCACCATCACCATCACGTGAGCAAGGGCGA
(7) 3’ GFP, GTAGCAGCCTGAGTCGTTATTACTTGTACAGCTCGTCCAT
(8) 5'UTR, GATCTTAAGGCTAGAGTACTAATACGACTCACTATAGGGAGACCACAACGGTTTCCCTCTAGAAATAA
TTTTGTTTAACTTTAAGAAGGAGATATACC (9) 3'UTR, CAAAAAACCCCTCAAGACCCGTTTAGAGGCCCCAAGGGGTTATGCTAGTTTTTTTTTTTTTTTTTTTTTT
TTTTTTTTGTAGCAGCCTGAGTCG (10) 5'Final-Cy3, GATCTTAAGGCTAGAGTAC
Nature Methods: doi:10.1038/nmeth.1289

(11) 3'Final, CAAAAAACCCCTCAAGAC
First 4 oligo’s were used for extracting the open reading frames out of the Gateway vector
(Invitrogen). Oligos 5-7 were used to create a linear template for the expression of 4- and 5-HIS
tagged eGFP. Oligo’s 8-9 were used for adding the 5’ and 3’ UTRs onto the linear templates.
The last 2 oligo’s were used to amplify the linear expression template.
DNA arraying and device alignment
Expression templates were spotted with an OmniGrid Micro (GeneMachines) microarrayer using
a CMP3B pin (TeleChem International, Inc.) for delivery onto epoxy coated glass substrates
(CEL Associates). Each sample solution contained 1% BSA in H2O to prevent covalent linkage
of the target DNA to the epoxy functional groups as well as for visualization during alignment.
After spotting the arrays were quality controlled on a GenePix4000B (Molecular Devices). The
arrays could then be stored in the dark at room temperature until aligned to a microfluidic device.
Device alignment was done manually on a SMZ1500 (Nikon) stereoscope and bonded overnight
on a heated plate at 40C.
Surface chemistry, protein synthesis and MITOMI
All devices were driven between 10 and 15 psi in the control line and 6 psi for the flow line. For
the initial surface derivatization steps the chamber valves remained closed to prevent liquid from
entering the chambers containing the spotted DNA targets. First, all accessible surface area was
derivatized by flowing a solution of biotinylated BSA (Pierce) resuspended to 2 mg/mL in H2O
for 30 min followed by a 5 min PBS wash. Next a 0.5 mg/mL Neutravidin (Pierce) solution in
PBS was flown for 30 min, followed by a 5 min PBS wash. The “button” membrane was closed
and the PBS wash continued for an additional 5 min. Then all remaining accessible surface area
was passivated with biotinylated BSA for 30 min, followed by a 10 min PBS wash. Finally a 1:4
solution of biotinylated-penta-histidine (Qiagen) or biotinylated anti T7 antibody (EMD
Biosciences) in 2% BSA in PBS was loaded for 2-5 min, after which the ”button” membrane was
opened and flow continued for 30 min, again followed by a 10 min PBS completing the surface
derivatization procedure.
Nature Methods: doi:10.1038/nmeth.1289
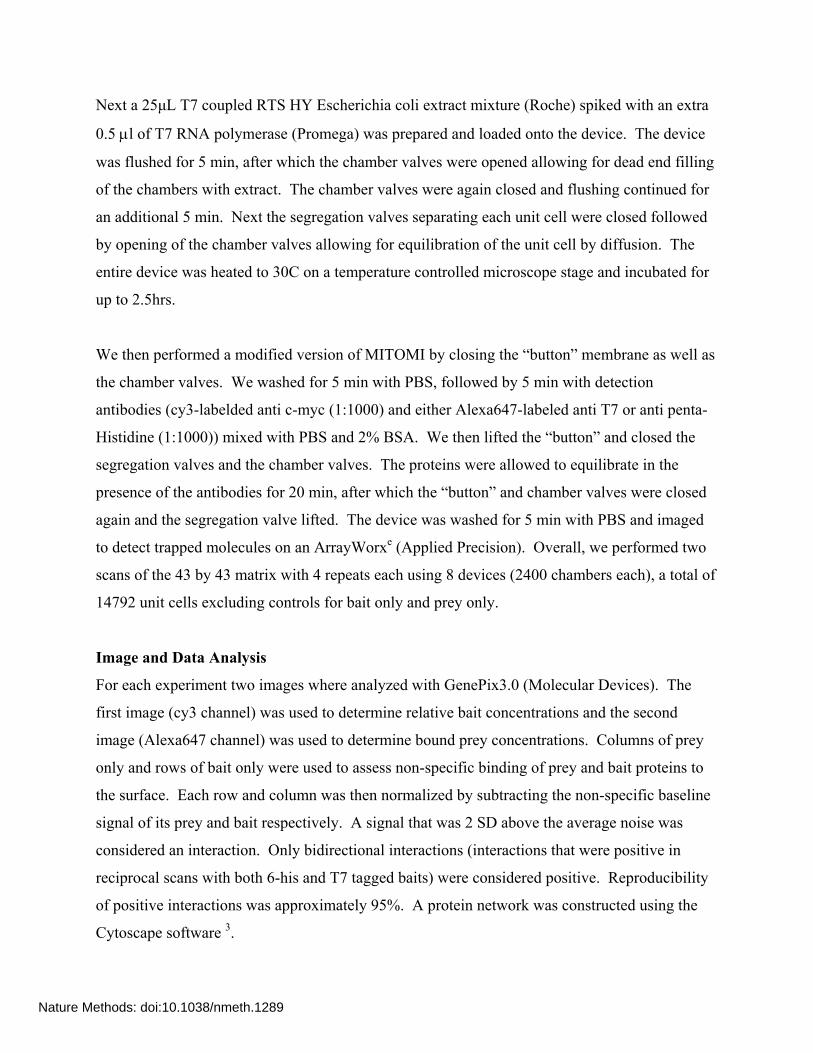
Next a 25μL T7 coupled RTS HY Escherichia coli extract mixture (Roche) spiked with an extra
0.5 μl of T7 RNA polymerase (Promega) was prepared and loaded onto the device. The device
was flushed for 5 min, after which the chamber valves were opened allowing for dead end filling
of the chambers with extract. The chamber valves were again closed and flushing continued for
an additional 5 min. Next the segregation valves separating each unit cell were closed followed
by opening of the chamber valves allowing for equilibration of the unit cell by diffusion. The
entire device was heated to 30C on a temperature controlled microscope stage and incubated for
up to 2.5hrs.
We then performed a modified version of MITOMI by closing the “button” membrane as well as
the chamber valves. We washed for 5 min with PBS, followed by 5 min with detection
antibodies (cy3-labelded anti c-myc (1:1000) and either Alexa647-labeled anti T7 or anti penta-
Histidine (1:1000)) mixed with PBS and 2% BSA. We then lifted the “button” and closed the
segregation valves and the chamber valves. The proteins were allowed to equilibrate in the
presence of the antibodies for 20 min, after which the “button” and chamber valves were closed
again and the segregation valve lifted. The device was washed for 5 min with PBS and imaged
to detect trapped molecules on an ArrayWorxe (Applied Precision). Overall, we performed two
scans of the 43 by 43 matrix with 4 repeats each using 8 devices (2400 chambers each), a total of
14792 unit cells excluding controls for bait only and prey only.
Image and Data Analysis
For each experiment two images where analyzed with GenePix3.0 (Molecular Devices). The
first image (cy3 channel) was used to determine relative bait concentrations and the second
image (Alexa647 channel) was used to determine bound prey concentrations. Columns of prey
only and rows of bait only were used to assess non-specific binding of prey and bait proteins to
the surface. Each row and column was then normalized by subtracting the non-specific baseline
signal of its prey and bait respectively. A signal that was 2 SD above the average noise was
considered an interaction. Only bidirectional interactions (interactions that were positive in
reciprocal scans with both 6-his and T7 tagged baits) were considered positive. Reproducibility
of positive interactions was approximately 95%. A protein network was constructed using the
Cytoscape software 3.
Nature Methods: doi:10.1038/nmeth.1289

Co-immunoprecipitation experiments
Prey and bait proteins were co-expressed in a 50μL of Roche RTS HY extract for 2.5hrs at 30C
and 600 rpm (Roche RTS Proteomaster). As a control for non-specific binding of prey and
antibody to the beads, preys were expressed in the absence of bait. Next, 1μL of Ni-NTA
agarose magnetic beads (Qiagen) and Alexa647-labeled anti T7 antibody (final dilution 1:1000)
were added. Mixture was incubated for an additional 15 min. Beads were then pulled down
with a magnet and washed once with 250μL of PBS. Proteins were then eluted from the beads
using 200 mM imidazole in PBS. The soluble Alexa647 probe from each reaction was read on a
fluorimeter (Shimadzu RS 5301PC) in duplicates. Excitation was set to 647 nm and emission set
to 670 nm, both with 5 nm slits. Alexa647 signal after subtraction of the respective control
reaction is proportional to the strength of the interaction between the corresponding prey and
bait. Overall, we tested 13 prey and bait pairs with 6 known interactions, 6 unknown interactions
and 1 non-interacting pair as a negative control. The experiment was repeated twice.
Determining eGFP concentrations
A linear template for 4- and 5- HIS tagged eGFP were constructed using the PCR method
described above (SI table V). The constructs were expressed in vitro with the Roche RTS 100
kit in a 50 ul volumes and their concentrations in the extract were determined using the eGFP
fluorescence. For this purpose we made an eGFP calibration curve from a stock of pure eGFP
1mg/ml (Biovision) SI Figure 2.
Determining 4-HIS eGFP binding constant
In order to find the sensitivity of PING we did the following experiment: We flowed a series of
increasing 4-HIS GFP (or 5-HIS eGFP) concentrations on a device with a Penta-HIS antibody
(Qiagen) surface chemistry. Each concentration was flowed into two channels for 5 min each
with a total of 8 different concentrations. Hepes 50mM was used as concentration 0. We then
incubated the eGFPs in the presence of the antibody for 30 min. MITOMI was performed and the
results were imaged. The binding constant of 4-HIS eGFP to the Penta-HIS antibody was
determined by a non-linear least square fitting to F=Fmax*[C]/(Kd+[C]), where F is the
Nature Methods: doi:10.1038/nmeth.1289
fluorescence intensities obtained from PING, C is the concentration of 4-HIS eGFP and Kd is the
binding constant.
Supplementary References
1. Thorsen, T., Maerkl, S.J. & Quake, S.R. Microfluidic large-scale integration. Science
298, 580-584 (2002).
2. Maerkl, S.J. & Quake, S.R. A systems approach to measuring the binding energy
landscapes of transcription factors. Science 315, 233-237 (2007).
3. Shannon, P., et al. Cytoscape: a software environment for integrated models of
biomolecular interaction networks. Genome research 13, 2498-2504 (2003).
Nature Methods: doi:10.1038/nmeth.1289