supplementary information - media.nature.com · acciptridae, strigiformes, caprimulgidae and...
TRANSCRIPT

Diversification analyses:
Table S1. Sampling for diversification analyses
Table S2. Summary statistics for diversification analyses
Figure S1. Effects of sampling fraction and phylogenetic uncertainty on diversification analyses.
Posterior distributions accounting for sampling fraction, both sampling fraction and
phylogenetic uncertainty, or neither for the three groups most sensitive to these effects
(Striginae+Suriinae, Falconidae, Caprimulgidae)
Supplementary Note: Effects of differences in sampling levels for CP and non-CP taxa on
speciation and transition rates and tip branch length estimates.
Phylogenies:
Supplementary Methods: Detailed phylogenetic methods and key references for molecular
phylogenetic data
Table S3. Number of sites and accessions for each gene used in each family-level phylogeny
Table S4. Number of sites, accessions and proportion of taxa with each gene for passerine
phylogeny
Table S5. List of genes for all phylogenies
Table S6. Datamatrix summary statistics and node support
Table S7. Proportion of tips and internal nodes with mitochondrial and nuclear genes for each
phylogeny
Figure S2. Genes contributing information across the depth of the passerine phylogeny
Figures S3-S7. Phylogenies for the Accipitridae, Strigiformes, Caprimulgiformes, Falconidae and
Galliformes.
SUPPLEMENTARY INFORMATIONdoi:10.1038/nature11050
WWW.NATURE.COM/NATURE | 1

Table S1. Sampling for diversification analyses
Group Sub-group Taxonomy Data Sampling fraction
all CP Proportion CP all CP non-CP CP
Accipitridae 250 53 0.21 178 43 0.69 0.81
Buteonines & Sea Eagles 71 17 0.24 68 17 0.94 1.00
Strigiformes 220 61 0.28 108 45 0.40 0.74
Striginae & Surniinae 174 59 0.34 92 44 0.42 0.75
Surniinae 39 12 0.31 23 8 0.56 0.67
Striginae 138 47 0.34 69 36 0.36 0.77
Caprimulgidae 92 21 0.23 57 15 0.59 0.71
Falconidae 65 9 0.14 50 9 0.73 1.00
Phasianidae 181 15 0.08 130 12 0.71 0.80
Taxonomy and sampling based on IOC 2.4 species. Data and sampling fraction show the absolute numbers
and proportions of species in the molecular phylogenies used for diversification analyses.
SUPPLEMENTARY INFORMATIONRESEARCHdoi:10.1038/nature11050
WWW.NATURE.COM/NATURE | 2

Tab
le S
2. S
um
ma
ry s
tati
stic
s fo
r d
ive
rsif
icat
ion
an
alys
es.
Ti
p
bran
ch
leng
ths
Phyl
ogen
etic
clus
terin
g
BiS
SE
div
ersi
ficat
ion
anal
yses
M
axim
um L
ikel
ihoo
d Ba
yesi
an M
CM
C
Gro
up
Sub-
grou
p
all/C
P
ratio
MP
step
s
Pro
porti
on
resh
uffle
s
with
MP
step
s ≤
CP
λ 1/λ
0∆
lnL
p
q 10/
q 01
∆ln
L p
q 10/ λ 1
µ/λ
λ 1/λ
0
Pro
porti
on
of s
teps
with
λ1≤λ 0
q 10/q
01
Pro
porti
on
of s
teps
with
q 10≤
q 01
q 10/
λ1
µ/λ
Acci
pitri
dae
0.
88
30/4
3 0.
001
2.71
9.
49
1.3E
-05
6.92
12
.75
4.4E
-07
0.95
1.
4E-0
52.
83
<0.0
001
6.18
<0
.000
1 1.
00
0.17
Bu
teon
ines
+
Sea
Eagl
es
0.63
12
/17
0.02
3 3.
96
9.99
7.
8E-0
621
.83
6.71
2.
5E-0
4 0.
69
2.9E
-07
4.42
<0
.000
1 12
.39
<0.0
001
0.73
0.
25
Stri
gifo
rmes
0.84
26
/45
0.00
2 1.
36
0.56
0.
2910
15.4
610
.05
7.3E
-06
0.59
3.
7E-0
71.
57
0.06
48
10.1
0 0.
0018
0.
62
0.10
Strig
inae
+Sur
niin
ae
0.82
25
/44
0.02
0 1.
97
2.15
0.
0379
>>10
7.78
8.
0E-0
5 0.
64
7.7E
-07
1.99
0.
0453
4.
42
0.00
40
0.64
0.
16
Su
rniin
ae
0.67
5/
8 0.
088
5.40
3.
61
0.00
72>>
103.
15
0.01
20
0.64
6.
6E-0
65.
11
0.00
46
6.91
0.
0025
0.
78
0.36
St
rigin
ae
0.94
20
/36
0.09
9 0.
48
0.36
0.
3992
1.61
0.
64
0.25
73
2.73
1.
9E-0
80.
38
0.90
81
1.39
0.
2795
0.
76
1.12
Cap
rimul
gida
e
0.86
12
/15
0.18
5 4.
58
5.04
0.
0015
>>10
5.32
0.
0011
0.
75
2.5E
073.
84
0.13
18
9.51
0.
0113
0.
69
0.14
Falc
onid
ae
0.
62
9/9
1.00
0 3.
19
0.55
0.
5763
7.79
2.
14
0.03
86
1.93
5.
3E07
2.03
0.
2960
5.
27
0.01
40
2.4
0.17
Phas
iani
dae
1.
19
11/1
2 0.
294
0.13
0.
97
0.16
328.
04
0.35
0.
4057
4.
71
9.3E
050.
38
0.84
58
6.36
0.
0417
13
.3
2.00
CP
= C
olou
r Pol
ymor
phic
spe
cies
= s
tate
1, n
on-C
P =
sta
te 0
. Ana
lyse
s us
e B
EA
ST
trees
, cal
ibra
ted
to a
n ar
bitra
ry m
ean
rate
of 0
.01,
ther
efor
e ab
solu
te v
alue
s of
rate
par
amet
ers
are
arbi
trary
an
d un
ique
to e
ach
maj
or g
roup
and
sho
uld
not b
e co
mpa
red.
Bay
esia
n an
alys
es (M
CM
C) u
se 5
0 BE
AST
sam
ple
trees
with
100
0 st
ep M
CM
C e
ach
(= p
ool o
f 50,
000
step
s). A
ll ot
her a
naly
ses
use
the
BE
AS
T m
edia
n no
de h
eigh
t max
imum
cla
de c
redi
bilit
y (M
CC
) tre
e. T
he M
P s
teps
col
umn
show
s th
e ob
serv
ed n
umbe
r of m
axim
um p
arsi
mon
y in
ferre
d ch
ange
s fo
r the
CP
sta
te, w
ith th
e m
axim
um p
ossi
ble
num
ber o
f cha
nges
afte
r the
forw
ard
slas
h. T
he p
ropo
rtion
of r
eshu
ffles
with
MP
ste
ps ≤
CP
refe
rs to
the
frequ
ency
that
rand
omis
atio
ns s
how
gre
ater
than
or e
qual
clu
ster
ing
than
obs
erve
d. P
hylo
gene
tic c
lust
erin
g an
alys
es w
ere
done
in M
esqu
ite u
sing
100
0 ra
ndom
isat
ions
. BiS
SE
div
ersi
ficat
ion
rate
ana
lyse
s us
ing
Div
ersi
tree
0.6-
1 an
d 0.
7-6,
with
sam
plin
g fra
ctio
n.
λ 1 =
spe
ciat
ion
rate
for s
tate
1 (C
P), λ 0
= s
peci
atio
n ra
te fo
r sta
te 0
(non
-CP
). S
peci
atio
n ra
te ra
tio =
λ1/λ
0. Tr
ansi
tion
away
ratio
= q
10/q
01 =
ratio
of t
rans
ition
rate
from
CP
to n
on-C
P, o
ver t
he
trans
ition
rate
from
non
-CP
to C
P. ∆
lnL
= lo
g lik
elih
ood
diffe
renc
e be
twee
n op
timal
and
equ
al s
peci
atio
n ra
te m
odel
s. P
= p
roba
bilit
y th
at e
qual
rate
mod
el is
wor
se fi
t, by
AN
OV
A P
r(>|C
hi|)
6 vs
5
d.f.
q 10/λ
1 is
the
ratio
of t
he tr
ansi
tion
rate
aw
ay fr
om p
olym
orph
ism
to th
e sp
ecia
tion
rate
for t
he p
olym
orph
ic s
tate
: the
se tw
o ra
tes
are
gene
rally
of s
imila
r mag
nitu
de (r
atio
clo
se to
one
). C
P
µ/λ
is th
e ra
tio o
f ext
inct
ion
rate
µ to
spe
ciat
ion
rate
λ fo
r the
col
our p
olym
orph
ic s
tate
. Rat
ios
are
subs
tant
ially
less
than
one
(in
all b
ut tw
o in
stan
ces)
indi
catin
g m
uch
high
er s
peci
atio
n ra
te th
an
extin
ctio
n ra
te.

Cap
rim
ulg
idae
Stri
gin
ae+
Surn
iinae
Falc
on
idae
Figu
re S
1. E
xam
ples
of t
he e
ffect
of a
ccou
ntin
g fo
r sam
plin
g fra
ctio
n an
d ph
ylog
enet
ic u
ncer
tain
ty in
pos
terio
r dis
tribu
tions
of B
ISS
E s
peci
atio
n ra
te; l
ambd
a0 =
mon
omor
phic
sp
ecie
s, la
mbd
a1 =
col
our p
olym
orph
ic s
peci
es. T
op: 2
0,00
0 st
ep M
CM
C u
sing
BE
AS
T m
edia
n M
CC
tree
with
no
sam
plin
g fra
ctio
n; m
iddl
e: a
pply
ing
sam
plin
g.f =
kno
wn
taxo
n sa
mpl
ing
for e
ach
clas
s (0
,1);
botto
m: p
ool o
f 100
0 st
eps
for e
ach
of 5
0 B
EA
ST
sam
ple
trees
(with
sam
plin
g fra
ctio
n). D
iver
sitre
e 0.
6-1;
exp
onet
ial p
rior 1
/(2r)
; opt
imiz
ed s
tep
size
(w);
MC
MC
sta
rting
with
ML
para
met
er v
alue
s. N
umbe
r of s
peci
es a
nd s
ampl
ing
fract
ion
in e
ach
cate
gory
(0,1
): Fa
lcon
idae
41/
9, 0
.73/
1.00
; Stri
gina
e+S
urni
inae
48/
44, 0
.42/
0.75
; C
aprim
ulgi
dae
42/1
5, 0
.59/
0.71
. S
ampl
ing
fract
ion
mos
tly h
ad a
qua
ntita
tive
effe
ct, w
eake
ning
app
aren
t sig
nific
ance
leve
l, in
crea
sing
any
bim
odal
tren
d in
pos
terio
r dis
tribu
tion.
Effe
ct in
Acc
ipitr
idae
and
Pha
sian
idae
w
as n
eglig
ible
(not
sho
wn)
. Phy
loge
netic
unc
erta
inty
had
a n
eglig
ible
effe
ct. S
ome
anal
yses
gav
e un
stab
le re
sults
pro
babl
y du
e to
lim
ited
taxa
and
mul
ti-m
odal
like
lihoo
d su
rface
, as
seen
in b
oth
Bay
esia
n an
d M
L m
etho
ds (e
.g. F
alco
nida
e). A
lthou
gh th
ere
may
be
limita
tions
to th
e B
iSS
E m
etho
d, re
sults
qua
litat
ivel
y m
atch
thos
e tip
bra
nch
leng
th re
sults
(Tab
le S
2).
No
sam
plin
g
Sam
plin
g fr
acti
on
an
d p
hyl
og
enet
ic
un
cert
ain
ty
Sam
plin
g

Supplementary Note
In order to gauge the effect of the difference in sampling of CP and non CP species on
relative speciation and transition rates we randomly sub-sampled the CP species to give equal
CP and non CP species sampling fractions (Table S1). We repeated this ten times each for the
Acciptridae, Strigiformes, Caprimulgidae and Falconidae phylogenies, and calculated median
parameter estimates from the MCMC samples and average tip branch lengths. In all cases, the
trend is the same as for the more complete sampling but with greater variance due to the
weakened sampling. For the Acciptridae, Strigiformes, Caprimulgidae and Falconidae
respectively, the speciation ratios λi/λ0 are 3.2, 1.6, 4.5 and 1.1, the transition ratios q10/q01
are 8.0, 5.7, 11.9 and 5.8 and the tip branch length ratios CP/non CP are 0.88, 0.80; 0.82 and
0.59.
SUPPLEMENTARY INFORMATIONRESEARCHdoi:10.1038/nature11050
WWW.NATURE.COM/NATURE | 5

Supplementary Methods
We used Hackett et al.31 as the overall high level phylogenetic framework demarking major
groups and suitable outgroups, and further within family nomenclature follows that used in
the key references for molecular phylogenetic data and inference (listed below). We
constructed species-level phylogenies for groups containing the highest proportions and/or
absolute numbers of polymorphic species. These are the Accipitridae, Strigiformes,
Caprimulgiformes, Falconidae and Galliformes. We then identified monophyletic, well-
sampled, biologically and phylogenetically coherent groups within these phylogenies for
diversification analyses. This resulted in the exclusion of certain clades within some of these
groups due to their phylogenetic distinctiveness, poor sampling and/or because they
contained few or no CP species. Thus, we restricted our diversification analyses to the clade
containing the Striginae and Suriinae within the Strigiformes; to the Caprimulgidae within the
Caprimulgiformes and to the Phasianidae within the Galliformes. We also constructed several
very large phylogenies for the Passeriformes.
Genes were chosen on the basis of the density of coverage and therefore datasets are by-and-
large combinations of previously published studies, listed in the key references below.
Additional details are provided on the passerine data as these are more complex. Tables S3-5
provide information on genes and GenBank accessions used in the sequence alignments,
while Tables S6-7 and Figure S2 provide summaries of node support, gene density and
coverage across phylogenetic levels. Trees in newick format (with node support values) are
proved as a supplementary text file, and the Accipitridae, Strigiformes, Caprimulgiformes,
Falconidae and Galliformes trees shown in Figures S3-7.
Sequences were aligned with Clustal programs36, either desktop ClustalX or via the EMBL
Clustal Portal (http://www.ebi.ac.uk/Tools/msa/clustalw2). For all but some passerine dataset
introns alignment was straightforward. For the more complex cases a three-stage strategy was
used: a first alignment to identify sequences with large insertions and/or inversions, followed
by a second alignment with iteration, and then subsequent deletion of some chaotic sections.
Preliminary phylogenies for each gene-by-group alignment were done with RAxML37 via the
CIPRES Gateway for RAxML (http://www.phylo.org) to check for possibly mislabelled
GenBank accessions. Alignments were then assembled into supermatrices e.g22,33 to give
nexus format datasets with the maximum possible number of IOC species for that particular
SUPPLEMENTARY INFORMATIONRESEARCHdoi:10.1038/nature11050
WWW.NATURE.COM/NATURE | 6

group. Again, RAxML trees (with fast bootstrapping) were produced to check for
phylogenetic stability. In a few cases some taxa were then excluded due to inadequate data.
Model and partition strategies were assessed by the second order AIC38,39 via RAxML
likelihood scores, and by BEAST 1.5.440 MCMC parameter stability using Tracer 1.540,41. A
two-partition GTR-gamma model (one for mitochondrial genes and one for nuclear genes)
was chosen as this structure provides for the major features of sequence evolution while
linking what might otherwise be a disparate patchwork of data 42,43.
Final relaxed-clock trees for the diversification analyses were produced by BEAST 1.5.440
using the uncorrelated lognormal model. No attempt was made to infer actual ages and all
phylogenies were calibrated to an arbitrary mean rate of 0.01 to remove the confounding
effect of uncertainty in absolute dates. Although this results in arbitrary absolute values of
rate parameters unique to each major group, here we are only interested in relative speciation
rates.
The RAxML phylogenies were used as starting trees, with a Yule node height (speciation)
prior, and the two-partition GTR-gamma model. Two 20 million step chains were run
sampling every 1000 steps and the data combined allowing for a 25% burnin, giving all
parameter effective sample sizes greater than 200, and a final median node height maximum
clade credibility (MCC) tree. In addition, a set of 100 trees were taken from the post burnin
samples for assessing the effect of phylogenetic uncertainty. Trees were subsequently
manipulated using PAUP 4.0b1044 TreeEdit v1.0a4-6145 and FigTree 1.3.140.
Phylogenetic clustering was assessed by maximum parsimony (MP) steps for character state
changes on the BEAST MCC tree, done in Mesquite using 1000 randomizations
(http://www.mesquiteproject.org). Across all groups the CP state is present in multiple
lineages, appearing to be relatively scattered, although there is some signal of clustering in
most groups (Table S2).
Phylogenetic analysis of the passerines involved first accumulating all GenBank accessions
for genes that appeared to have a large coverage of species or genera or families. Libraries of
25 genes were assembled amounting to some fifty thousand accessions totalling 41
Megabases of sequence, and alignments built for twenty thousand accessions of 16 Mb. This
SUPPLEMENTARY INFORMATIONRESEARCHdoi:10.1038/nature11050
WWW.NATURE.COM/NATURE | 7

followed the above general procedure of aligning and generating gene trees for data-
checking, and also included building family- and genus- level trees as part of the process. The
different gene and taxon level trees were checked against each other for consistency and
unstable taxa identified to check the component genes.
Owing to the massive scale of the species level phylogeny, the passerines were broken down
into three sub-trees: sub-oscines (878 = 68% of IOC 2.4 species), lower oscines up to the
Corvoidea (709, 66%), the Passeroidea and attendant lineages (2541, 69%). These shared a
common datamatrix of 11 nuclear and 7 mitochondrial genes, a common framework of four
family-level outgroups and complementary sets of family-level passerine lineages to enable
linking of the sub-trees. Due to the size of these trees CIPRES RAxML was used to generate
trees, employing the two-partition model and fast bootstrap method37. Altogether the data
were able to generate reasonable trees for 120/123 families, 1134/1255 genera, and
4128/6213 species (66.5%). Within the genus and species level trees >60% of nodes have
bootstraps >70% (Table S6). Ultrametric versions (suitable for analysis of relative branch
length) of this tree were then created using PATHd846 arbitrarily calibrated to a tree height of
one.
All trees are based on at least one nuclear gene as well as several mitochondrial genes with an
average of more than 2.5 kilobases per taxon but a considerable proportion of missing data
(Tables S3-6). In an incomplete supermatrix sister lineages must have some data in common:
two lineages with sets of genes A and B respectively are directly linked by A B genes in
common, and together they contribute A B genes to the next lineage down22,33,43. Thus the
phylogenetic data in a supermatrix accumulates through the depth of the tree. Table S7 and
Figure S2 give a brief summary of this accumulation in the passerines. Individual species
have a median of three genes in common linking them to the tree (with 78% having at least
two genes), this rises to median 5 genes for genera (93%) and 10 genes for families (100%).
Across all the different datasets most species have both mitochondrial and nuclear data and
virtually all deeper nodes have mitochondrial and nuclear genes in common (Table S7). In
the passerines 71% of species have cytochrome b and 67% have ND2 (Table S4). While only
61% percent of species have a nuclear gene, in the context of the phylogeny this adds up to
74% of genera having at least one mitochondrial and one nuclear gene in common, rising to
95% at the family level (Table S7).
SUPPLEMENTARY INFORMATIONRESEARCHdoi:10.1038/nature11050
WWW.NATURE.COM/NATURE | 8

References
36 Thompson, J. D., Gibson, T. J., Plewniak, F., Jeanmougin, F. & Higgins, D. G. The
CLUSTAL_X windows interface: flexible strategies for multiple sequence alignment
aided by quality analysis tools. Nuc. Acids Res. 25, 4876-4882 (1997).
37 Stamatakis, A. RAxML-VI-HPC: Maximum likelihood-based phylogenetic analyses
with thousands of taxa and mixed models. Bioinformatics 22, 2688-2690,
doi:10.1093/bioinformatics/btl446 (2006).
38 Lee, M. S. Y. & Hugall, A. F. Model type, implicit data weighting, and model
averaging in phylogenetics. Mol. Phyl. Evol. 38, 848-857,
doi:10.1016/j.ympev.2005.08.005 (2006).
39 Posada, D. & Buckley, T. R. Model selection and model averaging in phylogenetics:
Advantages of akaike information criterion and Bayesian approaches over likelihood
ratio tests. Syst. Biol. 53, 793-808, doi:10.1080/10635150490522304 (2004).
40 Drummond, A. J. & Rambaut, A. BEAST: Bayesian evolutionary analysis by
sampling trees. BMC Evol. Biol. 7, doi:21410.1186/1471-2148-7-214 (2007).
41 Beiko, R. G., Keith, J. M., Harlow, T. J. & Ragan, M. A. Searching for convergence
in phylogenetic Markov chain Monte Carlo. Syst. Biol. 55, 553-565,
doi:10.1080/10635150600812544 (2006).
42 Kubatko, L. S. & Pearl, D. K. Seeing the trees in your terrace. Science 333, 411-412,
doi:10.1126/science.1209690 (2011).
43 Sanderson, M. J., McMahon, M. M. & Steel, M. Terraces in phylogenetic tree space.
Science 333, 448-450, doi:10.1126/science.1206357 (2011).
44 Swofford, D.L. PAUP*: phylogenetic analysis using parsimony (*and other methods),
Version 4.0. Sinauer, Sunderland, MA. (2000)
45 Phylogenetic tree editor v1.0a4-61 (Oxford University, Oxford, UK, 2000).
46 Britton, T., Oxelman, B., Vinnersten, A. & Bremer, K. Phylogenetic dating with
confidence intervals using mean path lengths. Mol. Phyl. Evol. 24, 58-65,
doi:10.1016/s1055-7903(02)00268-3 (2002).
SUPPLEMENTARY INFORMATIONRESEARCHdoi:10.1038/nature11050
WWW.NATURE.COM/NATURE | 9

Key references for molecular phylogenetic data and inference
Accipitridae
Arshad, M., Gonzalez, J., El-Sayed, A. A., Osborne, T. & Wink, M. Phylogeny and
phylogeography of critically endangered Gyps species based on nuclear and
mitochondrial markers. J. Ornithol. 150, 419-430, doi:10.1007/s10336-008-0359-x
(2009).
do Amaral, F. R. et al. Patterns and processes of diversification in a widespread and
ecologically diverse avian group, the buteonine hawks (Aves, Accipitridae). Mol.
Phyl. Evol. 53, 703-715, doi:10.1016/j.ympev.2009.07.020 (2009).
Gamauf, A. & Haring, E. Molecular phylogeny and biogeography of Honey-buzzards (genera
Pernis and Henicopernis). J. Zool. Syst. Evol. Res. 42, 145-153 (2004).
Griffiths, C. S., Barrowclough, G. F., Groth, J. G. & Mertz, L. A. Phylogeny, diversity, and
classification of the Accipitridae based on DNA sequences of the RAG-1 exon. J.
Avian Biol. 38, 587-602, doi:10.1111/j.2007.0908-8857.03971.x (2007).
Haring, E., Kvaloy, K., Gjershaug, J. O., Rov, N. & Gamauf, A. Convergent evolution and
paraphyly of the hawk-eagles of the genus Spizaetus (Aves, Accipitridae) -
phylogenetic analyses based on mitochondrial markers. J. Zool. Syst. Evol. Res. 45,
353-365, doi:10.1111/j.1439-0469.2007.00410.x (2007).
Helbig, A. J., Kocum, A., Seibold, I. & Braun, M. J. A multi-gene phylogeny of aquiline
eagles (Aves : Accipitriformes) reveals extensive paraphyly at the genus level. Mol.
Phyl. Evol. 35, 147-164, doi:10.1016/j.ympev.2004.10.003 (2005).
Lerner, H. R. L. & Mindell, D. P. Phylogeny of eagles, Old World vultures, and other
Accipitridae based on nuclear and mitochondrial DNA. Mol. Phyl. Evol. 37, 327-346,
doi:10.1016/j.ympev.2005.04.010 (2005).
Lerner, H. R. L., Klaver, M. C. & Mindell, D. P. Molecular phylogenetics of the Buteonine
birds of prey (Accipitridae). Auk 125, 304-315, doi:10.1525/auk.2008.06161 (2008).
Riesing, M. J., Kruckenhauser, L., Gamauf, A. & Haring, E. Molecular phylogeny of the
genus Buteo (Aves : Accipitridae) based on mitochondrial marker sequences. Mol.
Phyl. Evol. 27, 328-342, doi:10.1016/s1055-7903(02)00450-5 (2003).
Wink, M., Heidrich, P. & Fentzloff, C. A mtDNA phylogeny of sea eagles (genus Haliaeetus)
based on nucleotide sequences of the cytochrome 6-gene. Biochem. Syst.Ecol. 24,
783-791 (1996).
SUPPLEMENTARY INFORMATIONRESEARCHdoi:10.1038/nature11050
WWW.NATURE.COM/NATURE | 10

Strigiformes
Fuchs, J. et al. Tracing the colonization history of the Indian Ocean scops-owls (Strigiformes
: Otus) with further insight into the spatio-temporal origin of the Malagasy avifauna.
BMC Evol. Biol. 8, doi:19710.1186/1471-2148-8-197 (2008).
Hull, J. M. et al. Range-wide genetic differentiation among North American great gray owls
(Strix nebulosa) reveals a distinct lineage restricted to the Sierra Nevada, California.
Mol. Phyl. Evol. 56, 212-221, doi:10.1016/j.ympev.2010.02.027 (2010).
Wink, M. & Heidrich, P. in Raptors at Risk (eds R.D. Chancellor & B.U. Meyburg)
(WWGBP/Hancock House, 2000).
Wink, M., El-Sayed, A. A., Sauer-Gurth, H. & Gonzalez, J. Molecular phylogeny of owls
(Strigiformes) inferred from DNA sequences of the mitochondrial cytochrome b and
the nuclear RAG-1 gene. Ardea 97, 581-591 (2009).
Caprimulgiformes
Barrowclough, G. F., Groth, J. G. & Mertz, L. A. The RAG-1 exon in the avian order
Caprimulgiformes: Phylogeny, heterozygosity, and base composition. Mol. Phyl.
Evol. 41, 238-248, doi:10.1016/j.ympev.2006.05.013 (2006).
Braun, M. J. & Huddleston, C. J. A molecular phylogenetic survey of caprimulgiform
nightbirds illustrates the utility of non-coding sequences. Mol. Phyl. Evol. 53, 948-
960, doi:10.1016/j.ympev.2009.08.025 (2009).
Dumbacher, J. P., Pratt, T. K. & Fleischer, R. C. Phylogeny of the owlet-nightjars (Aves :
Aegothelidae) based on mitochondrial DNA sequence. Mol. Phyl. Evol. 29, 540-549,
doi:10.1016/s1055-7903(03)00135-0 (2003).
Han, K. L., Robbins, M. B. & Braun, M. J. A multi-gene estimate of phylogeny in the
nightjars and nighthawks (Caprimulgidae). Mol. Phyl. Evol. 55, 443-453,
doi:10.1016/j.ympev.2010.01.023 (2010).
Larsen, C., Speed, M., Harvey, N. & Noyes, H. A. A molecular phylogeny of the nightjars
(Aves : Caprimulgidae) suggests extensive conservation of primitive morphological
traits across multiple lineages. Mol. Phyl. Evol. 42, 789-796,
doi:10.1016/j.ympev.2006.10.005 (2007).
SUPPLEMENTARY INFORMATIONRESEARCHdoi:10.1038/nature11050
WWW.NATURE.COM/NATURE | 11
Falconidae
El-Sayed, A. A., Gonzalez, J. & Wink, M. Phylogenetic relationships in diurnal raptors and
putative allies: Evidence from mitochondrial DNA sequences, nuclear RAG-1 genes
and genomic fingerprints. J. Ornithol. 147, 162-163 (2006).
Fuchs, J., Chen, S., Johnson, J. A. & Mindell, D. P. Pliocene diversification within the South
American Forest falcons (Falconidae: Micrastur). Mol. Phyl. Evol. 60, 398-407,
doi:10.1016/j.ympev.2011.05.008 (2011).
Griffiths, C. S., Barrowclough, G. F., Groth, J. G. & Mertz, L. Phylogeny of the Falconidae
(Aves): a comparison of the efficacy of morphological, mitochondrial, and nuclear
data. Mol. Phyl. Evol. 32, 101-109, doi:10.1016/j.ympev.2003.11.019 (2004).
Groombridge, J. J. et al. A molecular phylogeny of African kestrels with reference to
divergence across the Indian Ocean. Mol. Phyl. Evol. 25, 267-277 (2002).
Nittinger, F., Haring, E., Pinsker, W., Wink, M. & Gamauf, A. Out of Africa? Phylogenetic
relationships between Falco biarmicus and the other hierofalcons (Aves : Falconidae).
J. Zool. Syst. Evol. Res. 43, 321-331, doi:10.1111/j.1439-0469.2005.00326.321-331
(2005).
Galliformes
Bao, X. K. et al. The phylogenetic position and speciation dynamics of the genus Perdix
(Phasianidae, Galliformes). Mol. Phyl. Evol. 56, 840-847,
doi:10.1016/j.ympev.2010.03.038 (2010).
Bonilla, A. J., Braun, E. L. & Kimball, R. T. Comparative molecular evolution and
phylogenetic utility of 3 '-UTRs and introns in Galliformes. Mol. Phyl. Evol. 56, 536-
542, doi:10.1016/j.ympev.2010.04.006 (2010).
Crowe, T. M. et al. Phylogenetics, biogeography and classification of, and character
evolution in, gamebirds (Aves : Galliformes): effects of character exclusion, data
partitioning and missing data. Cladistics 22, 495-532, doi:10.1111/j.1096-
0031.2006.00120.x (2006).
Frank-Hoeflich, K. et al. Increased taxon and character sampling reveals novel intergeneric
relationships in the Cracidae (Aves : Galliformes). J. Zool. Syst. Evol. Res. 45, 242-
254, doi:10.1111/j.1439-0469.2007.00396.x (2007).
SUPPLEMENTARY INFORMATIONRESEARCHdoi:10.1038/nature11050
WWW.NATURE.COM/NATURE | 12

Kimball, R. T. & Braun, E. L. A multigene phylogeny of Galliformes supports a single origin
of erectile ability in non-feathered facial traits. J. Avian Biol. 39, 438-445,
doi:10.1111/j.2008.0908-8857.04270.x (2008).
Kriegs, J. O. et al. Waves of genomic hitchhikers shed light on the evolution of gamebirds
(Aves : Galliformes). BMC Evol. Biol. 7, doi:19010.1186/1471-2148-7-190 (2007).
Shen, Y. Y. et al. A mitogenomic perspective on the ancient, rapid radiation in the
Galliformes with an emphasis on the Phasianidae. BMC Evol. Biol. 10,
doi:13210.1186/1471-2148-10-132 (2010).
Passeriformes
Barker, F. K., Barrowclough, G. F. & Groth, J. G. A phylogenetic hypothesis for passerine
birds: taxonomic and biogeographic implications of an analysis of nuclear DNA
sequence data. Proc. Roy. Soc. Lond. B 269, 295-308, doi:10.1098/rspb.2001.1883
(2002).
Barker, F. K., Cibois, A., Schikler, P., Feinstein, J. & Cracraft, J. Phylogeny and
diversification of the largest avian radiation. Proc. Natl. Acad. Sci. USA 101, 11040-
11045, doi:10.1073/pnas.0401892101 (2004).
Beresford, P., Barker, F. K., Ryan, P. G. & Crowe, T. M. African endemics span the tree of
songbirds (Passeri): molecular systematics of several evolutionary 'enigmas'. Proc.
Roy. Soc. Lond. B 272, 849-858, doi:10.1098/rspb.2004.2997 (2005).
Ericson, P. G. P. & Johansson, U. S. Phylogeny of Passerida (Aves : Passeriformes) based on
nuclear and mitochondrial sequence data. Mol. Phyl. Evol. 29, 126-138,
doi:10.1016/s1055-7903(03)00067-8 (2003).
Gardner, J. L., Trueman, J. W. H., Ebert, D., Joseph, L. & Magrath, R. D. Phylogeny and
evolution of the Meliphagoidea, the largest radiation of Australasian songbirds. Mol.
Phyl. Evol. 55, 1087-1102, doi:10.1016/j.ympev.2010.02.005 (2010).
Irestedt, M., Johansson, U. S., Parsons, T. J. & Ericson, P. G. P. Phylogeny of major lineages
of suboscines (Passeriformes) analysed by nuclear DNA sequence data. J. Avian Biol.
32, 15-25 (2001).
Irestedt, M. & Ohlson, J. I. The division of the major songbird radiation into Passerida and
'core Corvoidea' (Aves : Passeriformes) - the species tree vs. gene trees. Zoologica
Scripta 37, 305-313, doi:10.1111/j.1463-6409.2007.00321.x (2008).
SUPPLEMENTARY INFORMATIONRESEARCHdoi:10.1038/nature11050
WWW.NATURE.COM/NATURE | 13

Johansson, U. S., Fjeldsa, J. & Bowie, R. C. K. Phylogenetic relationships within Passerida
(Aves : Passeriformes): A review and a new molecular phylogeny based on three
nuclear intron markers. Mol. Phyl. Evol. 48, 858-876,
doi:10.1016/j.ympev.2008.05.029 (2008).
Jonsson, K. A. & Fjeldsa, J. A phylogenetic supertree of oscine passerine birds (Aves :
Passeri). Zool. Scripta 35, 149-186, doi:10.1111/j.1463-6409.2006.00221.x (2006).
Jonsson, K. A., Fabre, P. H., Ricklefs, R. E. & Fjeldsa, J. Major global radiation of corvoid
birds originated in the proto-Papuan archipelago. Proc. Natl. Acad. Sci. USA 108,
2328-2333, doi:10.1073/pnas.1018956108 (2011).
Lovette, I. J. et al. A comprehensive multilocus phylogeny for the wood-warblers and a
revised classification of the Parulidae (Ayes). Mol. Phyl. Evol. 57, 753-770,
doi:10.1016/j.ympev.2010.07.018 (2010).
Sangster, G., Alstrom, P., Forsmark, E. & Olsson, U. Multi-locus phylogenetic analysis of
Old World chats and flycatchers reveals extensive paraphyly at family, subfamily and
genus level (Aves: Muscicapidae). Mol. Phyl. Evol. 57, 380-392,
doi:10.1016/j.ympev.2010.07.008 (2010).
SUPPLEMENTARY INFORMATIONRESEARCHdoi:10.1038/nature11050
WWW.NATURE.COM/NATURE | 14

Table S3. Number of sites and accessions for each gene used in each family-level phylogeny
Group Gene Total
Accipitridae RAG-1 BFib7 cytb ND6 12S ATPase COI
Sites 2872 972 1077 519 805 842 827 7914
accessions 88 92 161 61 68 53 57 580
Strigiformes RAG-1 MYO TGFB2 cytb ND2 COI
Sites 948 728 605 1143 1056 693 5173
accessions 72 37 39 104 45 39 336
Caprimulgiformes RAG-1 v-myc GH1 cytb COI
Sites 2872 1288 2190 1143 693 8186
accessions 35 76 65 87 22 285
Falconidae RAG-1 cytb COI ND2
Sites 2836 1143 693 1041 5713
accessions 50 48 15 34 147
Galliformes BFib7 OvoG mtDNA cytb ND2
Sites 951 469 17132 1146 1044 20742
accessions 57 72 37 181 109 456
SUPPLEMENTARY INFORMATIONRESEARCHdoi:10.1038/nature11050
WWW.NATURE.COM/NATURE | 15

Table S4. Number of sites, accessions and proportion of taxa with each gene for passerine
phylogeny
Gene sequence Genes Accessions Proportion of taxa in trees with gene
Family Genus Species Sites Family Genus Species
Nuclear RAG-1 122 642 915 2910 0.98 0.56 0.22
c-myc 78 192 229 513 0.62 0.17 0.06
c-mos 79 153 193 624 0.63 0.13 0.05
Zenk 60 100 120 1224 0.48 0.09 0.03
RAG-2 105 463 574 1155 0.84 0.41 0.14
bFib7 46 228 466 1110 0.37 0.2 0.11
bFib5 79 415 836 675 0.63 0.36 0.2
MYO 111 689 1438 787 0.89 0.61 0.35
ODC 101 521 1110 895 0.81 0.46 0.27
TGFB2 47 156 442 633 0.38 0.14 0.11
GAPDH 71 464 823 466 0.57 0.41 0.2
Mitochondrial cytb 107 902 2950 1143 0.86 0.79 0.71
ND2 110 871 2785 1041 0.88 0.77 0.67
COI 74 478 1302 1311 0.59 0.42 0.31
ATPase 52 206 542 985 0.42 0.18 0.13
12S 77 285 590 941 0.62 0.25 0.14
ND3 68 309 919 351 0.54 0.27 0.22
16S 58 219 425 611 0.46 0.19 0.1
Total 1445 7293 16659 17375
SUPPLEMENTARY INFORMATIONRESEARCHdoi:10.1038/nature11050
WWW.NATURE.COM/NATURE | 16

Table S5. Genes used for phylogeny reconstruction
Gene sequences code gene Nuclear RAG-1 Recombination activating protein 1 c-myc Proto-oncogene protein, exon 3 c-mos Oocyte maturation factor Mos zenk Zinc finger protein (ZENK = EGR-1), exon 2 RAG-2 Recombination activating protein 2 OvoG Ovomucoid gene, intron G v-myc Myelocytomatosis viral oncogene-like protein, exon 3 GH1 Growth hormone 1, intron 2 Bfib7 Beta-Fibrinogen intron 7 BFib5 Beta-Fibrinogen intron 5 MYO Myoglobin, intron 2 to intron 3 ODC Ornithine decarboxylase, intron 6 to intron 7 TGFB2 Transforming growth factor beta 2, intron 5 ALDOB Aldolase B fructose-bisphosphate GAPDH Glyceraldehyde-3-phosphate dehydrogenase, intron 11 Mitochondrial cytb Cytochrome b ND2 NADH dehydrogenase subunit 2 COI Cytochrome oxidase subunit 1 ATPase ATPase subunits 6, 8 ND6 NADH dehydrogenase subunit 6 ND3 NADH dehydrogenase subunit 6 12S 12S ribosomal RNA Genbank accession numbers available from authors on request.
SUPPLEMENTARY INFORMATIONRESEARCHdoi:10.1038/nature11050
WWW.NATURE.COM/NATURE | 17

Tab
le S
6. D
atam
atri
x su
mm
ary
stat
isti
cs a
nd
no
de
sup
po
rt
Phy
loge
ny
Gen
es
S
ites
Acc
essi
ons
Tot
al
base
s T
axa
A
v.
leng
th
Mis
sing
data
p- taxa
Sup
port
m
tDN
A
nucl
ear
in
grou
pou
tgro
ups
>
50
>70
>
90
Acc
ipitr
idae
5
2 79
14
580
6445
41
178
344
11
0.55
0.71
0.87
/0.8
70.
7/0.
81
0.52
/0.7
2
Str
igifo
rmes
3
3 51
73
336
2840
41
108
325
59
0.51
0.49
0.83
/0.9
30.
67/0
.79
0.44
/0.6
9
Cap
rimul
gifo
rmes
2
3 81
86
285
3757
64
817
4270
0.
480.
650.
85/0
.93
0.67
/0.8
50.
52/0
.76
Fal
coni
dae
3 1
5713
14
718
9510
50
335
76
0.37
0.77
0.82
/0.8
70.
74/0
.77
0.62
/0.7
1
Gal
lifor
mes
3
2 20
742
456
9765
21
197
149
32
0.76
0.66
0.84
/0.8
70.
71/0
.81
0.55
/0.7
4
Pas
serif
orm
es
gene
ra-le
vel
7 11
17
375
7125
6316
223
1134
455
50
0.68
0.9
0.77
0.61
0.45
spec
ies-
leve
l 7
11
1737
515
202
1337
6707
41
284
3233
0.
810.
670.
770.
630.
47
Site
s =
alig
nmen
t len
gth;
Tot
al b
ases
= d
efin
ed n
ucle
otid
e ch
arac
ters
in m
atrix
; Acc
essi
ons
= n
umbe
r of
indi
vidu
al G
enB
ank
acce
ssio
ns; A
v le
ngth
= a
vera
ge
num
ber
of b
ases
per
taxo
n; M
issi
ng d
ata
is p
ropo
rtio
n of
sta
tes
code
d as
? (
=m
issi
ng d
ata)
; p-t
axa
= p
ropo
rtio
n of
IOC
2.4
taxa
in th
e da
tase
t;
Cap
rimul
gifo
rmes
out
grou
ps in
clud
e A
erod
ram
us a
nd H
emip
rocn
e; G
allif
orm
es d
ata
incl
udes
ent
ire m
tDN
A g
enom
e le
ss c
ontr
ol r
egio
n; S
uppo
rt s
how
s
prop
ortio
n of
nod
es w
ith in
dica
ted
RA
xML
fast
boo
tstr
ap a
nd/o
r B
EA
ST
pos
terio
r pr
obab
ility
.
SUPPLEMENTARY INFORMATIONRESEARCHdoi:10.1038/nature11050
WWW.NATURE.COM/NATURE | 18

Table S7. Proportion of tips and internal nodes with mitochondrial and nuclear genes for each phylogeny
Phylogeny Nuclear Mitochondrial Both Accipitridae 0.69 0.96 0.65 Strigiformes 0.77 0.98 0.75 Caprimulgiformes 0.87 1 0.87 Falconidae 0.94 1 0.94 Galliformes 0.42 0.99 0.41 Passeriformes Nuclear Mitochondrial Both Multiple both family taxon 1 0.95 0.95 0.85 contribute to node 1 1 1 0.97 common to node 1 0.95 0.95 0.84 genus taxon 0.8 0.95 0.76 0.52 contribute to node 0.93 0.99 0.92 0.83 common to node 0.79 0.95 0.74 0.51 species taxon 0.61 0.95 0.56 0.27 contribute to node 0.83 0.99 0.83 0.66 common to node 0.6 0.95 0.55 0.29
both = at least one nuclear and one mitochondrial gene multiple both = multiple nuclear and multiple mitochondrial genes contribute to node = proportion of internal nodes with genes contributing information common to node = proportion of internal nodes with genes in common
SUPPLEMENTARY INFORMATIONRESEARCHdoi:10.1038/nature11050
WWW.NATURE.COM/NATURE | 19

Figure S2. Minimum number of genes contributing information to nodes across phylogenetic depth of the passerine phylogeny
SUPPLEMENTARY INFORMATIONRESEARCHdoi:10.1038/nature11050
WWW.NATURE.COM/NATURE | 20

Buteo_buteo_1n5m_p
Haliaeetus_pelagicus_0n3m_p
Gyps_coprotheres_2n1m
Buteo_solitarius_0n4m_p
Nisaetus_nanus_0n1m
Hamirostra_melanosternon_2n1m
Pithecophaga_je�eryi_1n1m
Buteo_albigula_1n4m
Buteo_platypterus_1n5m_p
Lophotriorchis_kienerii_0n1m
Ichthyophaga_ichthyaetus_0n1m
Leucopternis_albicollis_1n4m
Haliaeetus_sanfordi_0n1m
Accipiter_erythronemius_0n1m
Nisaetus_pinskeri_0n1m
Elanus_caeruleus_1n0m
Eutriorchis_astur_0n1m
Haliaeetus_leucocephalus_2n5m
Accipiter_ru�ventris_1n1m
Pernis_ptilorhynchus_0n1m_p
Lophaetus_occipitalis_2n1m
Aquila_clanga_1n2m_p
Torgos_tracheliotus_2n1m
Buteo_augur_0n4m_p
Dryotriorchis_spectabilis_0n1m
Buteo_lineatus_1n5m
Kaupifalco_monogrammicus_1n2mAccipiter_trivirgatus_0n1m
Aquila_gurneyi_0n1m
Ichthyophaga_humilis_0n1m
Nisaetus_bartelsi_0n1m
Necrosyrtes_monachus_2n1m
Nisaetus_nipalensis_2n4m
Buteo_auguralis_0n1m
Leucopternis_semiplumbeus_1n4m
Haliastur_indus_2n1m
Buteo_polyosoma_1n5m_p
Aviceda_cuculoides_0n1m
Cathartes_aura_1n0m
Pernis_apivorus_1n3m_p
Milvus_milvus_1n1m
Gyps_rueppellii_2n1m
Circaetus_cinereus_1n1m
Buteo_albonotatus_0n5m
Butastur_ru�pennis_1n1m
Aquila_africana_0n1m
Gampsonyx_swainsonii_1n2m
Urotriorchis_macrourus_0n1m_p
Aquila_pomarina_1n1m_p
Accipiter_cirrocephalus_1n1m
Morphnus_guianensis_2n1m_p
Accipiter_novaehollandiae_1n0m_p
Spilornis_cheela_1n3m
Buteo_brachypterus_0n1m
Buteo_jamaicensis_2n5m_p
Leucopternis_princeps_1n4m
Circus_cinereus_0n1m
Aquila_spilogaster_1n1m
Aquila_chrysaetos_2n4m
Leucopternis_polionotus_1n4m
Harpia_harpyja_2n1m
Gyps_indicus_1n1m
Circaetus_gallicus_1n3m_p
Micronisus_gabar_1n1m_p
Hieraaetus_morphnoides_2n1m_p
Buteogallus_anthracinus_2n5m
Butastur_teesa_1n1m
Circus_ranivorus_1n1m
Leucopternis_occidentalis_1n4m
Haliaeetus_leucogaster_1n2m
Aquila_heliaca_2n2m
Leucopternis_plumbeus_1n4m
Haliaeetus_leucoryphus_0n1m
Buteo_albicaudatus_1n5m_p
Melierax_poliopterus_0n1m
Buteo_swainsoni_1n5m_p
Geranospiza_caerulescens_2n5m
Aquila_fasciata_2n3m
Rostrhamus_sociabilis_2n5m
Nisaetus_kelaarti_0n1m
Accipiter_imitator_1n0m_p
Circus_aeruginosus_2n3m_p
Accipiter_superciliosus_0n2m_p
Polemaetus_bellicosus_2n1m
Haliaeetus_vocifer_1n1m
Circaetus_cinerascens_0n1m
Buteo_nitidus_2n5m
Nisaetus_philippensis_1n1m
Leptodon_cayanensis_2n1m_p
Sagittarius_serpentarius_2n2m
Parabuteo_unicinctus_1n5m
Pernis_celebensis_0n1m
Leucopternis_melanops_1n4m
Aegypius_monachus_2n2m
Nisaetus_alboniger_0n4m
Lophoictinia_isura_1n1m
Hieraaetus_wahlbergi_2n1m_p
Polyboroides_typus_2n1m
Butastur_indicus_0n2m
Leucopternis_kuhli_1n4m
Spizaetus_tyrannus_2n1mSpizaetus_melanoleucus_2n1m
Gyps_bengalensis_2n1m
Leucopternis_schistaceus_1n4m
Circus_cyaneus_0n2mAccipiter_tachiro_1n0m_p
Circaetus_pectoralis_2n1m
Gyps_himalayensis_1n1m
Buteogallus_meridionalis_2n5m
Aviceda_subcristata_1n0m
Gyps_tenuirostris_0n1m
Spizaetus_isidori_2n1m
Accipiter_gentilis_2n5m_p
Accipiter_nisus_2n3m
Spizaetus_ornatus_2n1m
Accipiter_bicolor_1n2m_p
Milvus_migrans_0n3m
Aquila_audax_1n1m
Harpagus_bidentatus_1n0m
Buteo_oreophilus_1n1m
Gypohierax_angolensis_2n1m
Buteo_galapagoensis_0n5m
Harpyhaliaetus_solitarius_2n4m
Buteo_regalis_1n5m_p
Nisaetus_cirrhatus_1n1m_p
Spilornis_ru�pectus_0n1m
Harpyopsis_novaeguineae_2n1m
Spilornis_holospilus_0n1m
Melierax_canorus_2n1m
Ictinaetus_malayensis_1n1m
Gyps_africanus_2n1m
Hieraaetus_pennatus_2n1m_p
Gypaetus_barbatus_1n1m
Buteo_refectus_0n3m
Aquila_verreauxii_2n1m
Chondrohierax_uncinatus_1n1m_pElanus_leucurus_1n2m
Busarellus_nigricollis_1n5m
Accipiter_virgatus_0n1m
Macheiramphus_alcinus_1n0m_p
Buteo_rufofuscus_1n4m_p
Hieraaetus_ayresii_1n1m_p
Buteo_magnirostris_2n5m
Elanoides_for�catus_2n4m
Pandion_haliaetus_2n5m
Buteo_brachyurus_0n5m_p
Trigonoceps_occipitalis_1n1m
Circaetus_fasciolatus_1n1m
Accipiter_soloensis_0n1m
Accipiter_striatus_0n2m
Gyps_fulvus_1n3m
Accipiter_gularis_0n2m
Circus_bu�oni_0n1m_p
Neophron_percnopterus_2n2m
Ictinia_plumbea_2n5m
Aquila_adalberti_1n1m
Buteo_ru�nus_1n4m_p
Buteo_ventralis_0n1m_p
Aquila_rapax_2n1m_p
Buteogallus_aequinoctialis_0n4m
Leucopternis_lacernulatus_0n4m
Stephanoaetus_coronatus_2n1m
Henicopernis_longicauda_0n1m
Buteo_ridgwayi_0n4m
Terathopius_ecaudatus_2n1m_p
Haliaeetus_albicilla_1n4m
Buteogallus_urubitinga_1n5m
Geranoaetus_melanoleucus_2n5m
Buteo_japonicus_1n4m
Buteo_leucorrhous_0n5m_p
Haliastur_sphenurus_1n1m
Spilornis_elgini_0n1m
Haliaeetus_vociferoides_1n1m
Sarcogyps_calvus_2n1m
Buteo_lagopus_1n5m_p
Nisaetus_lanceolatus_0n1m
Buteo_hemilasius_0n4m_p
Aquila_nipalensis_2n2m
Ictinia_mississippiensis_0n5m
Accipiter_cooperii_1n2m
Harpyhaliaetus_coronatus_0n4m
0.58
1
1
0.32
1
0.28
1
1
1
0.04
0.94
1
1
0.84
0.98
0.7
1
1
1
0.92
0.75
1
1
0.33
1
1
1
1
1
1
1
0.91
0.96
0.56
0.99
0.34
1
0.99
0.96
0.99
1
0.73
0.86
0.73
1
0.97
0.99
1
11
0.42
0.79
0.03
0.93
1
0.55
1
1
0.95
0.95
1
0.45
0.45
0.97
1
0.15
1
0.51
0.73
1
0.94
1
0.92
1
0.5
0.98
1
1
1
1
1
1
1
1
0.72
0.64
0.17
0.98
0.84
0.98
1
0.44
0.96
1
1
1
1
0.94
0.76
1
0.37
0.98
1
0.76
0.53
0.98
0.99
1
1
1
1
1
0.88
1
1
1
1
0.38
0.17
1
0.97
10.68
1
0.99
0.96
1
1
0.28
0.94
0.55
0.43
1
1
0.98
1
0.91
0.07
0.99
1
0.97
0.99
0.94
0.76
1
1
0.52
1
1
1
0.47
0.92
1
1
1
0.7
0.99
0.44
1
0.74
1
1
1
0.34
1
1
1
0.99
1
0.98
0.74
1
1
0.63
1
1
0.36
1
1
Figure S3. Accipitridae datamatrix BEAST median node height MCC tree with posterior probability values. CP species highlighted in orange; taxon label shows genus_species_mt and nuclear genes_CP status. Major sub-groups denoted. Outgroups in grey. Approximate percentage of species sampled shown for some major clades (notwithstanding phylogenetic uncertainty).
Sea Eagles100%
Buteonine Hawks 95%
Booted Eagles 92%
Vultures & Serpent Eagles 86%
Pernine Kites67%
Accipiters & Harriers 32%
Asio_otus_3n3m
Athene_brama_0n1m
Tyto_alba_3n3m
Megascops_asio_3n3m_p
Pulsatrix_perspicillata_1n1m
Otus_mirus_2n2m
Otus_capnodes_2n2m_p
Glaucidium_minutissimum_0n1m
Bubo_magellanicus_0n2m
Megascops_watsonii_0n1m_p
Megascops_trichopsis_0n1m_p
Bubo_nipalensis_1n1m
Otus_rutilus_2n2m_p
Megascops_albogularis_0n1m
Asio_�ammeus_2n2m
Otus_insularis_2n2m
Ninox_rudol�_1n1m
Ninox_connivens_1n2m
Phodilus_badius_3n1m
Ninox_scutulata_1n2m
Ninox_novaeseelandiae_0n3m
Glaucidium_tephronotum_0n1m
Tyto_tenebricosa_1n2m
Otus_ireneae_2n2m_p
Otus_lempiji_3n3m_p
Megascops_sanctaecatarinae_0n1m_p
Bubo_lacteus_1n1m
Otus_elegans_0n1m
Glaucidium_bolivianum_1n1m_p
Glaucidium_capense_0n1m
Aegolius_acadicus_3n3m
Strix_occidentalis_3n2m
Glaucidium_brasilianum_1n3m_p
Ketupa_ketupu_1n1m
Otus_brucei_1n1m_p
Otus_megalotis_3n3m_p
Aegolius_funereus_1n2m
Ninox_philippensis_0n2m
Glaucidium_perlatum_1n1m
Otus_lettia_3n3m_p
Strix_leptogrammica_0n1m
Bubo_virginianus_3n3m_p
Glaucidium_cuculoides_2n1m
Strix_butleri_1n1m_p
Ketupa_zeylonensis_1n1m
Mimizuku_gurneyi_0n1m
Aegolius_harrisii_1n1m
Megascops_napensis_1n0m
Megascops_kennicottii_3n3m_p
Megascops_koepckeae_1n2m
Strix_virgata_0n1m_p
Megascops_choliba_1n2m_p
Otus_scops_3n3m_p
Strix_varia_0n2m
Otus_sunia_3n3m_p
Glaucidium_peruanum_1n1m
Tyto_glaucops_0n1m
Ninox_squamipila_0n1m
Bubo_bengalensis_1n1m_p
Otus_mayottensis_2n2m
Otus_spilocephalus_3n2m_p
Glaucidium_hardyi_1n1m_p
Otus_moheliensis_2n2m_p
Athene_noctua_3n2m_p
Megascops_�ammeolus_1n2m_p
Otus_pauliani_2n2m_p
Strix_aluco_3n2m_p
Tyto_novaehollandiae_1n1m_p
Bubo_africanus_1n1m_p
Otus_semitorques_0n1m
Colius_striatus_2n3m
Strix_woodfordii_3n2m_p
Megascops_hoyi_2n3m_p
Megascops_guatemalae_0n1m_p
Bubo_capensis_1n1m
Otus_bakkamoena_3n2m_p
Glaucidium_nana_1n2m_p
Glaucidium_jardinii_1n1m_p
Ptilopsis_leucotis_2n2m
Otus_longicornis_2n2m
Ptilopsis_granti_1n1m
Pandion_haliaetus_3n3m
Athene_cunicularia_3n2m
Megascops_petersoni_0n1m
Glaucidium_californicum_1n1m_p
Bubo_bubo_3n3m_p
Bubo_scandiacus_1n2m
Bubo_ascalaphus_1n1m
Ninox_rufa_1n2m
Pseudoscops_clamator_1n2mAsio_capensis_1n1m
Otus_pembaensis_2n2m_pOtus_senegalensis_2n2m_p
Strix_uralensis_1n2mStrix_davidi_0n1m
Micrathene_whitneyi_0n2m
Megascops_atricapilla_1n1m_p
Tyto_capensis_0n2m
Leptosomus_discolor_3n2m
Ninox_strenua_1n2m
Megascops_roboratus_1n2m_p
Tyto_longimembris_1n1m
Glaucidium_gnoma_3n2m_p
Pulsatrix_koeniswaldiana_1n1m
Strix_nebulosa_1n3m
Glaucidium_griseiceps_1n1m
Glaucidium_passerinum_1n1m
Strix_ru�pes_1n2m_p
Ninox_boobook_1n0m
Lophostrix_cristata_0n1m_p
Surnia_ulula_1n2m
1
0.93
0.99
1
1
0.53
0.25
0.63
1
1
0.99
1
1
1
0.38
0.87
0.83
1
1
0.6
1
0.27
1
1
0.73
1
1
1
0.96
0.96
1
1
0.97
0.45
1
1
0.69
0.34
0.56
0.77
0.29
1
0.99
1
0.43
0.99
0.44
1
1
1
0.91
0.68
0.92
1
1
0.26
0.7
1
1
0.99
0.99
1
0.89
0.98
1
1
1
1
1
1
0.84
0.98
1
0.57
0.87
0.9
0.81
1
0.99
1
1
1
0.8
1
1
1
1
0.85
1
0.58
0.85
1
1
1
0.82
0.94
1
1
0.98
0.61
0.96
0.86
1
0.2
1
0.95
0.97
0.73
1
1
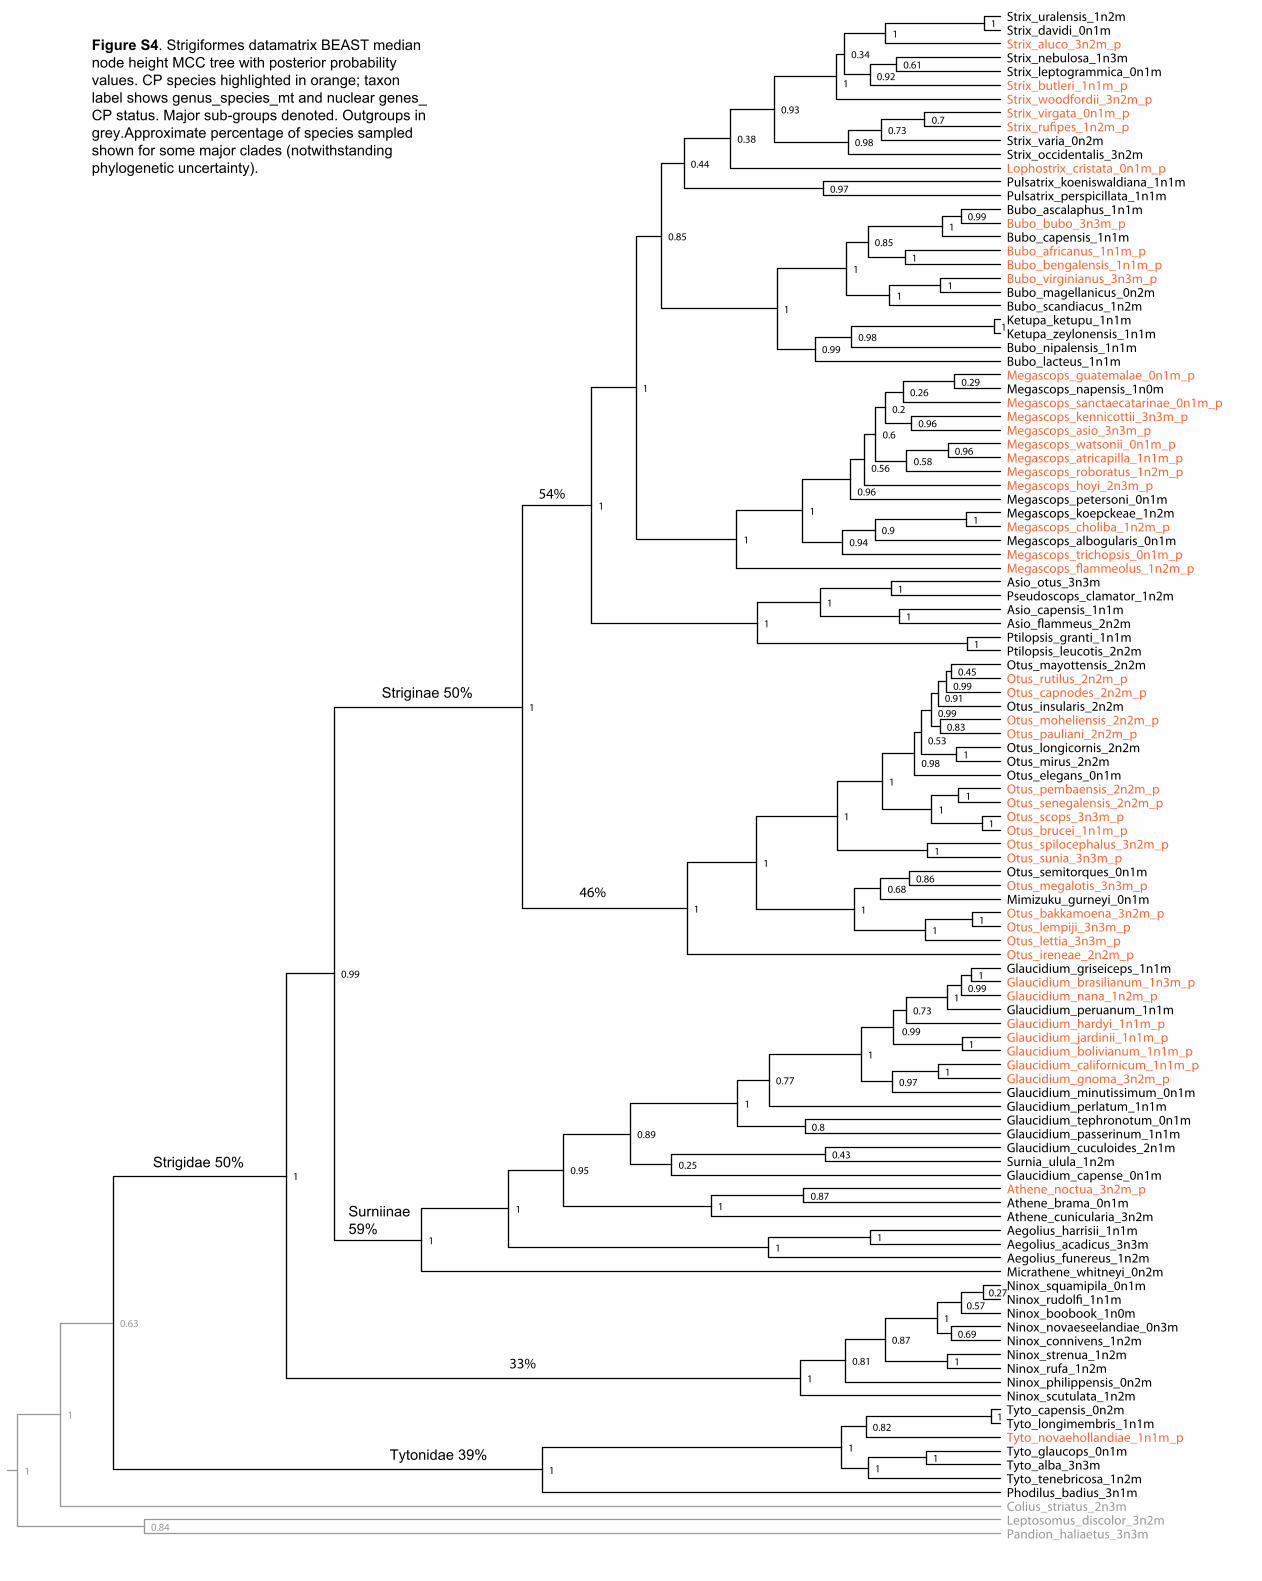
Figure S4. Strigiformes datamatrix BEAST median node height MCC tree with posterior probability values. CP species highlighted in orange; taxon label shows genus_species_mt and nuclear genes_ CP status. Major sub-groups denoted. Outgroups in grey.Approximate percentage of species sampled shown for some major clades (notwithstanding phylogenetic uncertainty).
Strigidae 50%
Tytonidae 39%
Surniinae 59%
Striginae 50%
33%
46%
54%

Caprimulgus_ru�gena_2n1mCaprimulgus_europaeus_3n2m
Chordeiles_minor_2n2m_p
Caprimulgus_carolinensis_3n2m_p
Eurostopodus_argus_2n1m
Aegotheles_archboldi_0n1m_p
Caprimulgus_aegyptius_2n1m
Caprimulgus_salvini_2n1m
Caprimulgus_pectoralis_2n1m_p
Nyctiphrynus_mcleodii_3n2m_p
Caprimulgus_indicus_2n2m
Nyctibius_bracteatus_2n1m
Caprimulgus_batesi_2n1m
Caprimulgus_anthonyi_2n1m
Caprimulgus_enarratus_2n1m
Caprimulgus_poliocephalus_2n1m
Caprimulgus_maculicaudus_3n1m
Caprimulgus_candicans_0n1m
Caprimulgus_madagascariensis_2n1m_p
Hydropsalis_climacocerca_3n1m
Caprimulgus_inornatus_0n1m_p
Aegotheles_wallacii_0n1m
Aegotheles_novaezealandiae_0n1m
Caprimulgus_vociferus_3n2m
Caprimulgus_rufus_2n1m
Caprimulgus_a�nis_3n1m_p
Caprimulgus_nigrescens_2n1m
Hemiprocne_3n1m
Caprimulgus_ridgwayi_2n1m
Nyctiphrynus_rosenbergi_2n1m
Caprimulgus_saturatus_2n1m
Uropsalis_segmentata_3n1m
Batrachostomus_cornutus_0n1m_p
Nyctibius_maculosus_1n1m
Aegotheles_savesi_0n1m
Podargus_strigoides_3n2m_p
Aegotheles_cristatus_1n2m_p
Caprimulgus_cayennensis_2n1m
Strix_2n2m
Grus_3n2m
Podager_nacunda_3n2m
Chordeiles_rupestris_2n1m
Eleothreptus_anomalus_2n2m
Psittaciformes_2n2m
Chordeiles_pusillus_2n1m
Caprimulgus_manillensis_2n1m
Nyctibius_aethereus_2n1m
Pandion_2n2m
Phalaenoptilus_nuttallii_3n2m
Tauraco_3n1m
Macrodipteryx_vexillarius_3n1m
Nyctibius_leucopterus_1n1m
Caprimulgus_parvulus_3n2m
Nyctibius_grandis_3n1m
Podargus_papuensis_1n1m_p
Caprimulgus_nigriscapularis_2n1m_p
Nyctiphrynus_ocellatus_3n1m_p
Aegotheles_tatei_0n1m
Nyctidromus_albicollis_3n2m_p
Caprimulgus_climacurus_3n1m_p
Nyctibius_jamaicensis_1n1m_p
Batrachostomus_septimus_3n1m_p
Podargus_ocellatus_1n1m_p
Caprimulgus_fraenatus_0n1m
Lurocalis_semitorquatus_3n1m
Steatornis_caripensis_3n1m
Hydropsalis_torquata_2n2m
Eurostopodus_papuensis_2n1m
Macrodipteryx_longipennis_2n1m_p
Eurostopodus_macrotis_3n1m
Aegotheles_albertisi_2n1m_p
Caprimulgus_macrurus_3n1m
Caprimulgus_longirostris_3n1m_p
Caprimulgus_whitelyi_2n1m
Eurostopodus_mystacalis_2n1m
Nyctiprogne_leucopyga_3n1m
Chordeiles_acutipennis_3n2m
Aegotheles_bennettii_1n1m
Nyctiphrynus_yucatanicus_2n1m_p
Uropsalis_lyra_2n1m
Aerodramus_3n2m
Aegotheles_crinifrons_0n1m_p
Nyctibius_griseus_1n2m_p
Rigidipenna_inexpectata_0n1m
Aegotheles_insignis_3n1m_p
Caprimulgus_fossii_2n1m_p
Siphonorhis_brewsteri_2n1m
Lurocalis_ru�ventris_2n1m
0.78
1
1
1
1
1
11
0.99 0.98
0.8
1
1
0.57
1
1
1
1
1
1
0.94
1
1
1
1
1
0.85
1
0.59
1
1
0.54
1
0.39
1
1
0.5
1
1
1
10.88
1
1
0.41
1
0.98
11
1
1
0.59
0.98
1
0.34
10.95
1
1
1
1
0.76
0.95
0.36
0.89
1
0.98
1
0.88
0.83
1
1
1
1
1
1
1
0.51
1
0.98
0.63
0.51
0.96
0.68
1
1 Nyctibiidae 100%
Aegothelidae 91%
Apodiformes
Caprimulgidae 62%
Podargidae 43%
Steatornithidae 100%
Figure S5. Caprimulgiformes datamatrix BEAST median node height MCC tree with posterior probability values. CP species highlighted in orange; taxon label shows genus_species_mt and nuclear genes_CP status. Major sub-groups denoted. Outgroups in grey. Approximate percentage of species sampled shown for some major clades (notwithstanding phylogenetic uncertainty).

Milvago_chimachima_1n2m
Falco_concolor_1n1m
Falco_vespertinus_1n1m
Micrastur_semitorquatus_1n2m_p
Falco_deiroleucus_1n1m
Phalcoboenus_australis_1n1m
Falco_longipennis_1n2m
Pandionidae_1n3m
Micrastur_mintoni_1n1m
Falco_cuvierii_1n1m
Falco_amurensis_1n2m
Falco_araeus_0n1m
Caracara_plancus_1n3m
Falco_subniger_1n1m
Falco_berigora_1n1m_p
Herpetotheres_cachinnans_1n2m
Falco_pelegrinoides_1n1m
Falco_rupicoloides_1n1m
Falco_zoniventris_1n1m
Polihierax_semitorquatus_1n2m
Falco_femoralis_1n2m
Microhierax_caerulescens_1n2m
Falco_cenchroides_1n1m
Falco_dickinsoni_1n1m
Micrastur_plumbeus_1n1m
Falco_naumanni_1n2m
Phalcoboenus_megalopterus_1n2m
Falco_rusticolus_1n2m_p
Falco_eleonorae_1n1m_p
Falco_peregrinus_1n3m_p
Falco_columbarius_1n3m
Micrastur_buckleyi_1n1m
Daptrius_ater_1n1m
Falco_newtoni_0n1m_p
Micrastur_ru�collis_1n1m_p
Microhierax_erythrogenys_0n1m
Falco_mexicanus_1n2m
Falco_cherrug_1n1m_p
Psittacidae_1n3m
Ibycter_americanus_1n2m
Falco_chicquera_1n1m
Falco_jugger_1n1m
Falco_sparverius_1n3m_p
Spiziapteryx_circumcincta_1n2m
Corvidae_1n3m
Falco_punctatus_1n1m
Falco_subbuteo_1n3m
Falco_biarmicus_1n1m
Falco_tinnunculus_1n3m
Micrastur_mirandollei_1n1m
Micrastur_gilvicollis_1n2m
Falco_novaeseelandiae_1n1m
Milvago_chimango_1n2m
11
1
1
1
11
0.61
0.64
0.98
0.65
1
0.89
1
1
1
1
1
0.31
1
0.25
1
1
1
1
0.25
1
0.4
1
1
1
0.28
0.99
1
1
0.76
1
1
1
0.95
1
1
1
1
0.65
1
0.32
0.54
1
0.44
0.81
1
Falconinae 74%
Figure S6. Falconidae datamatrix BEAST median node height MCC tree with posterior probability values. CP species high-lighted in orange; taxon label shows genus_species_mt and nuclear genes_ CP status. Major sub-groups denoted. Outgroups in grey. Approximate percentage of species sampled shown for some major clades (notwithstanding phylogenetic uncertainty).
Herpetotherinae 100%
79%

Lophura_erythrophthalma_0n1m
Bonasa_umbellus_0n2m_p
Pternistis_bicalcaratus_0n1m_p
Nothocrax_urumutum_1n1m
Alectoris_chukar_2n3m
Penelope_montagnii_0n1m
Mitu_salvini_0n1m
Peliperdix_lathami_1n2m
Lophura_nycthemera_2n3m
Colinus_virginianus_2n2m
Chamaepetes_goudotii_1n1m
Agelastes_meleagrides_0n1m
Perdicula_asiatica_0n1m
Oreophasis_derbianus_1n1m
Lagopus_lagopus_0n2m_p
Tetrao_parvirostris_0n2m
Penelope_obscura_1n0m
Megapodius_cumingii_0n1m
Rollulus_rouloul_0n1m
Gallus_lafayetii_2n2m
Alectoris_rufa_2n1m
Francolinus_pintadeanus_0n1m
Chrysolophus_pictus_2n3m
Lagopus_muta_0n2m
Gallus_gallus_2n3m
Polyplectron_katsumatae_0n1m
Pternistis_swainsonii_1n2m
Margaroperdix_madagarensis_0n1m
Megapodius_layardi_2n2m
Chrysolophus_amherstiae_1n3m
Coturnix_japonica_2n2m
Callipepla_gambelii_1n2m
Dendroperdix_sephaena_1n2m
Tetraogallus_altaicus_0n1m
Falcipennis_canadensis_2n2m_p
Excalfactoria_chinensis_0n2m
Penelope_argyrotis_0n1m
Tragopan_blythii_2n2m
Lophura_inornata_2n2m
Crossoptilon_auritum_0n2m
Ortalis_vetula_2n2m
Arborophila_javanica_1n1m
Polyplectron_inopinatum_2n2m
Crax_alberti_0n1m_p
Gallus_sonneratii_2n2m
Crax_rubra_2n2m_p
Crax_alector_0n1m
Ortalis_guttata_0n1m
Megapodius_pritchardii_0n1m
Tragopan_temminckii_2n3m
Francolinus_pondicerianus_1n2m
Centrocercus_urophasianus_0n2m
Gallus_varius_2n3m
Catreus_wallichii_2n2m
Mitu_tomentosum_0n1m
Ortalis_canicollis_1n1m
Lophura_ignita_0n2m
Lophura_bulweri_0n1m
Megapodius_tenimberensis_0n1m
Pternistis_hartlaubi_0n1m_p
Francolinus_gularis_0n1m
Lagopus_leucura_0n2m
Guttera_pucherani_2n2m
Tympanuchus_cupido_0n2m
Polyplectron_germaini_2n2m
Ortalis_poliocephala_0n1m
Ortalis_ru�cauda_0n1m
Mitu_tuberosum_1n1m
Callipepla_squamata_0n2m
Scleroptila_levaillantii_1n2m
Pipile_cumanensis_0n1m
Arborophila_gingica_0n1m
Meleagris_gallopavo_2n3m
Tetraogallus_caspius_0n1m
Crax_daubentoni_0n1m
Penelope_superciliaris_0n1m
Penelope_jacquacu_0n1m
Ortalis_motmot_0n1m
Eulipoa_wallacei_0n1m
Arborophila_torqueola_0n1m
Pipile_jacutinga_1n0m
Alectoris_graeca_0n1m
Megapodius_eremita_0n2m
Syrmaticus_mikado_1n2m
Numida_meleagris_2n3m
Aburria_aburri_1n1m
Leipoa_ocellata_2n2m
Tetraophasis_szechenyii_0n3m
Rheinardia_ocellata_0n1m
Pucrasia_macrolopha_2n3m_p
Pternistis_natalensis_1n2m_p
Pavo_muticus_2n3m
Syrmaticus_soemmerringii_0n2m
Caloperdix_oculeus_0n1m
Guttera_plumifera_0n1m
Ithaginis_cruentus_1n2m
Polyplectron_bicalcaratum_2n3m
Lophura_edwardsi_0n1m
Coturnix_coturnix_0n2m
Lophophorus_impejanus_2n2m_p
Ortalis_leucogastra_0n1m
Talegalla_fuscirostris_0n1m
Cyrtonyx_montezumae_2n2m
Crossoptilon_crossoptilon_2n2m
Pternistis_capensis_1n2m
Scleroptila_levaillantoides_0n2m
Pipile_cujubi_0n1m
Callipepla_douglasii_0n2m
Polyplectron_schleiermacheri_1n1m
Callipepla_californica_0n2m_p
Alectoris_philbyi_0n1m
Phasianus_versicolor_0n2m
Tragopan_satyra_0n1m
Polyplectron_napoleonis_2n2m
Syrmaticus_humiae_1n3m
Penelope_purpurascens_0n1m
Lophura_diardi_0n1m
Oreortyx_pictus_2n2m_p
Pternistis_squamatus_1n2m_p
Pavo_cristatus_2n2m
Afropavo_congensis_2n2m
Macrocephalon_maleo_0n2m
Crax_globulosa_0n1m
Perdix_perdix_2n2m
Dendragapus_obscurus_0n2m
Lophophorus_sclateri_0n2m
Perdix_hodgsoniae_0n2m
Ammoperdix_heyi_0n1m
Tympanuchus_phasianellus_2n2m
Pauxi_unicornis_0n1m
Argusianus_argus_1n1m
Coturnix_pectoralis_0n1m
Scleroptila_shelleyi_1n2m
Pauxi_pauxi_2n1m_p
Syrmaticus_ellioti_2n3m
Francolinus_francolinus_0n1m
Arborophila_ru�pectus_0n1m
Ptilopachus_petrosus_1n2m
Crossoptilon_harmani_0n1m
Megapodius_decollatus_0n1m
Tetrastes_bonasia_0n3m
Chamaepetes_unicolor_0n1m
Pternistis_hildebrandti_0n1m
Megapodius_forsteni_0n1m
Crossoptilon_mantchuricum_0n1m
Tragopan_caboti_0n2m
Scleroptila_africana_1n2m
Polyplectron_malacense_2n2m
Megapodius_freycinet_0n2m
Megapodius_reinwardt_1n1m
Ptilopachus_nahani_1n2m
Tympanuchus_pallidicinctus_0n2m
Tetrastes_sewerzowi_0n2m
Phasianus_colchicus_2n3m
Tetraophasis_obscurus_0n2m
Perdix_dauurica_0n3m
Scleroptila_�nschi_0n2m
Galloperdix_lunulata_0n1m
Pternistis_griseostriatus_1n2m
Pternistis_castaneicollis_0n1m_p
Anas_1n2m
Ortalis_garrula_0n1m
Haematortyx_sanguiniceps_0n1m
Crax_fasciolata_0n1m
Tetrao_urogallus_0n2m
Pternistis_leucoscepus_1n2m
Syrmaticus_reevesii_2n3m
Colinus_cristatus_0n1m
Acryllium_vulturinum_1n3m
Pternistis_adspersus_1n2m
Alectoris_barbara_0n1m
Tetraogallus_tibetanus_0n2m
Lyrurus_mlokosiewiczi_0n2m
Pternistis_erckelii_0n1m
Polyplectron_chalcurum_2n2m
Lyrurus_tetrix_0n2m_p
Coturnix_ypsilophora_0n2m
Alectura_lathami_2n3m
Alectoris_magna_0n2m
Lophura_swinhoii_2n2m
Lophura_hatinhensis_0n1m
Arborophila_rufogularis_0n1m
Mitu_mitu_0n1m
Bambusicola_fytchii_0n2m
Alectoris_melanocephala_0n1m
Penelopina_nigra_1n1m
Lophophorus_lhuysii_0n3m
Xenoperdix_udzungwensis_1n1m
Rhizothera_longirostris_0n1m
Falcipennis_falcipennis_0n2m
Crax_blumenbachii_1n1m
Pternistis_afer_1n2m
Lophura_leucomelanos_0n1m_p
Tetraogallus_himalayensis_0n2m
Peliperdix_coqui_1n2m
Bambusicola_thoracicus_2n3m
Ortalis_cinereiceps_0n1m
Aepypodius_arfakianus_0n1m
1
0.49
0.99
1
0.44
1
1
1
1
0.51
0.97
0.36
1
1
1
1
0.5
1
0.96
1
0.57
1
1
0.31
1
1
1
0.84
1
0.98
0.39
1
0.49
0.78
1
0.19
0.95
0.85
0.21
1
1
0.91
1
0.45
0.87
1
0.98
1
1
1
1
0.64
0.91
1
1
1
0.88
1
1
1
0.86
0.55
0.92
1
0.95
0.99
1
1
0.91
0.38
1
1
1
1
1
0.94
1
0.33
1
0.79
1
0.62
1
0.97
1
1
1
1
1
1
1
1
1
11
0.96
0.96
1
1
1
1
1
1
1
1
1
0.66
1
0.26
1
1
1
0.95
1
0.33
0.97
0.46
1
0.55
0.57
0.94
0.45
0.98
1
1
1
0.12
1
0.74
0.84
1
1
0.76
1
0.55
1
1
1
1
0.89
0.55
0.79
1
1
0.97
0.81
1
0.99
1
1
1
1
0.95
1
0.73
1
1
1
1
0.89
1
1
1
0.96
1
1
1
1
0.46
10.97
0.91
0.39
1
0.31
0.34
0.94
0.7
0.14
1
1
1
0.36
1
1
0.21
1
1
0.45
0.99
1
0.9
0.9
1
1
0.66
Figure S7. Galliformes datamatrix BEAST median node height MCC tree with posterior probability values. CP species highlighted in orange; taxon label shows genus_species_mt and nuclear genes_CP status. Major sub-groups denoted. Outgroups in grey. Approximate percentage of species sampled shown for some major clades (notwithstanding phylogenetic uncertainty).
Megapodidae 78%
Cracidae 69%
Phasianidae 72%
Odontophoridae 29%
Numididae 83%