supplementary information - media.nature.com · | 5 supplementary information research 0.01 legend:...
TRANSCRIPT
W W W. N A T U R E . C O M / N A T U R E | 1
SUPPLEMENTARY INFORMATIONdoi:10.1038/nature12721
0
1
2
3
4
Tota
l num
ber o
f Neu
ropi
lin1-‐
Tota
l num
ber o
f CD
103+
cel
ls
GF HFD LFD CRB
GF HFD LFD CRB
0
1
2
3
4
5
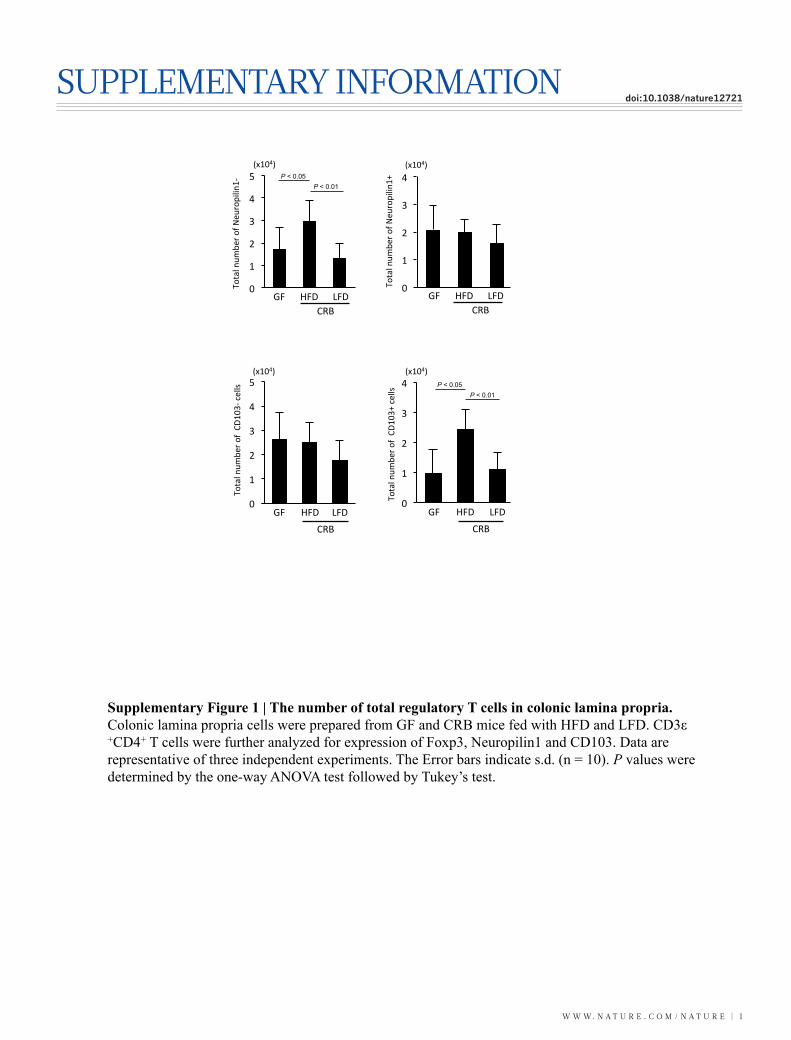
Supplementary Figure 1 | The number of total regulatory T cells in colonic lamina propria. Colonic lamina propria cells were prepared from GF and CRB mice fed with HFD and LFD. CD3ε+CD4+ T cells were further analyzed for expression of Foxp3, Neuropilin1 and CD103. Data are representative of three independent experiments. The Error bars indicate s.d. (n = 10). P values were determined by the one-way ANOVA test followed by Tukey’s test.
0
1
2
3
4
GF HFD LFD CRB
Tota
l num
ber o
f Neu
ropi
lin1+
0
1
2
3
4
5
GF HFD LFD CRB
Tota
l num
ber o
f CD
103-‐
cel
ls
(x104) (x104)
(x104) (x104)
P < 0.05 P < 0.01
P < 0.05 P < 0.01
SUPPLEMENTARY INFORMATION
2 | W W W. N A T U R E . C O M / N A T U R E
RESEARCH
Tota
l num
ber o
f He
lios-‐
cel
ls
GF HFD LFD
CRB
0
2
4
6
0
5
10
15
20
25
[%] o
f He
lios-‐
Fox
p3+
GF HFD LFD
CRB
0
2
4
6
8
10
GF HFD LFD
CRB
[%] o
f He
lios+
Fox
p3+
GF LFD HFD
Helios
Foxp
3
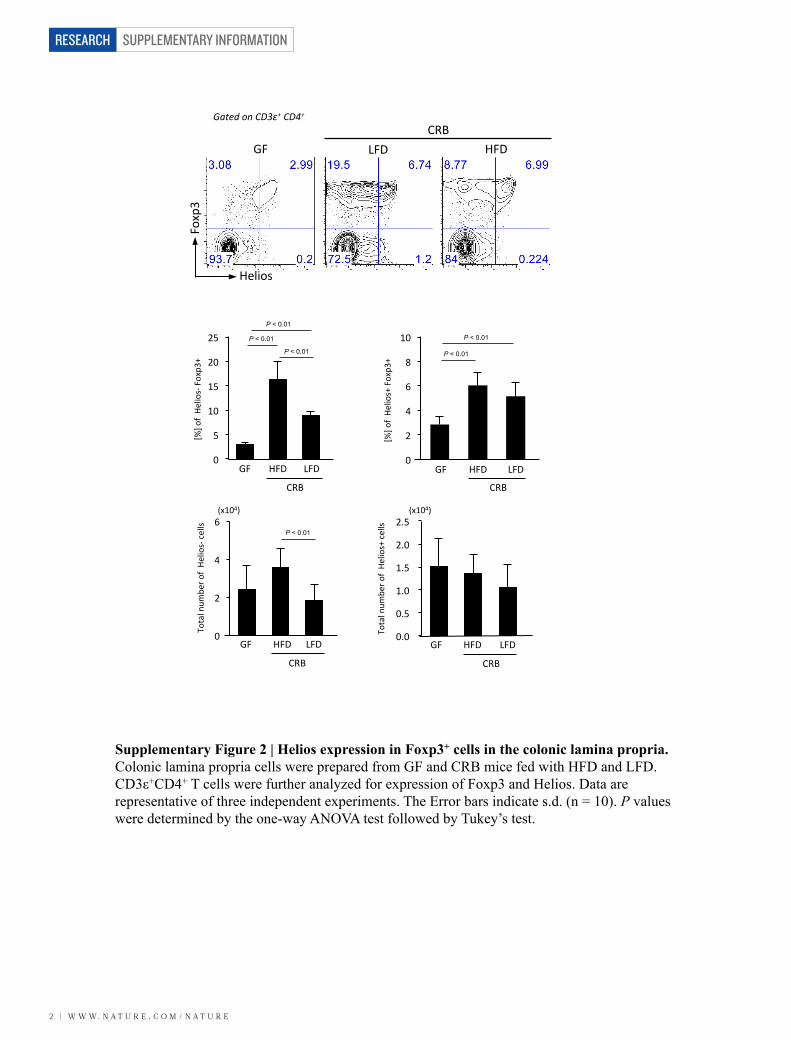
Supplementary Figure 2 | Helios expression in Foxp3+ cells in the colonic lamina propria. Colonic lamina propria cells were prepared from GF and CRB mice fed with HFD and LFD. CD3ε+CD4+ T cells were further analyzed for expression of Foxp3 and Helios. Data are representative of three independent experiments. The Error bars indicate s.d. (n = 10). P values were determined by the one-way ANOVA test followed by Tukey’s test.
0.0
0.5
1.0
1.5
2.0
2.5
GF HFD LFD
CRB
Tota
l num
ber o
f He
lios+
cel
ls
(x104) (x104)
CRB
P < 0.01
P < 0.01
P < 0.01
P < 0.01
P < 0.01
P < 0.01
Gated on CD3ε+ CD4+
W W W. N A T U R E . C O M / N A T U R E | 3
SUPPLEMENTARY INFORMATION RESEARCH
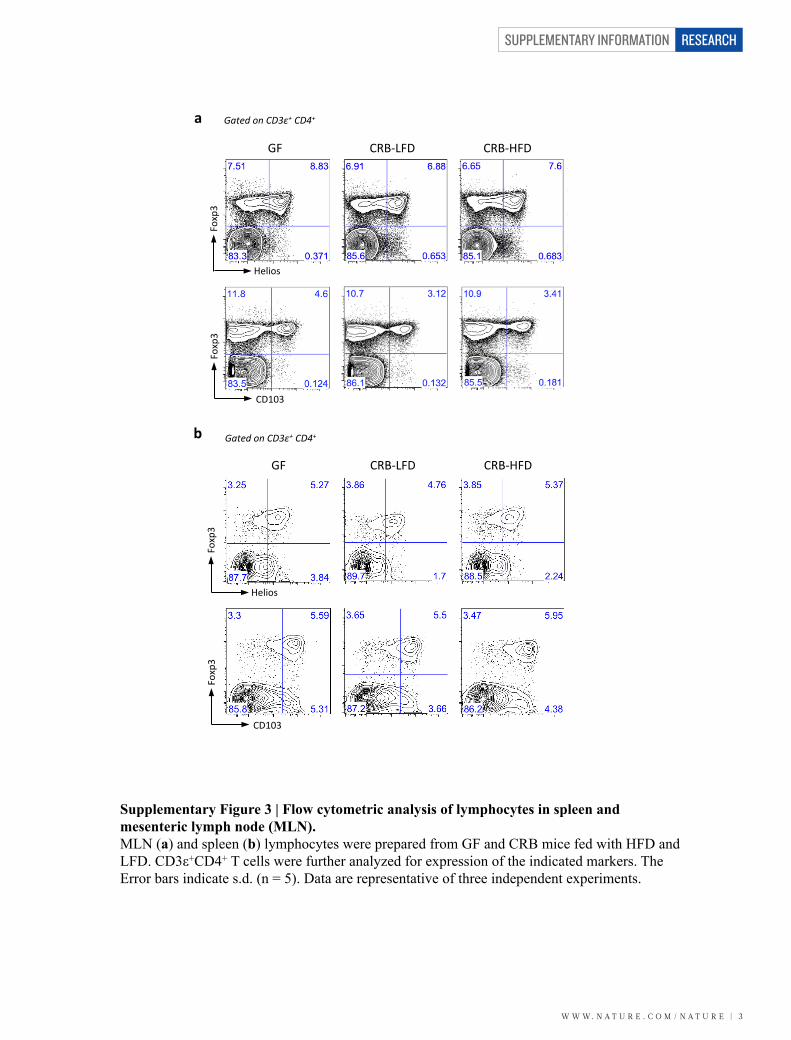
Supplementary Figure 3 | Flow cytometric analysis of lymphocytes in spleen and mesenteric lymph node (MLN). MLN (a) and spleen (b) lymphocytes were prepared from GF and CRB mice fed with HFD and LFD. CD3ε+CD4+ T cells were further analyzed for expression of the indicated markers. The Error bars indicate s.d. (n = 5). Data are representative of three independent experiments.
CD103
Helios
Foxp
3
GF CRB-‐LFD CRB-‐HFD
a
b
GF CRB-‐LFD CRB-‐HFD
Foxp
3
CD103
Helios
Foxp
3 Fo
xp3
Gated on CD3ε+ CD4+
Gated on CD3ε+ CD4+
SUPPLEMENTARY INFORMATION
4 | W W W. N A T U R E . C O M / N A T U R E
RESEARCH
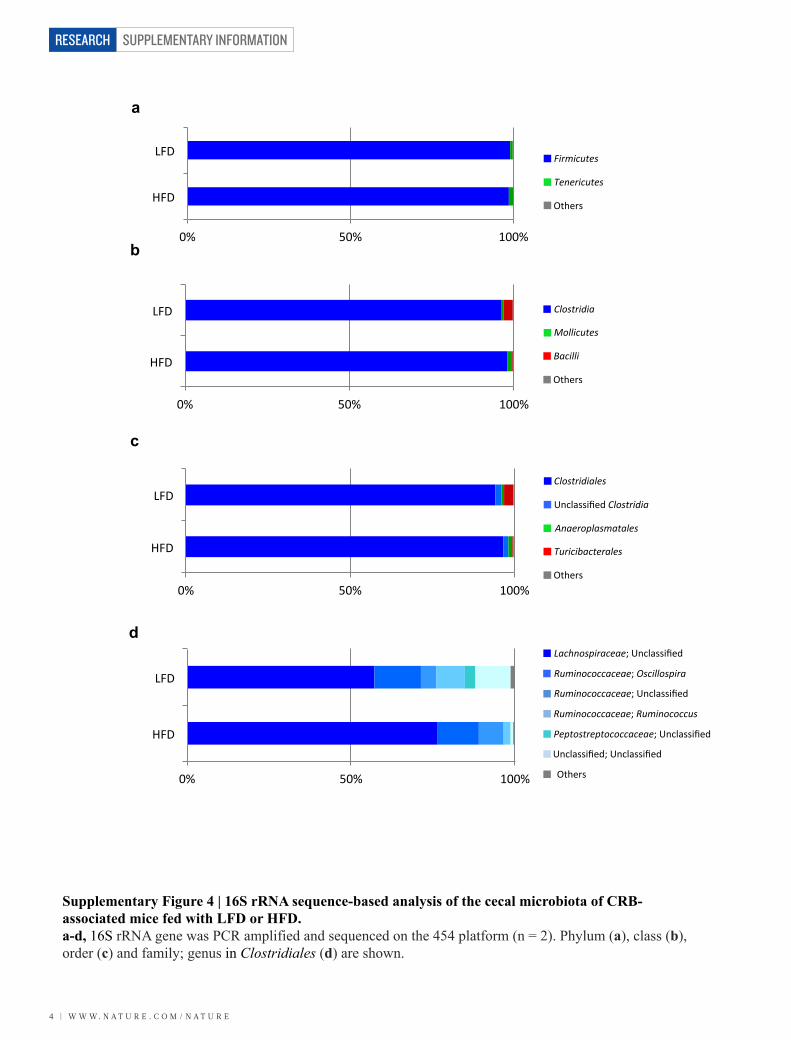
Supplementary Figure 4 | 16S rRNA sequence-based analysis of the cecal microbiota of CRB-associated mice fed with LFD or HFD. a-d, 16S rRNA gene was PCR amplified and sequenced on the 454 platform (n = 2). Phylum (a), class (b), order (c) and family; genus in Clostridiales (d) are shown.
a
b
c
d
0% 50% 100%
HFD
LFD
0% 50% 100%
HFD
LFD
0% 50% 100%
HFD
LFD
0% 50% 100%
HFD
LFD
Peptostreptococcaceae; Unclassified
Ruminococcaceae; Unclassified
Lachnospiraceae; Unclassified
Clostridia
Mollicutes
Bacilli
Others
Clostridiales
Unclassified Clostridia
Anaeroplasmatales
Turicibacterales
Others
Ruminococcaceae; Oscillospira
Ruminococcaceae; Ruminococcus
Unclassified; Unclassified
Others
Firmicutes
Tenericutes
Others
W W W. N A T U R E . C O M / N A T U R E | 5
SUPPLEMENTARY INFORMATION RESEARCH
0.01Legend:
Dataset read
L_total
H_total
spore
Color ranges:
IV
I
II
XI
III
XIVa
Escherichia coli {NR 102804}
OTU 1359
OTU 1015
OTU 343
OTU 141OTU 1052
OTU 1418
Hydrogenoanaerobacterium saccharovorans {NR 044425}
OTU 1395Clostridium
cellulosi {FJ465164}
Acetanaerobacterium elongatum
{NR 042930}
OTU 878
OTU 119
OTU
1234O
TU 1555
OTU
856
OTU
1580
OTU 149
OTU 1498
Clostridium m
ethylpentosum {Y18181}
OTU 1604
OTU 1087
Ruminococcus bromii {DQ882649}
Clostridium leptum {AJ305238}
Butyricicoccus pullicaecorum {EU410376}
Eubacterium desmolans {L34618}
OTU
105O
TU 1393 O
TU 1
422
Oscillospira guillierm
ondii {AB040495}
OTU
112O
TU 1465
Oscillibacter valericigenes {N
R 074793} O
TU 1
81O
TU 2
33
OTU
608
OTU
135
8O
TU 1
423
OTU
118
1O
TU 6
52
OTU
239
OTU
422
OTU
46
OTU
540
OTU
295
OTU
43
OTU 52
2OTU
529
Clostrid
ium or
biscin
dens
{Y18
187}
Flavonifra
ctor p
lautii {NR 043142}
Pseud
oflav
onifra
ctor c
apillo
sus {
NR 0256
70}
OTU 21
7
OTU 1596
OTU 513OTU 744OTU 1500
OTU 1048OTU 1097
OTU 1
068
OTU 10
83
OTU 1
406
OTU
211
OTU
1641C
lost
ridiu
m v
iride
{NR
026
204}
Faecalibacterium prausnitzii {AY305307}
Faecalibacterium prausnitzii {NR 028961}
Faecalibacterium prausnitzii {AJ270469}
Faecalibacterium prausnitzii {AJ270470}
OTU 455
Clostridium sporogenes {AJ579907}
Clostridium tetani {NR 074498}Clostridium tyrobutyricum {M59113}Clostridium peptidovorans {AF156796}
Clostridium histolyticum {M59094}Clostridium limosum {M59096}
Clostridium proteolyticum {X73448}
Clostridium grantii {X75272}
Clostridium acetobutylicum {X68182}
Clostridium butyricum {FJ384369}Clostridium disporicum {Y18176}
Clostridium difficile {AB638443}
Clostridium difficile {X73450}
Clostridium lituseburense {M59107}
OTU 20
Clostridium litorale {X77845}
Clostridium thermolacticum {X72870}Clostridium termitidis {X71854}
Clostridium aldrichii {NR 026099}
Clostridium thermocellum {NR 074629}
OTU 50OTU 1313
OTU 100OTU 1496
OTU 1034
OTU 96OTU 1070
OTU 1250
OTU 1538OTU 998
OTU 1434OTU 979
OTU 634Catonella morbi {NR 026248}
Clostridium scindens {NR 028785}
OTU 1073
OTU 1091
OTU 601OTU 1299
OTU 1426
OTU 600OTU 1215
OTU 1038OTU 1397
OTU 124
OTU 611
OTU
262
OTU
984O
TU 466
OTU
1309O
TU 1142O
TU 7
72
OTU
849
OTU
1099O
TU 89
OTU
614
OTU
1519
OTU
923Butyrivibrio proteoclasticus {U
37378}
Clostridium nexile {NR 029248}Clostridium oroticum {FR749917}
Clostridium coccoides {EF025906}
Roseburia inulinivorans {AJ270473}
Roseburia inulinivorans {NR 042007}
Lachnospira pectinoschiza {AY169414}
Roseburia intestinalis {AJ312385}
Roseburia intestinalis {AY305308}Roseburia intestinalis {NR 027557}
Roseburia hominis {AJ270482}Roseburia faecis {AY305310}
Roseburia cecicola {L14676}
OTU 399
OTU 1386OTU 1653
Clostridium hylemonae {NR 024719}
OTU 268OTU 693
OTU 114OTU 288
Clostridium celerecrescens {NR 026100}
Clostridium xylanolyticum {X71855}Clostridium bolteae {NR 025567}
Clostridium clostridioforme {HM008264}
Clostridium lavalense {EF564278}
OTU 293OTU 571
OTU 179OTU 1656
OTU 139
Rumino
coccu
s obe
um {A
Y1694
11}
OTU 1578
Euba
cteriu
m re
ctale
{AJ2
7047
5}
Euba
cteriu
m re
ctale
{AY3
0531
1}
Butyr
ivibr
io fib
risolv
ens {
AJ25
0365
}
Blau
tia h
ydro
geno
troph
ica {N
R 02
6314
}O
TU 1
449
Anae
rost
ipes
cac
cae
{AJ2
7048
7}
Para
spor
obac
teriu
m p
auciv
oran
s {NR
025
390}
OTU 23
7OTU 1053
OTU 1623
OTU 10
11
Clostrid
ium xy
lanov
oran
s {NR 02
8740
}
OTU 55
6
Clos
tridi
um a
min
ophi
lum
{DQ
2788
62}
Euba
cter
ium
rum
inan
tium
{NR
0246
61}
OTU
141
0
OTU
490
OTU
264
OTU
162
4
OTU
223
OTU
953
OTU
148
4O
TU 6
56
Cluster XIVa
Cluster IV
Cluster III
Cluster I
Cluster II
Cluster XI
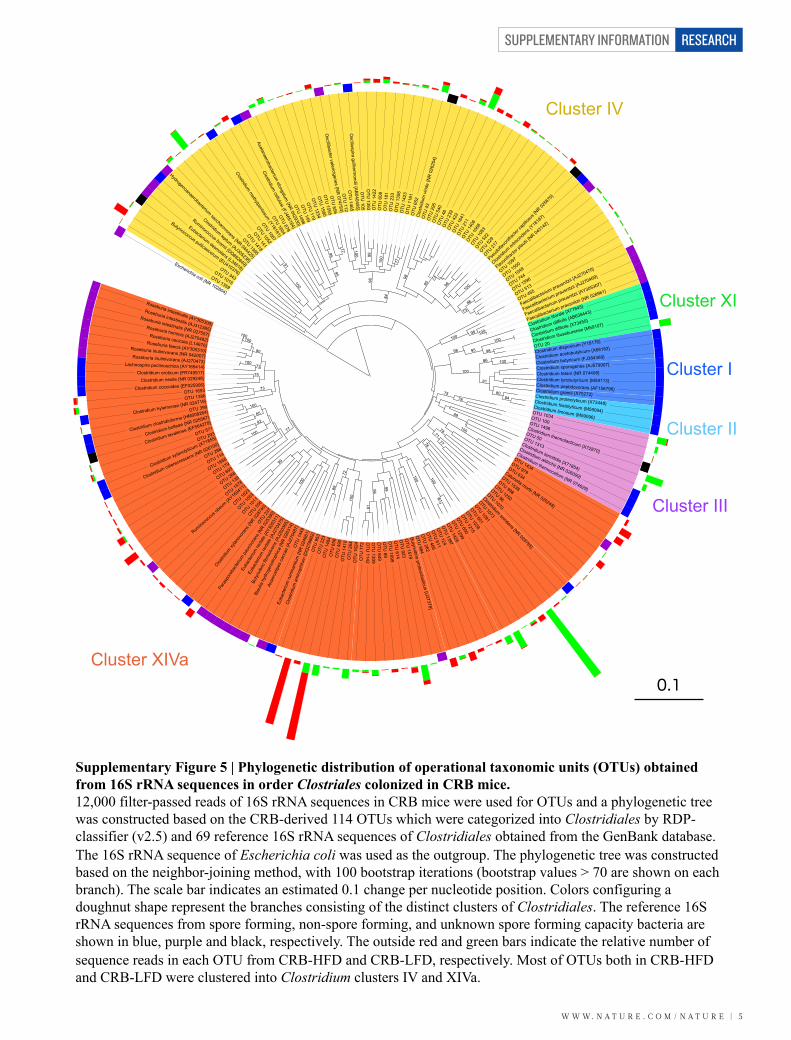
Supplementary Figure 5 | Phylogenetic distribution of operational taxonomic units (OTUs) obtained from 16S rRNA sequences in order Clostriales colonized in CRB mice. 12,000 filter-passed reads of 16S rRNA sequences in CRB mice were used for OTUs and a phylogenetic tree was constructed based on the CRB-derived 114 OTUs which were categorized into Clostridiales by RDP-classifier (v2.5) and 69 reference 16S rRNA sequences of Clostridiales obtained from the GenBank database. The 16S rRNA sequence of Escherichia coli was used as the outgroup. The phylogenetic tree was constructed based on the neighbor-joining method, with 100 bootstrap iterations (bootstrap values > 70 are shown on each branch). The scale bar indicates an estimated 0.1 change per nucleotide position. Colors configuring a doughnut shape represent the branches consisting of the distinct clusters of Clostridiales. The reference 16S rRNA sequences from spore forming, non-spore forming, and unknown spore forming capacity bacteria are shown in blue, purple and black, respectively. The outside red and green bars indicate the relative number of sequence reads in each OTU from CRB-HFD and CRB-LFD, respectively. Most of OTUs both in CRB-HFD and CRB-LFD were clustered into Clostridium clusters IV and XIVa.
0.1
0.01Legend:
Dataset read
L_total
H_total
spore
Color ranges:
IV
I
II
XI
III
XIVa
Escherichia coli {NR 102804}
OTU 1359
OTU 1015
OTU 343
OTU 141OTU 1052
OTU 1418
Hydrogenoanaerobacterium saccharovorans {NR 044425}
OTU 1395Clostridium
cellulosi {FJ465164}
Acetanaerobacterium elongatum
{NR 042930}
OTU 878
OTU 119
OTU
1234O
TU 1555
OTU
856
OTU
1580
OTU 149
OTU 1498
Clostridium m
ethylpentosum {Y18181}
OTU 1604
OTU 1087
Ruminococcus bromii {DQ882649}
Clostridium leptum {AJ305238}
Butyricicoccus pullicaecorum {EU410376}
Eubacterium desmolans {L34618}
OTU
105O
TU 1393 O
TU 1
422
Oscillospira guillierm
ondii {AB040495}
OTU
112O
TU 1465
Oscillibacter valericigenes {N
R 074793} O
TU 1
81O
TU 2
33
OTU
608
OTU
135
8O
TU 1
423
OTU
118
1O
TU 6
52
OTU
239
OTU
422
OTU
46
OTU
540
OTU
295
OTU
43
OTU 52
2OTU
529
Clostrid
ium or
biscin
dens
{Y18
187}
Flavonifra
ctor p
lautii {NR 043142}
Pseud
oflav
onifra
ctor c
apillo
sus {
NR 0256
70}
OTU 21
7
OTU 1596
OTU 513OTU 744OTU 1500
OTU 1048OTU 1097
OTU 1
068
OTU 10
83
OTU 1
406
OTU
211
OTU
1641C
lost
ridiu
m v
iride
{NR
026
204}
Faecalibacterium prausnitzii {AY305307}
Faecalibacterium prausnitzii {NR 028961}
Faecalibacterium prausnitzii {AJ270469}
Faecalibacterium prausnitzii {AJ270470}
OTU 455
Clostridium sporogenes {AJ579907}
Clostridium tetani {NR 074498}Clostridium tyrobutyricum {M59113}Clostridium peptidovorans {AF156796}
Clostridium histolyticum {M59094}Clostridium limosum {M59096}
Clostridium proteolyticum {X73448}
Clostridium grantii {X75272}
Clostridium acetobutylicum {X68182}
Clostridium butyricum {FJ384369}Clostridium disporicum {Y18176}
Clostridium difficile {AB638443}
Clostridium difficile {X73450}
Clostridium lituseburense {M59107}
OTU 20
Clostridium litorale {X77845}
Clostridium thermolacticum {X72870}Clostridium termitidis {X71854}
Clostridium aldrichii {NR 026099}
Clostridium thermocellum {NR 074629}
OTU 50OTU 1313
OTU 100OTU 1496
OTU 1034
OTU 96OTU 1070
OTU 1250
OTU 1538OTU 998
OTU 1434OTU 979
OTU 634Catonella morbi {NR 026248}
Clostridium scindens {NR 028785}
OTU 1073
OTU 1091
OTU 601OTU 1299
OTU 1426
OTU 600OTU 1215
OTU 1038OTU 1397
OTU 124
OTU 611
OTU
262
OTU
984O
TU 466
OTU
1309O
TU 1142O
TU 7
72
OTU
849
OTU
1099O
TU 89
OTU
614
OTU
1519
OTU
923Butyrivibrio proteoclasticus {U
37378}Clostridium nexile {NR 029248}
Clostridium oroticum {FR749917}
Clostridium coccoides {EF025906}
Roseburia inulinivorans {AJ270473}
Roseburia inulinivorans {NR 042007}
Lachnospira pectinoschiza {AY169414}
Roseburia intestinalis {AJ312385}
Roseburia intestinalis {AY305308}Roseburia intestinalis {NR 027557}
Roseburia hominis {AJ270482}Roseburia faecis {AY305310}
Roseburia cecicola {L14676}
OTU 399
OTU 1386OTU 1653
Clostridium hylemonae {NR 024719}
OTU 268OTU 693
OTU 114OTU 288
Clostridium celerecrescens {NR 026100}
Clostridium xylanolyticum {X71855}Clostridium bolteae {NR 025567}
Clostridium clostridioforme {HM008264}
Clostridium lavalense {EF564278}
OTU 293OTU 571
OTU 179OTU 1656
OTU 139
Rumino
coccu
s obe
um {A
Y1694
11}
OTU 1578
Euba
cteriu
m re
ctale
{AJ2
7047
5}
Euba
cteriu
m re
ctale
{AY3
0531
1}
Butyr
ivibr
io fib
risolv
ens {
AJ25
0365
}
Blau
tia h
ydro
geno
troph
ica {N
R 02
6314
}O
TU 1
449
Anae
rost
ipes
cac
cae
{AJ2
7048
7}
Para
spor
obac
teriu
m p
auciv
oran
s {NR
025
390}
OTU 23
7OTU 1053
OTU 1623
OTU 10
11
Clostrid
ium xy
lanov
oran
s {NR 02
8740
}
OTU 55
6
Clos
tridi
um a
min
ophi
lum
{DQ
2788
62}
Euba
cter
ium
rum
inan
tium
{NR
0246
61}
OTU
141
0
OTU
490
OTU
264
OTU
162
4
OTU
223
OTU
953
OTU
148
4O
TU 6
56
Cluster XIVa
Cluster IV
Cluster III
Cluster I
Cluster II
Cluster XI
Supplementary Figure 5 | Phylogenetic distribution of operational taxonomic units (OTUs) obtained from 16S rRNA sequences in order Clostriales colonized in CRB mice. 12,000 filter-passed reads of 16S rRNA sequences in CRB mice were used for OTUs and a phylogenetic tree was constructed based on the CRB-derived 114 OTUs which were categorized into Clostridiales by RDP-classifier (v2.5) and 69 reference 16S rRNA sequences of Clostridiales obtained from the GenBank database. The 16S rRNA sequence of Escherichia coli was used as the outgroup. The phylogenetic tree was constructed based on the neighbor-joining method, with 100 bootstrap iterations (bootstrap values > 70 are shown on each branch). The scale bar indicates an estimated 0.1 change per nucleotide position. Colors configuring a doughnut shape represent the branches consisting of the distinct clusters of Clostridiales. The reference 16S rRNA sequences from spore forming, non-spore forming, and unknown spore forming capacity bacteria are shown in blue, purple and black, respectively. The outside red and green bars indicate the relative number of sequence reads in each OTU from CRB-HFD and CRB-LFD, respectively. Most of OTUs both in CRB-HFD and CRB-LFD were clustered into Clostridium clusters IV and XIVa.
0.1
SUPPLEMENTARY INFORMATION
6 | W W W. N A T U R E . C O M / N A T U R E
RESEARCH
b
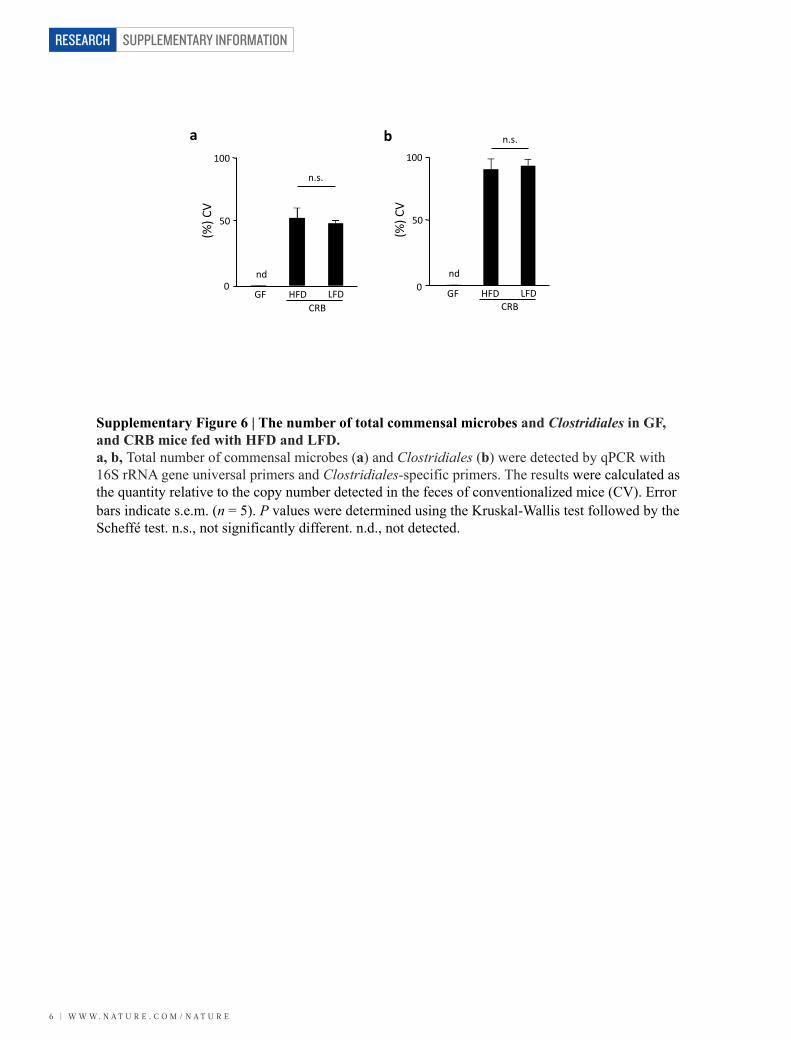
Supplementary Figure 6 | The number of total commensal microbes and Clostridiales in GF, and CRB mice fed with HFD and LFD. a, b, Total number of commensal microbes (a) and Clostridiales (b) were detected by qPCR with 16S rRNA gene universal primers and Clostridiales-specific primers. The results were calculated as the quantity relative to the copy number detected in the feces of conventionalized mice (CV). Error bars indicate s.e.m. (n = 5). P values were determined using the Kruskal-Wallis test followed by the Scheffé test. n.s., not significantly different. n.d., not detected.
a
(%) C
V
nd
n.s.
GF HFD LFD CRB
100
50
0
(%) C
V
nd
n.s.
GF HFD LFD CRB
100
50
0
b
Supplementary Figure 6 | The number of total commensal microbes and Clostridiales in GF, and CRB mice fed with HFD and LFD. a, b, Total number of commensal microbes (a) and Clostridiales (b) were detected by qPCR with 16S rRNA gene universal primers and Clostridiales-specific primers. The results were calculated as the quantity relative to the copy number detected in the feces of conventionalized mice (CV). Error bars indicate s.e.m. (n = 5). P values were determined using the Kruskal-Wallis test followed by the Scheffé test. n.s., not significantly different. n.d., not detected.
a
(%) C
V
nd
n.s.
GF HFD LFD CRB
100
50
0
(%) C
V
nd
n.s.
GF HFD LFD CRB
100
50
0
W W W. N A T U R E . C O M / N A T U R E | 7
SUPPLEMENTARY INFORMATION RESEARCH
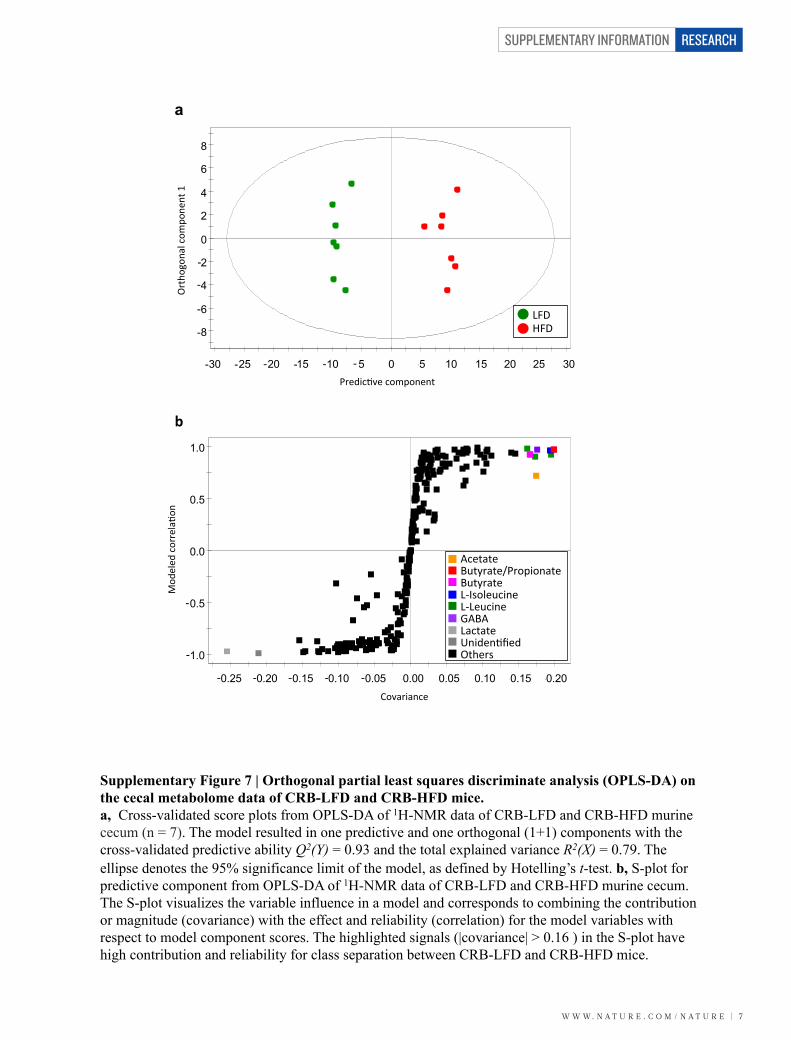
Supplementary Figure 7 | Orthogonal partial least squares discriminate analysis (OPLS-DA) on the cecal metabolome data of CRB-LFD and CRB-HFD mice. a, Cross-validated score plots from OPLS-DA of 1H-NMR data of CRB-LFD and CRB-HFD murine cecum (n = 7). The model resulted in one predictive and one orthogonal (1+1) components with the cross-validated predictive ability Q2(Y) = 0.93 and the total explained variance R2(X) = 0.79. The ellipse denotes the 95% significance limit of the model, as defined by Hotelling’s t-test. b, S-plot for predictive component from OPLS-DA of 1H-NMR data of CRB-LFD and CRB-HFD murine cecum. The S-plot visualizes the variable influence in a model and corresponds to combining the contribution or magnitude (covariance) with the effect and reliability (correlation) for the model variables with respect to model component scores. The highlighted signals (|covariance| > 0.16 ) in the S-plot have high contribution and reliability for class separation between CRB-LFD and CRB-HFD mice.
a
b -1.0
-0.5
0.0
0.5
1.0
-0.20-0.15-0.10-0.05-0.000.050.100.150.200.25
p(co
rr)[1
]
p[1]
130509_1HNMR_Treg_IQI&BALB_CRB for Loading and S-plot.M5 (OPLS/O2PLS-DA), L, H: Parp[Comp. 1]/p(corr)[Comp. 1]
R2X[1] = 0.667384 SIMCA-P+ 12.0.1 - 2013-05-20 12:07:30 (UTC+9)
Covariance
Mod
eled
cor
rela
Uon
Acetate Butyrate/Propionate Butyrate L-‐Isoleucine L-‐Leucine GABA Lactate UnidenUfied Others
-
-
- - - - -
-8
-6
-4
-2
0
2
4
6
8
-30-25-20-15-10-5051015202530
to[1
]
t[1]
130509_1HNMR_Treg_IQI&BALB_CRB for Loading and S-plot.M5 (OPLS/O2PLS-DA), L, H: Part[Comp. 1]/to[XSide Comp. 1]Colored according to classes in M5
R2X[1] = 0.667384 R2X[XSide Comp. 1] = 0.124008 Ellipse: Hotelling T2 (0.95)
LH
SIMCA-P+ 12.0.1 - 2013-05-20 12:02:08 (UTC+9)
LFD HFD
PredicUve component
- - - - - -
Ort
hogo
nal c
ompo
nent
1
-
-
-
-
SUPPLEMENTARY INFORMATION
8 | W W W. N A T U R E . C O M / N A T U R E
RESEARCH
0
10
20
30
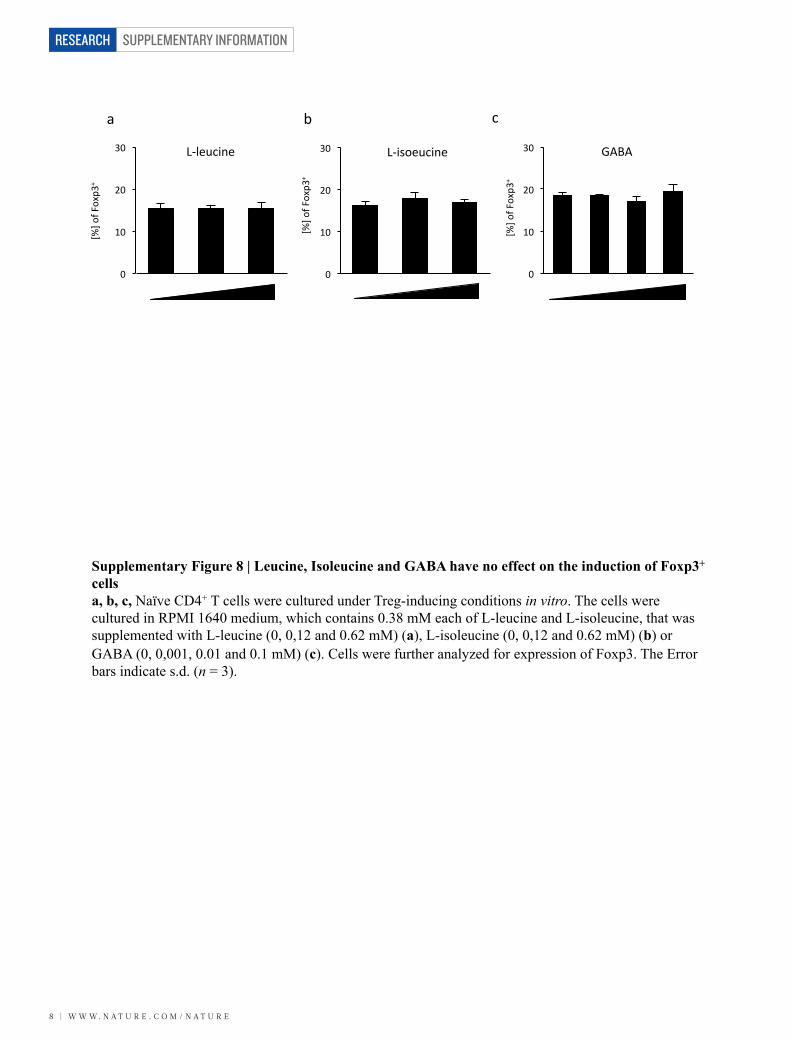
Supplementary Figure 8 | Leucine, Isoleucine and GABA have no effect on the induction of Foxp3+ cells a, b, c, Naïve CD4+ T cells were cultured under Treg-inducing conditions in vitro. The cells were cultured in RPMI 1640 medium, which contains 0.38 mM each of L-leucine and L-isoleucine, that was supplemented with L-leucine (0, 0,12 and 0.62 mM) (a), L-isoleucine (0, 0,12 and 0.62 mM) (b) or GABA (0, 0,001, 0.01 and 0.1 mM) (c). Cells were further analyzed for expression of Foxp3. The Error bars indicate s.d. (n = 3).
0
10
20
30
[%] o
f Fox
p3+
a b c
[%] o
f Fox
p3+
0
10
20
30
[%] o
f Fox
p3+
L-‐leucine L-‐isoeucine GABA
W W W. N A T U R E . C O M / N A T U R E | 9
SUPPLEMENTARY INFORMATION RESEARCH
Tota
l num
ber o
f Fo
xp3+ c
ells
CD4
Foxp
3
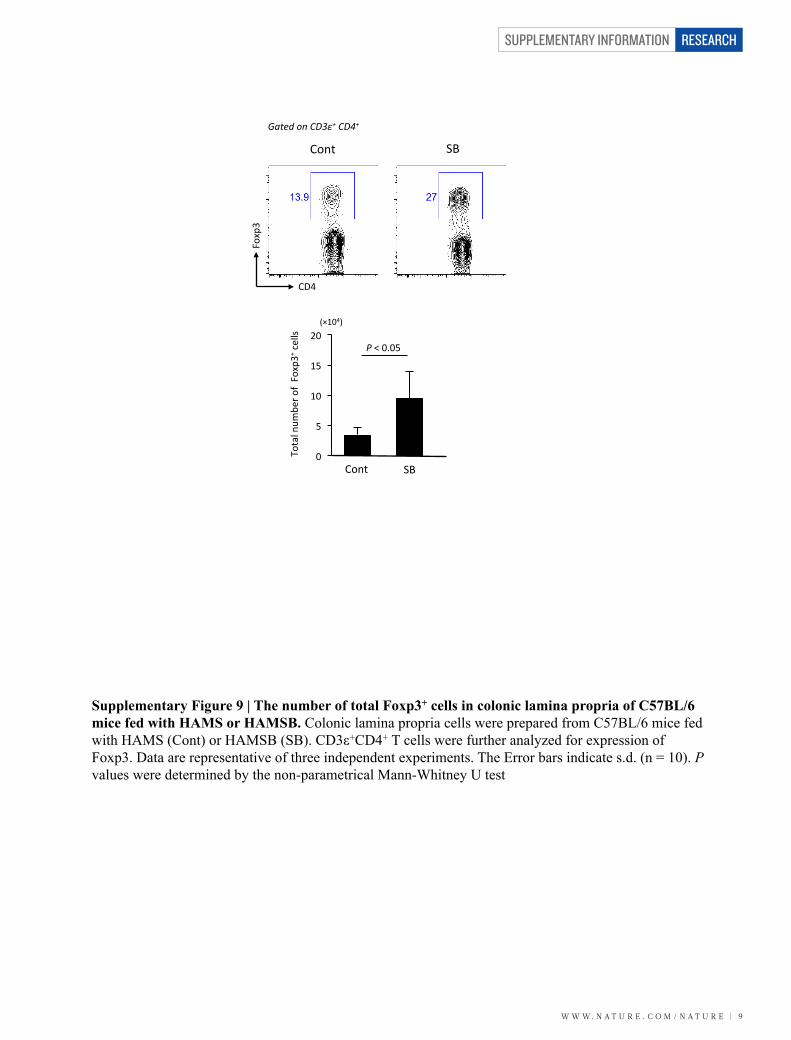
Supplementary Figure 9 | The number of total Foxp3+ cells in colonic lamina propria of C57BL/6 mice fed with HAMS or HAMSB. Colonic lamina propria cells were prepared from C57BL/6 mice fed with HAMS (Cont) or HAMSB (SB). CD3ε+CD4+ T cells were further analyzed for expression of Foxp3. Data are representative of three independent experiments. The Error bars indicate s.d. (n = 10). P values were determined by the non-parametrical Mann-Whitney U test
0
5
10
15
20 (×104)
P < 0.05
Cont SB
Cont SB
Gated on CD3ε+ CD4+
SUPPLEMENTARY INFORMATION
1 0 | W W W. N A T U R E . C O M / N A T U R E
RESEARCH
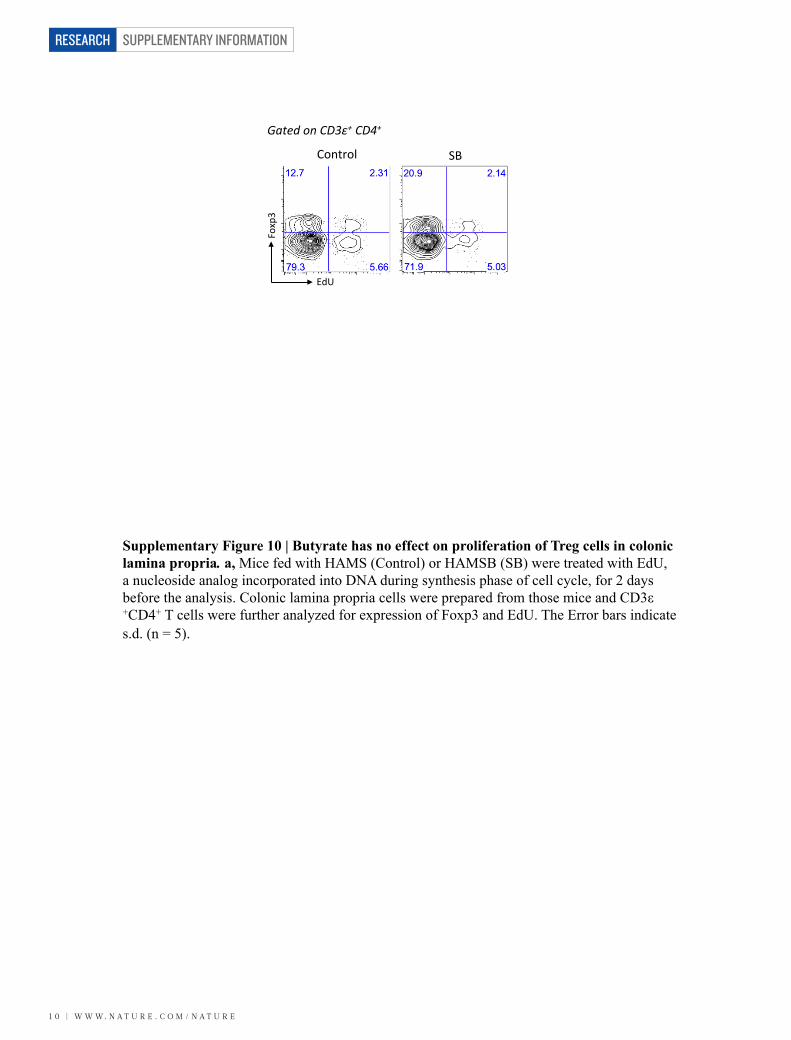
Supplementary Figure 10 | Butyrate has no effect on proliferation of Treg cells in colonic lamina propria. a, Mice fed with HAMS (Control) or HAMSB (SB) were treated with EdU, a nucleoside analog incorporated into DNA during synthesis phase of cell cycle, for 2 days before the analysis. Colonic lamina propria cells were prepared from those mice and CD3ε+CD4+ T cells were further analyzed for expression of Foxp3 and EdU. The Error bars indicate s.d. (n = 5).
Control
EdU Fo
xp3
SB
Gated on CD3ε+ CD4+
W W W. N A T U R E . C O M / N A T U R E | 1 1
SUPPLEMENTARY INFORMATION RESEARCH
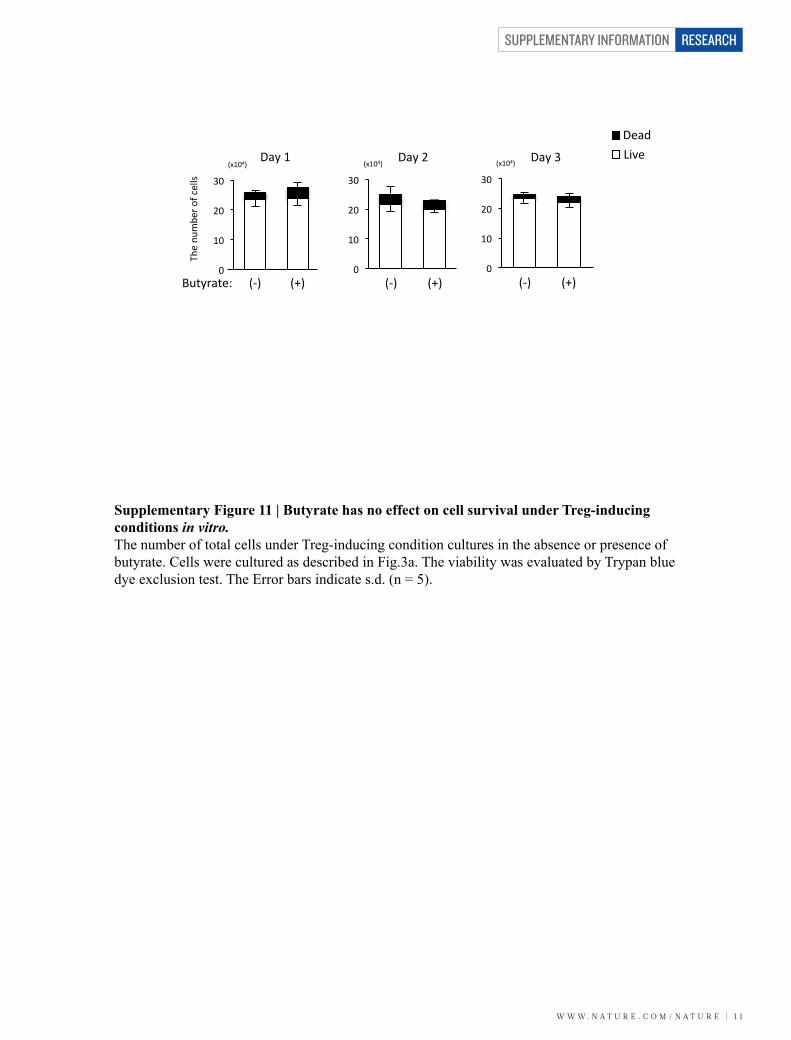
Supplementary Figure 11 | Butyrate has no effect on cell survival under Treg-inducing conditions in vitro. The number of total cells under Treg-inducing condition cultures in the absence or presence of butyrate. Cells were cultured as described in Fig.3a. The viability was evaluated by Trypan blue dye exclusion test. The Error bars indicate s.d. (n = 5).
Day 1 Day 2 Day 3 Live Dead
0
10
20
30 Th
e nu
mbe
r of c
ells
0
10
20
30
0
10
20
30 (x104) (x104) (x104)
(-‐) (+) Butyrate: (-‐) (+) (-‐) (+)
SUPPLEMENTARY INFORMATION
1 2 | W W W. N A T U R E . C O M / N A T U R E
RESEARCH
0
2
4
6
8
10
Tota
l num
ber o
f N
euro
pilin
1-‐ T
reg
cells
Tota
l num
ber o
f H
elio
s-‐ T
reg
cells
0
1
2
3
4
5
Neuropilin1
Foxp
3
Helios
Foxp
3 P < 0.05
P < 0.05
Cecal SCFA Fecal SCFA
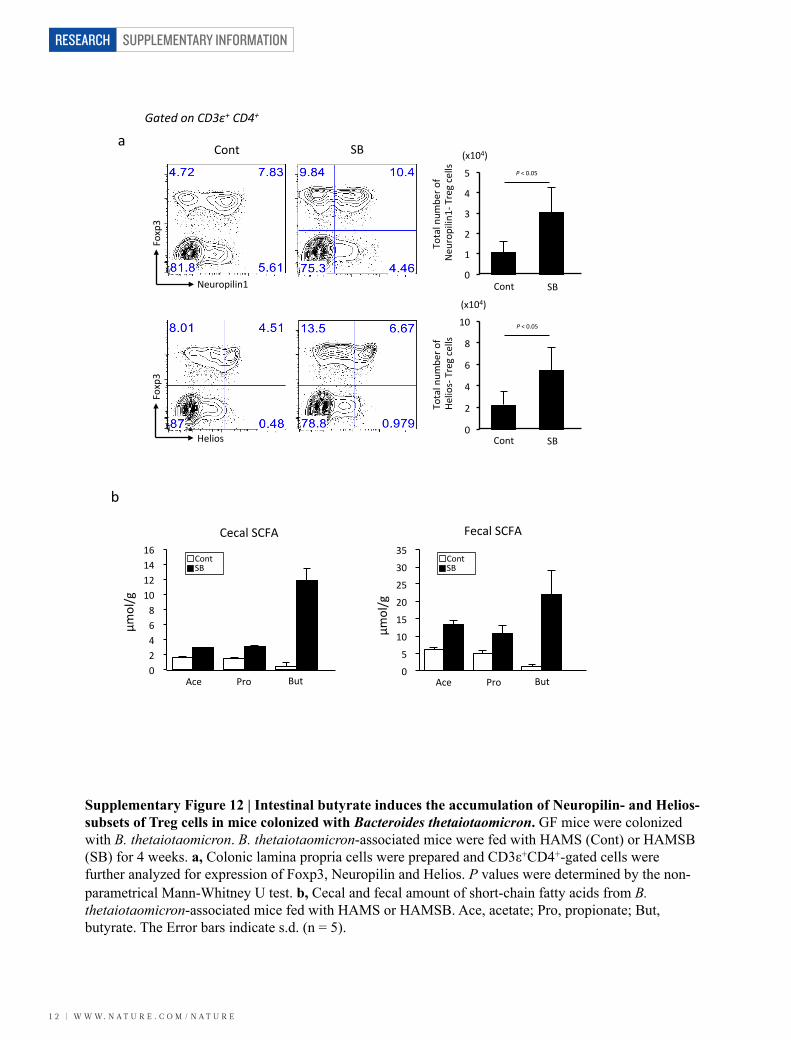
Supplementary Figure 12 | Intestinal butyrate induces the accumulation of Neuropilin- and Helios- subsets of Treg cells in mice colonized with Bacteroides thetaiotaomicron. GF mice were colonized with B. thetaiotaomicron. B. thetaiotaomicron-associated mice were fed with HAMS (Cont) or HAMSB (SB) for 4 weeks. a, Colonic lamina propria cells were prepared and CD3ε+CD4+-gated cells were further analyzed for expression of Foxp3, Neuropilin and Helios. P values were determined by the non-parametrical Mann-Whitney U test. b, Cecal and fecal amount of short-chain fatty acids from B. thetaiotaomicron-associated mice fed with HAMS or HAMSB. Ace, acetate; Pro, propionate; But, butyrate. The Error bars indicate s.d. (n = 5).
a
b
0 2 4 6 8
10 12 14 16
µmol
/g
0
5
10
15
20
25
30
35
µmol
/g
(x104)
(x104)
Cont SB
Gated on CD3ε+ CD4+
Cont SB
Cont SB
Cont SB
Ace Pro But Ace Pro But
Cont SB
W W W. N A T U R E . C O M / N A T U R E | 1 3
SUPPLEMENTARY INFORMATION RESEARCH
CD4 Fo
xp3
Cont SB
0 5
10 15 20 25 30
0
5
10
15
20 (x104)
Tota
l num
ber o
f Fox
p3+
cells
Gated on CD3ε+ CD4+
[%] o
f Fox
p3+
n.s. n.s.
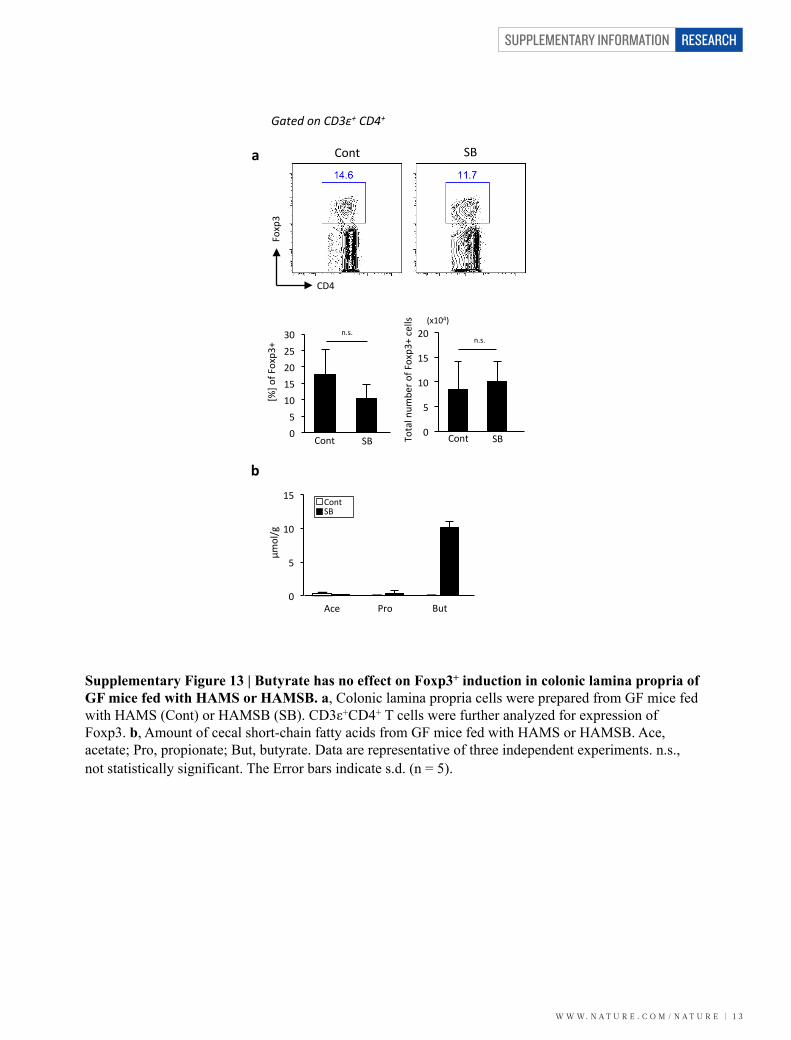
Supplementary Figure 13 | Butyrate has no effect on Foxp3+ induction in colonic lamina propria of GF mice fed with HAMS or HAMSB. a, Colonic lamina propria cells were prepared from GF mice fed with HAMS (Cont) or HAMSB (SB). CD3ε+CD4+ T cells were further analyzed for expression of Foxp3. b, Amount of cecal short-chain fatty acids from GF mice fed with HAMS or HAMSB. Ace, acetate; Pro, propionate; But, butyrate. Data are representative of three independent experiments. n.s., not statistically significant. The Error bars indicate s.d. (n = 5).
Cont SB Cont SB
a
b
0
5
10
15
µmol
/g
Ace Pro But
Cont SB
SUPPLEMENTARY INFORMATION
1 4 | W W W. N A T U R E . C O M / N A T U R E
RESEARCH
0
5
10
15
20
CD4
GATA
3
CD4
RORγ
t
CD4
T-‐be
t
[%] o
f GAT
A3+
cel
ls
Tota
l num
ber o
f G
ATA3
+ c
ells
[%] o
f RO
Rγt+
cel
ls
Tota
l num
ber o
f R
ORγ
t+ c
ells
[%] o
f T-‐b
et+
cel
ls
Tota
l num
ber o
f T
-‐bet
+ ce
lls
0
5
10
15
20
25
30
35
0
2
4
6
8
0
10
20
30
0
1
2
3
4
0
1
2
3
4
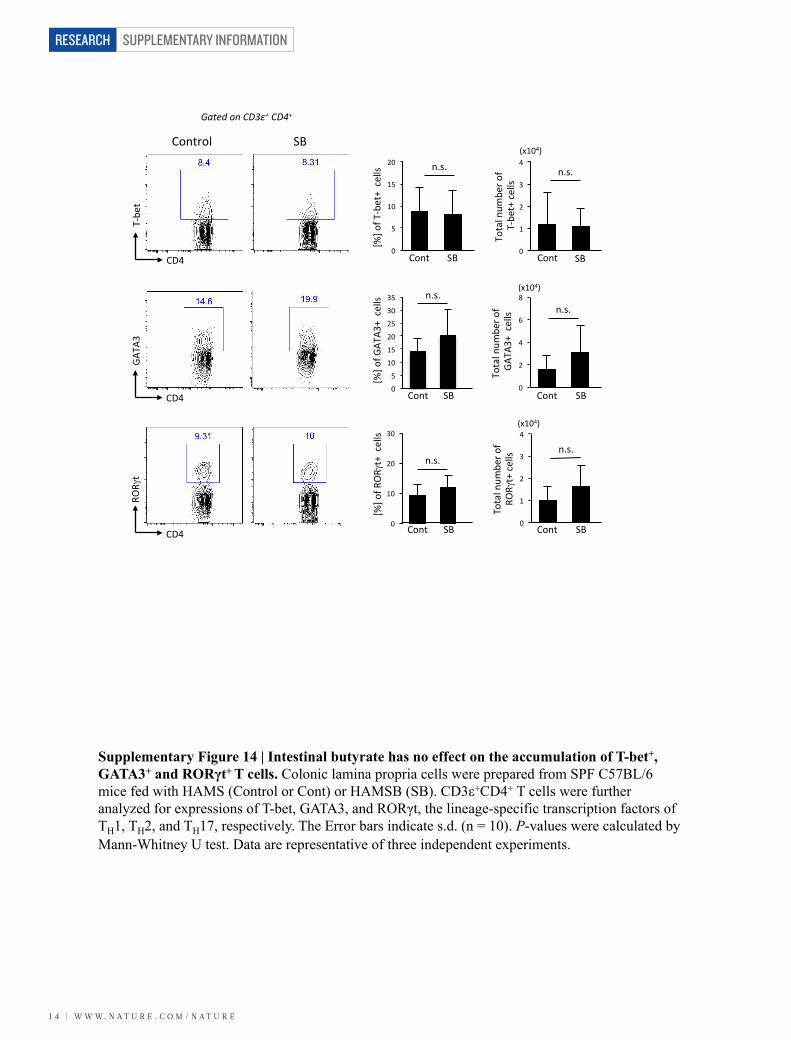
Supplementary Figure 14 | Intestinal butyrate has no effect on the accumulation of T-bet+, GATA3+ and RORγt+ T cells. Colonic lamina propria cells were prepared from SPF C57BL/6 mice fed with HAMS (Control or Cont) or HAMSB (SB). CD3ε+CD4+ T cells were further analyzed for expressions of T-bet, GATA3, and RORγt, the lineage-specific transcription factors of TH1, TH2, and TH17, respectively. The Error bars indicate s.d. (n = 10). P-values were calculated by Mann-Whitney U test. Data are representative of three independent experiments.
(x104)
(x104)
(x104) SB Control
Gated on CD3ε+ CD4+
SB Cont SB Cont
SB Cont SB Cont
SB Cont SB Cont
n.s.
n.s.
n.s.
n.s.
n.s.
n.s.
W W W. N A T U R E . C O M / N A T U R E | 1 5
SUPPLEMENTARY INFORMATION RESEARCH
0
10
20
30
40
0
20
40
60
80
0
10
20
30
40
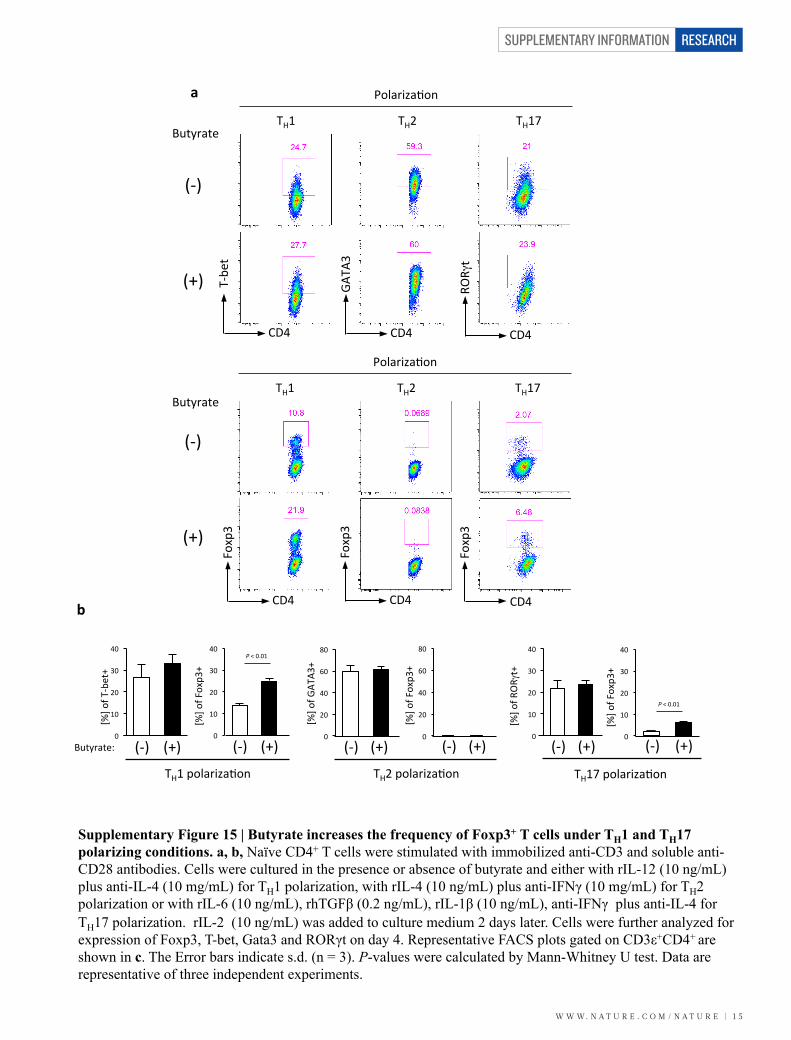
Supplementary Figure 15 | Butyrate increases the frequency of Foxp3+ T cells under TH1 and TH17 polarizing conditions. a, b, Naïve CD4+ T cells were stimulated with immobilized anti-CD3 and soluble anti-CD28 antibodies. Cells were cultured in the presence or absence of butyrate and either with rIL-12 (10 ng/mL) plus anti-IL-4 (10 mg/mL) for TH1 polarization, with rIL-4 (10 ng/mL) plus anti-IFNγ (10 mg/mL) for TH2 polarization or with rIL-6 (10 ng/mL), rhTGFβ (0.2 ng/mL), rIL-1β (10 ng/mL), anti-IFNγ plus anti-IL-4 for TH17 polarization. rIL-2 (10 ng/mL) was added to culture medium 2 days later. Cells were further analyzed for expression of Foxp3, T-bet, Gata3 and RORγt on day 4. Representative FACS plots gated on CD3ε+CD4+ are shown in c. The Error bars indicate s.d. (n = 3). P-values were calculated by Mann-Whitney U test. Data are representative of three independent experiments.
0
20
40
60
80
0
10
20
30
40
0
10
20
30
40
[%] o
f T-‐b
et+
TH1 polarizaUon TH2 polarizaUon TH17 polarizaUon
P < 0.01
a
b
(-‐) (+) (-‐) (+) (-‐) (+) (-‐) (+) (-‐) (+) (-‐) (+)
CD4
Foxp
3
CD4
Foxp
3
CD4
Foxp
3
TH1 TH2 TH17
CD4
RORγ
t
CD4 GA
TA3
CD4
T-‐be
t
(-‐)
(+)
PolarizaUon
TH1 TH2 TH17
PolarizaUon
(-‐)
(+)
[%] o
f Fox
p3+
[%] o
f Fox
p3+
[%] o
f Fox
p3+
[%] o
f GAT
A3+
[%] o
f RO
Rγt+
Butyrate
Butyrate
P < 0.01
Butyrate:
SUPPLEMENTARY INFORMATION
1 6 | W W W. N A T U R E . C O M / N A T U R E
RESEARCH
0
10
20
30
40
Helios Fo
xp3
[%] o
f Hel
ios-
Fox
p3+
cells
P < 0.05
Cont SB
Cont SB
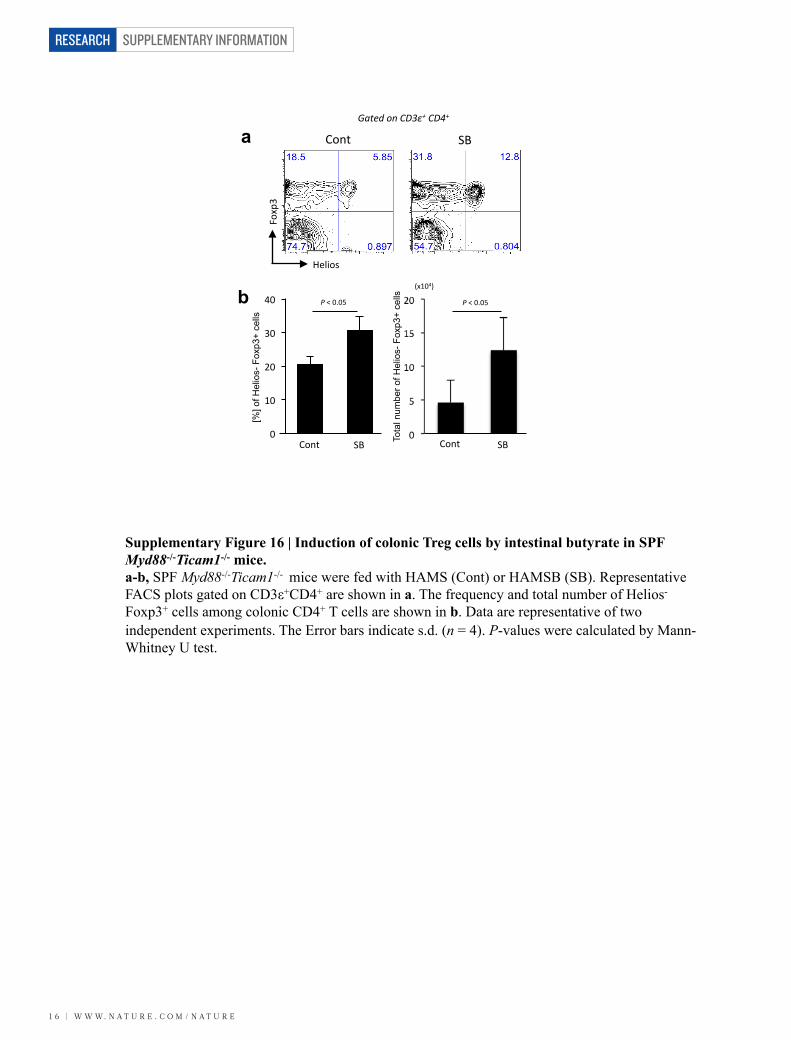
Supplementary Figure 16 | Induction of colonic Treg cells by intestinal butyrate in SPF Myd88-/-Ticam1-/- mice. a-b, SPF Myd88-/-Ticam1-/- mice were fed with HAMS (Cont) or HAMSB (SB). Representative FACS plots gated on CD3ε+CD4+ are shown in a. The frequency and total number of Helios-
Foxp3+ cells among colonic CD4+ T cells are shown in b. Data are representative of two independent experiments. The Error bars indicate s.d. (n = 4). P-values were calculated by Mann-Whitney U test.
a
b
Gated on CD3ε+ CD4+
(x104)
Tota
l num
ber o
f Hel
ios-
Fox
p3+
cells
Cont SB
P < 0.05
0
10
20
30
40
Helios
Foxp
3
[%] o
f Hel
ios-
Fox
p3+
cells
P < 0.05
Cont SB
Cont SB
Supplementary Figure 16 | Induction of colonic Treg cells by intestinal butyrate in SPF Myd88-/-Ticam1-/- mice. a-b, SPF Myd88-/-Ticam1-/- mice were fed with HAMS (Cont) or HAMSB (SB). Representative FACS plots gated on CD3ε+CD4+ are shown in a. The frequency and total number of Helios-
Foxp3+ cells among colonic CD4+ T cells are shown in b. Data are representative of two independent experiments. The Error bars indicate s.d. (n = 4). P-values were calculated by Mann-Whitney U test.
a
b
Gated on CD3ε+ CD4+
(x104)
Tota
l num
ber o
f Hel
ios-
Fox
p3+
cells
Cont SB
P < 0.05
W W W. N A T U R E . C O M / N A T U R E | 1 7
SUPPLEMENTARY INFORMATION RESEARCH
b
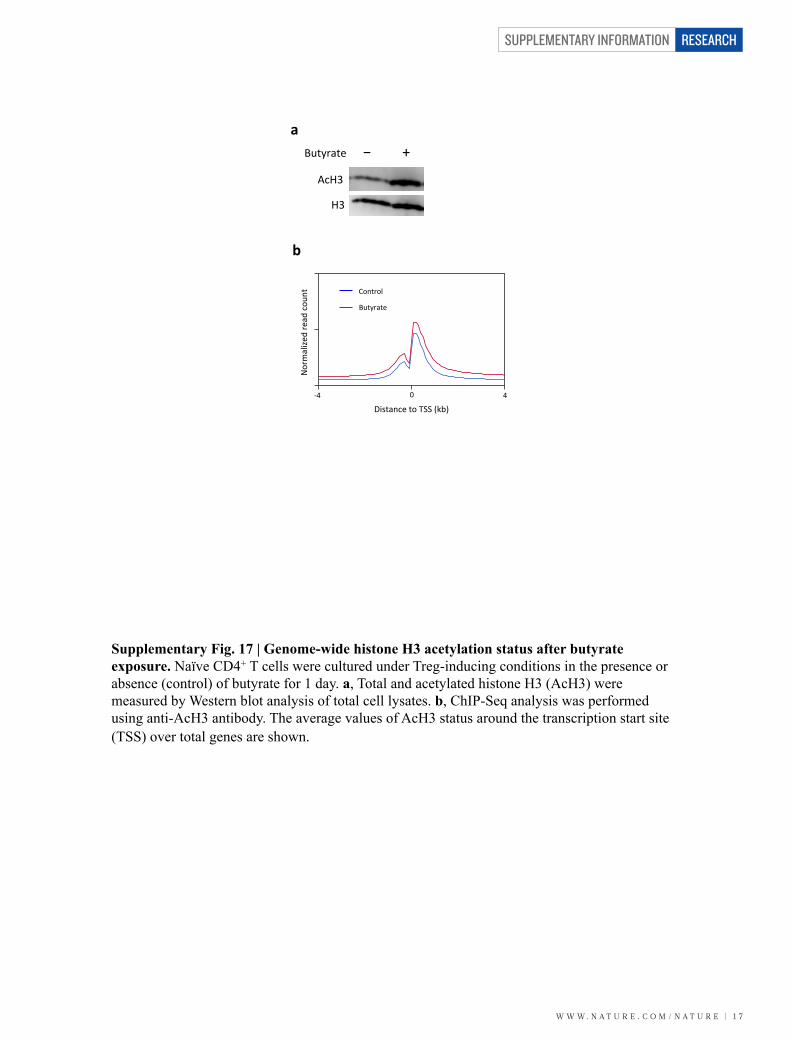
Supplementary Fig. 17 | Genome-wide histone H3 acetylation status after butyrate exposure. Naïve CD4+ T cells were cultured under Treg-inducing conditions in the presence or absence (control) of butyrate for 1 day. a, Total and acetylated histone H3 (AcH3) were measured by Western blot analysis of total cell lysates. b, ChIP-Seq analysis was performed using anti-AcH3 antibody. The average values of AcH3 status around the transcription start site (TSS) over total genes are shown.
a
AcH3
H3
Butyrate − +
Distance to TSS (kb)
-4 0 4
Nor
mal
ized
read
cou
nt
Butyrate day 1Control day 1
Genic region
Transposon-like repeats
B1
0 100 0 55 0
Relative position (%)
Nor
mal
ized
read
s
0 100 0 55 0
Relative position (%)
Nor
mal
ized
read
s
0 100 0 55 0
Relative position (%)
Nor
mal
ized
read
s
0 100 0 55 0
Relative position (%)
Nor
mal
ized
read
s
Nor
mal
ized
read
cou
nt
Distance to TSS (kb)
0 4 -‐4
Control
Butyrate
SUPPLEMENTARY INFORMATION
1 8 | W W W. N A T U R E . C O M / N A T U R E
RESEARCH
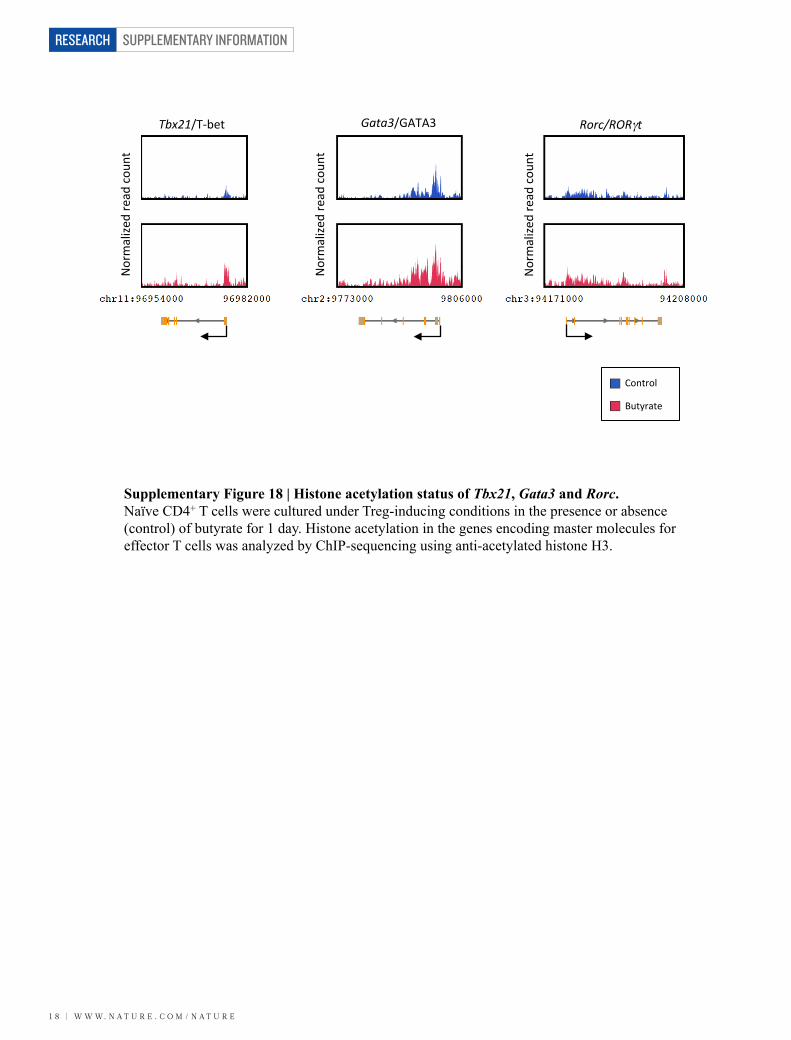
Supplementary Figure 18 | Histone acetylation status of Tbx21, Gata3 and Rorc. Naïve CD4+ T cells were cultured under Treg-inducing conditions in the presence or absence (control) of butyrate for 1 day. Histone acetylation in the genes encoding master molecules for effector T cells was analyzed by ChIP-sequencing using anti-acetylated histone H3.
Tbx21/T-‐bet Gata3/GATA3 Rorc/RORγt
Control
Butyrate
Nor
mal
ized
read
cou
nt
Nor
mal
ized
read
cou
nt
Nor
mal
ized
read
cou
nt
W W W. N A T U R E . C O M / N A T U R E | 1 9
SUPPLEMENTARY INFORMATION RESEARCH
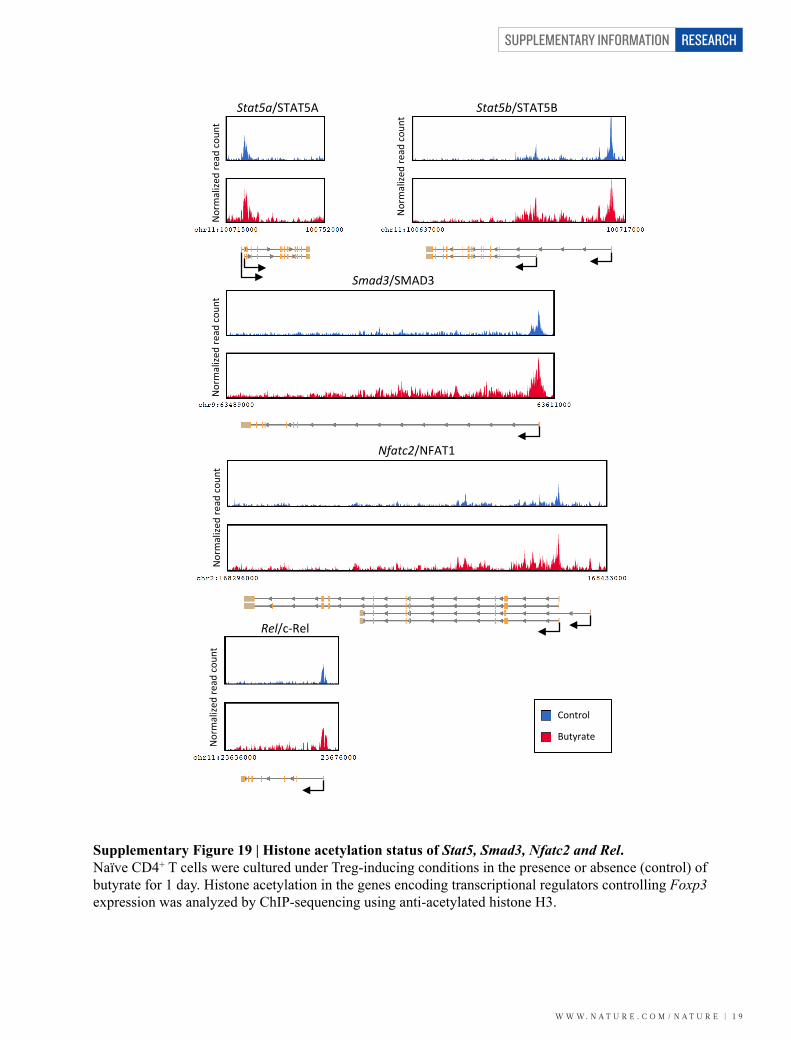
Supplementary Figure 19 | Histone acetylation status of Stat5, Smad3, Nfatc2 and Rel. Naïve CD4+ T cells were cultured under Treg-inducing conditions in the presence or absence (control) of butyrate for 1 day. Histone acetylation in the genes encoding transcriptional regulators controlling Foxp3 expression was analyzed by ChIP-sequencing using anti-acetylated histone H3.
Control
Butyrate
Stat5a/STAT5A Stat5b/STAT5B
Smad3/SMAD3
Nfatc2/NFAT1
Rel/c-‐Rel
Nor
mal
ized
read
cou
nt
Nor
mal
ized
read
cou
nt
Nor
mal
ized
read
cou
nt
Nor
mal
ized
read
cou
nt
Nor
mal
ized
read
cou
nt
SUPPLEMENTARY INFORMATION
2 0 | W W W. N A T U R E . C O M / N A T U R E
RESEARCH
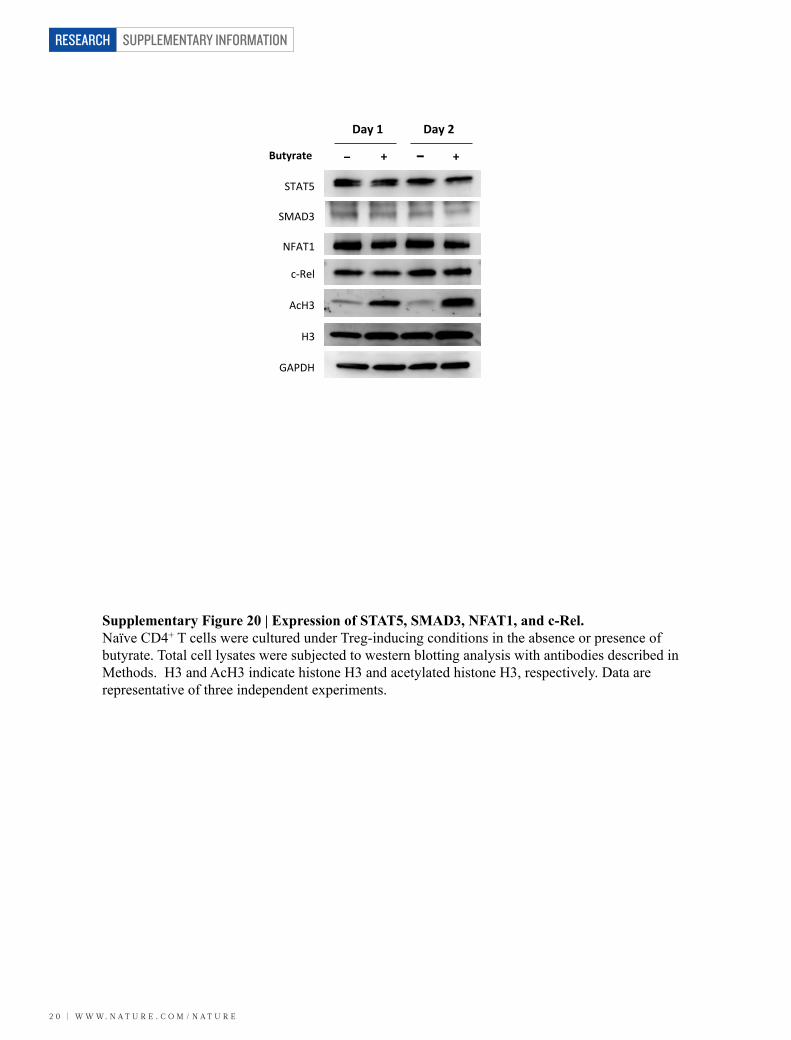
Supplementary Figure 20 | Expression of STAT5, SMAD3, NFAT1, and c-Rel. Naïve CD4+ T cells were cultured under Treg-inducing conditions in the absence or presence of butyrate. Total cell lysates were subjected to western blotting analysis with antibodies described in Methods. H3 and AcH3 indicate histone H3 and acetylated histone H3, respectively. Data are representative of three independent experiments.
STAT5
SMAD3
NFAT1
c-‐Rel
AcH3
H3
GAPDH
Day 1 Day 2
Butyrate − + − +
W W W. N A T U R E . C O M / N A T U R E | 2 1
SUPPLEMENTARY INFORMATION RESEARCH
90
95
100
105
110
115
0 1 2 3 4 5 6 7 8
Control SA SP SB
Body
wei
ght c
hang
e (%
)
Post transfer (week)
0
5
10
15
20 Control SA SP SB
Ace Pro But
µmol
/g fe
ces
a b
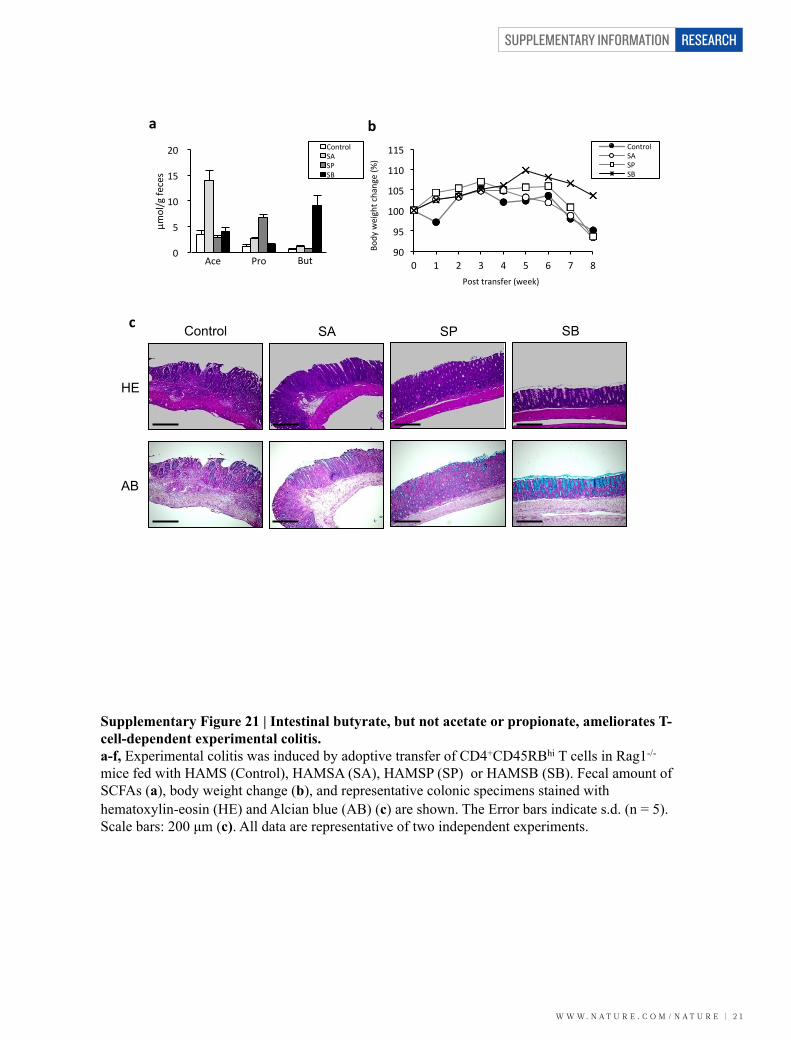
Supplementary Figure 21 | Intestinal butyrate, but not acetate or propionate, ameliorates T-cell-dependent experimental colitis. a-f, Experimental colitis was induced by adoptive transfer of CD4+CD45RBhi T cells in Rag1-/- mice fed with HAMS (Control), HAMSA (SA), HAMSP (SP) or HAMSB (SB). Fecal amount of SCFAs (a), body weight change (b), and representative colonic specimens stained with hematoxylin-eosin (HE) and Alcian blue (AB) (c) are shown. The Error bars indicate s.d. (n = 5). Scale bars: 200 µm (c). All data are representative of two independent experiments.
HE
AB
Control SA SP SB c
SUPPLEMENTARY INFORMATION
2 2 | W W W. N A T U R E . C O M / N A T U R E
RESEARCH
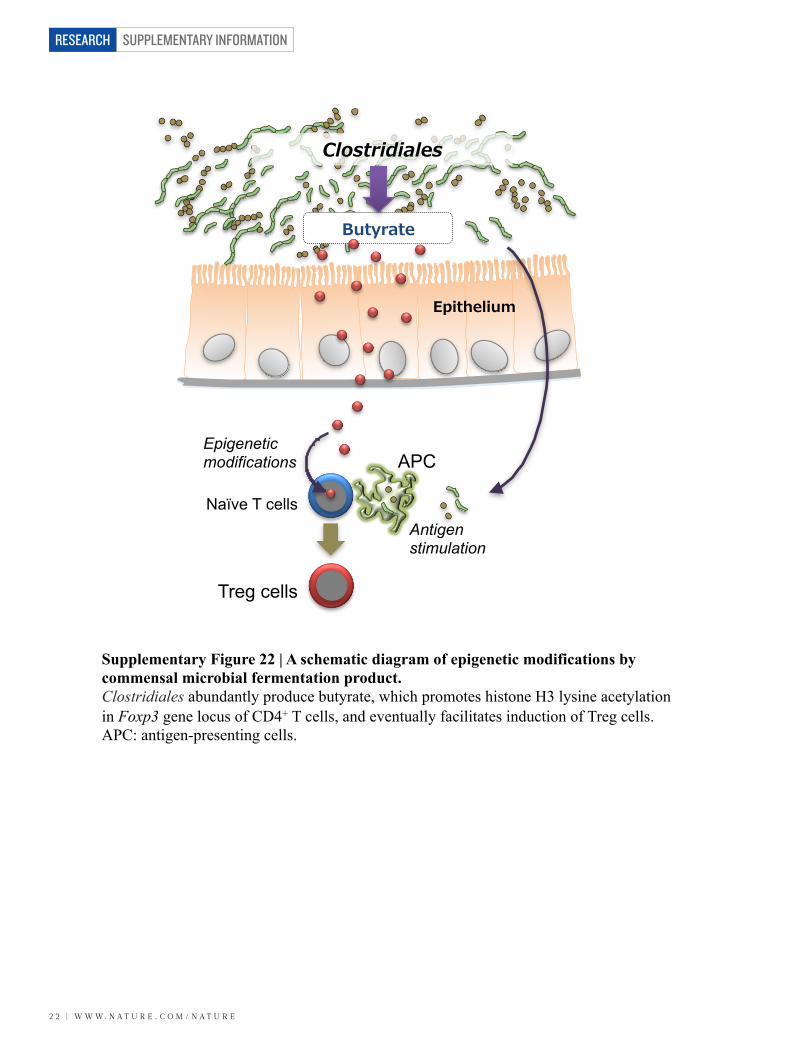
Naïve T cells
Treg cells
APC
Antigen stimulation
Epigenetic modifications
Supplementary Figure 22 | A schematic diagram of epigenetic modifications by commensal microbial fermentation product. Clostridiales abundantly produce butyrate, which promotes histone H3 lysine acetylation in Foxp3 gene locus of CD4+ T cells, and eventually facilitates induction of Treg cells. APC: antigen-presenting cells.
W W W. N A T U R E . C O M / N A T U R E | 2 3
SUPPLEMENTARY INFORMATION RESEARCH