supplementary information - media.nature.com · supplementary information. doi: 10.1038/nchem.1411....
TRANSCRIPT
NATURE CHEMISTRY | www.nature.com/naturechemistry 1
SUPPLEMENTARY INFORMATIONDOI: 10.1038/NCHEM.1411
1
SUPPLEMENTARY INFORMATION TO:
In situ surface coverage analysis of RuO2-catalysed HCl oxidation reveals
the entropic origin of compensation in heterogeneous catalysis
Detre Teschner1,2*, Gerard Novell-Leruth3, Ramzi Farra1, Axel Knop-Gericke1, Robert Schlögl1,
László Szentmiklósi2, Miguel González Hevia3, Hary Soerijanto4, Reinhard Schomäcker4, Javier
Pérez-Ramírez5, and Núria López3*
1Fritz-Haber Institute of the Max Planck Society, Berlin, D-14195, Germany
2Centre for Energy Research, Hungarian Academy of Sciences, Budapest, H-1525, Hungary 3Institute of Chemical Research of Catalonia (ICIQ), Av. Països Catalans 16, 43007 Tarragona, Spain
4Department of Chemistry, Technical University of Berlin, Berlin, D-10623, Germany 5Institute for Chemical and Bioengineering, Department of Chemistry and Applied Biosciences,
ETH Zurich, Wolfgang-Pauli-Strasse 10, CH-8093 Zurich, Switzerland
*To whom correspondence should be addressed. E-mail: [email protected]; [email protected]
Table of Contents
1. Catalytic HCl oxidation in a flow reactor
2. Details to Temporal Analysis of Products
3. Details to in situ PGAA
4. DFT details
5. Analysis of model systems
6. Rate analysis of Deacon reaction
7. Supplementary Tables
8. Supplementary Figures
© 2012 Macmillan Publishers Limited. All rights reserved.
NATURE CHEMISTRY | www.nature.com/naturechemistry 2
SUPPLEMENTARY INFORMATIONDOI: 10.1038/NCHEM.1411
2
1. Section: Catalytic HCl oxidation in a flow reactor
Catalytic HCl oxidation on industrial RuO2/SnO2-Al2O3 catalysts has been performed in order to derive a Constable-
Cramer relation. This catalyst enables long-term stable catalytic performance necessary to generate reliable data.
Details to this material can be found in Ref. [1] and [2]. The catalyst was first powdered by ball milling and diluted
with a fivefold amount of SnO2 support material. Water was added to the powder mixture and then it was dried at
353 K. A sieve fraction of 0.2–0.45 mm-sized particles was prepared, and 1 g of it was diluted with 4 g glass beads
and mixed well in order to minimize the occurrence of hot spots in the reactor. An atmospheric pressure flow reactor
was fed with a range of reactant gas mixtures by using mass flow controllers, and Cl2 formation was detected by
iodometric titration. The catalytic tube reactor was made of quartz with 8 mm inner diameter. Various reaction feed
compositions (O2:HCl:N2:Cl2:H2O) with a total flow of 80 cm3 min-1 were used and with each of the reaction feed an
Arrhenius experiment was carried out in the T range of 523-644 K. With a repeated reference experiment at O2:
HCl:N2:Cl2:H2O = 40:10:30:-:- (in cm3 min-1) the reactivity was confirmed to be stable. All reactivity data is
referenced to this feed at 523 K. By calculating the Knudsen diffusion coefficient and the Wheeler–Weisz modulus,
it was verified that the reaction was not limited by intraparticle diffusion.
2. Section: Details to Temporal Analysis of Products
Temporary Analysis of Products (TAP) is a transient technique time-resolved in the sub-millisecond range, in which
the gases are fed by narrow pulses to an evacuated reactor, and the responses are monitored directly at the outlet by
mass spectrometry. The effect of oxygen coverage on HCl oxidation over RuO2 (Aldrich, 99.9%) was studied using
a TAP-2 reactor.3,4 The as-received sample was calcined in static air at 773 K for 5 h, using a heating ramp of
10 K min-1. ca. 10 mg of RuO2 particles (0.2-0.3 mm) was packed in the isothermal (central) zone of a quartz micro-
reactor (4.6 mm i.d., 70 mm long), between two layers of quartz particles of the same sieve fraction. The thickness
of the catalyst zone (0.9-1.2 mm) was very small compared to the overall length of the bed (71 mm). This
configuration, referred to as thin-zone reactor, is characterized by negligible gas concentration gradients across the
catalyst bed.5 The sample was pretreated in 20 cm3 STP min−1 of O2 at 623 K followed by evaluation to 10-6 Pa.
Subsequently, 1000 pulses of a mixture of Kr:HCl = 1:2 were dosed in order to ensure chlorine surface saturation of
the sample in the subsequent experiments. The pulse size used was ca. 10 nmol, which allows working in the
Knudsen diffusion regime. It was verified that the shape of the O2 response is unaffected by pulse size in this range,
© 2012 Macmillan Publishers Limited. All rights reserved.
NATURE CHEMISTRY | www.nature.com/naturechemistry 3
SUPPLEMENTARY INFORMATIONDOI: 10.1038/NCHEM.1411
3
which is necessary for the oxygen coverage calculations, and indicates that the experiments were carried out, indeed,
in the Knudsen diffusion regime. In this regime, purely heterogeneous steps of activation of molecules on the
catalyst surface are taken into account, since any collision of molecules in the gas phase is minimized. Two types of
experiments were carried out at 623 K:
(a) Pulses of Ar:O2 = 1:2 over RuO2 and blank (reactor entirely loaded with quartz). These experiments were
performed to determine the oxygen adsorbed on RuO2 as a function of time after pulse injection. The
determination is based on comparing the area-normalized responses over quartz (only diffusion) and RuO2
(diffusion+adsorption).
(b) Pump-probe experiments were carried out, consisting in pulsing Ar:O2 = 1:2 (pump) followed by Kr:HCl = 1:2
(probe), separated by a time delay ( ) between 1 and 8 s. A new cycle starts 20 s after having pulsed HCl. The
area of the Cl2 response was monitored for the different time delay used.
The gases used were Kr (Linde, 5.0), Ar (Linde, 5.0), O2 (Air Products, 5.2), and HCl (Praxair, 2.5). A quadrupole
mass spectrometer (RGA 300, Stanford Research Systems) monitored the transient responses at the reactor outlet of
the following atomic mass units (AMUs): 84 (Kr), 70 (Cl2), 40 (Ar), 36 (HCl), and 32 (O2). Responses were
averaged over ten pulses per AMU in order to improve the signal-to-noise ratio. Prior to that, it was checked that the
responses were stable, that is, with invariable intensity and shape during an interval of 20 pulses.
3. Section: Details to in situ PGAA
In situ Prompt Gamma Activation Analysis (PGAA) is a technique recently implemented for studying catalysts in
action.6 It is based on the radiative neutron capture of nuclei, enabling the quantification of most elements in the
investigated volume, in our case, inside a Deacon micro-reactor. PGAA at atmospheric pressure condition was
carried out at the cold neutron beam of the Budapest Neutron Centre. For the experiments, a quartz tube reactor was
placed into the neutron beam, and the reactor tube was surrounded by a specially designed oven having openings for
the incoming and outgoing neutrons and for the emitted gamma rays. These openings are covered by thin aluminium
foils for decreasing heat losses. 0.5 g of RuO2 (Aldrich, calcined at 773 K for 5 h) with the sieve fraction of 0.1-0.2
mm was loaded into the reactor. Various gas feeds, at constant 166.7 cm3 min−1 total flow, were supplied by mass
flow controllers. Chlorine (4.0), HCl (4.5), oxygen (5.0) and nitrogen (5.0) were used. The Deacon feed composition
was varied between O2:HCl:N2 = 0.25:1:3.75 and 4:1:0, and the reaction was monitored by iodometric titration. The
© 2012 Macmillan Publishers Limited. All rights reserved.
NATURE CHEMISTRY | www.nature.com/naturechemistry 4
SUPPLEMENTARY INFORMATIONDOI: 10.1038/NCHEM.1411
4
reaction temperature was set to 503 and 543 K for the p(O2) dependent Deacon experiments. At each temperature,
the p(O2) dependent series was performed after an initial HCl treatment at the same temperature to saturate the
catalyst surface with chlorine and thus decrease the time needed to reach steady state for the individual
measurements. A Compton-suppressed high-purity germanium crystal was used to detect the prompt-gamma
photons. Molar ratios (Cl/Ru) were determined from the characteristic peak areas corrected by the detector
efficiency and the nuclear data of the observed elements.7
4. Section: DFT details
Density Functional Theory (DFT) applied to slab of RuO2(110) was employed through the VASP code8,9 to
determine the thermodynamic and kinetic parameters for HCl oxidation. The exchange-correlation functional was
RPBE10 and the inner electrons were replaced by PAW11 while monoelectronic valence states were expanded in
plane waves with a cutoff energy of 400 eV. The total thickness of RuO2(110) slab corresponds to three layers
where the upper layers were relaxed in all directions. Transition states were located through the climbing-image
version of the Nudged Elastic Band method12 and were fully characterized by the corresponding frequency analysis.
5. Section: Analysis of model systems
A model reaction mechanism for the reaction (1/2A2+B ↔ AB) can be as follows.
½( A2+2*↔ A2**) (R1)
½( A2**↔ 2A*) (R2)
B+*↔ B* (R3)
A*+B*↔ AB*+* (R4)
AB*↔ AB+* (R5)
Where and are the corresponding reaction constant and kinetic coefficient for reaction for the
kinetic coefficients positive signs indicate forward reactions and negative backwards reactions. The global reaction
constant can be written as . The degree of approach to the equilibrium can be defined as
where
is the pressure for reactants and products and =1bar.
If the reaction follows the Arrhenius equation then it can be written as:
© 2012 Macmillan Publishers Limited. All rights reserved.
NATURE CHEMISTRY | www.nature.com/naturechemistry 5
SUPPLEMENTARY INFORMATIONDOI: 10.1038/NCHEM.1411
5
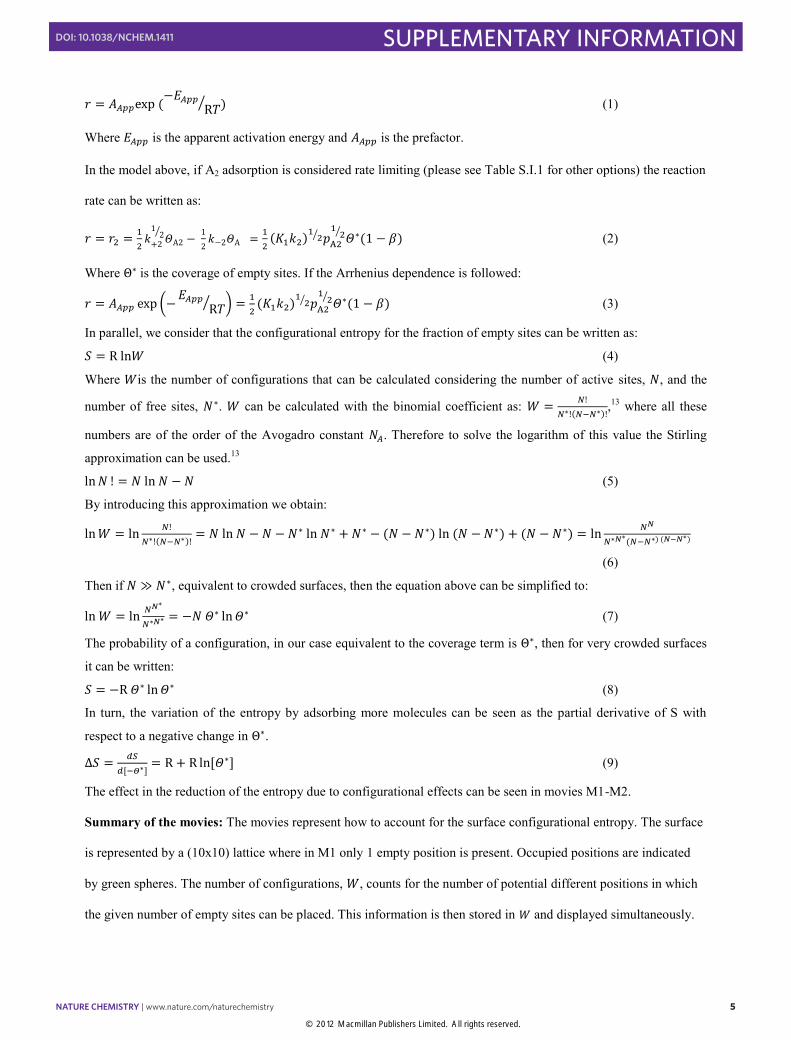
(1)
Where is the apparent activation energy and is the prefactor.
In the model above, if A2 adsorption is considered rate limiting (please see Table S.I.1 for other options) the reaction
rate can be written as:
(2)
Where is the coverage of empty sites. If the Arrhenius dependence is followed:
(3)
In parallel, we consider that the configurational entropy for the fraction of empty sites can be written as:
(4)
Where is the number of configurations that can be calculated considering the number of active sites, , and the
number of free sites, . can be calculated with the binomial coefficient as: ,
13 where all these
numbers are of the order of the Avogadro constant . Therefore to solve the logarithm of this value the Stirling
approximation can be used.13
(5)
By introducing this approximation we obtain:
(6)
Then if , equivalent to crowded surfaces, then the equation above can be simplified to:
(7)
The probability of a configuration, in our case equivalent to the coverage term is , then for very crowded surfaces
it can be written:
(8)
In turn, the variation of the entropy by adsorbing more molecules can be seen as the partial derivative of S with
respect to a negative change in .
(9)
The effect in the reduction of the entropy due to configurational effects can be seen in movies M1-M2.
Summary of the movies: The movies represent how to account for the surface configurational entropy. The surface
is represented by a (10x10) lattice where in M1 only 1 empty position is present. Occupied positions are indicated
by green spheres. The number of configurations, , counts for the number of potential different positions in which
the given number of empty sites can be placed. This information is then stored in and displayed simultaneously.
© 2012 Macmillan Publishers Limited. All rights reserved.
NATURE CHEMISTRY | www.nature.com/naturechemistry 6
SUPPLEMENTARY INFORMATIONDOI: 10.1038/NCHEM.1411
6
Only different configurations contribute to the counter so some of the movements do not modify while others
do. Then, the configurational entropy can be calculated as . In M2 the same representation is presented
for a system with two empty positions. As can be seen, the associated number of configurations is much larger now
compared to the previous case. Therefore, upon adsorption, i.e. going from M2 to M1, the corresponding is
negative as the process implies the reduction of the total number of associated configurations.
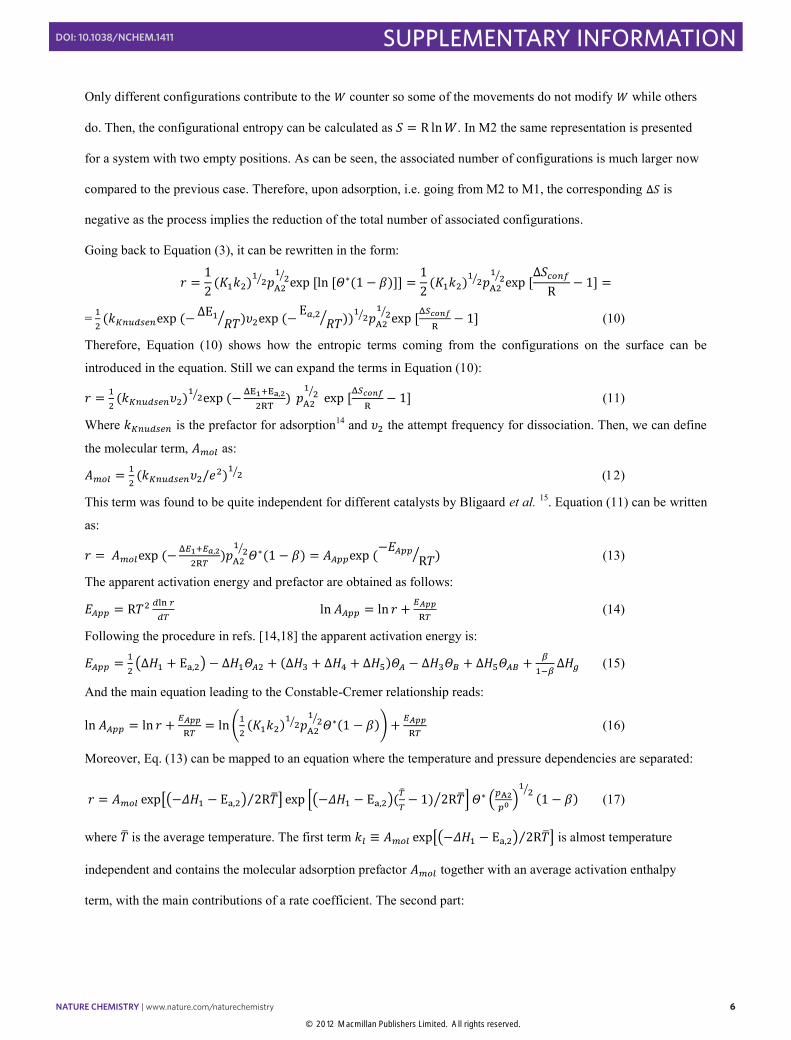
Going back to Equation (3), it can be rewritten in the form:
=
(10)
Therefore, Equation (10) shows how the entropic terms coming from the configurations on the surface can be
introduced in the equation. Still we can expand the terms in Equation (10):
(11)
Where is the prefactor for adsorption14 and the attempt frequency for dissociation. Then, we can define
the molecular term, as:
This term was found to be quite independent for different catalysts by Bligaard et al. 15. Equation (11) can be written
as:
(13)
The apparent activation energy and prefactor are obtained as follows:
(14)
Following the procedure in refs. [14,18] the apparent activation energy is:
(15)
And the main equation leading to the Constable-Cremer relationship reads:
(16)
Moreover, Eq. (13) can be mapped to an equation where the temperature and pressure dependencies are separated:
(17)
where is the average temperature. The first term is almost temperature
independent and contains the molecular adsorption prefactor together with an average activation enthalpy
term, with the main contributions of a rate coefficient. The second part:
© 2012 Macmillan Publishers Limited. All rights reserved.
NATURE CHEMISTRY | www.nature.com/naturechemistry 7
SUPPLEMENTARY INFORMATIONDOI: 10.1038/NCHEM.1411
7
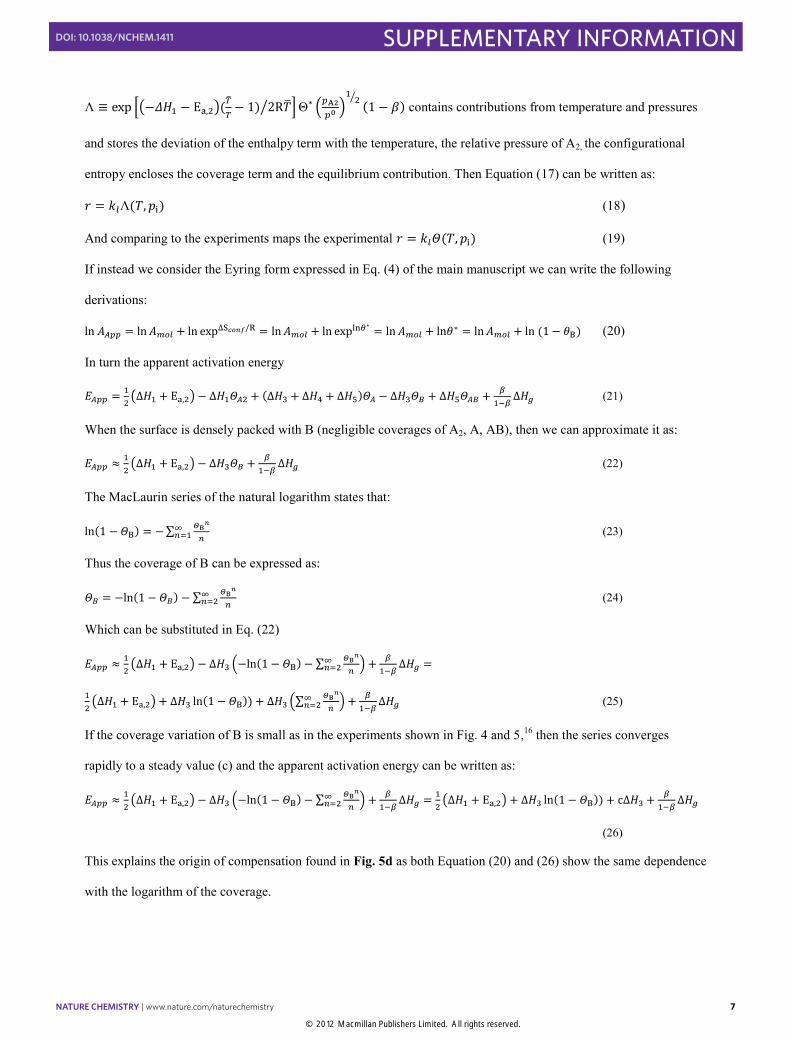
contains contributions from temperature and pressures
and stores the deviation of the enthalpy term with the temperature, the relative pressure of A2, the configurational
entropy encloses the coverage term and the equilibrium contribution. Then Equation (17) can be written as:
(18)
And comparing to the experiments maps the experimental (19)
If instead we consider the Eyring form expressed in Eq. (4) of the main manuscript we can write the following
derivations:
(20)
In turn the apparent activation energy
(21)
When the surface is densely packed with B (negligible coverages of A2, A, AB), then we can approximate it as:
(22)
The MacLaurin series of the natural logarithm states that:
(23)
Thus the coverage of B can be expressed as:
(24)
Which can be substituted in Eq. (22)
(25)
If the coverage variation of B is small as in the experiments shown in Fig. 4 and 5,16 then the series converges
rapidly to a steady value (c) and the apparent activation energy can be written as:
(26)
This explains the origin of compensation found in Fig. 5d as both Equation (20) and (26) show the same dependence
with the logarithm of the coverage.
© 2012 Macmillan Publishers Limited. All rights reserved.
NATURE CHEMISTRY | www.nature.com/naturechemistry 8
SUPPLEMENTARY INFORMATIONDOI: 10.1038/NCHEM.1411
8
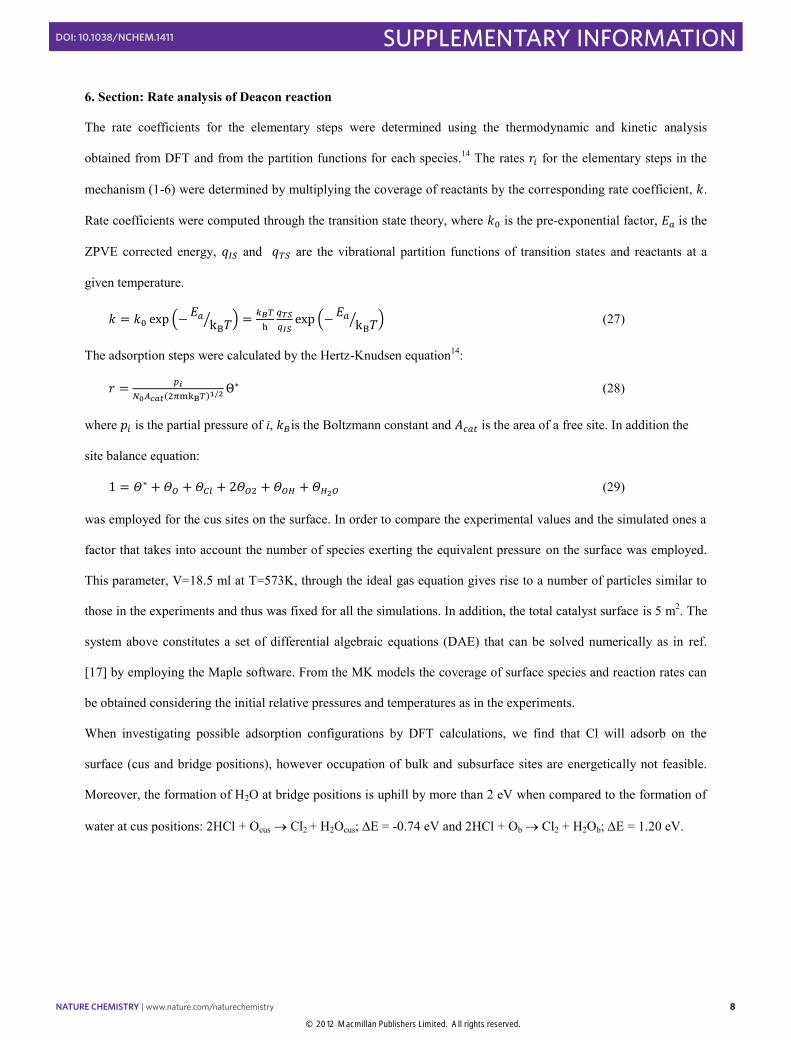
6. Section: Rate analysis of Deacon reaction
The rate coefficients for the elementary steps were determined using the thermodynamic and kinetic analysis
obtained from DFT and from the partition functions for each species.14 The rates for the elementary steps in the
mechanism (1-6) were determined by multiplying the coverage of reactants by the corresponding rate coefficient, .
Rate coefficients were computed through the transition state theory, where is the pre-exponential factor, is the
ZPVE corrected energy, and are the vibrational partition functions of transition states and reactants at a
given temperature.
(27)
The adsorption steps were calculated by the Hertz-Knudsen equation14:
(28)
where is the partial pressure of i, is the Boltzmann constant and is the area of a free site. In addition the
site balance equation:
(29)
was employed for the cus sites on the surface. In order to compare the experimental values and the simulated ones a
factor that takes into account the number of species exerting the equivalent pressure on the surface was employed.
This parameter, V=18.5 ml at T=573K, through the ideal gas equation gives rise to a number of particles similar to
those in the experiments and thus was fixed for all the simulations. In addition, the total catalyst surface is 5 m2. The
system above constitutes a set of differential algebraic equations (DAE) that can be solved numerically as in ref.
[17] by employing the Maple software. From the MK models the coverage of surface species and reaction rates can
be obtained considering the initial relative pressures and temperatures as in the experiments.
When investigating possible adsorption configurations by DFT calculations, we find that Cl will adsorb on the
surface (cus and bridge positions), however occupation of bulk and subsurface sites are energetically not feasible.
Moreover, the formation of H2O at bridge positions is uphill by more than 2 eV when compared to the formation of
water at cus positions: 2HCl + Ocus Cl2 + H2Ocus; E = -0.74 eV and 2HCl + Ob Cl2 + H2Ob; E = 1.20 eV.
© 2012 Macmillan Publishers Limited. All rights reserved.
NATURE CHEMISTRY | www.nature.com/naturechemistry 9
SUPPLEMENTARY INFORMATIONDOI: 10.1038/NCHEM.1411
9
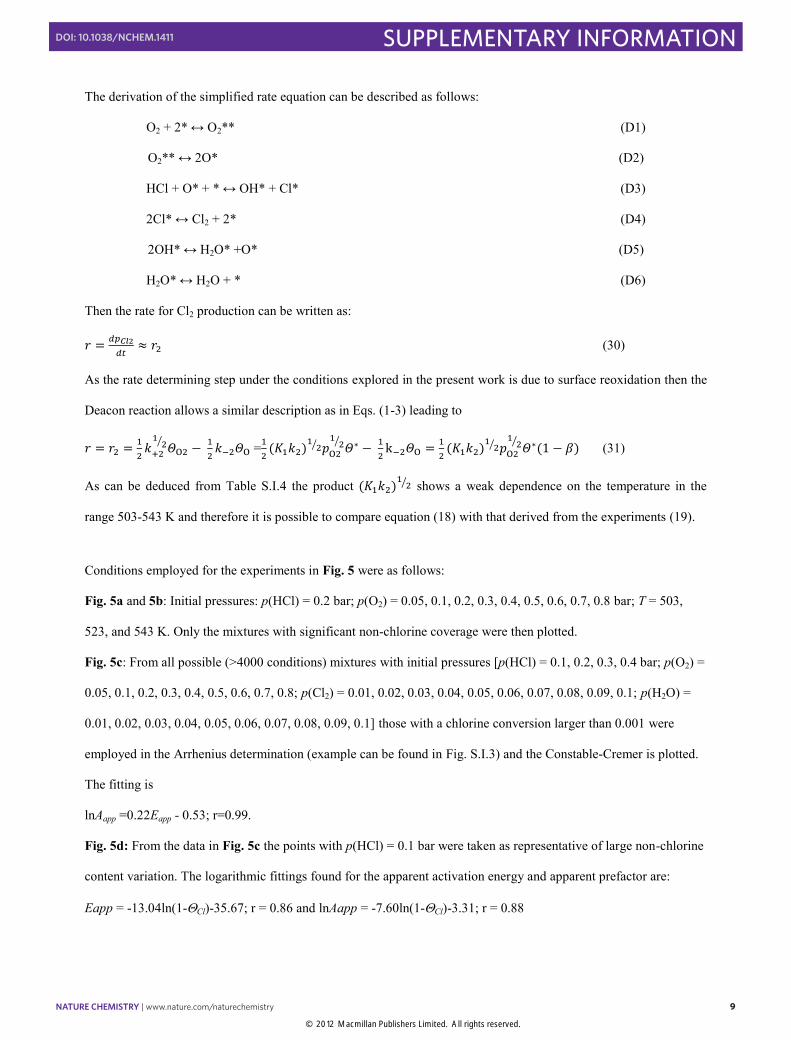
The derivation of the simplified rate equation can be described as follows:
O2 + 2* ↔ O2** (D1)
O2** ↔ 2O* (D2)
HCl + O* + * ↔ OH* + Cl* (D3)
2Cl* ↔ Cl2 + 2* (D4)
2OH* ↔ H2O* +O* (D5)
H2O* ↔ H2O + * (D6)
Then the rate for Cl2 production can be written as:
(30)
As the rate determining step under the conditions explored in the present work is due to surface reoxidation then the
Deacon reaction allows a similar description as in Eqs. (1-3) leading to
=
(31)
As can be deduced from Table S.I.4 the product shows a weak dependence on the temperature in the
range 503-543 K and therefore it is possible to compare equation (18) with that derived from the experiments (19).
Conditions employed for the experiments in Fig. 5 were as follows:
Fig. 5a and 5b: Initial pressures: p(HCl) = 0.2 bar; p(O2) = 0.05, 0.1, 0.2, 0.3, 0.4, 0.5, 0.6, 0.7, 0.8 bar; T = 503,
523, and 543 K. Only the mixtures with significant non-chlorine coverage were then plotted.
Fig. 5c: From all possible (>4000 conditions) mixtures with initial pressures [p(HCl) = 0.1, 0.2, 0.3, 0.4 bar; p(O2) =
0.05, 0.1, 0.2, 0.3, 0.4, 0.5, 0.6, 0.7, 0.8; p(Cl2) = 0.01, 0.02, 0.03, 0.04, 0.05, 0.06, 0.07, 0.08, 0.09, 0.1; p(H2O) =
0.01, 0.02, 0.03, 0.04, 0.05, 0.06, 0.07, 0.08, 0.09, 0.1] those with a chlorine conversion larger than 0.001 were
employed in the Arrhenius determination (example can be found in Fig. S.I.3) and the Constable-Cremer is plotted.
The fitting is
lnAapp =0.22Eapp - 0.53; r=0.99.
Fig. 5d: From the data in Fig. 5c the points with p(HCl) = 0.1 bar were taken as representative of large non-chlorine
content variation. The logarithmic fittings found for the apparent activation energy and apparent prefactor are:
Eapp = -13.04ln(1-Cl)-35.67; r = 0.86 and lnAapp = -7.60ln(1-Cl)-3.31; r = 0.88
© 2012 Macmillan Publishers Limited. All rights reserved.
NATURE CHEMISTRY | www.nature.com/naturechemistry 10
SUPPLEMENTARY INFORMATIONDOI: 10.1038/NCHEM.1411
10
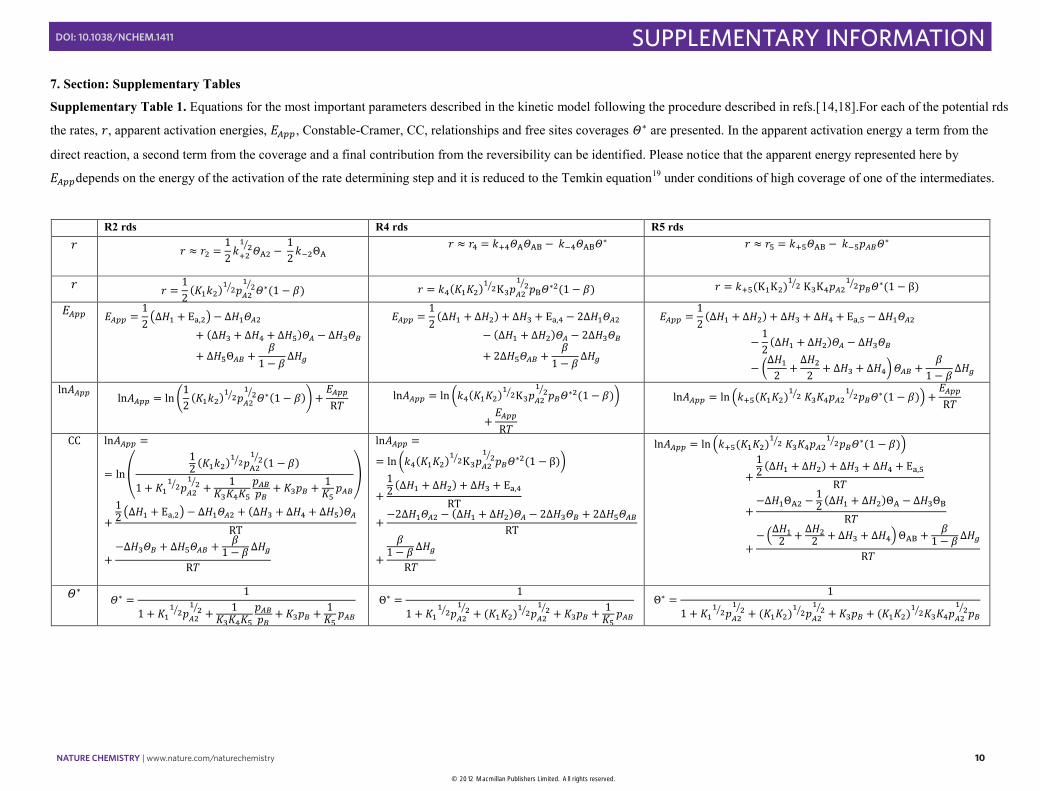
7. Section: Supplementary Tables
Supplementary Table 1. Equations for the most important parameters described in the kinetic model following the procedure described in refs.[14,18].For each of the potential rds
the rates, , apparent activation energies, , Constable-Cramer, CC, relationships and free sites coverages are presented. In the apparent activation energy a term from the
direct reaction, a second term from the coverage and a final contribution from the reversibility can be identified. Please notice that the apparent energy represented here by
depends on the energy of the activation of the rate determining step and it is reduced to the Temkin equation19 under conditions of high coverage of one of the intermediates.
R2 rds R4 rds R5 rds
10
7. Section: Supplementary Tables
Supplementary Table 1. Equations for the most important parameters described in the kinetic model following the procedure described in refs.[14,18].For each of the potential rds
the rates, , apparent activation energies, , Constable-Cramer, CC, relationships and free sites coverages are presented. In the apparent activation energy a term from the
direct reaction, a second term from the coverage and a final contribution from the reversibility can be identified. Please notice that the apparent energy represented here by
depends on the energy of the activation of the rate determining step and it is reduced to the Temkin equation19 under conditions of high coverage of one of the intermediates.
R2 rds R4 rds R5 rds
© 2012 Macmillan Publishers Limited. All rights reserved.
NATURE CHEMISTRY | www.nature.com/naturechemistry 11
SUPPLEMENTARY INFORMATIONDOI: 10.1038/NCHEM.1411
11
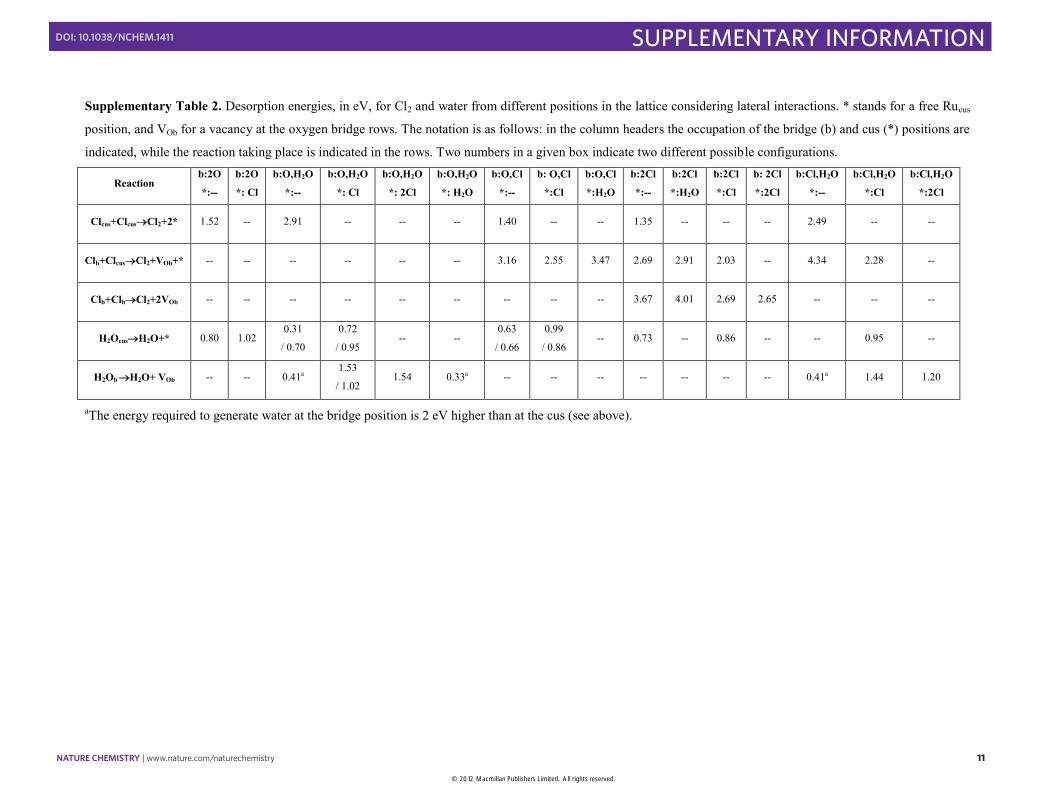
Supplementary Table 2. Desorption energies, in eV, for Cl2 and water from different positions in the lattice considering lateral interactions. * stands for a free Rucus
position, and VOb for a vacancy at the oxygen bridge rows. The notation is as follows: in the column headers the occupation of the bridge (b) and cus (*) positions are
indicated, while the reaction taking place is indicated in the rows. Two numbers in a given box indicate two different possible configurations.
Reaction b:2O
*:--
b:2O
*: Cl
b:O,H2O
*:--
b:O,H2O
*: Cl
b:O,H2O
*: 2Cl
b:O,H2O
*: H2O
b:O,Cl
*:--
b: O,Cl
*:Cl
b:O,Cl
*:H2O
b:2Cl
*:--
b:2Cl
*:H2O
b:2Cl
*:Cl
b: 2Cl
*:2Cl
b:Cl,H2O
*:--
b:Cl,H2O
*:Cl
b:Cl,H2O
*:2Cl
Clcus+ClcusCl2+2* 1.52 -- 2.91 -- -- -- 1.40 -- -- 1.35 -- -- -- 2.49 -- --
Clb+ClcusCl2+VOb+* -- -- -- -- -- -- 3.16 2.55 3.47 2.69 2.91 2.03 -- 4.34 2.28 --
Clb+ClbCl2+2VOb -- -- -- -- -- -- -- -- -- 3.67 4.01 2.69 2.65 -- -- --
H2OcusH2O+* 0.80 1.02 0.31
/ 0.70
0.72
/ 0.95 -- --
0.63
/ 0.66
0.99
/ 0.86 -- 0.73 -- 0.86 -- -- 0.95 --
H2Ob H2O+ VOb -- -- 0.41a 1.53
/ 1.02 1.54 0.33a -- -- -- -- -- -- -- 0.41a 1.44 1.20
aThe energy required to generate water at the bridge position is 2 eV higher than at the cus (see above).
© 2012 Macmillan Publishers Limited. All rights reserved.
NATURE CHEMISTRY | www.nature.com/naturechemistry 12
SUPPLEMENTARY INFORMATIONDOI: 10.1038/NCHEM.1411
12
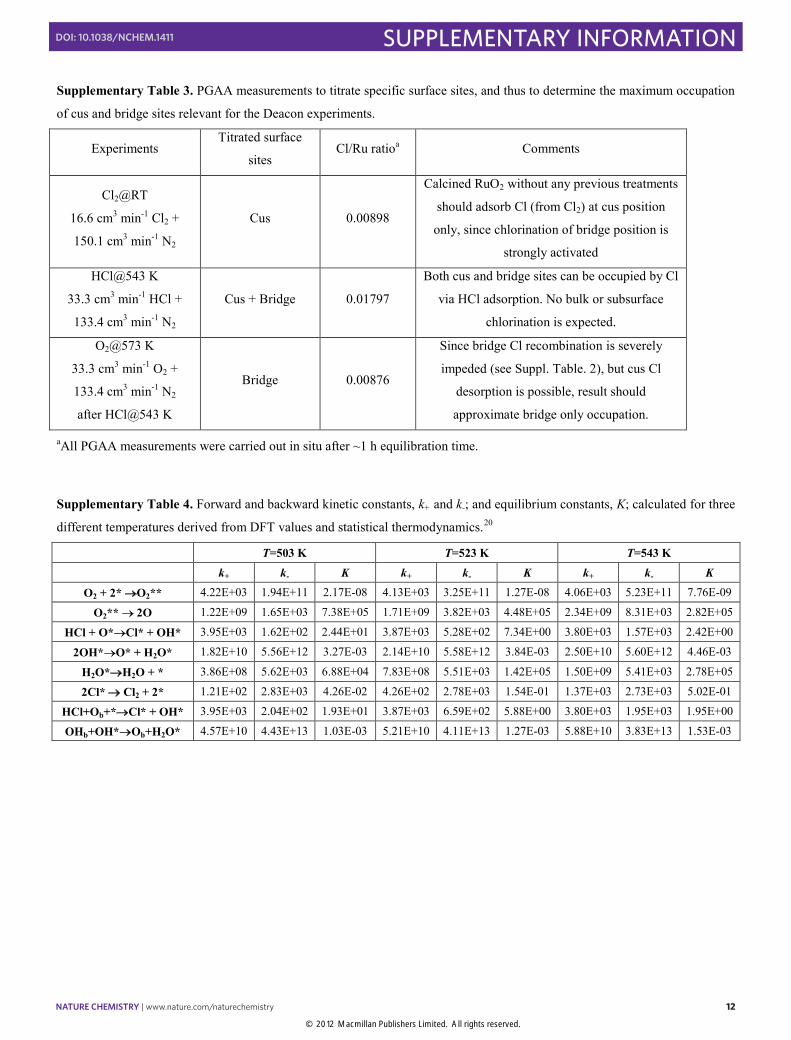
Supplementary Table 3. PGAA measurements to titrate specific surface sites, and thus to determine the maximum occupation
of cus and bridge sites relevant for the Deacon experiments.
Experiments Titrated surface
sites Cl/Ru ratioa Comments
Cl2@RT
16.6 cm3 min-1 Cl2 +
150.1 cm3 min-1 N2
Cus 0.00898
Calcined RuO2 without any previous treatments
should adsorb Cl (from Cl2) at cus position
only, since chlorination of bridge position is
strongly activated
HCl@543 K
33.3 cm3 min-1 HCl +
133.4 cm3 min-1 N2
Cus + Bridge 0.01797
Both cus and bridge sites can be occupied by Cl
via HCl adsorption. No bulk or subsurface
chlorination is expected.
O2@573 K
33.3 cm3 min-1 O2 +
133.4 cm3 min-1 N2
after HCl@543 K
Bridge 0.00876
Since bridge Cl recombination is severely
impeded (see Suppl. Table. 2), but cus Cl
desorption is possible, result should
approximate bridge only occupation.
aAll PGAA measurements were carried out in situ after ~1 h equilibration time.
Supplementary Table 4. Forward and backward kinetic constants, k+ and k-; and equilibrium constants, K; calculated for three
different temperatures derived from DFT values and statistical thermodynamics.20
T=503 K T=523 K T=543 K k+ k- K k+ k- K k+ k- K
O2 + 2* O2** 4.22E+03 1.94E+11 2.17E-08 4.13E+03 3.25E+11 1.27E-08 4.06E+03 5.23E+11 7.76E-09
O2** 2O 1.22E+09 1.65E+03 7.38E+05 1.71E+09 3.82E+03 4.48E+05 2.34E+09 8.31E+03 2.82E+05
HCl + O*Cl* + OH* 3.95E+03 1.62E+02 2.44E+01 3.87E+03 5.28E+02 7.34E+00 3.80E+03 1.57E+03 2.42E+00
2OH*O* + H2O* 1.82E+10 5.56E+12 3.27E-03 2.14E+10 5.58E+12 3.84E-03 2.50E+10 5.60E+12 4.46E-03
H2O*H2O + * 3.86E+08 5.62E+03 6.88E+04 7.83E+08 5.51E+03 1.42E+05 1.50E+09 5.41E+03 2.78E+05
2Cl* Cl2 + 2* 1.21E+02 2.83E+03 4.26E-02 4.26E+02 2.78E+03 1.54E-01 1.37E+03 2.73E+03 5.02E-01
HCl+Ob+*Cl* + OH* 3.95E+03 2.04E+02 1.93E+01 3.87E+03 6.59E+02 5.88E+00 3.80E+03 1.95E+03 1.95E+00
OHb+OH*Ob+H2O* 4.57E+10 4.43E+13 1.03E-03 5.21E+10 4.11E+13 1.27E-03 5.88E+10 3.83E+13 1.53E-03
© 2012 Macmillan Publishers Limited. All rights reserved.
NATURE CHEMISTRY | www.nature.com/naturechemistry 13
SUPPLEMENTARY INFORMATIONDOI: 10.1038/NCHEM.1411
13
Supplementary Table 5. Coverage for free sites *, dioxygen, oxygen, hydroxyl, chlorine and water at the Rucus sites under
reaction conditions with the DFT-MK simulations at t= 8 E-3 s, relative initial pressures of pHCl/pO2 and the produced Cl2, pCl2.
T/K pO2/pHCl Cl pCl2/Pa 503.15 3 0.994 3626 0.994 2.01E-04 1.07E-02 1.34E-08 3.28E-03 503.15 3.5 0.993 3884 0.993 2.07E-04 1.51E-02 1.46E-08 3.16E-03 503.15 4 0.992 4105 0.992 2.12E-04 2.20E-02 1.59E-08 3.08E-03 523.15 1 0.989 4015 0.989 2.09E-04 2.36E-02 9.16E-09 6.41E-03 523.15 1.5 0.962 4624 0.962 2.28E-04 1.13E-01 1.20E-08 5.92E-03 523.15 2 0.914 4914 0.914 2.25E-04 2.04E-01 1.39E-08 5.47E-03 523.15 2.5 0.876 5110 0.876 2.19E-04 2.52E-01 1.57E-08 5.17E-03 523.15 3 0.852 5231 0.852 2.16E-04 2.78E-01 1.78E-08 4.99E-03 523.15 3.5 0.837 5309 0.837 2.13E-04 2.94E-01 2.00E-08 4.89E-03 523.15 4 0.826 5364 0.826 2.11E-04 3.04E-01 2.23E-08 4.81E-03 543.15 0.5 0.975 4393 0.975 2.07E-04 7.53E-02 7.05E-09 1.11E-02 543.15 1 0.888 5031 0.888 2.11E-04 2.65E-01 1.17E-08 9.59E-03 543.15 1.5 0.864 5158 0.864 2.08E-04 2.96E-01 1.74E-08 9.23E-03 543.15 2 0.850 5230 0.850 2.05E-04 3.12E-01 2.29E-08 9.03E-03 543.15 2.5 0.838 5289 0.838 2.03E-04 3.25E-01 2.81E-08 8.86E-03 543.15 3 0.829 5338 0.829 2.01E-04 3.35E-01 3.31E-08 8.72E-03 543.15 3.5 0.820 5382 0.820 1.99E-04 3.43E-01 3.78E-08 8.60E-03 543.15 4 0.812 5421 0.812 1.97E-04 3.51E-01 4.25E-08 8.49E-03
Supplementary Table 6. Derived Arrhenius parameters (with their standard error) of Deacon reaction over RuO2/SnO2-Al2O3
at the indicated conditions. The corresponding Arrhenius plot is shown in Supplementary Fig. 1.
Conditions
O2:HCl:N2:Cl2:H2O
EApp in kJ mol-1
(standard error)
lnAApp
(standard error)
Standard deviation
of linear fit
40:10:30:-:- 68.9 (1.0) 15.88 (0.22) 0.03
10:10:60:-:- 67.7 (0.5) 15.01 (0.09) 0.01
10:2.5:67.5:-:- 61.7 (0.7) 13.39 (0.15) 0.02
2.5:10:67.5:-:- 67.8 (0.6) 14.52 (0.13) 0.02
10:40:30:-:- 65.7 (0.7) 14.81 (0.15) 0.02
20:20:40:-:- 68.6 (0.2) 15.54 (0.03) 0.005
20:20:37:3:- 75.5 (2.3) 16.58 (0.49) 0.07
20:20:37:-:3 88.9 (3.5) 18.98 (0.74) 0.1
20:20:33:3:3 115.4 (8.5) 23.67 (1.81) 0.25
20:20:28:6:6 148.6 (2.8) 29.42 (0.56) 0.05
© 2012 Macmillan Publishers Limited. All rights reserved.
NATURE CHEMISTRY | www.nature.com/naturechemistry 14
SUPPLEMENTARY INFORMATIONDOI: 10.1038/NCHEM.1411
14
8. Section: Supplementary Figures
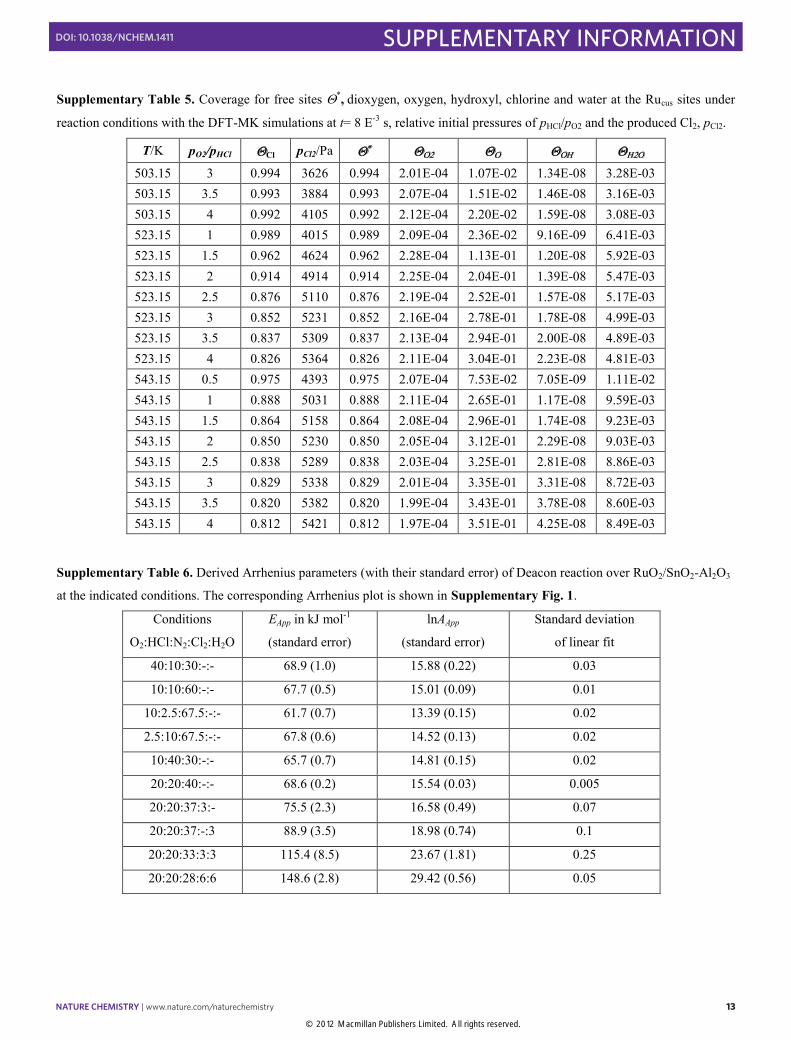
Supplementary Figure 1. Arrhenius plot of Deacon reaction over RuO2/SnO2-Al2O3 in the 523-644 K region. Feed
composition O2:HCl:N2:Cl2:H2O (in cm3 min-1) as indicated. The reaction rate (ri) is referenced to the condition
O2:HCl:N2:Cl2:H2O = 40:10:30:-:- at 523 K (r0). The derived apparent pre-exponential factor and activation energy values
(Table S.I. 6) are plotted in Figure 1 of the main text. Note that estimation of isokinetic T is meaningless based on the
combination of those experiments where the calculated apparent Arrhenius parameters vary very little. Therefore, the
isokinetic T was calculated from the intersection of the 3 linear fit giving the highest apparent activation energy (three last
conditions in Table S.I. 6) with all other fits. This combination gives rise to 24 (9+8+7) isokinetic T values. The average of
them is 671 K with standard deviation of 41 K.
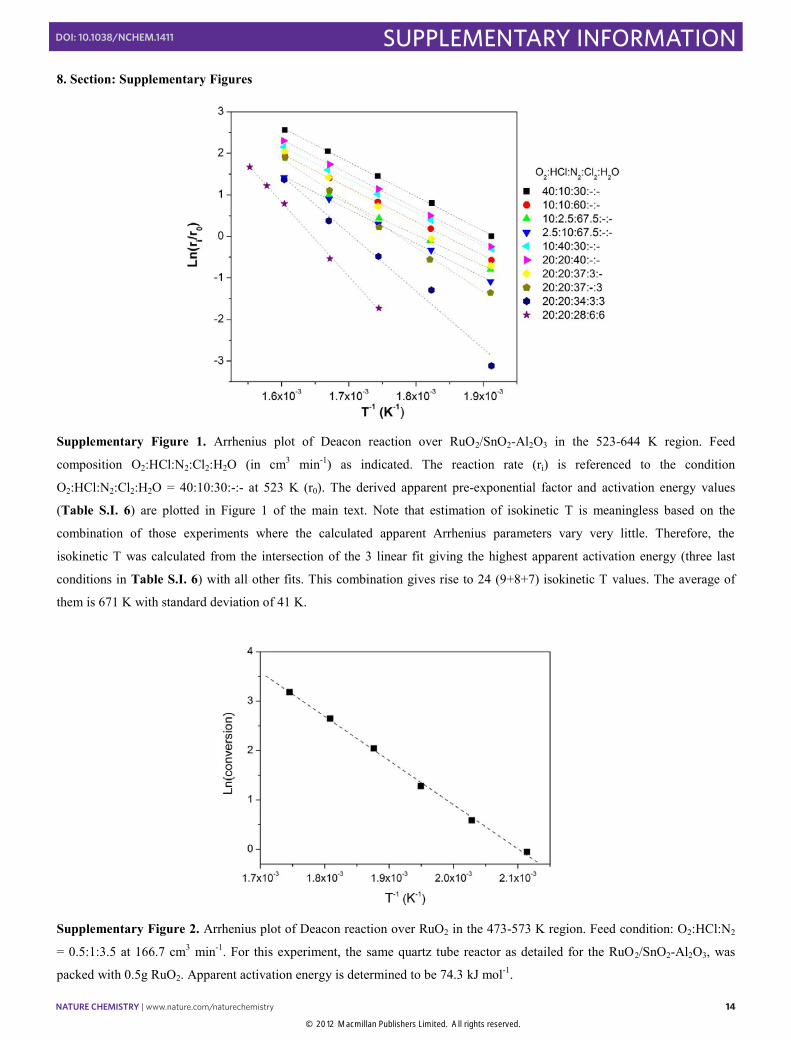
Supplementary Figure 2. Arrhenius plot of Deacon reaction over RuO2 in the 473-573 K region. Feed condition: O2:HCl:N2
= 0.5:1:3.5 at 166.7 cm3 min-1. For this experiment, the same quartz tube reactor as detailed for the RuO2/SnO2-Al2O3, was
packed with 0.5g RuO2. Apparent activation energy is determined to be 74.3 kJ mol-1.
14
8. Section: Supplementary Figures
Supplementary Figure 1. Arrhenius plot of Deacon reaction over RuO2/SnO2-Al2O3 in the 523-644 K region. Feed
composition O2:HCl:N2:Cl2:H2O (in cm3 min-1) as indicated. The reaction rate (ri) is referenced to the condition
O2:HCl:N2:Cl2:H2O = 40:10:30:-:- at 523 K (r0). The derived apparent pre-exponential factor and activation energy values
(Table S.I. 6) are plotted in Figure 1 of the main text. Note that estimation of isokinetic T is meaningless based on the
combination of those experiments where the calculated apparent Arrhenius parameters vary very little. Therefore, the
isokinetic T was calculated from the intersection of the 3 linear fit giving the highest apparent activation energy (three last
conditions in Table S.I. 6) with all other fits. This combination gives rise to 24 (9+8+7) isokinetic T values. The average of
them is 671 K with standard deviation of 41 K.
Supplementary Figure 2. Arrhenius plot of Deacon reaction over RuO2 in the 473-573 K region. Feed condition: O2:HCl:N2
= 0.5:1:3.5 at 166.7 cm3 min-1. For this experiment, the same quartz tube reactor as detailed for the RuO2/SnO2-Al2O3, was
packed with 0.5g RuO2. Apparent activation energy is determined to be 74.3 kJ mol-1.
© 2012 Macmillan Publishers Limited. All rights reserved.
NATURE CHEMISTRY | www.nature.com/naturechemistry 15
SUPPLEMENTARY INFORMATIONDOI: 10.1038/NCHEM.1411
15
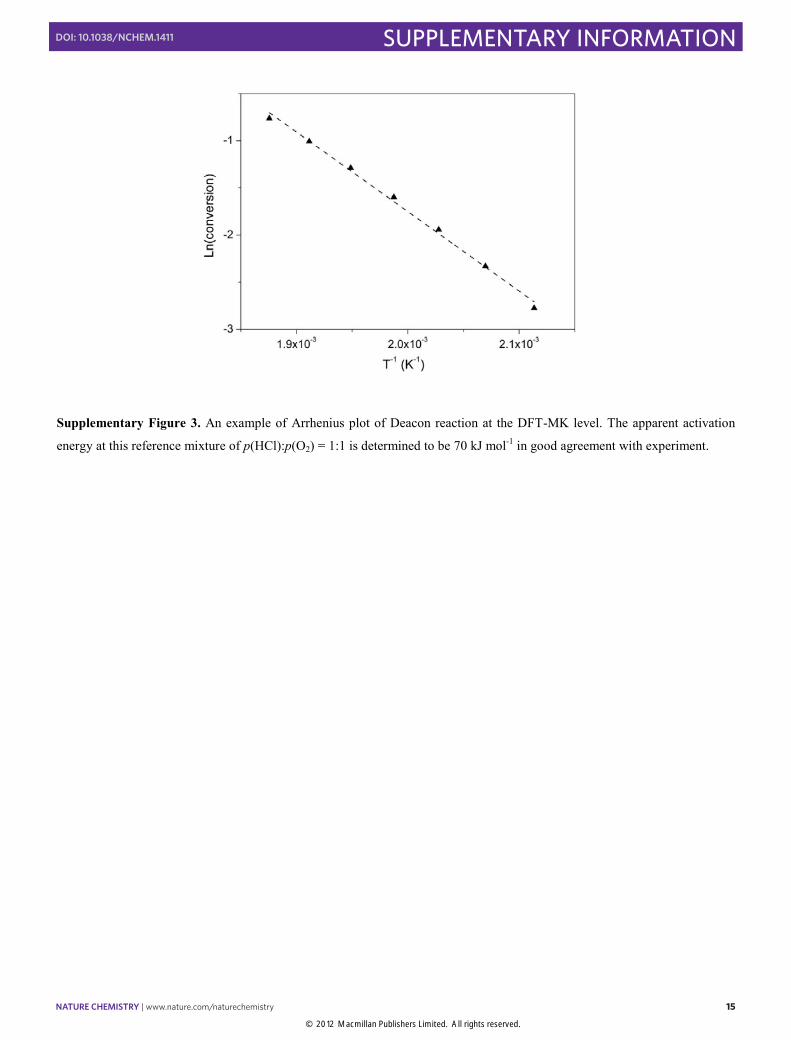
Supplementary Figure 3. An example of Arrhenius plot of Deacon reaction at the DFT-MK level. The apparent activation
energy at this reference mixture of p(HCl):p(O2) = 1:1 is determined to be 70 kJ mol-1 in good agreement with experiment.
© 2012 Macmillan Publishers Limited. All rights reserved.
NATURE CHEMISTRY | www.nature.com/naturechemistry 16
SUPPLEMENTARY INFORMATIONDOI: 10.1038/NCHEM.1411
16
References
1 Teschner, D. et al., An integrated approach to Deacon chemistry on RuO2-based catalysts. J.Catal. 285, 273–284 (2012). 2 Mondelli, C., Amrute, A. P., Schmidt, T. & Pérez-Ramírez, J. Shaped RuO2/SnO2-Al2O3 catalyst for large-scale stable Cl2
production by HCl oxidation. ChemCatChem. 3, 657-660 (2011). 3 Pérez-Ramírez, J. & Kondratenko, E. V. Evolution, achievements, and perspectives of the TAP technique. Catal. Today, 121,
160-169 (2007). 4 Gleaves, J. T., Yablonsky, G., Zheng, X. L., Fushimi, R. & Mills, P. L. Temporal analysis of products (TAP)-Recent
advances in technology for kinetic analysis of multi-component catalysts. J. Mol. Catal. A-Chem. 315, 108-134 (2010). 5 Shekhtman, S. O., Yablonsky, G. S., Chen, S. & Gleaves, J. T. Thin-zone TAP-reactor - theory and application. Chem. Eng.
Sci. 54, 4371-4378 (1999). 6 Revay, Z. et al. In situ determination of hydrogen inside a catalytic reactor using prompt γ activation analysis. Anal. Chem.
80, 6066-6071 (2008). 7 Revay, Z. Determining elemental composition using prompt gamma activation analysis. Anal. Chem. 81, 6851-6859 (2009). 8 Kresse, G. & Hafner, J. Ab initio molecular-dynamics for liquid-metals. Phys. Rev. B, 47, 558-561 (1993). 9 Kresse, G. & Furthmüller, J. M. Efficient iterative schemes for ab initio total-energy calculations using a plane-wave basis
set. Phys. Rev. B, 54, 11169-11186 (1996). 10 Hammer, B., Hansen, L. B. & Nørskov, J. K. Improved adsorption energetics within density-functional theory using revised
Perdew-Burke-Ernzerhof functionals. Phys. Rev. B 59, 7413-7421 (1999). 11 Kresse, G. & Joubert, D. From ultrasoft pseudopotentials to the projector augmented-wave method. Phys. Rev. B 59, 1758-
1775 (1999). 12 Henkelman, G., Uberuaga B.P. & Jónsson, H., A climbing image nudged elastic band method for finding saddle points and
minimum energy paths. J. Chem. Phys. 113, 9901-9904 (2000)
13 Atkins, P. & de Paula, J. Atkins’ Physical Chemistry. (Oxford University Press, New York, 8th Ed. 2006)
14 Chorkendorff, I. & Niemantsverdriet, J. W. Concepts of Modern Catalysis and Kinetics (Wiley-VCH, Weinheim, 2003) 15 Bligaard, et.al. On the compensation effect in heterogeneous catalysis. J. Phys. Chem. B 107, 9325-9331 (2003). 16 The contribution of the terms in order 2 and 3 in the expansion to the value would be for a and for . 17 Novell-Leruth, G., Ricart, J. M. & Pérez-Ramírez, J. Pt(100)-catalyzed ammonia oxidation studied by DFT: mechanism and
microkinetics. J. Phys. Chem. C 112, 13554-13562 (2008). 18 Lynggaard, H., Andreasen, A., Stegelmann, C. & Soltze, P. Analysis of simple kinetic models in heterogeneous catalysis.
Prog. Surf. Sci. 77, 71-137 (2004) 19 Temkin, M. I. Relation between the apparent and the true activation energy of heterogeneous reactions. Acta Physicochim.
URSS, 3, 312 (1935). 20 McQuarrie, D. A. & Simon, J. D. Molecular Thermodynamics (University Science Books, Sausalito, 1999).
© 2012 Macmillan Publishers Limited. All rights reserved.