rhodopsin density and visual threshold in retinitis pigmentosa
TRANSCRIPT

RHODOPSIN DENSITY AND VISUAL THRESHOLD IN RETINITIS PIGMENTOSA
V. N. HIGHMAN, F.R.C.S. London,
It is sometimes helpful to investigate the etiology of lesions of the visual path cen-tripetally, starting at the periphery. This approach enabled Carr and Ripps1 to show that Oguchi's disease cannot be due to a failure in visual pigment kinetics, and Carr and associates2-3 have similarly established that lesions causing congenital nyctalopia are situated on the central side of the receptor outer limbs. These workers used f undus reflectom-etry, a technique derived from ophthalmos-copy4 in which the usual white light is replaced by various monochromatic lights, and a radiometric device is substituted for the practitioner's eye.
The method5 is based on two properties of visual pigments, the colored light-absorbing materials contained in the outer limbs of the rods and cones. As the present report is only concerned with the rod pigment in man, namely rhodopsin, it will be unnecessary to refer to the cones. The first of the properties referred to is the strong preferential light absorption for blue-green light. Over 20% of such light incident on the human retina is absorbed by the rod pigment: other wavelengths are absorbed to a significantly smaller extent—e.g., red light is absorbed hardly at all. It follows that absorption by the pigment, and, therefore, also changes in, and variations from, the norm are gauged best with blue-green light, undiluted by any other wavelength. The second property relevant to fundus reflectometry is that rhodopsin, when exposed to light, changes its molecular structure: its absorption of blue-green light is reduced and the pigment is
From the Department of Visual Science, Institute of Ophthalmology, University of London, London, England.
Reprint requests to R. A. Weale, D.Sc, Ph.D., Department of Visual Science, Institute of Ophthalmology, Judd Street, London WC1H 9QS, England.
, AND R. A. WEALE, D .SC. England
consequently said to bleach. If the pigment has not been exposed to light—i.e., the retina containing it is dark-adapted—then the relation between the fraction of pigment bleached and the light exposure causing the bleaching can be predicted by simple mathematics.1 The fact that blue-green light is most readily absorbed implies also that it has a high bleaching efficiency. It follows that if such light is used for measuring absorption its intensity has to be kept as low as is consistent with accuracy, for otherwise the pigment will, as it were, melt away before our eyes.
It will be recalled that the absorptivity (A) cannot be measured directly as such. It has to be computed from measurements of the light transmitted by the pigment under test. In the case of rhodopsin, the transmis-sivity, or fraction of the incident light, is smaller for blue-green light than for any other part of the visible spectrum. Transmis-sivity (T) is, however, not directly related to pigment concentration (c) . The latter is linearly related to -log T, known as the density (D) . To a first approximation we can say:
A = 1-T = kD = kac6
where k is a numerical constant, a the spectral extinction coefficient and c the concentration of the pigment, and 6 the path-length traversed by the measuring light.
When we wish to study the properties of rhodopsin in the living human eye, absolute measurements of these values are impossible. The reason is that any light sent into the eye is absorbed not only by rhodopsin but also by a number of other pigments—in the crystalline lens and hemoglobin, to name but two— which leave their imprint on the light probing the transmission factor of rhodopsin. However, if, under given conditions of light exposure, rhodopsin bleaches and therefore
822

VOL. 75, NO. 5 RHODOPSIN DENSITY AND VISUAL THRESHOLD 823
changes its concentration and molecular configuration, and can be shown to be the only pigment to change, then the measured change can be attributed to it: stable pigments do not affect measurements of concentration changes of rhodopsin.
The technique employed by the earlier workers1"3 who applied the method to clinical conditions was sequential. This is to say, they sent a weak measuring beam of light into the dark-adapted eye. It traversed the ocular media, the retina, was reflected at the fundus oculi, and then retraced its path to emerge from the eye. Its intensity (ID) was measured at this point by photoelectric means. Next, the measuring beam was replaced by a relatively intense bleaching beam which illuminated the limited retinal area previously probed by the weak measuring beam. The bleaching beam reduced the concentration by an amount which could be determined by re-substitution of the measuring beam. As the concentration and therefore the absorption of the retina had been reduced by exposure to the bleaching beam, the second measurement with the weak beam always showed it to have a somewhat higher intensity (Ip) than when it was first used on the dark-adapted eye. The change in density, which, as the above equation shows, can be used to measure the change in concentration, is given by :
AD = log IP — log ID
The conditions in which AD -» D have been discussed by the workers who have used this technique4·6: the approximation is valid for blue-green light if the measurement of IP takes place immediately- after the bleaching exposure, a condition obeyed in the present study.
From the clinical point of view, the principal disadvantage of a sequential technique is that it makes more demands on the patient's ability to cooperate than one is willing to allow (case in point, if eye movements are not rigorously controlled, the measurements may be vitiated). This drawback could be over
come if ID and IP could be measured simultaneously. This is clearly impossible to do for a given retinal area. However, if one part of the retina is denuded of its rhodopsin by exposure to a bleaching light, and the neighboring, dark-adapted regions are used as samples of retina which contain rhodopsin, then conditions are created for a simultaneous measurement. For example, if the two areas are photographed in blue-green light by means of orthodox fundus photography, the resultant negative should be darker in the bleached part as the less absorbed light coming from this region must be of higher intensity than that of the light coming from regions containing rhodopsin. That this can be done qualitatively was shown almost 100 years ago by Kühne,7 who managed to use the light passing through the panes of a window to impress on the retinae of frogs and rabbits an outline of the window and the criss-cross of the horizontal and vertical bars. The light parts bleached the retina, the unbleached ones remaining colored. The resulting imprint was called an optogram. Quantitative support for the feasibility of this approach was obtained more recently8·9
when the changes in rhodopsin and metarho-dopsin densities of cat and rabbit eyes were studied photospectrographically. Ito and associates10 photographed optograms in human eyes without obtaining any quantitative data. However, their method, which entailed bleaching half of one retina and comparing it with the other, unbleached half, is not unequivocal; photographs similar to the one they show can also be obtained from partial closure of the eye. The only unambiguous evidence is provided by a structured optogram and, in some preliminary trials, it was shown11
that the optographic imprint of a black-and-white grating can, in fact, be photographed, and utilized for an estimate of density changes in the normal human eye.
This paper gives an account of some of the problems involved when the application of the method was extended to patients with retinitis pigmentosa and to "carriers." Their

824 AMERICAN JOURNAL OF OPHTHALMOLOGY MAY, 1973
visual state was assessed by measurements of the absolute threshold in the retinal region in which the optograms were formed. Measurements were made of the density change due to photolysis as a function of perimetric angle, the rate of pigment regeneration, and the edema effect.12'13
METHOD
Technique—The standard instrument used for the fundus photography was a slightly modified Zeiss-Nordenson 1926 retinal camera. The existing light source was replaced by a xenon FA5 (150W) lamp, and room was made for the insertion of a carrier just in front of the condenser. The carrier was provided with a slide to which the opto-graphic target was attached. This consisted of two parallel opaque bars, with the transparent interval between them subtending at the eye an angle of five degrees. This was chosen so that its retinal image was minimally affected by retinal blood vessels. A blue-green filter (Ilford 302 and 102) was placed beside the target so that either the target or the filter was in the light path.
The target was used for producing the op-togram, the filter for photographing it. A blue-green filter was used because rhodopsin absorbs maximally in this part of the spectrum, hence blue-green light maximizes the density change resulting from a change in its concentration.
Subjects—The heredity, clinical features, and field defects of pigmentary retinopathy, which is a progressive disease eventually leading to blindness, have been studied by von Graefe.14·15 The rate of progress is usually slow, central vision often not failing until the fifth decade of life. Before there are obvious clinical signs and symptoms, pathologic changes occur in the retina, and these have been shown by the presence of an abnormal electro-oculogram.16
We investigated a series of patients from the Genetic Clinic at Moorfields Eye Hospital, all of whom had early manifestations of
the disease, in the hope that (1) some of the early, little understood pathology of the disease might be elucidated, and (2) the diagnosis of the disease might be aided in patients with doubtful signs or symptoms. All the patients we studied belonged to families in which the rate of progress of the disease had been slow so that there would be ample scope for investigating any early changes.
We divided our cases into three groups. The first group consisted of four patients whose family tree suggested inheritance by autosomal dominance, but who had no clinical or electrophysiologic evidence of the disease. In two patients (A.W., N.C.) in this group, the age of onset was younger than usual, while the other two were a couple of years older than the expected age at onset (E.C., C.G.). All patients of the second group were suffering from the autosomal dominant disease, with typical fundi and electrophysiologic changes. In both groups the family histories suggested a slowly progressive disease.
The third group of patients were all suffering from the X-linked disease. In orthodox recessive Mendelian inheritance, the hétérozygote or carrier does not demonstrate any abnormality. It has now become apparent that in pigmentary retinopathy the hétérozygote in fact often does manifest the disease17 at about the fourth or fifth decade of life. The pedigrees of the six female patients in this group show that they are proven or suspect hétérozygotes. The progress of the X-linked disease in women is extremely slow, and we were interested to see if the changes in this disease were similar to the findings in the autosomal dominant disease. The case of the male patient in this group was typical of the X-linked disease, the onset of the disease occurring in early childhood and becoming well advanced by the time he reached the age of 19 years. In this patient, as well as all the others, central fields were examined on the Friedmann Central Field Analyzer to ensure that the visual pigment density changes were not measured

VOL. 75, NO. 5 RHODOPSIN DENSITY AND VISUAL THRESHOLD 825
in scotomatous areas (where there was no visual function).
Three normal adults were used as controls.
Procedure—The patient's right pupil having been dilated with tropicamide ( Mydriacil 1%), he or she was seated at the instrument. A red fixation spot was provided so that the center of the target was imaged at an angle of 18 degrees in the right nasal visual field. The size of the target was such as to cover an extent of more than 5 degrees horizontally on each side of the central point. Before any photography was done, each subject was taken through a dummy run in which he was asked to fixate the red spot ; he was exposed to the target for the experimental period of 10 seconds and then to the photographic flash. If the procedure was understood, the trial run was followed by a period of dark adaptation lasting 20 minutes. His position on an adjustable chin-rest was checked just before the actual test with a deep-red filter (Ilford Spectrum 608) placed on the target carrier and giving a retinal illumination of 3.87 log td. As rhodopsin absorption of red light is weak, uncontrolled photolysis of the visual pigment was thereby minimized. However, the final focusing had to be done quickly in blue-green light so that errors due to chromatic aberration might be eliminated. With the patient in position, his eye was exposed to the target for 10 seconds and the optogram photographed immediately afterwards.
It was desirable to obtain a measure of the rate of regeneration of the pigment. Consequently, in some cases, a second photographic exposure was done three minutes after the first, by which time most investigators agree18"21 that the normal eye has regenerated 50% of its bleached rhodopsin or more.
An assessment was also obtained of the edema effect in some of the patients. This phenomenon12·13 manifests itself in the normal eye as a slight darkening of the fundus following an intense exposure of the eye.
The darkening disappears within three minutes of the cessation of the light exposure. Its photometric magnitude is of interest because photolysis, by virtue of converting light-absorbing pigments into relatively transparent material, leads to a lightening of the fundus for some spectral lights. The edema effect, which counteracts the lightening, seems to be uniform throughout the visible part of the spectrum. Its magnitude is revealed by replacing the blue-green filter used for photographing the optograms with a red one (Ilford Spectrum 608). We noted above that rhodopsin is virtually transparent to light transmitted by it, and its effect can therefore be ignored.
Calibration—The luminance of the camera beam was determined with an S.E.I, meter by making a photometric match between the camera field luminance and a secondary standard illuminating a magnesium oxide surface. The match was done through an artificial pupil 2 mm in diameter. Measurement of the cross-sectional area of the beam in the plane of the patient's pupil then enabled one to convert the photometric units into units of retinal illumination. The match was done by a dark-adapted observer at approximately the same retinal location as the instrument was being used. The target log luminance was 6.26, expressed in (scotopic) trolands. Similarly, the intensity of the photographic exposure was 4.60 log td. sec. Upon comparison of these data with others obtained before,12 it follows that a 10s-expo-sure to the grating leads to about 96% of the available pigment being photolysed, whereas the photographic (blue-green) light has a negligible effect.
Threshold measurements—All the observers were dark-adapted for 30 minutes. As this period was not preceded by any special adapting light history, it may be considered adequate for complete dark adaptation. The absolute threshold was measured 10 times by means of a Goldmann adaptometer ; the test field subtended at the eye an angle of 10 degrees and was centered at 18 degrees in

826 AMERICAN JOURNAL OF OPHTHALMOLOGY MAY, 1973
Fig. 1 (Highman and Weale). A human opto-gram (XX) and superposed neutral density filters of increasing transmissivity (Pi-5). Sax, Sbx, and Wii represent areas on the negative which, in conjunction with analogous regions in the unbleached parts AA and BB, serve for the calculation of the pigment density lost in XX owing to an earlier exposure of the eye to an intense light.
the temporal part of the retina. The field, therefore, covered more than the part on which the optogram was produced, but it would clearly have been preferable to use a smaller test field to scan the area in question. Considerations of time made this impossible. The diameter of the naturally dilated pupil was measured in red light.
Densitometry—To produce photo-opto-grams necessitates the use of the fastest film available, as an excessively bright flash could bleach the dark-adapted areas of the retina, thus reducing the contrast of the optogram itself. As the method can yield only density differences, resolution being unimportant, a film with a very high emulsion speed was chosen. Kodak recording film 2475 was satisfactory. When developed with Kodak developer DK50 it has an emulsion speed of 3200 ASA in "flat" illumination.
A photo-optogram reveals a density difference between bleached and unbleached areas of the retina (Fig. 1), and has to be calibrated. This was done by projecting a calibrated step wedge onto the retina each time a photograph was taken. The steps of the wedge
were separated by gaps so that spatial variations in fundus color could be allowed for when densitometry was done parallel to the optogram—i.e., at right angles to the long axis of the wedge. Each step and gap subtended 1°17' at the eye, the innermost step being 13 degrees from the fovea, the central one 18 degrees, and the outermost 23 degrees.
The negative (Fig. 1) shows a grid consisting of vertical stripes due to the interposition of the step wedge in the path of the illuminating flash. The horizontal bar is the optogram which is clearly visible in normal subjects. The object forming the optogram allows the full width of the photograph to be utilized so that density changes in various perimetric positions can be determined on one photograph. The target for the optogram subtended five degrees vertically at the eye. A Wooster Mk 111 model 1 recording mi-crodensitometer was used to measure trans-missivities on the negative. The measuring beam was considerably larger than the grain side of the emulsion so that smooth traces were obtained. The negative was scanned at the center of the bar (Fig. 1, X-X) on either size as shown by the four arrows in order to allow for changes in fundus reflectivity in the vertical meridian. At the end of each experiment, a photograph of the fundus was taken through the target used for producing the optogram; this served as a marker for lining up the position of optograms on the microdensitometer.
To determine any photographic density differences, a calibration of the exposure is needed. It is obtained by comparing the actual density of the wedge described above with its density on the negative projected on the bleached portion or optogram because we wish to match the filter added in the form of rhodopsin to one part of the fundus with a known filter density. Let XX represent a densitometric scan through the center of the optogram, which avoids the white reflex. The transmissivities measured along XX are indicated by the suffix, X. The edge of the

VOL. 75, NO. 5 RHODOPSIN DENSITY AND VISUAL THRESHOLD 827
optogram was avoided because blurring may occur owing to involuntary movements of the eye during the bleaching exposure. Let the transmissivity along XX of filter Px on the negative be Wix, and increase from left to right in steps W2x to W5x (positions P2
to P 5 ) . Let the transmissivities of the negative on either side of a filter be Sax to Sfx. Separation of the filters comprising the wedge aids in the identification of each filter on the recorded scan obtained from the microdensitometer, allows for variation in fundus reflectivity to be taken into account during the determination of transmissivities for various positions, and determines the perimetric angle, provided the wedge always occupies the same position in the subject's visual field. Now, let Six be defined as the transmissivity at Ριχ, were no filter present, and equal to (Sax + Sbx)/2. Transmissivities S2x-5x are defined similarly. With marked variation in fundus reflectivity across the negative, this simplifying assumption cannot be made, each filter being taken as a separate unit, measurements being made on each side of each filter Ριχ-5χ. The density difference on the negative resulting from the interposition in the photographing light of the filter on the left (Ριχ) is defined as log Wix-log Six. The measured density differences for Ρ2χ-5χ may be determined in a similar manner. The density differences for positions Ραχ-5χ were plotted against the filter densities for Pi_5, giving a straight line.
The negative seems to make it easy to compare the transmissivities vertically across the edge of the optogram and to make a match horizontally across the filters in order to determine the difference between bleached and unbleached parts of the retina ; but variations in fundus reflectivity occur vertically as well as horizontally. Microdensitometric scans along AA and BB on either side of the optogram and equidistant from XX enable one to allow for this in a manner strictly analogous to the procedure outlined above. It is then possible to set off the double density differences as between the optogram and un-
bleached parts of the retina for various retinal positions along the calibration curve, and so to convert photographic into retinal density differences.
Accuracy—In order to determine the accuracy of the technique, five estimates were carried out in one patient, three on one occasion and two eight weeks later. It was possible to reproduce the results with an accuracy of approximately 0.005 density unit.
RESULTS
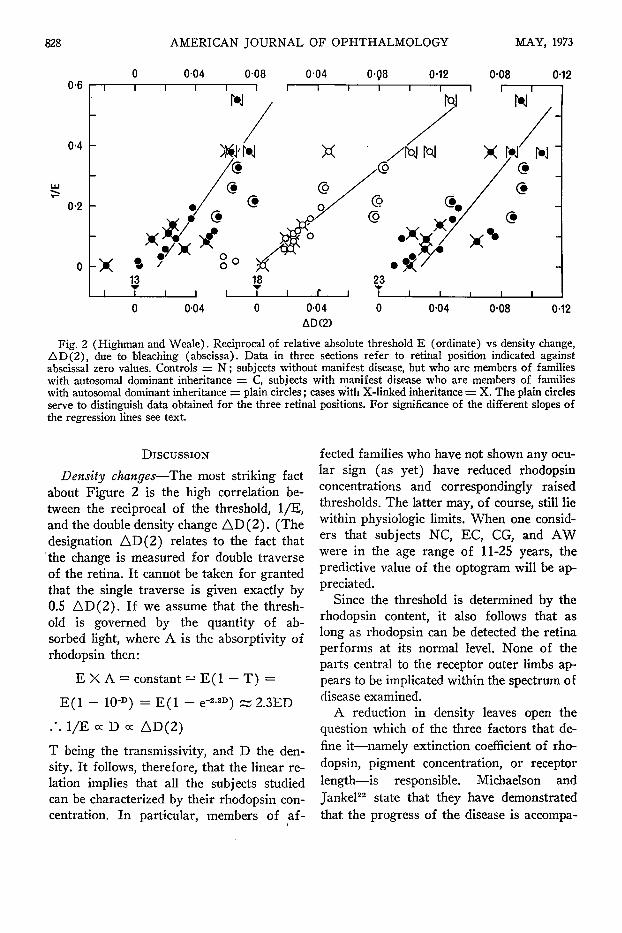
Figure 2 shows results obtained at three retinal positions, namely at 13, 18 and 23 degrees, respectively. These results are tabulated in Table 1. Density differences measured across the optogram are plotted along the abscissa, the differences increasing towards the right. The ordinate represents the reciprocals of the absolute thresholds (in relative units) normalized to a pupillary diameter of 4 mm. The lines represent regression coefficients.
Figure 3 shows experimental data obtained after regeneration had continued for three minutes. Results for two normal subjects (N: C> 3 ) . t w o members of a dominant autosomal family (Patients NC: O and CG: ^ ), one X-linked case with manifest disease (Patient CW: H ) , and one dominant autosomal case with manifest disease (Patient JC: <►) are shown for five retinal locations of Figure 1. These data are corrected for the edema effect as discussed below. The horizontal line indicates the level of regeneration achieved after. three minutes in the dark after normal retinae had been maximally photolysed.18
Figure 4 gives results obtained when the bleaching situation was as for Figure 2, but the photographing light was not blue-green, but red. As stated earlier, this isolates the edema effect. The empty symbols represent the state of affairs immediately after bleaching, the filled ones represent the effect observed after three minutes' dark adaptation. The measured density difference is plotted against perimetric angle.
828 AMERICAN JOURNAL OF OPHTHALMOLOGY MAY, 1973
0-12
0·04 0-04 AD (2)
0·04 0·08 0-12
Fig. 2 (Highman and Weale). Reciprocal of relative absolute threshold E (ordinate) vs density change, AD(2), due to bleaching (abscissa). Data in three sections refer to retinal position indicated against abscissa! zero values. Controls = N ; subjects without manifest disease, but who are members of families with autosomal dominant inheritance = C, subjects with manifest disease who are members of families with autosomal dominant inheritance = plain circles ; cases with X-linked inheritance = X. The plain circles serve to distinguish data obtained for the three retinal positions. For significance of the different slopes of the regression lines see text.
DISCUSSION
Density changes—The most striking fact about Figure 2 is the high correlation between the reciprocal of the threshold, 1/E, and the double density change A D ( 2 ) . (The designation AD(2) relates to the fact that the change is measured for double traverse of the retina. It cannot be taken for granted that the single traverse is given exactly by 0.5 AD (2) . If we assume that the threshold is governed by the quantity of absorbed light, where A is the absorptivity of rhodopsin then:
E X A = constant = E ( l - T) =
E ( l - 10-D) = E ( 1 - e r
. · . 1/E oc D oc AD(2)
3) Ä 2.3ED
T being the transmissivity, and D the density. It follows, therefore, that the linear relation implies that all the subjects studied can be characterized by their rhodopsin concentration. In particular, members of af
fected families who have not shown any ocular sign (as yet) have reduced rhodopsin concentrations and correspondingly raised thresholds. The latter may, of course, still lie within physiologic limits. When one considers that subjects NC, EC, CG, and AW were in the age range of 11-25 years, the predictive value of the optogram will be appreciated.
Since the threshold is determined by the rhodopsin content, it also follows that as long as rhodopsin can be detected the retina performs at its normal level. None of the parts central to the receptor outer limbs appears to be implicated within the spectrum of disease examined.
A reduction in density leaves open the question which of the three factors that define it—namely extinction coefficient of rhodopsin, pigment concentration, or receptor length—is responsible. Michaelson and Jankel22 state that they have demonstrated that, the progress of the disease is accompa-

VOL. 75, NO. S RHODOPSIN DENSITY AND VISUAL THRESHOLD 829
TABLE 1 DOUBLE DENSITY DIFFERENCE VS THRESHOLD
Patient, Sex, and Age in Years
Normal group: GM-M-21 CM-F-21 LA-F-26
13°
.075
.067
.063
Group from dominant autosomal families: EC-M-16 AW-F-25 CG-F-1S NC-F-11
Group with X-linked CW-F-23 ST-F-14 CT-F-15 TW-F-9 CM-F-4S JN-F-42 RG-F-18
.068
.055
.065
.079
AD (2)*
18°
.113
.127
.101
.084
.078
.045
.080
inheritance and manifest disease: .061 .025 .022 .047 .033 .011
- . 0 1 9
.047
.030
.024
.024
.022
.018
.004
23°
.087
.093
.107
.096
.088
.095
.048
.073
.040
.022
.064
.030
.031
.020
Group with autosomal dominant inheritance and manifest disease: MC-M-12 FOM-4 KG-F-12 ML-F-21 SL-M-23 JC-F-3S DC-M-40 SB-F-7 JB-F-12
.052
.038
.049
.037
.020
.027
.002
.017
.003
.027
.042
.035 .035 .018 .019
- . 014 - .022 - .022
.073
.052
.076 .048 .040 .015 .018 .022 .010
1/Threshold for 4 mm Pupil
0.38 0.55 0.378
0.328 0.165 0.26 0.217
0.38 0.138 0.110 0.0834 0.0575 0.0899 0.003
0.119 0.195 0.1 0.157 0.0575 0.093 0.019 0.0331 0.0020
* AD (2) = double density difference.
nied by a shortening of the rods. This suggests that the primary seat of the lesion lies in the pigment epithelium the rate of the phagocytic activity of which clearly exceeds the rate of formation of the receptors.23
Figure 4, taken in conjunction with earlier data,12 shows that at high intensities the increase in the amount of light reflected from the fundus as due to the photolysis of the light-absorbing pigment in front of it is partly offset by a darkening which can be observed (e.g., also in the cat24 where there is a tapetum). In other words, the data in Figure 2 should be displaced to the right by the amounts given in Figure 4. This was not
done, however, in this case as it affects neither the correlation factors nor the regression coefficients. The reason that the regression coefficient for the data at 18 degrees has a lower slope than at the other locations is due to the rod population25 being densest at about 18 degrees.
Regeneration—The correction was, however, applied for the calculation of the fraction of pigment regenerated in the course of three minutes (Fig. 3) . The line represents data obtained on normal eyes following flash bleaching18 and prolonged bleaching,19-20 a point disregarded by Alpern,21 who believes that the rate is affected by the expo-

830 AMERICAN JOURNAL OF OPHTHALMOLOGY MAY, 1973
100
Έ CO <*• ■σ ω +■· CO i_ ω c ω en
c ω ε g)
'ο.
T r T r T r
50
0
c %
<►
<►
a c
6
1 15 20
Degrees temporal retina Fig. 3 (Highman and Weale). Fraction of pigment regenerated during three minutes' dark-adaptation
following an exhaustive bleaching exposure. Normal subjects = t> 3 , subjects with manifest disease and autosomal dominant inheritance = <►, subjects without manifest disease who are members of families with autosomal dominant inheritance = φ ^ , patients with X-linked inheritance" and manifest disease = Q. Horizontal line represents mean level from well-controlled experiments reported earlier.
sure time preceding regeneration. It is clear that the rate of regeneration in all the subjects examined agrees with the earlier work and corresponds to a time-constant of four minutes.
CONCLUSION
The results seem to us to show that the initial stages of retinitis pigmentosa of the types we have examined follow a concordant pattern. The limiting factor insofar as visual function is concerned is the amount of rho-dopsin present in the area under test. This seems to be governed by the reduced length of the receptors and suggests that the rate of
formation of rods no longer matches that of phagocytic activity of the pigment epithelium. We cannot rule out the possibility that there are cases where the lesion is not as peripheral and/or exclusive as we found it to be the case, although we have to emphasize that we have not knowingly selected any of our subjects. Another point that has emerged is that if our results are typical of the disease, then they differ fundamentally from what Dowling and Sidman26 observed for the rat. In that species the early stage is characterized by hyperdensity of the visual pigment. However, as the rat pigment is atypical among mammals,27 it seems even

VOL. 75, NO. S RHODOPSIN DENSITY AND VISUAL THRESHOLD 831
0-02
T3 a> — o < 0-02
0-04-
1 I
- o - o
I I
1 '
■
o o D
1 .
1 1 1
■ •
o D O
1 1 1
1 '
■
•
D
8 1 1
1 1
*
•
§ :
1 1
15 20 Degrees temporal retina
Fig. 4 (Highman and Weale). Changes in apparent density measured with red light. Open symbols = immediately after bleaching, filled symbols = three minutes later. Normal = circles, cases with X-linked inheritance and manifest disease = squares and diamonds.
less advisable than usual to argue from one species to another.
S U M M A R Y
Optograms were studied in patients with retinitis pigmentosa, in subjects whose family members had this disease, and in normal controls. The abnormal types included X -linked autosomal dominant transmission, and subjects with manifesting and non-manifesting disease. T h e optogram was photographed and the difference between the bleached and unbleached parts of the retina expressed in terms of rhodopsin density. A high correlation was found between this value and the reciprocal of the absolute threshold of each subject. The rate of rhodopsin regeneration was normal in all cases studied. Measurements were also obtained on the edema effect. W e conclude that in the initial and mid-term stages of the disease the limits to visual function are set by the rhodopsin density of the retina.
ACKNOWLEDGMENT
We thank everyone who participated in this study, also Mr. Alan Bird, F.R.C.S., Moorfields Eye Hospital, who spared no effort in sending us patients.
R E F E R E N C E S
1. Carr, R. F., and Ripps, H. : Rhodopsin kinetics and rod adaptation in Oguchi's disease. Invest. Ophth. 6:426, 1967.
2. Carr, R. F., Ripps, H., Siegel, I. M., and Weale, R. A. : Rhodopsin and the electrical activity of the retina in congenital night blindness. Invest. Ophth. S :497, 1966.
3. : Visual functions in congenital night blindness. Invest. Ophth. 5:508,1966.
4. Weale, R. A. : Fundus reflectometry. Ophthal-mologica. In press.
5. Abelsdorff, G. : Die ophthalmoskopische Erkennbarkeit des Sehpurpurs. Z. Psychol. Physiol. Sinnesorg. 14:77, 1897.
6. Rushton, W. A. H. : Visual pigments in man. In Dartnall, H. J. A. (éd.) : Handbook of Sensory Physiology, vol. 71. Chemistry of Vision. Berlin, Springer-Verlag, 1972, p. 364.
7. Kühne, W. : Ueber die Darstellung von Opto-grammen im Froschauge. In Untersuchungen aus dem physiologischen Institute der Universität Heidelberg. 1:225, 1878.

832 AMERICAN JOURNAL OF OPHTHALMOLOGY MAY, 1973
8. Weale, R. A. : A photographic method for in vivo studies of visual pigments. Proc. XX Internat. Physiol. Cong. Brussels, 1956, p. 951.
9. : Observations on photochemical reactions in living eyes. Brit. J. Ophth. 41:461, 1957.
10. Ito, H., Ozawa, K., and Mizuno, K. : Red-free light fundus photography—rhodopsin photography. Jap. J. Clin. Ophth. 22:1243, 1968.
11. Highman, V. N. : A photographic technique for the measurement of optograms. Proc. Roy. Soc. Med. 64:940, 1971.
12. Weale, R. A. : Photo-chemical changes in the dark-adapting human retina. Vis. Res. 2:25, 1962a.
13. : Photochemistry of the human central fovea. Nature (Lond.) 218:238, 1968.
14. Von Graefe, A. : Ueber die Untersuchung des Gesichtsfeldes bei amblyopischen Affectionen. von Graefe's Arch. Ophth. 2(2) :258, 1856.
15. : Exceptionelles Verhalten des Gesichtsfeldes bei Pigmententartung der Netzhaut, von Graefe's Arch. Ophth. 4:250, 1858.
16. Arden, G. B., and Fojas, M. R.: Electrophys-iological abnormalities in pigmentary degenerations of the retina. Arch. Ophth. 68:369, 1962.
17. Bird, A. C, and Blach, R. K. : X-linked recessive fundus dystrophies and their carrier states. Trans. Ophth. Soc. U.K. 90:127, 1970.
18. Ripps, H., and Weale, R. A.: Rhodopsin regeneration in man. Nature (Lond.) 222:775, 1969.
19. Weale, R. A.: Further studies of photochemical reactions in living human eyes. Vis. Res. 1:354, 1962.
20. : On an early stage of rhodopsin regeneration in man. Vis. Res. 7:819, 1967.
21. Alpern, M. : Rhodopsin kinetics in the human eye. J. Physiol. (Lond.) 217:447, 1971.
22. Michaelson, I. C, and Jankel, N. : Personal communication.
23. Young, R. W. : An hypothesis to account for a basic distinction between rods and cones. Vis. Res. 11:1, 1971.
24. Weale, R. A. : Photochemical reactions in the living cat's retina. J. Physiol. (Lond.) 122:322, 1953.
25. 0sterberg, G. : Topography of the layer of rods and cones in the human retina. Acta Ophth. Rbh. Suppl. 6:1,1935.
26. Dowling, J. E., and Sidman, R. L. : Inherited retinal dystrophy in the rat. J. Cell Biol. 14:73, 1962.
27. Lewin, D. R., Thompson, J. N., Pitt, G. A., and Howell, J. M. : Blindness resulting from vitamin A deficiency in albino and pigmented guinea pigs and rats. Int. J. Vit. Res. 40:270, 1970.
O P H T H A L M I C M I N I A T U R E
The gong sounded, Kration advanced, smiling. T o AH, he looked like a man half-formed out of red mist. H e thought : "If I do not get him within five minutes, this eye will close, and then I shall be a man fighting in the dark."
The thought was indescribably terrifying. The curtain of mist was darkening. Now, by straining the muscles of his forehead and cheeks, and holding his mouth wide open, he could barely manage to see.
A voice cried : "Look out, Krat ion ! He ' s going to swallow you !" Gerald Kersh
The Last Battle W m . Heinemann, 1946