piata it romania 2008-2014 - prezentare rezumativa
TRANSCRIPT
7/21/2019 Piata It Romania 2008-2014 - Prezentare Rezumativa
http://slidepdf.com/reader/full/piata-it-romania-2008-2014-prezentare-rezumativa 1/5
Romania 2008-2014NACE CODES: 5821, 5829, 6201, 6202, 6203, 6209, 6311,
6312, 6399, 4741, 4651, 4742, 4743, 2620, 9511, 9512, 2630
www.manageranticriza.ro
Disclaimer
The market study was conducted by SC Business Management Technologies SRL and is the exclusive property of the company. The company has made everyeffort to ensure optimal data collection and processing but assumes no responsibility for any negative consequence or loss caused by certain decisions of the
beneficiaries, taken on the basis of the results of this study. The content may not be copied, disseminated, altered or published without the written consent of
the company.
Methodology : desk research (national and international databases, media, national statistics bodies, EUROSTAT etc.)
MARKET STUDY
IT MARKET - 2015
7/21/2019 Piata It Romania 2008-2014 - Prezentare Rezumativa
http://slidepdf.com/reader/full/piata-it-romania-2008-2014-prezentare-rezumativa 2/5
CONTACT: [email protected]; Phone no: 0723 627 200
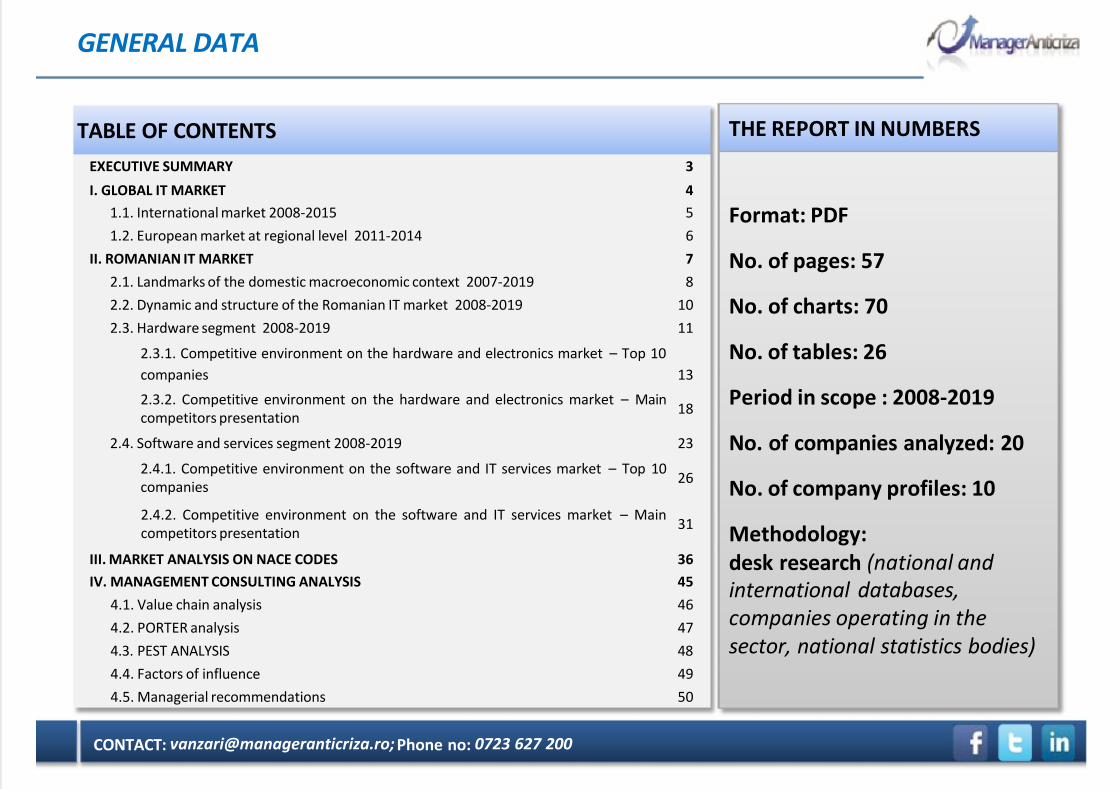
GENERAL DATA
TABLE OF CONTENTS
EXECUTIVE SUMMARY 3
I. GLOBAL IT MARKET 4
1.1. International market 2008-2015 5
1.2. European market at regional level 2011-2014 6
II. ROMANIAN IT MARKET 7
2.1. Landmarks of the domestic macroeconomic context 2007-2019 8
2.2. Dynamic and structure of the Romanian IT market 2008-2019 10
2.3. Hardware segment 2008-2019 11
2.3.1. Competitive environment on the hardware and electronics market – Top 10
companies 13
2.3.2. Competitive environment on the hardware and electronics market – Main
competitors presentation18
2.4. Software and services segment 2008-2019 23
2.4.1. Competitive environment on the software and IT services market – Top 10
companies26
2.4.2. Competitive environment on the software and IT services market – Main
competitors presentation31
III. MARKET ANALYSIS ON NACE CODES 36
IV. MANAGEMENT CONSULTING ANALYSIS 45
4.1. Value chain analysis 46
4.2. PORTER analysis 47
4.3. PEST ANALYSIS 48
4.4. Factors of influence 49
4.5. Managerial recommendations 50
Format: PDF
No. of pages: 57
No. of charts: 70
No. of tables: 26
Period in scope : 2008-2019
No. of companies analyzed: 20
No. of company profiles: 10
Methodology:
desk research (national and
international databases,
companies operating in the
sector, national statistics bodies)
THE REPORT IN NUMBERS
7/21/2019 Piata It Romania 2008-2014 - Prezentare Rezumativa
http://slidepdf.com/reader/full/piata-it-romania-2008-2014-prezentare-rezumativa 3/5
CONTACT: [email protected]; Phone no: 0723 627 200
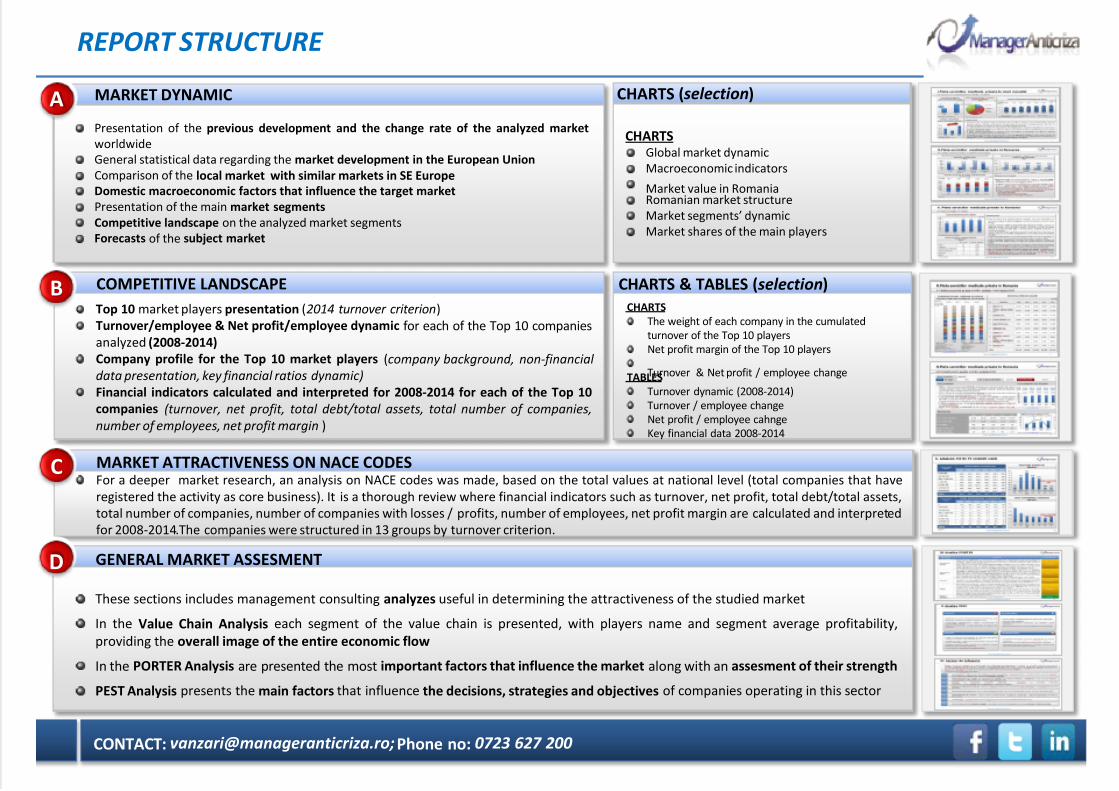
REPORT STRUCTURE
Presentation of the previous development and the change rate of the analyzed market
worldwide
General statistical data regarding the market development in the European Union
Comparison of the local market with similar markets in SE Europe
Domestic macroeconomic factors that influence the target market
Presentation of the main market segments
Competitive landscape on the analyzed market segments
Forecasts of the subject market
MARKET DYNAMIC
CHARTSGlobal market dynamic
Macroeconomic indicators
Market value in RomaniaRomanian market structure
Market segments’ dynamic
Market shares of the main players
CHARTS (selection)A
Top 10 market players presentation (2014 turnover criterion)
Turnover/employee & Net profit/employee dynamic for each of the Top 10 companies
analyzed (2008-2014)
Company profile for the Top 10 market players (company background, non-financial
data presentation, key financial ratios dynamic)
Financial indicators calculated and interpreted for 2008-2014 for each of the Top 10
companies (turnover, net profit, total debt/total assets, total number of companies,
number of employees, net profit margin )
COMPETITIVE LANDSCAPE
CHARTS
The weight of each company in the cumulated
turnover of the Top 10 players
Net profit margin of the Top 10 players
Turnover & Net profit / employee changeTABLES
Turnover dynamic (2008-2014)
Turnover / employee change
Net profit / employee cahnge
Key financial data 2008-2014
CHARTS & TABLES (selection)B
For a deeper market research, an analysis on NACE codes was made, based on the total values at national level (total companies that have
registered the activity as core business). It is a thorough review where financial indicators such as turnover, net profit, total debt/total assets,
total number of companies, number of companies with losses / profits, number of employees, net profit margin are calculated and interpreted
for 2008-2014.The companies were structured in 13 groups by turnover criterion.
MARKET ATTRACTIVENESS ON NACE CODESC
These sections includes management consulting analyzes useful in determining the attractiveness of the studied market
In the Value Chain Analysis each segment of the value chain is presented, with players name and segment average profitability,
providing the overall image of the entire economic flow
In the PORTER Analysis are presented the most important factors that influence the market along with an assesment of their strength
PEST Analysis presents the main factors that influence the decisions, strategies and objectives of companies operating in this sector
GENERAL MARKET ASSESMENTD
7/21/2019 Piata It Romania 2008-2014 - Prezentare Rezumativa
http://slidepdf.com/reader/full/piata-it-romania-2008-2014-prezentare-rezumativa 4/5
CONTACT: [email protected]; Phone no: 0723 627 200
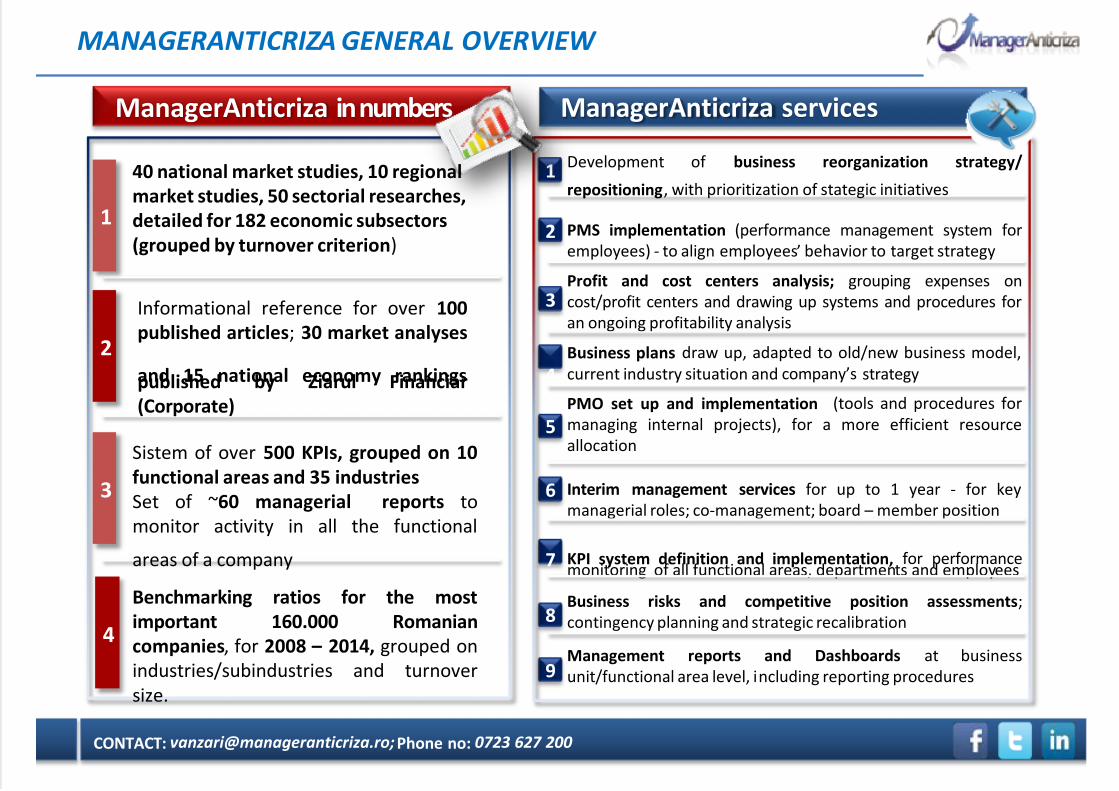
MANAGERANTICRIZA GENERAL OVERVIEW
ManagerAnticriza
services
Development of business reorganization strategy/
repositioning, with prioritization of stategic initiatives
PMS implementation (performance management system for
employees) - to align employees’ behavior to target strategy
Profit and cost centers analysis; grouping expenses on
cost/profit centers and drawing up systems and procedures for
an ongoing profitability analysis
Business plans draw up, adapted to old/new business model,
current industry situation and company’s strategy
PMO set up and implementation (tools and procedures for
managing internal projects), for a more efficient resource
allocation
Interim management services for up to 1 year - for key
managerial roles; co-management; board – member position
KPI system definition and implementation, for performancemonitoring of all functional areas, departments and employees
Business risks and competitive position assessments;
contingency planning and strategic recalibration
Management reports and Dashboards at business
unit/functional area level, including reporting procedures
1
2
3
4
5
6
7
8
9
ManagerAnticriza
in
numbers
1
2
3
4
40 national market studies, 10 regional
market studies, 50 sectorial researches,
detailed for 182 economic subsectors
(grouped by turnover criterion)
Informational reference for over 100
published articles; 30 market analyses
and 15 national economy rankingspublished by Ziarul Financiar
(Corporate)
Sistem of over 500 KPIs, grouped on 10
functional areas and 35 industries
Set of ~60 managerial reports to
monitor activity in all the functional
areas of a company
Benchmarking ratios for the most
important 160.000 Romanian
companies, for 2008 – 2014, grouped on
industries/subindustries and turnover
size.

7/21/2019 Piata It Romania 2008-2014 - Prezentare Rezumativa
http://slidepdf.com/reader/full/piata-it-romania-2008-2014-prezentare-rezumativa 5/5
08.12.2015CONTACT: vanzari@mana
geranticriza.ro; Phone no: 0723 627 200
NO. ROMANIA
Real estate
Beverages industry
Electrical energy
Pharma distribution
Pharma production
Food & Beverage
Media
Advertising
Textile industry
Cargo transportation
Passenger
transportation
Travel and Tourism
Infrastructure
1
2
3
4
5
6
7
8
9
10
11
12
13
NO. ROMANIA
IT
Building materials
Insurance
Construction
Gambling
Grain
Furniture
Automotive
Fuel distribution
Food imports
Dairy
Leasing
Fruits & Vegetables
14
15
16
17
18
19
20
21
22
23
24
25
26
NO. ROMANIA
Luxury
Legal services
Telecommunications
Tobacco
Meat production and
processingPublishing
Recruitment and
executive search
Retail
Private healthcare
Training
Audit and accounting
services
Mgmt. consulting
E-commerce
27
28
29
30
31
32
33
34
35
36
37
38
39
NO. REGIONAL STUDIES
Grain
Tourism and
hospitality
Passenger & Cargo
transportation
Dairy
Meat production and
processing
Textiles
IT
Telecommunications
Construction
Private healthcare
Pharma distribution
Retail
Furniture
1
2
3
4
5
6
7
8
9
10
11
12
13
AVAILABLE REPORTS