nclb – adequate yearly · pdf filenclb – adequate yearly progress ... 2012-13:...
TRANSCRIPT

NCLB ndash Adequate Yearly Progress
Education Commission of the States bull 700 Broadway Suite 1200 bull Denver CO 80203-3460 bull 3032993600 bull Fax 3032968332 bull wwwecsorg
Target Attendance and Graduation Rates
And How Rates Are Calculated By Kathy Christie
January 2005 The intent of the No Child Left Behind Act (NCLB) is to hold states accountable for improving performance of all students State definitions of adequate yearly progress (AYP) must include graduation rates for high schools and an additional indicator for middle and elementary schools States must determine whether schools make adequate yearly progress as measured by the following Progress by all students ndash as measured by annual statewide tests ndash toward proficiency in language artsreading and
math by 2013-14 The progress of each subgroup of students ndash racialethnic low income students with disabilities and those with
limited proficiency in English ndash toward proficiency on these tests Ninety-five percent participation of each subgroup in the tests Progress by all students on the two indicators graduation rates in the case of high schools and a state-determined
indicator for elementary and middle schools This StateNote reports on the last bullet ndash target attendance and graduation rates for all states and territories Table 1 ndash which will likely be the most useful in this document ndash illustrates the target attendance rate and graduation rate by state Table 2 provides further information on attendance rate calculations and describes the indicator used in states that do not use attendance Table 3 provides detailed information on how each state calculates its graduation rate (and other notes such as definitions of a dropout)
Sources Used Glossaries or explanatory text on report cards state technical documents Consolidated State Applications Accountability Workbooks US Department of Education Decision Letters administrative rules state statute other state publications and in several instances (when no other information was available) personal communication
Highlights Total number of states that use attendance 37 plus the District of Columbia Total number states that do NOT use attendance 13 Attendance rate target range 80 to 958 Graduation rate target range 50 to 95
Education Commission of the States 700 Broadway Suite 1200 Denver CO 80203-3460 3032993600 Fax 3032968332 wwwecsorg
bull Page 2 bull
TABLE 1 State Targets for Attendance and Graduation Rates State Target Attendance
Rate Target Graduation Rate Source
Alabama
95 or improvement from previous year
For 2004-05 10 drop-out rate or improvement from previous year
2004 Interpretive Guide Alabama State Accountability System
Alaska 85 5558 Consolidated State Application Accountability Workbook Amended with approval June 7 2004
Arizona
935 or 5 gain from previous year
705 Report Card httpwwwadeazgovsrcsReportCards54362004pdf
Arkansas
Schools for which the attendance rate is more than one standard deviation below the mean will not meet adequate yearly progress
If more than one standard deviation below the mean (8674167) school will not meet adequate yearly progress ndash unless improvement from previous year
Consolidated State Application Accountability Plan Amended June 2004 (Approved United States Department of Education (USDOE))
California Not Applicable (NA) Does not use attendance
Meet at least one 828 target + 01 one-year
change + 02 two-year
average change Meet an annual status
target that begins at 828 and increases at a rate similar to the schedule of annual measurable objectives in English language arts and mathematics
OR If no graduation rate is available or the primary mission of the school is to return students to the regular classroom in a comprehensive high school an alternate method is used
2004 AYP Criteria Summary httpwwwcdecagovtaacaydocumentsaprcriteria04pdf State of California Consolidated State Application Accountability Workbook Amended September 15 2004 (approved by USDOE)
Colorado NA
553 Report card
Connecticut NA
70 or annual improvement
Report card Consolidated State Application Accountability Workbook Modified August 13 2004 (approved by USDOE)
Delaware NA
75 School Year Graduation Target 2003-04 75
Report card
Education Commission of the States 700 Broadway Suite 1200 Denver CO 80203-3460 3032993600 Fax 3032968332 wwwecsorg
bull Page 3 bull
State Target Attendance Rate Target Graduation Rate Source
2004-05 765 2005-06 78 2006-07 795 2007-08 81 2008-09 825 2009-10 84 2010-11 855 2011-12 87 2012-13 885 2013-14 90
District of Columbia 90 or improvement of 1
Not yet available Report card
Florida NA
1 improvement
Florida Department of Education Fact Sheet httpwwwfldoeorgNCLBFactSheet-AYPpdf Consolidated State Application Accountability Workbook Revised March 26 2003 (approved by USDOE)
Georgia NA
60 or improvement Consolidated State Application Accountability Workbook
Hawaii NA
70 Report card
Idaho NA
90 by 2012-13 or improvement
Consolidated State Application Accountability Workbook
Illinois 88 increasing annually to a final target of 92 in 2013-2014
65 increasing annually as follows 2005 67 2006 69 2007 72 2008 75 2009 78 2010 80 2011 82 2012 84 2013-2014 85
Report card Accountability Workbook revised May 2004 (approved by USDOE)
Indiana 95 95 511 IAC 62-7-8 Other indicators
Iowa 958 in 2003-2004 At least one of the following criteria must be met 1 District rate is greater than or equal to state goal 2 District rate falls within Confidence Interval 3 District rate has improved from previous year
894 in 2003-2004 At least one of the following criteria must be met 1 District rate is greater than or equal to state goal 2 District rate falls within Confidence Interval 3 District rate has improved from previous year
2004 State Report card Personal communication Xiaoping Wang Iowa Department of Education
Education Commission of the States 700 Broadway Suite 1200 Denver CO 80203-3460 3032993600 Fax 3032968332 wwwecsorg
bull Page 4 bull
State Target Attendance Rate Target Graduation Rate Source
Kansas 90 or show improvement
75 or show improvement
Kansas Adequate Yearly Progress Revised Guidance Revised July 2004
Kentucky NA
2004 7550 2005 7775 2006 8000 (aligns with state statute of 5 or below dropout by 2006) 2007 8225 2008 8450 2009 8675 2010 8900 2011 9125 2012 9350 2013 9575 2014 9800 (Also recognizes and honors students with severe disabilities)
2004 NCLB Interpretative Guide Kentucky Department of Education (V 203 Updated August 13 2004)
Louisiana 90 or 1 improvement
90 (Non-dropout rate) Bulletin 111 Chapter 1 Sec 511 Consolidated Application Accountability Workbook Amended 2004 (approved by USDOE)
Maine 80 60 httpwwwedgovadminsleadaccountlettersacme2html
Maryland Improvement by at least one tenth of one percent Ultimate attendance rate of 94 by school year 2013-2014
81 in 2004 or show improvement over the previous year of one tenth of one percent Increasing intermediate targets in years 2005 2008 and 2011 with ultimate goal of 90 (3 standard for dropout rate)
httpwwwedgovadminsleadaccountstateplans03mdcsapdf Report Card
Massachusetts 92 or 1 increase compared to the prior year Next phase intermediate attendance and graduation rate targets for years 2005 and 2006 will be set by the state board in 2005
Interim indicator is the grade 12 ldquocompetency determinationrdquo rate ndashpassing state MCAS tests as a prerequisite for high school graduation ndash for 2003 and 2004 = 70 Will begin reporting graduation rates in 2006-07
Consolidated Application Accountability Workbook Revised August 12 2004 (approved by USDOE)
Michigan 85 2008-2009 90
80 for 2002-03 85 for 2005-06 90 for 2008-09 90 in effect through 2013-14 Or if over a period of two
Michigan Consolidated State Application Accountability Workbook Revised May 22 2003
Education Commission of the States 700 Broadway Suite 1200 Denver CO 80203-3460 3032993600 Fax 3032968332 wwwecsorg
bull Page 5 bull
State Target Attendance Rate Target Graduation Rate Source
years reduce by 10 the percentage of students representing the gap between the 85 target and the schoolrsquos actual rate (ldquosafe harborrdquo) (Example school attendance rate 70 85 minus 70 = 15 gap 15 times 10 = 15 School target becomes 715 in order to make AYP)
Minnesota 90 or improvement on track to meeting target
80 or growth toward it Minnesota Consolidated State Application Accountability Workbook Updated September 29 2004
Mississippi 93 (or an increase from prior year)
72 (or an increase from prior year)
Report card
Missouri Improvement Once 95 is reached the goal is to maintain
Standard for minimum graduation rate is 65 Other indicator is ldquoprogressing raterdquo
Consolidated Application Accountability Workbook Updated September 7 2004
Montana 80 or improvement from prior year
80 or improvement from prior year
Report Card Consolidated State Application Accountability Workbook Revised June 6 2003
Nebraska NA
8397 or progress toward it
Overview Q amp A on Adequate Yearly Progress wwwndestateneus2003SA2003PDFSAYPQApdf
Nevada 90 or improvement 50 or improvement A Guide to No Child Left Behind amp Adequate Yearly Progress Analyses in Nevada httpwwwdoenvgovnclbaypquestionsguidehtmother_indicatorsThe Nevada Adequate Yearly Progress Technical Manual June 11 2004 httpwwwdoenvgovnclbaypquestions ayp_manualpdf
New Hampshire 95 2007 752 2008-2010 792 2011 831 2012 87 2013 909 2014 95
Consolidated State Application Accountability Workbook for The State of New Hampshire Amended March 30 2004 Rhode Island School and District Performance and Accountability System August 2004 ndash School Performance Classifications An Explanation of the Process
Education Commission of the States 700 Broadway Suite 1200 Denver CO 80203-3460 3032993600 Fax 3032968332 wwwecsorg
bull Page 6 bull
State Target Attendance Rate Target Graduation Rate Source
New Jersey 90 Reduce dropout rate by 5 per year until the prior yearrsquos statewide dropout rate percentage is reached
Consolidated Application Accountability Workbook Revised August 16 2004 (approved by USDOE) District Report Card
New Mexico 92 75 New Mexico Public Education Department Questions and Answers About Adequate Yearly Progress (AYP)
New York NA 55 Personal communication Ira Schwart November 30 2004
North Carolina A 90 daily attendance rate or improvement (01 percentage point) from the previous year
A 90 graduation rate or improvement (01 percentage point) from the previous year
Report Card
North Dakota 93 899 Report Card A Guide to the 2003-04 AYP Report ND Department of Public Instruction
Ohio 93 or improvement over prior year
736 or improvement over prior year
Report Card
Oklahoma 15 standard deviations below the mean which is 912 or improvement from previous year
School completion component score that is one and a half standard deviations below the mean or improvement For 2000-2001 the state average graduation rate was 856 with a standard deviation of 112 Target is set at 15 standard deviations from the mean which is 688 ndash or improvement from previous year
Consolidated State Application Accountability Workbook August 26 2004
Oregon 920 Both of these indicators may be met by the two-year weighted average or the rate for the most current year
681 Both of these indicators may be met by the two-year weighted average or the rate for the most current year
2003-04 AYP Policy and Technical Manual May 2004 Revised July 2004
Pennsylvania 90 or any improvement from previous year
80 or any improvement from previous year
Pennsylvania Consolidated State Application Accountability Workbook Revised May 8 2004
Rhode Island 90 with a final goal of 95
95 by 2013-2014 for 2005 goal is 753 2003 target was 714 Interim years 2006 2007 753
Rhode Island School and District Performance and Accountability System August 2004 Report Card Rhode Island School and District
Education Commission of the States 700 Broadway Suite 1200 Denver CO 80203-3460 3032993600 Fax 3032968332 wwwecsorg
bull Page 7 bull
State Target Attendance Rate Target Graduation Rate Source
2008-2010 792 2011 831 2012 87 2013 909
Accountability System Technical Bulletin Revised and Updated October 13 2004 httpwwwridoenetassessmentNEWSAccountability_Technical_Bulletin_2004_FINALpdf
South Carolina 953 At least equal to or greater than prior year or three-year average greater than the prior year
Report Card
South Dakota 94 or improvement over prior year
90 or improvement over prior year
South Dakota Consolidated Application Accountability Workbook approved by USDOE on June 17 2004
Tennessee 93 or improvement over prior year
90 or improvement over prior year To show sufficient improvement districts and schools must be on track to meet the 90 graduation rate benchmark by 2013-14
No Child Left Behind Summary of Recent Changes (httpwww2statetnusk-12aypsumrecchangespdf) httpwww2statetnusk- 12aypprogress primerpdf
Texas 90 or improvement 70 or improvement httpwwwteastatetxusayp2004guide pdf
Utah 93 or improvement 857 Report Card
Vermont NA
75 Consolidated Application Accountability Workbook State of Vermont Revised December 2 2004
Virginia 94 (and for safe harbor only a performance target of 70 in science until the state has the capacity to disaggregate attendance data in 2003-2004 and graduation rate data in 2005-2006 or earlier)
57
Decision Letter on Request to Amend Virginia Accountability Plan July 8 2004 (amendments approved by USDOE) Consolidated Application Amended Accountability Workbook Revised May 26 2004
Washington Reduction of 1 of unexcused absences or improvement
66 increasing over the years until it reaches 85 in 2013-14
Washingtonrsquos Consolidated Application Accountability Workbook Amendments resubmitted June 16 2004 and approved June 18 2004
West Virginia 90 or improvement 80 or improvement
Report cards sect126-13-5 Annual Performance Measures for Accountability (West Virginia State Board Policy 2320) HB 4001 (2004)
Education Commission of the States 700 Broadway Suite 1200 Denver CO 80203-3460 3032993600 Fax 3032968332 wwwecsorg
bull Page 8 bull
State Target Attendance Rate Target Graduation Rate Source
Wisconsin 90 of the statewide average for 2001- 02 or growth
90 of the statewide average for 2001-02 or growth
Wisconsin Department of Public Instruction Consolidated State Application Accountability Workbook Last Revised May 14 2004 (approved by USDOE)
Wyoming NA
80 or improvement Wyoming Department of Education Press Release August 23 2004 Consolidated Application Accountability Workbook 2003-2004 Revised Submission August 11 2004 (approved by USDOE)
Territories American Samoa Unable to locate Unable to locate Puerto Rico NA
Does not use attendance
Unable to locate Puerto Rico Consolidated Application Accountability Workbook
Virgin Islands Unable to locate Unable to locate
TABLE 2 How Attendance Rates Are Calculated State Attendance Rate Details (where available) Source
Alabama Average Daily Attendance (ADA) is calculated by dividing the aggregate attendance days reported by the number of days that the school was in session during the reporting period ADA is converted to a percentage by dividing the ADA by the average daily membership for that period Reporting period is 40 days in length
Report card glossary
Alaska Aggregate daily attendance during the regular school year divided by the aggregate daily membership for the school year
Consolidated State Application Accountability Workbook amended with approval June 7 2004
Arizona Must meet attendance rate of at least 935 over the first 100 days of the academic year Calculated by dividing the average daily attendance by the average daily membership (ADM)
State of Arizona Consolidated State Application Accountability Workbook Revised August 16 2004 (approved by USDOE)
Arkansas Percent is calculated by dividing the three-quarter average daily attendance by the three-quarter average daily membership
Consolidated State Application Accountability Plan Amended April 2003 (approved by USDOE)
California Does not use attendance Other indicator 560 Academic Performance Index (API) or 1 point growth For 11 or more valid scores 560 API or 1 point growth OR For fewer than 11 valid scores Confidence Interval Adjusted API Table
2004 AYP Criteria Summary - Adequate Yearly Progress (PDF) Summary of criteria for 2004 Adequate Yearly Progress
Colorado Does not use attendance httpwwwcdestatecousaypotherindasp
Education Commission of the States 700 Broadway Suite 1200 Denver CO 80203-3460 3032993600 Fax 3032968332 wwwecsorg
bull Page 9 bull
State Attendance Rate Details (where available) Source
Other indicator Overall and within each sub-group 1 of students must score advanced in reading and math
Connecticut Does not use attendance Other indicator 70 basic or above in writing or improvement
Consolidated State Application Accountability Workbook Modified August 13 2004
Delaware Does not use attendance Other indicator In 2004 the Other Academic Indicator (OAI) was changed to an increase in the average of scale scores for students performing at Performance Levels 1 and 2 in reading and mathematics combined or a decrease in the percentage of students performing at Performance Level 1 in reading and mathematics combined
Educational Accountability A Partnership of School Community and Family Delaware Department of Education
District of Columbia Attendance calculated by dividing the total daily attendance over the full academic year by the total daily enrollment taken over the same period Schools are required to record and report both daily attendance and enrollment
Consolidated State Application Accountability Workbook Revised June 3 2003
Florida Does not use attendance Other indicator 1 increase in performance on the writing assessment
Consolidated State Application Accountability Workbook Revised March 26 2003 (approved by USDOE)
Georgia Does not use attendance Other indicator Middle Grades Writing Assessment (MGWA) The 2003-04 AYP process allowed elementary and middle schools to choose from a menu of nine other indicators The selected indicator(s) are reported in detail for each school in an LEA and then at the state level
Consolidated State Application Accountability Workbook revised August 12 2004 (approved by USDOE)
Hawaii Does not use attendance Other indicator Retention rate (target less than 3) A Elementary Schools The percentage of students for the target school year in grades 1 through 5 (or 6) whose grade level is the same or lower in the subsequent school year B Middle Intermediate or multi-level ElementaryIntermediate Schools The percentage of students for the target school year in the schools highest grade (8 or 9) whose grade level is the same or lower in the subsequent school year
httparchk12hiuspdfNCLBAYP_Grad-Retentionpdf
Idaho Does not use attendance Other indicator Language usage test For 2003-04 the goal was for the percentage of proficient or better to improve hold steady or be above 66 when compared to 2002-03 results Until graduation rate data is available this goal is a proxy for graduation rate as well
Consolidated State Application Accountability Workbook August 2004
Illinois Attendance rate is the aggregate days of student attendance divided by the sum of the aggregate days of student attendance and aggregate days of student absence multiplied by 100
Accountability Workbook Revised May 2004 (approved by USDOE June 14 2004)
Education Commission of the States 700 Broadway Suite 1200 Denver CO 80203-3460 3032993600 Fax 3032968332 wwwecsorg
bull Page 10 bull
State Attendance Rate Details (where available) Source Attendance Rate = (A (A + B) x 100 A = Sum of the number of students in attendance each school day of the year B = Sum of the number of students absent each school day of the year School districts that submit raw data on time are asked to verify their attendance rates when they are computed Edit checks are built into the process to ensure accuracy for example schools submitting data that result in attendance rates outside of an acceptable range (70-99) are contacted for verification
Indiana Defined under 511 IAC 1-3-3 as the aggregate days of attendance in a school or school district divided by the aggregate days of enrollment Attendance information is collected by student subgroup through the Student Test Number System Attendance rate is included (in the aggregate) for AYP and disaggregated (as necessary) for use when applying the exception clause to make AYP Sec 3 (a) For purposes of computing ADA for the regular school year school corporations shall count all students enrolled in grades K through 12 (b) Attendance shall be taken twice during each full student instructional day once in the morning session and once in the afternoon session A student in attendance during any part of the day up to and including one-half of the day shall be counted as one-half A student in attendance for more than one-half of the day shall be counted as one A full student instructional day shall be counted as one in determining the number of student instructional days in the regular school year
(c) Attendance shall be taken once during each partial student instructional day A student in attendance during any part of the day shall be counted as one-half A partial student instructional day counts as one-half in determining the number of student instructional days in the regular school year
Consolidated State Application Accountability Workbook Amended May 14 2004 (approved USDOE May 20 2004) 511 IAC 1-3-3 Average daily enrollment
Iowa Average Daily Attendance Rate is defined as the aggregate days of student attendance in a school or school district divided by the aggregate days of enrollment
Consolidated State Application Accountability Workbook Revised June 2003 approved by USDOE February 2004
Kansas Determined by dividing the average daily attendance by the total average daily membership
Report Card 2003-2004
Kentucky Does not use attendance rate Other indicator For elementary and middle schools the Commonwealth Accountability Testing System (CATS) Accountability Index which covers other content areas as well as reading and math For schools or districts that contain elementary middle and high school levels both the Accountability Index and graduation rate are used for the other academic indicator For elementary and middle schools meeting the requirement for the other academic indicator is
2004 NCLB Briefing Packet Report card
Education Commission of the States 700 Broadway Suite 1200 Denver CO 80203-3460 3032993600 Fax 3032968332 wwwecsorg
bull Page 11 bull
State Attendance Rate Details (where available) Source defined as an Accountability Index of 80 or higher OR Accountability Index equal to or greater than the biennial
goal for the corresponding year OR Accountability Index that exceeds that of the prior year
Louisiana One-year evaluations compared to a two-year baseline For
NCLB state is using a one-year measure Attendance data is collected at the student level must pass multiple edit rules and is substantiated through verification reports All attendance data is audited and validated through a two-stage process First a ldquopaperrdquo review is conducted followed by an onsite audit of a random sampling of schools as well as those schools showing any data irregularity
Consolidated State Application Accountability Workbook Amended 2004 (approved by USDOE)
Maine Unable to locate Maryland Attendance rate reflects the percentage of students present in
school for at least half the average school day during the school year The percent average daily attendance is calculated by dividing the aggregate number of students in attendance by the aggregate number of students in membership for the September to June school year For reporting purposes attendance and absence are counted in half-day day units A student is counted as present for half a day if in attendance any part of the school day A student is counted as absent for half a day if absent any part of the school day Students in attendance for more than half a day are counted as present for a full day Students absent for more than half a day are counted as absent for a full day Students are counted present only if actually at school or if at another place at a school activity sponsored by the school and supervised by a member of the school staff The following definitions are the minimum standards for attendance as defined by the state board Local boards may set more stringent standards A student is counted present only if actually at school or present at another place at a school activity that is sponsored by the school and is personally supervised by a member or members of the school staff This may include authorized independent study work-study programs field trips athletic events contests music festivals student conventions instruction for homebound students and similar activities when officially authorized under policies of the local school board It does not include making up school work at home or activities supervised or sponsored by private groups or individuals Excused (lawful) and unexcused (unlawful) absences are both counted as absences
httpwwwedgovadminsleadaccountstateplans03 mdcsapdf
Massachusetts Attendance and enrollment data are taken directly from the Student Information Management System (SIMS) and are an indication of the number of days a student attended school in that district and the number of days a student was enrolled in that district respectively The attendance rate is calculated by dividing the total number of days a student attended school by
School Leadersrsquo Guide to the 2004 Cycle III Accountability and Adequate Yearly Progress (AYP) Reports Updated October 18 2004
Education Commission of the States 700 Broadway Suite 1200 Denver CO 80203-3460 3032993600 Fax 3032968332 wwwecsorg
bull Page 12 bull
State Attendance Rate Details (where available) Source the total number of days enrolled Students are included in district-level attendance rates if they attended any school in the district for any portion of the school year As a result it is possible for a student to be included in multiple schools statewide However students are only included in the calculation for a school if they are enrolled in that school on October 1 and at the end of the school year Students are not counted towards multiple schools and only the amount of time a student spent at the school in which they were enrolled on October 1 is factored into the calculation Therefore all students in a district are counted towards the district AYP attendance rate but not all of the students contributed to the attendance rate of a particular school because a student might not have been enrolled in that district on October 1 Typically full membership is 180 days although some schools have longer requirements The attendance rate required to make AYP in 2004 was 92 or improvement of at least 1 from the previous year Determinations are only made for groups of six or more students
Michigan Each studentrsquos total possible number of attendance days that year based on the studentrsquos date of enrollment
Each studentrsquos actual days of attendance out of the total attendance days possible for that student
A schoolrsquos attendance rate will be the aggregate total number of days of actual attendance for all students in the school divided by the aggregate total number of possible days of attendance for all students based upon each studentrsquos date of enrollment times 100 to obtain a percentage figure
Michigan Consolidated State Application Accountability Workbook Revised May 22 2003
Minnesota Formula for attendance rate is the Average Daily Attendance (ADA) divided by the Average Daily Membership (ADM) The ADA and ADM for each grade school or district are added together and the resulting figures are used for each grade school or district summary (Grade level ADAGrade Level ADM) multiplied by 100 = Attendance Rate for that grade This will be used to calculate an average attendance rate for the school or district ADA is normally computed by taking the number of days a student was marked in attendance and dividing by the number of instructional days reported for that grade and school ADM is normally computed by taking the number of days the student was reported as enrolled and dividing by the number of instructional days reported for that grade and school Slight variations in the ADA and ADM computations are made for students whose membership and attendance is reported in terms of hours
Minnesota Consolidated State Application Accountability Workbook Updated September 29 2004
Mississippi Attendance rate is calculated by dividing the average daily attendance across months 1-9 by the average net membership across months 1-9 and multiplying by 100 That yields an average attendance rate for the school year
Mississippi Statewide Accountability System as Approved by the US Department of Education March 25 2004
Education Commission of the States 700 Broadway Suite 1200 Denver CO 80203-3460 3032993600 Fax 3032968332 wwwecsorg
bull Page 13 bull
State Attendance Rate Details (where available) Source Consolidated State Application Accountability Workbook
Missouri Number of hours attended divided by number of hours enrolled
Consolidated Application Accountability Workbook Updated Sept 7 2004
Montana Montana Office of Public Instruction collects ldquopresentrdquo and ldquoabsentrdquo information at two points in the school year October and February This process establishes the ldquoaverage daily attendancerdquo or ADA as required by Administrative Rules of Montana 1015103(3) and 1020102(6)
Consolidated State Application Accountability Workbook Revised June 6 2003
Nebraska Does not use attendance Other indicator tatewide writing assessments ndash improvement at Grade 4 62 at Grade 8 61 (The state goal is the percent of students at the proficient and advanced levels of performance) Each group school and district must meet the state goal or demonstrate progress (any increase in the percentage of students at the proficient level from the previous year) to have made AYP for this other academic indicator
Overview Q amp A on Adequate Yearly Progress wwwndestateneus2003SA2003PDFSAYPQApdf
Nevada ADA refers to the average percentage of students present in a school over the course of the year The target goal for ADA is 90 or improvement from previous year
A Guide to No Child Left Behind amp Adequate Yearly Progress Analyses in Nevada httpwwwdoenvgovnclbaypquestionsguidehtmother_indicators
New Hampshire Defined as the Average Daily Membership (ADM) reported to the NH Department of Education
Consolidated State Application Accountability Workbook for The State of New Hampshire Amended March 30 2004 (approved USDOE)
New Jersey Attendance is calculated by multiplying the number of students on roll by the number of days present divided by the number of students on roll multiplied by 180 the minimum possible number of days for attendance (NJAC 63-92) Student Attendance Rate Calculated by dividing the sum of days present in each grade level by the sum of possible days for all students in each grade The school and state totals are the sum of days present in all applicable grade levels divided by the total possible days for all students
Consolidated State Application Accountability Workbook Revised August 16 2004 State Report Card
New Mexico Currently the state data management system relies upon district-assigned student identification numbers This practice tends to cause duplication and confusion however the New Mexico State Department of Education (NMSDE) statistician and an externally contracted statistician match every assessment data entry by name student ID number and date of birth During the 2003 legislative session the New Mexico Legislature appropriated funds for the development and implementation of a statewide unique student identification system When implemented the NMSDE will be able to match assessment and student data management systems to determine attendance enrollment participation etc The statewide student identification system will ensure validity and
Consolidated State Application Accountability Workbook Revised May 16 2003
Education Commission of the States 700 Broadway Suite 1200 Denver CO 80203-3460 3032993600 Fax 3032968332 wwwecsorg
bull Page 14 bull
State Attendance Rate Details (where available) Source reliability through an ongoing audit process
New York Currently does not use attendance Other indicator Grades 4 and 8 science scores The science tests will be replaced by annual attendance rate no later than the 2006ndash07 school year
Accountability Peer Review New York State January 6 2003 Revision (Accountability plan approved by USDOE) Personal communication Ira Schwart New York State Education Department November 30 2004
North Carolina The average percentage of students who attend school daily Calculated by dividing the final Average Daily Attendance (ADA) in the school year by the final Average Daily Membership (ADM) in the school year
A student is counted as attending school if heshe is present on days when school is in session present at another activity sponsored by the school as part of the schools program or supervised by a member of the school staff This percentage is reported as an average since student attendance changes slightly from one day to the next Pre-kindergarten students are not included in the attendance averages District and state counts are the averages for schools in the same grade range category (elementary middle high combined elementary middle and high combined elementary and middle or combined middle and high)
Report Card North Carolina Department of Public Instruction Financial amp Business Services School Business Division Principals Monthly Report 2003-04
North Dakota Total actual attendance days for all enrolled students in the grades tested (divided by) total enrolled days for all enrolled students in the grades tested Attendance data are collected through the statersquos pupil membership reporting system A statistical test is applied to ensure confidence that any AYP determination is reliable
A Guide to the 2003-04 AYP Report ND Department of Public Instruction
Ohio The ratio of the number of enrolled students actually in attendance during the course of a school year to the number of enrolled students that school year
Attendance rate is calculated by multiplying the sum of the total aggregate days of attendance times one hundred and then dividing that product by the sum of the total aggregate days of membership plus the total aggregate days of unexcused absences
The total aggregate days of membership is the sum of the total aggregate days of attendance plus the total aggregate days of excused absence
Total aggregate days (of membership attendance excused absence and unexcused absence) are the sum of the days for the school district for all students in grades kindergarten through 12 grade including those students who the district is instructing and students who are residents of the district and are attending an educational service center joint vocational
OAC 3301-18-01 httpwwwodestateohusemis
Education Commission of the States 700 Broadway Suite 1200 Denver CO 80203-3460 3032993600 Fax 3032968332 wwwecsorg
bull Page 15 bull
State Attendance Rate Details (where available) Source school district or a postsecondary institution
Attendance days for a student are defined as the actual number of days the student was in attendance in the district for the entire year
Attendance days include in-school suspensions school sponsored field trips and the number of days a student received instructional services from the school district while expelled or while serving an out-of-school suspension
The Attendance rule allows a suspended or expelled student who receives instructional services during the suspension or expulsion to be counted as in attendance An enrolled student is defined in Division C of Section 331703 of the Ohio Revised Code as those pupils who are attending school those who have attended school during the current school year and are absent for authorized (excused) reasons those students described by division G (a scholarship student of a pilot project district) of this section and those handicapped children currently receiving home instruction
Oklahoma Total Days Attended divided by Total Days Membership
Consolidated State Application Accountability Workbook August 26 2004
Oregon Weighted average of enrollment multiplied by times the attendance rate for each year The attendance rate is the percentage of students attending in grades 1-12 and is calculated as the ratio of Total Days of Attendance to Total Daily Membership Total Days Attendance is calculated by summing the number of students present in the school each day across all the days of the school year
Total Daily Membership is the total number of days that could have been attended by students in the school It is calculated by summing the number of students enrolled in the school on each day across all the days of the school year
Enrollment is the number of students in membership in the school on October 1
Attendance is represented by Satisfactory student behavior rating on Oregon School and District Report Cards
2003-04 AYP Policy and Technical Manual May 2004 Revised July 2004
Pennsylvania Determined by average daily attendance (ADA) divided by average daily membership (ADM)
Pennsylvania Consolidated State Application Accountability Workbook Revised May 8 2004 approved by USDOE June 2004
Rhode Island For 2004 classifications data rounding used for participation rates and for attendance rates For attendance rates a rate of 895 or higher allowed to meet the current criterion of 900 attendance Data rounding is not used for the graduation rate
Rhode Island School and District Accountability System Technical Bulletin Revised and updated October 13 2004
Education Commission of the States 700 Broadway Suite 1200 Denver CO 80203-3460 3032993600 Fax 3032968332 wwwecsorg
bull Page 16 bull
State Attendance Rate Details (where available) Source South Carolina Divide 135-day average daily attendance by 135-day average
daily membership (the aggregate number of days present divided by the number of days the school is in session) A pupil is counted present if he is present in class during homeroom or at the time when attendance is normally taken A pupil may also be counted present if he attends classes later in the school day and otherwise meets the guidelines for attendance set forth in local board policies A pupil is counted absent if he is not present in class during homeroom or at the time when attendance is normally taken If the pupil attends classes later in the school day the absence may be changed to tardy according to the guidelines set forth in local board policies
httpwwwmyscschools comreports97pups1htm Report card httpwwwsdestatescus
South Dakota The attendance rate is reported as a percentage and is calculated by dividing the aggregate days of attendance by the aggregate days of membership for all students enrolled
Report Card South Dakota Consolidated Application Accountability Workbook Approved by USDOE June 17 2004
Tennessee Tennessee has a mandatory attendance software package that is used for calculating financial information based on average daily attendance as well as average daily membership Membership and Attendance accounting for each student will be on the basis of the amount of time a student is enrolled for an instructional day For schools that do not utilize a schedule based on periods a student who is enrolled for the entire day would be 10 ADM Section D-102 Student Membership and Attendance Accountability Procedures Manual A pupil in grade K-12 who is in attendance at least half of the state-required minimum school day (6 12 hours for grades 1-12 four hours for K) shall be counted as being present for that day A student who is in attendance less than half the state-required minimum school day shall not be counted present for any portion of that day
1 School systems should follow guidelines approved by the local school board regarding what constitutes the majority of the class period for students who leave early or arrive late
2 In determining half the state minimum school day the beginning of the general instructional day must be used Neither the arrival time of school buses departure time of school buses nor breakfast program shall be considered part of the instructional day (Accounting for perfect attendance is a matter of local policy)
D-107 Illegal Reporting of Attendance Systems may establish policies that include opportunities for students to attend make-up sessions outside the regular school day in order to regain credittime lost due to absence from school However if a student is absent from school heshe is considered absent for ADA purposes To direct teachers to change attendance reports when a student was actually absent is a violation of
Consolidated State Application Accountability Workbook Revised June 14 2004 (approved by USDOE) STUDENT MEMBERSHIP AND ATTENDANCE ACCOUNTABILITY PROCEDURES MANUAL
Education Commission of the States 700 Broadway Suite 1200 Denver CO 80203-3460 3032993600 Fax 3032968332 wwwecsorg
bull Page 17 bull
State Attendance Rate Details (where available) Source Tennessee Code Annotated sect 49-5-201 which states that teachers shall record accurately the number of pupils present and the number absent each day
Texas Attendance Rate is based on attendance of all students in Grades 1-12 for the entire school year Due to the timing of the availability of data the Attendance Rate is a prior-year measure For example the Attendance Rate evaluated as part of the 2004 AYP calculation is the 2002ndash03 Attendance Rate The Attendance Rate is calculated as follows Total number of days students were present in 2002ndash03 divided by total number of days students were in membership in 2002ndash03 x 100 For the attendance rate to be evaluated in the AYP calculation at the all-students level the district or campus must have at least 7200 total days in membership (40 students x 180 school days) Districts and campuses with fewer than 7200 total days in membership are not required to meet the attendance rate standard If a district or campus meets the minimum size requirement for the attendance rate for the current year improvement from the prior year is calculated even if the district or campus does not meet the minimum size requirement on the attendance rate for the prior year Improvement is not calculated if the district or campus does not have an attendance rate for the prior year
2004 Adequate Yearly Progress (AYP) Guide September 2004
Utah Divides the sum of days in attendance by the sum of days in membership across all students in the school and local education agency Attendance is the total number of days a student attended a specific school A student is counted as in attendance on a school day if the student was counted on the class roll by a teacher as being present ndash in Grade 1-6 at any time during the day and in Grades 7-12 in at least one period of the day The formula used for calculating the attendance rate reflects actual student behavior in the aggregate on the one hand and the schools differential responsibility for each student on the other a student enrolled for a shorter period with perfect attendance appropriately enhances the schools performance but a student enrolled for a longer period with poor attendance is appropriately given more weight by virtue of having more days in membership so the school has an incentive to improve that students attendance
State of Utah Consolidated Application Accountability Workbook Revised June 4 2003 (approved by USDOE)
Vermont Does not use attendance Other indicator VT Developmental Reading Assessment and the Reading Basic Understanding reporting area of the New Standards Reference Exam (Grade 8) Both indicators will aggregate two years of student results and will be able to be disaggregated by all subgroups as necessary Criteria for not making AYP would have 15 or more of students ranked as Below the Standard and Little or No Evidence Two years of results will be combined and a confidence interval of 01 will be used
Consolidated State Application Accountability Workbook revised December 10 2004
Virginia Prior to the beginning of a school year each school division must choose either attendance or performance on state science assessments as the other academic indicator The
Consolidated State Application Amended Accountability Workbook
Education Commission of the States 700 Broadway Suite 1200 Denver CO 80203-3460 3032993600 Fax 3032968332 wwwecsorg
bull Page 18 bull
State Attendance Rate Details (where available) Source choice of using either attendance rate or science state assessment results as the other academic indicator also will apply to the ldquosafe harborrdquo AYP calculation methodology To facilitate reporting of attendance prior to the beginning of the school year Virginia will institute a new data collection requirement for the annual March 31 average daily membership (ADM) data collection beginning in March 2004
Revised May 26 2004 (approved by USDOE)
Washington The percentage of student enrollment days in the school year that students had an unexcused absence The definition of an unexcused absence is a local decision so the definition differs among schools and districts In general a student who has an unexcused absence has not attended a majority of hours or periods in a school day or has not complied with a more restrictive district policy and has not met the conditions for an excused absence (see RCW 28A225020) Each district is required to set policy for excusing absences An unexcused absence is defined as the failure to meet the districtrsquos policy for excused absences An unexcused absence pursuant to RCW 28A225020 means a child has failed to attend the majority of hours or periods in an average school day or has failed to comply with a more restrictive school districtrsquos policy for excused absences The rate for AYP purposes is calculated as follows
Total of student days of unexcused absences in the year divided by
Average monthly headcount x
Number of student days in the school year
Report Card Washingtonrsquos Consolidated Application Accountability Workbook Amendments Resubmitted June 16 2004 and approved June 16 2004
West Virginia The following absences are excluded (A) Student absences excused in accordance with state board rules (B) Students not in attendance due to disciplinary measures (C) Absent students for whom the attendance director has pursued judicial remedies to compel attendance to the extent of his or her authority
HB 4001 (2004) which amended W VA Code sect18-2E-5
Wisconsin Data is based on information collected in state and school district student information systems The state department will incorporate spot audits into onsite services to check accuracy of data Graduation rates and average daily attendance calculated using individual student records in Wisconsin (to be implemented in 2004-05) should increase validity and reliability
Consolidated State Application Accountability Workbook Last Revised May 14 2004
Wyoming Does not use attendance Other indicator Reduction in the percentage of students scoring in the novice (lowest performance level) category
Consolidated Application Accountability Workbook 2003-2004 Revised Submission August 11 2004 (approved by USDOE)
Territories American Samoa Could not locate Puerto Rico Does not use attendance
Other Indicator Uses ldquoproficiency in English as a second languagerdquo measured through the English as a second language (ESL) test The ESL test has been newly developed along with the Math and Reading test and is aligned with the Puerto Rico ESL Academic Standards of 2000
Consolidated Application Accountability Workbook May 1 2003
Education Commission of the States 700 Broadway Suite 1200 Denver CO 80203-3460 3032993600 Fax 3032968332 wwwecsorg
bull Page 19 bull
State Attendance Rate Details (where available) Source Virgin Islands Could not locate
TABLE 3 How Graduation Rates are Calculated State Graduation Rate Definitions amp Notes Source
Alabama The projected four-year dropout rate is a measure of the cumulative proportion of the 9th grade class that would drop out prior to graduation if that yearrsquos grade specific dropout rate were to remain constant over the four years until that class is to graduate Step 1 Calculate the number of dropouts by grade (Grades 91011 and 12) Step 2 Compute the average by dividing each sum by the enrollment for that grade Example Grade 9 10 dropouts 250 enrolled = 04 Grade 10 20 dropouts in 160 enrolled = 20160 = 125 Grade 11 5 dropouts in 300 enrolled = 5300 = 0167 Grade 12 20 dropouts in 200 enrolled = 20200 = 1 Step 3 Compute the probability that a student remains all four years (a) Get (1- the decimal value from 2) for each grade (1-004) = 96 (1 ndash 0125) = 875 (1-0017) = 983 (1-01) = 9 (b) Multiply these probabilities together (96)(875)(983)(9) = 743 (c) Subtract from 1000 1000-743 = 257 The projected rate is 257 over four years
Report card
Alaska Uses methodology recommended by the National Center for Education Statistics
Consolidated State Application Accountability Workbook amended with approval June 7 2004
Arizona The graduation rate is a four-year longitudinal measure of how many students graduate from high school Any student who receives a traditional high school diploma within the first four years of starting high school is considered a four-year graduate as defined by the Arizona Department of Educationrsquos Graduation Rate Study A four-year rate is derived from dividing the sum of all four-year graduates in each year by the sum of those who should have graduated and did not transfer to another qualified educational facility or die By examining a cohort of students who began high school at the same time the graduation rate assesses how many students actually complete high school within a four-year period It should be noted that this calculation of the graduation rate does not include dropouts as transfer students or those who obtain a Graduate Equivalent Diploma (GED)
State of Arizona Consolidated State Application Accountability Workbook Revised August 16 2004 (approved by USDOE)
Arkansas The computation of graduation rate is a four-year model that tracks student enrollment by cohort groups beginning with a 9th grade cohort and following their progress through grade 12 Students who drop out and subsequently complete the GED program are counted
Consolidated State Application Accountability Plan as submitted August 10 2004
Number of Cohort members who graduated after four yearsGraduation = Original Transfers Transfers X 100 Rate Cohort +
In-
OutMembership - Deceased
Education Commission of the States 700 Broadway Suite 1200 Denver CO 80203-3460 3032993600 Fax 3032968332 wwwecsorg
bull Page 20 bull
State Graduation Rate Definitions amp Notes Source as a dropout and are not counted as a high school graduate Graduation Rate (also known as Completion Rate) The graduation rate is used to track the progress of the same cohort of students as they enter the 9th grade and graduate four years later The data elements for this calculation are accumulated over a four-year period Step 1 Dropout rates for each affected grade for each year are calculated first The dropout rate is found by dividing the number of students who dropped out of that grade by October 1 enrollment for that grade Step 2 Completion rates for each affected grade for each year are calculated This rate is found by subtracting the grades dropout rate from one (1) Step 3 Completion rates for each of the four grades are multiplied together Step 4 The results in Step 3 are multiplied by 100
(approved by USDOE August 17 2004)
California The graduation rate is calculated by dividing the number of high school graduates by the sum of dropouts for grades 9 through 12 in consecutive years plus the number of graduates A procedure established by NCLB determined the statewide graduation rate goal of 828
2004 AYP Criteria Summary - Adequate Yearly Progress (PDF) Summary of criteria for 2004 Adequate Yearly Progress
Colorado The graduation rate is a cumulative or longitudinal rate that calculates the number of students who actually graduate as a percent of those who were in membership and could have graduated over a four-year period (namely from grades 9-12)
The rate is calculated by dividing the number of graduates by the membership base The membership base is derived from end-of-year count of eighth graders four years earlier (ie in the spring of 1995) and adjusted for the number of students who have transferred into or out of the district during the years covering grades 9 through 12
httpwwwcdestatecouscderevalrv2003GradLinkshtm
Connecticut Number of June 2006 four-year graduates with regular diploma (may include special education students who have until age 21 to earn a
regular diploma)
divided by
Number of June 2006 graduates plus number of 2005-06 12th grade dropouts plus number of 2004-05 11th grade dropouts plus number of 2003-04 10th grade dropouts plus number of 2002-03 9th grade
dropouts The individual student data for each class tracked beginning with 9th grade in October 2002 Able to calculate the graduation rate for each subgroup for the class of 2006 In the interim Connecticut plans on using an alternative measure based on schoolsrsquo reported aggregate graduation data that is currently collected The graduation rate will be calculated as described above but will be based on aggregate data reported by districts and used in the determination of AYP for high schools Because of this current aggregate nature of the way these data are collected Connecticut will only be able to report on the subgroups of
Consolidated State Application Accountability Workbook Modified August 13 2004 (approved by USDOE)
Education Commission of the States 700 Broadway Suite 1200 Denver CO 80203-3460 3032993600 Fax 3032968332 wwwecsorg
bull Page 21 bull
State Graduation Rate Definitions amp Notes Source race gender and special education until 2006 In the interim Connecticut will use the CAPT writing standard (at least 70 basic or above or improvement based on previous year) disaggregated to determine Safe Harbor
Delaware The graduation rate is the number of students in one cohort who started in the schooldistrict in 9th grade and graduated four years later with a regular diploma or in the timeframe specified by the IEP divided by the same number plus those who have dropped out during the four-year period Students earning a GED certificate will not be counted as graduates but will be included in the denominator for calculation of graduation rate Delaware has individual student data from DELSIS and graduationexit data thus can calculate the graduation rate by disaggregated subgroup School district and state in-school report cards have reported the graduation rate since the late 1990s
Consolidated State Application Accountability Workbook Revised June 30 2004 (approved by USDOE)
District of Columbia
Could not locate final definition
Florida In Florida the number of graduates from a four-year adjusted cohort is divided by the total number of students in the adjusted cohort The adjusted cohort (denominator) is determined through a multi-step process in which subtracted from the 9th grade cohort are the students who transfer out of the school or are deceased and add the students transferring into the school who at the time of their enrollment are on the same schedule to graduate as students from the first group Uses the prior year graduation rate for the calculation of AYP and the state report card Florida has five high school graduation options
Standard Diploma Certificate of Completion State of FloridaHigh School Equivalency Diploma Special Diploma Special Certificate of Completion
Only those students receiving a standard diploma or a State of FloridaHigh School Equivalency Diploma are counted in the NCLB graduation rate The State of FloridaHigh School Equivalency Diploma differs significantly from the typical GED program This exit option is based on an agreement with the American Council on Education and s 1003435(4) Florida Statutes The participants in this program must meet performance standards established by rules of the state board and pass the GED instead of the FCAT All State of Florida diplomas issued under this option have equal status with other high school diplomas for all state purposes including admission to any state university or community college The performance standards are aligned with the Sunshine State Standards and students achieving this diploma are considered to be as proficient as any student receiving a standard diploma
Consolidated State Application Accountability Workbook Revised March 26 2003 (approved by USDOE)
Georgia The percentage of students who graduate in the standard number of years (four years for a 9-12 school) from a Georgia public high school with a regular diploma (not including a GED or certificate not fully aligned with the statersquos academic standards and not including Special Education diplomas) Students receiving GEDs are counted
Consolidated State Application Accountability Workbook Revised for 2003-2004 subsequent submission August 12 2004
Education Commission of the States 700 Broadway Suite 1200 Denver CO 80203-3460 3032993600 Fax 3032968332 wwwecsorg
bull Page 22 bull
State Graduation Rate Definitions amp Notes Source as dropouts and are included in the denominator for calculating graduation rates
(approved by USDOE)
Hawaii For the districtstate The percentage of first-time 9th grade students who graduate with a diploma within four years excluding students who have transferred out of the Hawaii public school system For schools The percentage of first-time 9th grade students who graduate with a diploma within four years excluding students who have transferred out of the school The denominator of the graduation rate is the number of first-time
9th grade students from the states beginning-of-the-school-year official enrollment count excluding students transferring out
The numerator of the graduation rate is the number of students receiving a diploma within four school years
The term transfer excludes dropouts as defined in the calculation of dropout rates under the Common Core of Data survey conducted by the National Center for Education Statistics (NCES) The term diploma is defined as completion of the State of Hawaii approved educational program and receipt of a BOE or DOE diploma in recognition Special education students who are not working toward a diploma may receive a certificate if they complete the program specified in their IEP Students who receive these IEP completion certificates are not counted as graduates
httparchk12hiuspdfNCLBAYP_Grad-Retentionpdf
Idaho When graduation rate is available this statistic will reflect data reported by school districts on a cohort or class of students over a four-year period beginning with the groups 9th grade year Idaho uses a formula established by the National Center for Education Statistics for calculating this rate Until graduation rate data is available the language usage test is a proxy for graduation rate For 2003-04 the goal was for the percent-age of proficient or better to improve hold steady or be above 66 when compared to 2002-03 results on the ISAT language usage test Effective for 2004-2005 the proxy for disaggregation of high school subgroups will be a growth index and graduation rate disaggregation will not be available until the full implementation of ISIMS Graduation rate is measured using the number of students who graduate from a public high school with a regular diploma (not including a GED or any other diploma not fully aligned with the statersquos academic standards) in the standard number of years Idaho includes in the graduation rate the number of students with disabilities who are entitled to services up to the age of 21 where the Individual Education Plan warrants the additional time to meet graduation requirements Graduation rate (G) is defined by NCES as the proportion of students that begin in 9th grade and go on to complete 12th grade with a diploma Idaho includes students who complete high school under the IEP exception A General Education Development (GED) certificate does not meet requirements that are comparable for receipt of a regular high school diploma
Consolidated State Application Accountability Workbook August 2004 (approved by USDOE)
Education Commission of the States 700 Broadway Suite 1200 Denver CO 80203-3460 3032993600 Fax 3032968332 wwwecsorg
bull Page 23 bull
State Graduation Rate Definitions amp Notes Source Illinois Graduation rate is the number of current year graduates divided by
the number of freshman class four years previously less students who transferred out plus students who transferred in multiplied by 100 It is essentially a cohort rate Graduation rate = (B (A ndash C + D)) 100 A = Freshman Class the number of students enrolled for the first time in grade 9 four years ago (namely freshman class enrollment in fall 1998) B = Graduates the number of students who graduated in the current school year (that is July 2001 through June 2002) Graduates include only students who were awarded regular diplomas students with GEDs and other nonregular completion certificates are not included C = Transferred out the number of students from the freshman class (A) who transferred to another school or died prior to graduation D = Transferred in the number of graduates from among all the graduates (B) who were not members of the original freshman class (A) Included are students who transferred in from other schools in the last four years and also students who graduated in fewer or more than four years Since these students are counted in the numerator they are also counted in the denominator to ensure that the graduation rate does not exceed 100
Accountability Workbook as revised May 2004 (approved June 14 2004)
Indiana A cohort refers to a class of students within a high school who have the same expected graduation year Expected graduation year means the reporting year beginning three years after the reporting year in which a student is first considered by a school corporation to have entered grade 9 Graduation rate means the percentage of students within a cohort who graduate during their expected graduation year (Indiana State Board of Education 511 IAC 62-25-5 filed Jul 14 2004) 511 IAC 62-25-9 Calculation of graduation rate Sec 9 The graduation rate for a cohort in a high school is the percentage determined under STEP SEVEN of the following formula Step One Determine the grade 9 enrollment at the beginning of the reporting year three years before the reporting year for which the graduation rate is being determined Step Two Add
(A) the number determined under STEP ONE and (B) the number of students who
(i) have enrolled in the high school after the date on which the number determined under STEP ONE was determined and
(ii) have the same expected graduation year as the cohort Step Three Add
(A) the sum determined under STEP TWO and (B) the number of retained students from earlier cohorts who
became members of the cohort for whom the graduation rate is being determined
Step Four Add (A) the sum determined under STEP THREE and (B) the number of students who
(i) began the reporting year in a cohort that expects to graduate during a future reporting year and
(ii) graduate during the current reporting year
Report card 511 IAC 61-1-2 Definitions 511 IAC 62-25-9
Education Commission of the States 700 Broadway Suite 1200 Denver CO 80203-3460 3032993600 Fax 3032968332 wwwecsorg
bull Page 24 bull
State Graduation Rate Definitions amp Notes Source Step Five Subtract from the sum determined under STEP FOUR the number of students who have left the cohort for any of the following reasons
(A) Transfer to another public or nonpublic school (B) Removal by the studentrsquos parents under IC 20-81-3-34 to
provide instruction equivalent to that given in the public schools
(C) Withdrawal because of a long-term medical condition or death
(D) Detention by a law enforcement agency or the department of correction
(E) Placement by a court order or the division of family and children
(F) Enrollment in a virtual school (G) Graduation before the beginning of the reporting year (H) Students who have attended school in Indiana for less than
one year and whose location cannot be determined (I) Students who cannot be located within the boundaries of the
school corporation and have been reported to the Indiana clearinghouse for missing and exploited children
Step Six Determine the total number of students who have graduated during the current reporting year Step Seven Divide
(A) the number determined under STEP SIX by (B) the remainder determined under STEP FIVE
(Indiana State Board of Education 511 IAC 62-25-9 filed July 14 2004) Prior to the 2005-2006 school year (i) ldquoDropout raterdquo means the number determined under STEP THREE of the following formula
Step One Determine the number of students enrolled on October 1 or the date closest to October 1 that school is in session Step Two Determine the number of students who drop out of school during the current school year and the previous summer recess Step Three Determine the quotient of (A) the amount determined under STEP TWO divided by (B) the amount determined under STEP ONE
(k) ldquoGraduation raterdquo for classes of students who graduate prior to the 2005-2006 school year means the number determined under STEP THREE of the following formula
Step One Determine the dropout rates for grades 9 10 11 and 12 Step Two Determine the remainder of
(A) 10 minus (B) the amount determined under STEP ONE for each of the above four grades
Step Three Determine the product of the four amounts determined under STEP TWO
Iowa Graduation rate calculation
GRi= Gi Gi + Di + D(i - 1) + D(i - 2)+D(i - 3) Where GRi is the graduation rate for a given year (i)
2004 State Report card
Education Commission of the States 700 Broadway Suite 1200 Denver CO 80203-3460 3032993600 Fax 3032968332 wwwecsorg
bull Page 25 bull
State Graduation Rate Definitions amp Notes Source Gi is the number of students achieving a regular high school diploma for year i Di is the number of dropouts in grade 12 for year i D(i-1) is the number of dropouts in grade 11 for the first previous year (i-1) D(i-2) is the number of dropouts in grade 10 for the second previous year (i-2) D(i-3) is the number of dropouts in grade 9 for the third previous year (i-3) Regular diplomas are given to students for completing all unmodified district graduation requirements in the standard number of four years Included are students receiving regular diplomas from an alternative placement within the district or who have had the requirements modified in accordance with a disability
Kansas 2003 NCLB AYP graduation formula
Graduates ndash (retentions + non-regular diplomas) divided by
Graduates + 2003 grade 12 dropouts + 2002 grade 11 dropouts +
2001 grade 10 dropouts + 2000 grade 9 dropouts The definition of graduation in Kansas was expanded to include IEP graduates which includes the following (a) Only students with disabilities (b) Students through the age of 21 (c) Students who are graduating with a regular diploma (d) Students who have been in high school for more than four years and (e) Students who have completed their course of study as specified in their IEPs Students who have received GEDs and transfers are not included in the group Dropouts are included in calculating graduation rate
Report card httponlineksdeorgrcarddefinitionsaspxorg_no=Damprpt_type=3graduation
Kentucky Graduation rate is defined as [number of prior-year grade 12 completers (standard diploma within
four years including students with disabilities whose Individual Education Plan (IEP) stipulate they will need more than four years to
obtain a standard diploma)] divided by
[number of prior-year grade 12 completers (include standard diplomas plus certificates of completion plus students with no IEP who will take longer than four years to graduate) plus number of dropouts from the prior 12th grade class who dropped out as 12th
graders plus the number of dropouts from the prior 12th grade who dropped out as 11th graders plus number of dropouts from the prior 12th grade class who dropped out as 10th graders plus number of dropouts from the prior 12th grade class who dropped out as 9th
graders]
In addition to students who receive four-year diplomas the following students qualify as graduates Students who do not graduate in four years but have an Individual Education Plan (IEP) documenting their need for more than four years of secondary school education to complete their program
2004 NCLB Briefing Packet 2004 NCLB Interpretative Guide ndash Kentucky Department of Education (V 203 Updated August 13 2004)
Louisiana sect513 Dropout Index Calculations Bulletin 111 Chap 1 Sec
Education Commission of the States 700 Broadway Suite 1200 Denver CO 80203-3460 3032993600 Fax 3032968332 wwwecsorg
bull Page 26 bull
State Graduation Rate Definitions amp Notes Source A A dropout index score for each school shall be calculated The index shall be calculated using the prior two years average dropout rates as compared to the states goal B The national definition of dropout shall be adhered to but in certain instances the Louisiana Department of Education shall calculate an Adjusted Dropout Rate for accountability purposes C Non-Dropout Rate (NDO) = 100 - Dropout Rate (DO) NOTE DO is expressed as a percentage D 7-8 dropout index formula = (25 x NDO) ndash 23000 E 9-12 dropout index formula = 1875 ndash (125 x dropout rate) F Combination dropout index formula = [(7-8 dropout index x number of 7-8 students) + (9-12 dropout index x number of 9-12 students)] total 7-12 enrollment
513
Maine Graduation rate for high schools includes all recipients of any type of certificate or diploma (as well as students who have dropped out of or transferred into a high school) in the denominator and will include only those students receiving a standard diploma in the standard number of years in the numerator ldquoNrdquo is 10 and confidence intervals are used since graduation is a performance measure Graduation rate is computed for the prior yearrsquos class to allow a fifth year option for students who have this in their Individual Education Plan (IEP) or Personal learning Plan (PLP) Graduation rate is the number of students who received a valid diploma (Certificates of Attendance Adult Education Diploma and GED are not counted in the graduation rate) divided by the total number of students in the cohort The cohort includes the students who started in 9th grade plus the transfers minus the students who left and did not enroll in another school
httpwwwmainegoveducationnewsnclbATM20AYP20Update-10-15-03pdf
Maryland National Center for Education Statistics synthetic graduation rate formula Annual targets from 2003 to 2014 in a stepped format with increasing intermediate targets in years 2005 2008 and 2011 The graduation requirement is met if the annual target is met or the graduation rate improves from the previous year
Consolidated Application Accountability Workbook Revised August 17 2004 (approved August 23 2004 USDOE)
Massachusetts Graduation rate is the number of graduates with a regular diploma who completed in four years divided by the number of 9th grade dropoutsretentions plus the number who completed without a regular diploma The dropout rate is the number of students who dropped out from grades 9-12 over a one-year period from July 1 to June 30 minus the number of returned dropouts divided by the October 1 enrollment For more information see httpwwwdoemasseduinfoservicesreportsdropout Revision Massachusetts will not include foreign exchange students in the graduation rate when such students are not officially enrolled in the school
Consolidated Application Accountability Workbook Revised August 17 2004 (approved August 23 2004 USDOE)
Michigan Computed following 9th grade students as a cohort through the years Michigan Consolidated
Education Commission of the States 700 Broadway Suite 1200 Denver CO 80203-3460 3032993600 Fax 3032968332 wwwecsorg
bull Page 27 bull
State Graduation Rate Definitions amp Notes Source of high school (a four-year cohort grades 9-12) Graduation rate is calculated on the percentage of the cohort that who earns a regular diploma When students exit from a school district an exit code for the student must be entered into the Single Record Student Database (SRSD) at the Center for Educational Performance and Information (CEPI) These codes will be used to determine what students will remain in the cohort being followed to calculate the graduation rate Students with the following CEPI codes will be considered as in the cohort and will be included in the calculation of graduation rate 01 ndash Graduated from general education with a diploma 02 ndash Graduated from general education with a diploma and applied to a degree granting college or university 03 ndash Graduated from an alternative program 04 ndash Graduated and applied to a non-degree granting institution 05 ndash Completed general education with an equivalency certificate 06 ndash Completed general education with other certificate 07 ndash Dropped out of school 10 ndash Expelled from the school district (no further services) 11 ndash Enlisted in military or Job Corps 13 ndash Incarcerated 16 ndash Unknown 17 ndash Placed in a recovery or rehabilitative program 19 ndash Expected to continue in the same school district 20 ndash Special Education student ndash received certificate of completion 21 ndash Special Education student ndash reached maximum age for service 22 ndash Special Education student ndash no longer receiving services and returned to general education program The cohort will be reduced by students who exit from school during the high school grades according to the following CEPI exit codes 08 ndash Enrolled in another district in Michigan 09 ndash Moved out of state 12 ndash Deceased 14 ndash Enrolled in home school 15 ndash Enrolled in a non-public school 25 ndash Special Education student ndash enrolled in special education in another district 26 ndash Special Education student ndash enrolled in another district not in special education The following CEPI exit codes would require the student to remain in the denominator but would not be counted as ldquograduatingrdquo in the calculation of graduation rate 05 ndash Completed general education with an equivalency certificate 06 ndash Completed general education with other certificate 07 ndash Dropped out of school 16 ndash Unknown 20 ndash Special education student ndash received certificate of completion 21 ndash Special education student ndash reached maximum age for services 22 ndash Special education student ndash no longer received services and returned to general education program
The following CEPI exit codes will be used to calculate dropout rate 07 ndash Dropped out of school 16 ndash Unknown
State Application Accountability Workbook Revised May 22 2003
Education Commission of the States 700 Broadway Suite 1200 Denver CO 80203-3460 3032993600 Fax 3032968332 wwwecsorg
bull Page 28 bull
State Graduation Rate Definitions amp Notes Source
Minnesota The calculation does not include students who graduate with GEDs or any other diploma not aligned to the statersquos academic standards Students are counted as dropped if they are reported as a drop and do not re-enroll in another school during the four year period Minnesota currently is not able to control for students who finish high school within four years from their start date The methodology allows for a consistent computation for all schools and districts in the state and includes students who change schools part way through their high school career The computation is based on students who receive diplomas in year four of the emulated cohort
Number of graduates year 4 divided by
Dropouts (Grade 9 Year 1 + Grade 10 Year 2+ Grade 11 Year 3 + Grade 12 Year 4) + Completers Year 4
Consolidated State Application Accountability Workbook updated Sept 29 2004 (approved USDOE Sept 30 2004)
Mississippi The graduation rate is calculated by dividing the number of the yearrsquos graduates by the number of 9th grade students four years earlier The adjusted 9th grade enrollment reflects the number of new students entering the school the number moving out and the number failing over the four-year period
Report card
Missouri The quotient of the number of graduates in the current year as of June 30th divided by the sum of the number of graduates in the current year as of June 30th plus the number of 12th graders who dropped out in the current year plus the number of 11th graders who dropped out in the second preceding year plus the number of 9th graders who dropped out in the third preceding year
(Graduates (9-12 Cohort Dropouts + Graduates)) x 100
5 CSR 50-340200 Report Card
Montana Montanarsquos graduation rate is an estimated cohort group rate that is calculated by the method recommended by the NCES
gt (c + gt+ d12t + d11
(t-1) + d10(t-2) + d9
(t-3)) Where
g = of graduates receiving a standard high school diploma in standard of years c = completers of high school by other means t = year of graduation d = dropouts 12 11 10 9 = class level All students graduating in Montana receive a standard high school diploma and will be counted as a graduate Students receiving a GED are not included as graduates when calculating graduation rates Montanarsquos definition of a dropout is consistent with the requirements of the NCES Common Core of Data (CCD) reporting According to Montanarsquos definition a dropout is an individual who
Was enrolled in school on the date of the previous year October enrollment count or at sometime during the previous school year and was not enrolled on the date of the current school year October count or Was not enrolled at the beginning of the previous year but was
Consolidated State Application Accountability Workbook Revised June 6 2003
Education Commission of the States 700 Broadway Suite 1200 Denver CO 80203-3460 3032993600 Fax 3032968332 wwwecsorg
bull Page 29 bull
State Graduation Rate Definitions amp Notes Source expected to enroll and did not reenroll during the year (ldquono showrdquo) and was not enrolled on the date of the current school year October count and Has not graduated from high school or completed a state- or district-approved high school educational program and Has not transferred to another school been temporarily absent due to a school-recognized illness or suspension or died (Montana Dropout Statistics Collectorrsquos Handbook
httpwwwopistatemtuspdfacddohandbookpdf) Previous year graduation rate used (2002 graduation rate in 2003) for all AYP determinations For purposes of AYP (other than ldquosafe harborrdquo) the calculation of the graduation rate applies to the school and district level but not to the subgroup level
Nebraska Local school boards are responsible for establishing the requirements for high school graduation For AYP reporting NCLB requires a cumulative graduation rate that considers the number of students who actually graduate as a percent of those who were in membership and could have graduated over a four-year period from grades9 through 12 Definition does not allow for the inclusion of dropouts and does not allow the use of transfer to avoid counting a student as a dropout
Adequate Yearly Progress (AYP) under No Child Left Behind (NCLB) Guidance Revised for the 2003-04 Reporting Retrieved from wwwndestateneusstars documentsAYPGuidance2003-04revisedpdf
Nevada Graduation rate is based on a 9th grade cohort of students Two substantive differences exist between graduation rate and the other AYP indicators First the need for completion information makes it impossible to calculate the indicator for the ldquocurrentrdquo school year In other words for the 2002-03 AYP determinations graduation rates reflecting the graduating class of 2001-02 had to be used Second the graduation rate indicator collapses information across a four-year time span while the other indicators rely primarily on a single year of information This means that change with respect to graduation rate is likely to take more time to observe Until the 2006-07 school year average daily attendance will be used as a proxy for the economically disadvantaged limited English proficient and students with disabilities subgroups Nevada adapted the NCES definition of completion rate which incorporates completers and dropouts ldquoCompletersrdquo include standard and advanced diploma recipients adjusted diploma recipients and certificate of attendance recipients Graduation rate only counts diploma recipient completers in the numerator excluding adjusted diploma recipients The denominator includes all diploma recipients certificate of attendance recipients dropouts (9th 10th 11th and 12th) and GED recipients For the 2001-2002 school year graduation rate is equal to
of diploma recipients (01-02) (excluding adjusted diploma recipients) divided by
of diploma recipients (01-02) (all recipients) + certificate of
attendance recipients (01-02) + GED recipients (01-02) + 9th grade dropouts (98-99) + 10th grade
A Guide to No Child Left Behind amp Adequate Yearly Progress Analyses in Nevada httpwwwdoenvgovnclb aypquestionsguidehtmother_indicators Consolidated State Application Accountability Workbook submitted August 26 2004 (approved October 6 2004 by USDOE)
Education Commission of the States 700 Broadway Suite 1200 Denver CO 80203-3460 3032993600 Fax 3032968332 wwwecsorg
bull Page 30 bull
State Graduation Rate Definitions amp Notes Source dropouts (99-00) +
11th grade dropouts (00-01) + 12th grade dropouts (01-02) Prior year graduation rates used to calculate AYP The state board is expected to revise the 50 target graduation rate
New Hampshire
New Hampshire plans to use a modified definition of graduation rate used by the National Center for Education Statistics until such time as a data collection system allows an accurate graduation rate (does not include GED) New Hampshire may use this modified rate until the 2005-2006 school year (From USDOE Decision Letter dated June 25 2003) Intends to transition to a graduation rate definition consistent with NCLB requirements New Hampshirersquos graduation rate will be calculated as the percentage of students who complete high school and earn a regular diploma within the standard number of years The standard numbers of years for students with IEP504 plans are specified in those documents NH Graduation Rate = Completer Rate X Regular Diploma Rate Where Completer Rate = 100 ndash Cumulative Dropout Rate and Regular Diploma Rate in the standard of years = of completers with regular diplomas earned in the standard of years Number of completers with regular + nonstandard diplomas Dropouts are defined as students who leave school prior to gradu-ation for reasons other than transfer to another school or death of student In New Hampshire four is the standard number of years for students who do not have IEPs or 504 plans An additional year may be considered for completion to accommodate variations across districts and schools including but not limited to (a) the number of credits required for graduation from public schools Many high schools go beyond the minimum number of credits for graduation (set at the state level) For example a student may transfer from a school requiring 20 credits to a school requiring 23 credits a public school may not accept all credits from a private school or variations in course offerings may make it necessary for a student to take a few courses during the fifth year (b) the number of credits from private schools that are accepted when a student transfers to a public school and (c) the needs of students who are enrolled in Dropout RecoveryIntervention Programs developed at the local level Students attending public schools that have an active dropout recovery program may need a fifth year to complete high school graduation requirements If this is not allowed there would be a disincentive to recover students before they permanently drop out Graduation rate is included (in the aggregate) for AYP and disaggregated (as necessary) for use when applying the exception clause to make AYP A student is a dropout 1 On the day following the studentrsquos declaration of dropout status
if age 18 or older 2 On the day following the parentrsquos or guardianrsquos declaration of
dropout status if age 16 or older 3 On the 16th consecutive day of failure to attend school when the
absence has not been excused by the school board and when the student is 18 or older
4 On the 16th day following the end of an expulsion period if the
Dropout Reporting Procedures For the 2002-2003 School Year NH Department of Education Division of Program Support Bureau of Information Services September 3 2003 Consolidated State Application Accountability Workbook Amended March 30 2004 (approved August 17 2004 by USDOE)
Education Commission of the States 700 Broadway Suite 1200 Denver CO 80203-3460 3032993600 Fax 3032968332 wwwecsorg
bull Page 31 bull
State Graduation Rate Definitions amp Notes Source student has failed to return to school or to enroll in another school or home schooled program and the student is 18 or older
5 On the day a district removes a student from the attendance roster because he has reached age 21 and has not yet graduated (A district may permit continued attendance for a student over 21)
6 On the 16th consecutive day of failure to attend an adult education program that the school board has approved as an alternative program This student will be considered a dropout from the public school last attended (Students in adult education programs are generally considered dropouts See the more detailed discussion of adult education programs in the next section)
7 On the day a student leaves school to pursue a GED A student is not a dropout 1 During a period of suspension or temporary expulsion 2 If shehe has transferred to another approved public or private
school or home schooled program within NH or an out-of-state school Transfer status is indicated by (a) a request for the transfer of records or other notification by the receiving school or (b) a written statement by a parent or guardian indicating the student will be attending another school but declining to provide the name of the school because of safety concerns or (c) the truant officer verifies that the student has moved out of the district
New Jersey Beginning with the 2004-2005 school year and all subsequent years New Jersey will begin to implement graduation rate and add a new cohort each year Graduation rate will be defined and calculated by the method recommended by the National Center for Education Statistics
Based on the National Center for Education Statisticsrsquo definition this calculation provides an estimate for the cohort of students that began high school four years ago
The calculation is derived by taking the number of school-year graduates plus the summer graduates following the school year and dividing by a combination of the following
School year plus summer graduates plus number of grade 9 dropouts four years prior plus number of grade 10 dropouts three years prior plus number of grade 11 dropouts two years prior plus number of grade 12 dropouts for this report card year The product is then multiplied by 100 to get the graduation rate
Consolidated State Application Accountability Workbook Revised August 16 2004 (approved USDOE August 18 2004) State Report Card
New Mexico ldquoGraduation raterdquo means the percentage of the students who graduated from a high school divided by the number of students who were enrolled in the schoolsrsquo 40th day of the same year This calculation will be used until four-year cohort data can be collected The 9th grade students from school year 2003-2004 will be the first cohorts graduating in school year 2006-2007
NMAC 6191 3 7 8 9 New Mexico 6191 NMAC 61917 (regulations adopted August 2004)
Education Commission of the States 700 Broadway Suite 1200 Denver CO 80203-3460 3032993600 Fax 3032968332 wwwecsorg
bull Page 32 bull
State Graduation Rate Definitions amp Notes Source New York Graduation rate is based upon the percentage of students measured
from the beginning of high school who graduate from high school with a regular diploma within four years (See below for an exception related to schools that offer a high school diploma and additional certification) In addition New York also holds schools accountable for students who transfer into a school after the beginning of high school New York uses as the denominator (beginning with the students who first entered 9th grade in the 2003ndash04 school year July 31ndashJune 30) the count of students who meet Condition 1 and either Condition 2 or Condition 3 below 1 Enrolled in 9th grade (anywhere) for the first time in a particular
year (year 1) or for ungraded students with disabilities attained age 17 during that school year AND
2 Were enrolled in the school or LEA on the first Wednesday of October in year 1 and did not transfer to another program leading to a high school diploma OR
3 Transferred into the school or LEA after the first Wednesday of October in year 1 and were continuously enrolled in the school or district for a period of five months (excluding July and August) except that students who first enrolled in the school after the first Wednesday in October of year 4 will not be included in the denominator
The graduation rate will be the percentage of these students who earned a regular high school diploma no later than the end of year 4 An exception will be made for high schools where a majority of students participate in a state-approved five-year program that results in the receipt of certification in a career or technology field in addition to a high school diploma For those schools the graduation rate will be the percentage of those students defined in Conditions 1 and 2 who earned a regular high school diploma no later than the end of year 5 The official count of school enrollment is taken each year on the first Wednesday in October Dropout rate measures the rate of dropouts which refers to any student regardless of age who left school prior to graduation for any reason except death and did not enter another school or high school equivalency preparation program or other diploma program
Understanding Your School Report Card February 2004 New York State Education Department
North Carolina Of the students who graduate with a regular diploma this reflects the percentage who graduated in four years or less It does not reflect all 9th graders who entered high school four years earlier Initially defining ldquograduation rate for public high schoolsrdquo as ldquo[t]he percentage of students who graduate from high school with a regular diploma in the standard number of yearsrdquo The 2002-03 ABCs masterbuild files will be coded to reflect diploma recipients The same files will indicate the date when students took End-of-Grade (EOG) tests in 8th grade Calculating the elapsed time between 8th grade EOG tests and diploma receipt will ascertain the number of years Schools will be given the capability to manually record the necessary information for students who do not have 8th
Report Card Consolidated State Application Accountability Workbook May 11 2004 (approved July 2004)
Education Commission of the States 700 Broadway Suite 1200 Denver CO 80203-3460 3032993600 Fax 3032968332 wwwecsorg
bull Page 33 bull
State Graduation Rate Definitions amp Notes Source grade EOG data (for example students who moved into the state after the 8th grade or who previously attended private schools) Timeline for Moving to a Cohort Definition of Graduation Rate For the longer term the first step establishes a baseline for membership in 9th grade during the 2002-03 school year Current student information management systems in North Carolina do not have the capability to track students over a four-year period anywhere in the state Therefore districts asked to generate student rosters for 9th graders in 2002-03 and retain them for future reference Local education agencies andor schools record the transition outcomes for each student on the roster over four years and maintain that information so that it could be matched with the diploma recipient information collected through the 2005-06 masterbuild files (or other data collection that may be more appropriate at that time) Thus the first year in which a cohort based graduation rate could be calculated would be the 2005-06 school year and the first year in which ldquoprogressrdquo could be ascertained using a cohort definition for two successive graduation rates would be 2006-07
North Dakota Graduate rate Counts as graduates within the standard number of years students with disabilities and limited English proficient students who graduate within the extended graduation schedule set forth in their individualized education plans developed by their IEP team or LEP service team
Number of Graduates divided by
Number of Graduates + Dropouts Yr1 + Dropouts Yr2 + Dropouts Yr3 + Dropouts Yr4
The schoolrsquos graduation rate is compared to the statersquos graduation goal and a test of statistical significance is performed where required to ensure the proper AYP status
Decision Letter August 17 2004 USDOE A Guide to the 2003-04 AYP Report North Dakota Department of Public Instruction
Ohio Sample calculation of FY2002 graduates + Summer 2002 Graduates
(Reported in FY2003K) divided by
of grade 9 dropouts in FY1999 + of grade 10 dropouts in FY2000 + of grade 11 dropouts in FY2001 + of grade 12 dropouts in FY 2002 +
of summer graduates 2002 (Reported in FY 2003K) X 100
The graduation rate is an estimated cohort group rate that is calculated by the method recommended by the National Center for Educational Statistics Students receiving non-standards based diplomas or GEDs are not included as graduates when calculating graduation rates The following website address contains the Student Data Elements section of Ohiorsquos educational management system httpwww odestateohusemisdocumentationmanual2003chapter_2asp and includes information about the calculation of the graduation rate
EMIS Guidelines State of Ohio Consolidated Application Accountability Workbook January 2003 (approved by USDOE)
Oklahoma Graduation rate is included (in the aggregate) for AYP and disaggregated (as necessary) for use when applying the exception
Consolidated State Application Accountability
Education Commission of the States 700 Broadway Suite 1200 Denver CO 80203-3460 3032993600 Fax 3032968332 wwwecsorg
bull Page 34 bull
State Graduation Rate Definitions amp Notes Source clause to make AYP Beginning in 2004-2005 the graduation rate is calculated using an estimated cohort group rate which is a recommended method by the National Center of Educational Statistics The calculation is shown below Number of Students Graduating with a Regular Diploma including summer graduates in 2003-2004
divided by
Number of Students Graduating with a Regular Diploma including summer graduates in 2003-2004
+ Number of Grade 12 Dropouts in 2003-2004
+ Number of Grade 11 Dropouts in 2002-2003
+ Number of Grade 10 Dropouts in 2001-2002
+ Number of Grade 9 Dropouts in 2000-2001
+ Number Receiving GEDs
Workbook August 26 2004 (approved by USDOE Sept 1 2004)
Oregon Weighted average of enrollment times graduation rate for each year Graduation rate = Number of students graduating with a regular diploma divided by (number of students graduating with a regular diploma + number of dropouts in grades 9 ndash 12) Graduates
bull Students are counted as graduates if they receive a regular high school diploma including an adult high school diploma The Oregon high school diploma requires at least 22 credits to earn
Not Graduates bull Students are not counted as graduates if they receive modified
diplomas based on completion of a special education individualized education program
bull Students are not counted as graduates if they receive credentials that require fewer than 22 credits to earn
bull Students are not counted as graduates if they finish their senior year and did not receive any credentials
bull Students are not counted as graduates if they earn a GED Enrollment is the number of students in membership in grades 9 ndash12 on October 1 Equivalent to percentage of Oregon 9th grade students who receive a regular diploma within four years
2003-04 AYP Policy and Technical Manual May 2004
Pennsylvania Graduation rate Measured over time by comparing the number of students receiving a regular high school diploma in a given year against the total number of students entering that 9th grade class four years earlier Uses the NCES calculation methodology for graduation rate both in the aggregate and when necessary disaggregated This calculation method utilizes the number of graduates that have earned a standard diploma in the numerator divided by the number of graduates and recipients of non-standard diplomas plus dropouts
Pennsylvania Consolidated State Application Accountability Workbook Revised May 8 2004 (approved USDOE)
X 100
Education Commission of the States 700 Broadway Suite 1200 Denver CO 80203-3460 3032993600 Fax 3032968332 wwwecsorg
bull Page 35 bull
State Graduation Rate Definitions amp Notes Source from the current year and the previous three years in the denominator Until cumulative four-year data are available will use the National Center for Educational Statistics (NCES) graduation rate synthetic methodology for reporting disaggregated data The synthetic formula uses the graduates in the numerator The graduates plus the 12th grade dropouts 11th grade dropouts 10th grade dropouts and 9th grade dropouts from the same (current) year are used in the denominator
Rhode Island The proposed formula for graduate rate is as follows Graduation of FY 2002 Graduates Rate = of FY 2002 Graduates + of Grade 9 dropouts in FY 1999 + of Grade 10 dropouts in FY 2000 + of Grade 11 dropouts in FY 2001 + of Grade 12 dropouts in FY 2002 + Then we will complete the transition to cohort reporting over the next three years as we implement a universal student identifier system The percentage of students from the Class of 2003 who dropped out of school this percentage is calculated using four years of data that is by tracking the students from this graduating class from the time they entered high school four years ago
Consolidated Application Accountability Workbook (approved by USDOE) Report Card
South Carolina The percentage of original 9th grade students who earn standard high school diplomas who graduate in four years or less (in other words on time) Formula SchoolDistrict 1 Student Count
9th Grade Student Count for school year beginning four years before year of graduation (count is taken from the 9th grade Master Classification List)
Subtract 9th grade repeaters Subtract all students who transferred out of schooldistrict Add all students who transferred into schooldistrict Equals Total Number of Students
2 Diplomas
Number of students receiving regular diplomas in four years Equals Total Number of Diplomas
3 Graduation Rate
Divide (Step Two by Step One)
All IEP non-diploma track student counts are included GED is not included Procedures Collected by state department office of research Reported by school districts Timeframe 190 Days ndash Available 2003 Addendum After Summer School
Report card httpwwwsdestatescus South Carolina Accountability Workbook Revised June 18 2004 (approved by USDOE)
Education Commission of the States 700 Broadway Suite 1200 Denver CO 80203-3460 3032993600 Fax 3032968332 wwwecsorg
bull Page 36 bull
State Graduation Rate Definitions amp Notes Source South Dakota Divide the total number of graduates (completers) by the total
number of graduates (completers) plus 11th and 12th grade dropouts The formula below will be fully implemented in four years In school year 2003 include 12th grade data only in school year 2004 include 11th and 12th grade data in school year 2005 include 10th through 12th grade and in school year 2006 full implementation with the inclusion of data for grades 9th through 12th grades
The formula
High School Completers in Year 4 Dropouts (Gr 9 year 1 + Gr 10 year 2 + Gr 11 year 3
+ Gr 12 year 4) + HS Completers Year 4 This calculation is based on the recommendation of NCES in a publication ldquoPublic High School Dropouts and Completers from Common Core of Data School Year 1998-99 through 1999-2000rdquo Definition of Terms (based on NCES recommendations) Dropout An individual who
bull Was enrolled in school at some time during the previous school year and
bull Was not enrolled at the beginning of the current school year and
bull Has not graduated from high school or completed a state or district approved educational program and
bull Does not meet any of the following exclusionary conditions o Transfer to another public school district private school
or state- or district-approved educational program (including correctional or health facility programs)
o Temporary absence due to suspension or school-excused illness or
o Death High School Completers
bull Diploma recipients ndash individuals who are awarded a high school diploma This would not include students that may receive a non-standard diploma (for example a GED or certificate of completion)
Students with disabilities who complete the required coursework for graduation will receive a regular high school diploma A student with an IEP who meets these criteria will be counted as a high school completer However students with an IEP who do not graduate in the standard number of years and who do not meet all required coursework for graduation will not be considered a high school completer
Report Card South Dakota Consolidated Application Accountability Workbook Approved by USDOE on June 17 2004
Tennessee Tennessee has a mandatory attendance software package which is used for calculating financial information based on average daily attendance as well as average daily membership In this way students are assigned student numbers and are coded as withdrawing transferring and dropouts The system is precise and monitored by state personnel as the per-pupil expenditure follows the student from system to system Each student is tracked from school to school and system to system with an identifying number for the entire state system This process guarantees that no student who has dropped out of school will be counted as a transfer or in any
Consolidated State Application Accountability Workbook Revised June 14 2004 (approved by USDOE)
Education Commission of the States 700 Broadway Suite 1200 Denver CO 80203-3460 3032993600 Fax 3032968332 wwwecsorg
bull Page 37 bull
State Graduation Rate Definitions amp Notes Source calculation of the Graduation Rate The state calculates graduation rates in a uniform manner for all schools and school districts The graduation rate does not include students who obtain a GED a special education diploma or certificate of attendance The graduation rate is a cumulative or longitudinal rate that will consider the number of students who actually graduate as a percent of those who were in membership and could have graduated over a four-year period from grade 9 through 12 including summer term attendance The number of graduates is divided by the sum of graduates plus dropouts + completers over four years The denominator for this rate is Grads + 12th grade dropouts from current year + completers + 11th grade dropouts one year previously + 10th grade dropouts two years previously + 9th grade dropouts three years previously Estimates the percent of students who complete high school on time with a regular diploma Regular On-Time Graduates divided by Regular On-Time Graduates + Other Graduates + Dropouts ldquoRegular on-time graduatesrdquo are students who receive a regular high school diploma within four years and one summer and special education students or English Language Learner (ELL) students who receive regular diplomas within five years and one summer ldquoOther graduatesrdquo include students receiving certificates of attendance special education diplomas and GED certificates Dropouts include students from the 2003-04 graduating class who dropped out of school in the 9th grade (2000-01) 10th grade (2001-02) 11th grade (2002-03) and 12th grade (2003-04)
httpwww2statetnusk-12aypgradratepdf
Texas Graduation Rates are rounded to one decimal place before improvement is calculated Therefore 01 is the minimum improvement required Districts and campuses that meet the 70 Graduation Rate standard are not also required to show improvement Graduation Rate Minimum Size Requirement All Students For the Graduation Rate to be evaluated in the AYP calculation at the all students-level the district or campus must have at least 40 students in the completionstudent status rate class Districts and campuses with fewer than 40 students in the completionstudent status rate class are not required to meet the Graduation Rate measures If a district or campus meets the minimum size requirement for the Graduation Rate for the current year improvement from the prior year is calculated even if the district or campus does not meet the minimum size requirement on the Graduation Rate for the prior year Improvement is not calculated if the district or campus does not have a Graduation Rate for the prior year
httpwwwteastatetxusayp2004guidepdf
Utah Utah restricts the cohort to grades 10 through 12 since Utah high schools which may implement any of three different grade spans have only these three grades in common in fact nearly half have only these three grades ndash Grades 7-12 (21 of high schools) Grades 9-12 (33) and Grades 10-12 (46) Specifically the cohort graduation rate will be operationalized as follows The number of students who graduated from 12th grade in the current year divided by the sum of (1) these same graduates and (2) the number of students who dropped out of 12th grade in the
Utah Consolidated Application (approved by USDOE)
Education Commission of the States 700 Broadway Suite 1200 Denver CO 80203-3460 3032993600 Fax 3032968332 wwwecsorg
bull Page 38 bull
State Graduation Rate Definitions amp Notes Source current year (3) 11th grade in the prior year and (4) 10th grade in the year before that Regular diploma graduates may include students with disabilities who can be retained as seniors until the age of 22 As long as such students are retained their cohort status will be adjusted so that their completion status will be included in the calculation of the graduation rate for the graduating class of the year in which it is finally determined
Vermont Academic indicator for all students is graduation rate Academic indicator for subgroups is grade 10 Basic Reading Counted as a graduate if received certificate of attendance or GED Also counted as a graduate if student is in an institution such as military that offers secondary education program On April 15 2003 the state board formally approved a five-year definition of graduation for the purposes of school accountability However this cannot be calculated and reported accurately until 2005 In the meantime Vermont will use the four-year calculation for the all-student AYP group Also will use the 10th grade New Standards Reference Exam Basic Reading indicator for subgroup disaggregation until 2005 when it will be possible to disaggregate the graduation rate Vermont has deferred a request for a five-year rate until 2005 when the impact data will be available to submit with the request to move to that rate The longitudinal completion rate is calculated by dividing the total number of graduates in a particular class and dividing it by the cumulative number of dropouts over the four-year period when the specified class would have attended high school This rate attempts to estimate the graduation rate for a single class of students when actual cohort data are unavailable
Report card httpdataedstatevtusaccountability03LEA_T129_03 pdf Consolidated Application Accountability Workbook State of Vermont Revised December 2 2004 Vermont School Report
Virginia The standard number of years for graduation is defined as four years or less A detailed explanation of the formula as it applies to Virginia follows GRi = G 1 Gi + (number of students receiving Special Diploma Modified Standard Diploma Certificate of Attendance and GED certificates for year) + Di + D (i ndash 1) + D(i ndash 2) + D(i ndash 3) Where GRi is the graduation rate for a given year (i) between 2002 and 2014 Gi is the number of students achieving a regular high school diploma (excluding Special Diploma Modified Standard Diploma Certificate of Attendance and GED certificates) for Year i Di the number of dropouts in grade 12 for year i D(i ndash 1) is the number of dropouts in grade 11 for the previous year (i-1)
Virginia Board of Education Consolidated State Application Amended Accountability Workbook Revised May 26 2004 Based on USED Letter of Approval May 25 2004 VBOE Letter of Response June 8 2004 httpwwwedgovadminsleadaccountlettersvadoc
Education Commission of the States 700 Broadway Suite 1200 Denver CO 80203-3460 3032993600 Fax 3032968332 wwwecsorg
bull Page 39 bull
State Graduation Rate Definitions amp Notes Source D(i ndash 2) is the number of dropouts in grade 10 for the previous year (i-2) D(i ndash 3) is the number of dropouts in grade 9 for the previous year (i-3) Graduation rates reflect only students who receive Standard or Advanced Studies Diplomas
Graduation rates are calculated by dividing the number of students receiving a diploma during a school year by the total of the following
bull The number of students receiving a diploma certificate of attendance or GED
bull The number of students who dropped out in grade 12
bull The number of students in grade 11 who dropped out during the previous year
bull The number of students in grade 10 who dropped out two years earlier
bull The number of students in grade 9 who dropped out three years earlier
Virginia currently defines graduation rate as ldquoa percent of 9th grade membership four years laterrdquo but plans to implement a student record system over the next three to five years that will enable Virginia to calculate a longitudinal rate and will decrease unreliability In the transition Virginia will calculate graduation rate using the NCES method For calculating lsquosafe harborrsquo Virginia uses an alternative additional indicator that can be disaggregated until 2005-06
Washington Estimated Cohort Graduation Rate (class of 2002) This rate represents only those students with an expected graduation year of 2002 These students would have started grade 9 in the fall of 1998 and were expected to graduate ldquoon timerdquo in four years Percentage of students who graduate from public high school with a regular diploma (not including a GED or any other diploma not fully aligned with the statersquos academic content standards) in the standard number of years The period of time required for students with disabilities to graduate is specified in each individualized education program (IEP) Students with disabilities who earn a diploma by completing the requirements of an IEP in the required period of time are counted as graduates The graduation rate is calculated as follows
The number of graduates with a regular diploma in four years divided by
The number of graduates with a regular diploma in four years plus the number of students who dropped out of high school in that cohort
grades 9 through 12 plus students who have continued to be enrolled but not graduated
Report Card httpwwwk12wausdataadmin Washingtonrsquos Consolidated Application Accountability Workbook Amendments Resubmitted June 16 2004 and approved June 18 2004
West Virginia 410 West Virginias graduation rate is measured using the number West Virginia Board of Education Policy 2520
Education Commission of the States 700 Broadway Suite 1200 Denver CO 80203-3460 3032993600 Fax 3032968332 wwwecsorg
bull Page 40 bull
State Graduation Rate Definitions amp Notes Source of students who graduate from a public high school with a regular diploma not including a Graduate Equivalency Diploma (GED) or any other diploma not fully aligned with the states academic standards in the standard number of years For students with disabilities the students Individualized Education Plan (IEP) will determine the standard number of years for graduation
4101 The calculation for the graduation rate is the method recommended by the National Center for Education Statistics (NCES) The formula is
Total number of four year graduates divided by the sum of the total number of four year graduates plus the dropouts for the four years of high school for this class of graduates
gt(gt+d12t+d11
(t-1)+d10(t-2)+d9
(t-3))
G = graduates d = dropouts t = year of graduation 12 11 10 and 9=class level
For the AYP determination the graduation rate calculation will be used for accountability at the public schoolLEAstate education agency (SEA) levels but will not be used for each subgroup However for public schoolsLEAs that use the safe harbor provision to meet AYP for the achievement indicator the graduation rate standard must be met by each of the nine subgroups Schools will be considered as having met the AYP if they meet or exceed the standard or if they have made improvement toward the standard
Wisconsin Graduation rate The number of ldquograduatesrdquo divided by the number of ldquograduatesrdquo plus ldquocohort dropoutsrdquo over four years expressed as a percentage Graduate A student who met graduation requirements for a regular diploma during a school year prior to the beginning of the fall semester of the next school year This would include any student who graduated at mid-year who transferred into or re-entered the high school during the year (even if the student was not included in the third Friday in September school enrollment count) who graduated in the spring of the school year or who accumulated required credits during summer school Students who receive an alternative diploma such as a HSED GED or ldquocertificate of attendancerdquo are not counted as graduates Dropout A student who was enrolled in the school at some time during a school year was not enrolled at the beginning of the next school year (third Friday in September) has not graduated from high school or completed a state or district-approved educational program and does not meet any of the following exclusionary conditions 1 Has not transferred to another public school district private school or state- or district-approved educational program 2 Is temporarily absent due to expulsion suspension or school-approved illness 3 Has died Cohort dropout Any student who was a 12th grade dropout for the year reported an 11th grade dropout for the prior year a 10th grade dropout for two years prior or a 9th grade dropout for three years
Report card Consolidated State Application Accountability Workbook Last Revised May 14 2004 (approved by USDOE)
Education Commission of the States 700 Broadway Suite 1200 Denver CO 80203-3460 3032993600 Fax 3032968332 wwwecsorg
bull Page 41 bull
State Graduation Rate Definitions amp Notes Source prior
Wyoming Defined as the total number of graduates divided by the total number of students who left school including students who completed high school and drop-outs from that class over the past four years The rate incorporates four years worth of data and thus is an estimated cohort rate It is calculated by dividing the number of students who receive a regular diploma by the sum of dropouts from grade 9 through 12 in consecutive years plus the number of students completing high school If a hypothetical graduating class began as 9th graders in Year 1 this four-year completion rate would look like
Students Receiving a Regular Diploma in Year 4 divided by
Dropouts (Grade 9 Year 1 + Grade 10 Year 2 + Grade 11 Year 3 +
Grade 12 Year 4) + Students Completing High School Year 4 This formula used by the department of education is an ldquoexiterrdquo rate The denominator is the total of all ldquoexitersrdquo from a school over a four-year period for a grade cohort The exiters are the 9th grade drop-outs three years ago the 10th grade drop-outs two years ago 11th grade drop-outs last year and this yearrsquos 12th grade drop-outs plus completers The numerator is the count of this yearrsquos regular diploma recipients The rate answers ldquoWhat percent of students exiting education do so with a regular diplomardquo
Consolidated Application Accountability Workbook 2003-2004 Revised Submission August 11 2004 (approved by USDOE)
Territories American Samoa
Could not locate
Puerto Rico Computes the high school graduation rate (HSGR) using and adaptation of the method recommended by the National Center for Education Statistics as follows
HSGR(i) = TG(i) TNC(i) x 100 wherehellip
TG(i) = NG(i) + NGS(i) TNC (i) = NG(i) + NGS(i) + N10DO(i-2) +
N11DO(i-1) + N12DO(i)
andhellip
i = The specific school year for which the computation is made HSGR(i) = High School Graduation Rate for school year i TG(i) = Total graduates with regular diploma who completed high school in three years for school year i TNC(i) = Estimated size of the high school cohort for school year i NG(i) = Number of graduates with regular diploma who completed high school in three years during the regular school year i NGS(i) = Number of graduates with regular diploma who completed high school in three years during the summer of school year i
Consolidated Application Accountability Workbook May 1 2003
Education Commission of the States 700 Broadway Suite 1200 Denver CO 80203-3460 3032993600 Fax 3032968332 wwwecsorg
bull Page 42 bull
State Graduation Rate Definitions amp Notes Source NG10DO(i -2) = Number of grade 10 dropouts in school year i -2 NG11DO(i-1) = Number of grade 11 dropouts in school year i -1 NG12DO(i) = Number of grade 12 dropouts in school year i Dropouts = Students who leave school prior to graduation for reasons other than transfer to another school in PR or moving from the island
Virgin Islands Could not locate
Kathy Christie vice president for knowledge management amp the ECS Clearinghouse compiled this StateNote copy 2005 by the Education Commission of the States (ECS) All rights reserved ECS is a nonprofit nationwide organization that helps state leaders shape education policy To request permission to excerpt part of this publication either in print or electronically please fax a request to the attention of the ECS Communications Department 3032968332 or e-mail ecsecsorg
Helping State Leaders Shape Education Policy
- Sources Used
- Highlights
- TABLE 1 State Targets for Attendance and Graduation Rates
- Territories
- TABLE 2 How Attendance Rates Are Calculated
- Accountability Workbook
- Territories
- TABLE 3 How Graduation Rates are Calculated
-
- February 2004
-
- Accountability Workbook
- Territories
-
- HSGR(i) = TG(i) TNC(i) x 100
-
- andhellip
- Helping State Leaders Shape Education Policy
-

Education Commission of the States 700 Broadway Suite 1200 Denver CO 80203-3460 3032993600 Fax 3032968332 wwwecsorg
bull Page 28 bull
State Graduation Rate Definitions amp Notes Source
Minnesota The calculation does not include students who graduate with GEDs or any other diploma not aligned to the statersquos academic standards Students are counted as dropped if they are reported as a drop and do not re-enroll in another school during the four year period Minnesota currently is not able to control for students who finish high school within four years from their start date The methodology allows for a consistent computation for all schools and districts in the state and includes students who change schools part way through their high school career The computation is based on students who receive diplomas in year four of the emulated cohort
Number of graduates year 4 divided by
Dropouts (Grade 9 Year 1 + Grade 10 Year 2+ Grade 11 Year 3 + Grade 12 Year 4) + Completers Year 4
Consolidated State Application Accountability Workbook updated Sept 29 2004 (approved USDOE Sept 30 2004)
Mississippi The graduation rate is calculated by dividing the number of the yearrsquos graduates by the number of 9th grade students four years earlier The adjusted 9th grade enrollment reflects the number of new students entering the school the number moving out and the number failing over the four-year period
Report card
Missouri The quotient of the number of graduates in the current year as of June 30th divided by the sum of the number of graduates in the current year as of June 30th plus the number of 12th graders who dropped out in the current year plus the number of 11th graders who dropped out in the second preceding year plus the number of 9th graders who dropped out in the third preceding year
(Graduates (9-12 Cohort Dropouts + Graduates)) x 100
5 CSR 50-340200 Report Card
Montana Montanarsquos graduation rate is an estimated cohort group rate that is calculated by the method recommended by the NCES
gt (c + gt+ d12t + d11
(t-1) + d10(t-2) + d9
(t-3)) Where
g = of graduates receiving a standard high school diploma in standard of years c = completers of high school by other means t = year of graduation d = dropouts 12 11 10 9 = class level All students graduating in Montana receive a standard high school diploma and will be counted as a graduate Students receiving a GED are not included as graduates when calculating graduation rates Montanarsquos definition of a dropout is consistent with the requirements of the NCES Common Core of Data (CCD) reporting According to Montanarsquos definition a dropout is an individual who
Was enrolled in school on the date of the previous year October enrollment count or at sometime during the previous school year and was not enrolled on the date of the current school year October count or Was not enrolled at the beginning of the previous year but was
Consolidated State Application Accountability Workbook Revised June 6 2003
Education Commission of the States 700 Broadway Suite 1200 Denver CO 80203-3460 3032993600 Fax 3032968332 wwwecsorg
bull Page 29 bull
State Graduation Rate Definitions amp Notes Source expected to enroll and did not reenroll during the year (ldquono showrdquo) and was not enrolled on the date of the current school year October count and Has not graduated from high school or completed a state- or district-approved high school educational program and Has not transferred to another school been temporarily absent due to a school-recognized illness or suspension or died (Montana Dropout Statistics Collectorrsquos Handbook
httpwwwopistatemtuspdfacddohandbookpdf) Previous year graduation rate used (2002 graduation rate in 2003) for all AYP determinations For purposes of AYP (other than ldquosafe harborrdquo) the calculation of the graduation rate applies to the school and district level but not to the subgroup level
Nebraska Local school boards are responsible for establishing the requirements for high school graduation For AYP reporting NCLB requires a cumulative graduation rate that considers the number of students who actually graduate as a percent of those who were in membership and could have graduated over a four-year period from grades9 through 12 Definition does not allow for the inclusion of dropouts and does not allow the use of transfer to avoid counting a student as a dropout
Adequate Yearly Progress (AYP) under No Child Left Behind (NCLB) Guidance Revised for the 2003-04 Reporting Retrieved from wwwndestateneusstars documentsAYPGuidance2003-04revisedpdf
Nevada Graduation rate is based on a 9th grade cohort of students Two substantive differences exist between graduation rate and the other AYP indicators First the need for completion information makes it impossible to calculate the indicator for the ldquocurrentrdquo school year In other words for the 2002-03 AYP determinations graduation rates reflecting the graduating class of 2001-02 had to be used Second the graduation rate indicator collapses information across a four-year time span while the other indicators rely primarily on a single year of information This means that change with respect to graduation rate is likely to take more time to observe Until the 2006-07 school year average daily attendance will be used as a proxy for the economically disadvantaged limited English proficient and students with disabilities subgroups Nevada adapted the NCES definition of completion rate which incorporates completers and dropouts ldquoCompletersrdquo include standard and advanced diploma recipients adjusted diploma recipients and certificate of attendance recipients Graduation rate only counts diploma recipient completers in the numerator excluding adjusted diploma recipients The denominator includes all diploma recipients certificate of attendance recipients dropouts (9th 10th 11th and 12th) and GED recipients For the 2001-2002 school year graduation rate is equal to
of diploma recipients (01-02) (excluding adjusted diploma recipients) divided by
of diploma recipients (01-02) (all recipients) + certificate of
attendance recipients (01-02) + GED recipients (01-02) + 9th grade dropouts (98-99) + 10th grade
A Guide to No Child Left Behind amp Adequate Yearly Progress Analyses in Nevada httpwwwdoenvgovnclb aypquestionsguidehtmother_indicators Consolidated State Application Accountability Workbook submitted August 26 2004 (approved October 6 2004 by USDOE)
Education Commission of the States 700 Broadway Suite 1200 Denver CO 80203-3460 3032993600 Fax 3032968332 wwwecsorg
bull Page 30 bull
State Graduation Rate Definitions amp Notes Source dropouts (99-00) +
11th grade dropouts (00-01) + 12th grade dropouts (01-02) Prior year graduation rates used to calculate AYP The state board is expected to revise the 50 target graduation rate
New Hampshire
New Hampshire plans to use a modified definition of graduation rate used by the National Center for Education Statistics until such time as a data collection system allows an accurate graduation rate (does not include GED) New Hampshire may use this modified rate until the 2005-2006 school year (From USDOE Decision Letter dated June 25 2003) Intends to transition to a graduation rate definition consistent with NCLB requirements New Hampshirersquos graduation rate will be calculated as the percentage of students who complete high school and earn a regular diploma within the standard number of years The standard numbers of years for students with IEP504 plans are specified in those documents NH Graduation Rate = Completer Rate X Regular Diploma Rate Where Completer Rate = 100 ndash Cumulative Dropout Rate and Regular Diploma Rate in the standard of years = of completers with regular diplomas earned in the standard of years Number of completers with regular + nonstandard diplomas Dropouts are defined as students who leave school prior to gradu-ation for reasons other than transfer to another school or death of student In New Hampshire four is the standard number of years for students who do not have IEPs or 504 plans An additional year may be considered for completion to accommodate variations across districts and schools including but not limited to (a) the number of credits required for graduation from public schools Many high schools go beyond the minimum number of credits for graduation (set at the state level) For example a student may transfer from a school requiring 20 credits to a school requiring 23 credits a public school may not accept all credits from a private school or variations in course offerings may make it necessary for a student to take a few courses during the fifth year (b) the number of credits from private schools that are accepted when a student transfers to a public school and (c) the needs of students who are enrolled in Dropout RecoveryIntervention Programs developed at the local level Students attending public schools that have an active dropout recovery program may need a fifth year to complete high school graduation requirements If this is not allowed there would be a disincentive to recover students before they permanently drop out Graduation rate is included (in the aggregate) for AYP and disaggregated (as necessary) for use when applying the exception clause to make AYP A student is a dropout 1 On the day following the studentrsquos declaration of dropout status
if age 18 or older 2 On the day following the parentrsquos or guardianrsquos declaration of
dropout status if age 16 or older 3 On the 16th consecutive day of failure to attend school when the
absence has not been excused by the school board and when the student is 18 or older
4 On the 16th day following the end of an expulsion period if the
Dropout Reporting Procedures For the 2002-2003 School Year NH Department of Education Division of Program Support Bureau of Information Services September 3 2003 Consolidated State Application Accountability Workbook Amended March 30 2004 (approved August 17 2004 by USDOE)
Education Commission of the States 700 Broadway Suite 1200 Denver CO 80203-3460 3032993600 Fax 3032968332 wwwecsorg
bull Page 31 bull
State Graduation Rate Definitions amp Notes Source student has failed to return to school or to enroll in another school or home schooled program and the student is 18 or older
5 On the day a district removes a student from the attendance roster because he has reached age 21 and has not yet graduated (A district may permit continued attendance for a student over 21)
6 On the 16th consecutive day of failure to attend an adult education program that the school board has approved as an alternative program This student will be considered a dropout from the public school last attended (Students in adult education programs are generally considered dropouts See the more detailed discussion of adult education programs in the next section)
7 On the day a student leaves school to pursue a GED A student is not a dropout 1 During a period of suspension or temporary expulsion 2 If shehe has transferred to another approved public or private
school or home schooled program within NH or an out-of-state school Transfer status is indicated by (a) a request for the transfer of records or other notification by the receiving school or (b) a written statement by a parent or guardian indicating the student will be attending another school but declining to provide the name of the school because of safety concerns or (c) the truant officer verifies that the student has moved out of the district
New Jersey Beginning with the 2004-2005 school year and all subsequent years New Jersey will begin to implement graduation rate and add a new cohort each year Graduation rate will be defined and calculated by the method recommended by the National Center for Education Statistics
Based on the National Center for Education Statisticsrsquo definition this calculation provides an estimate for the cohort of students that began high school four years ago
The calculation is derived by taking the number of school-year graduates plus the summer graduates following the school year and dividing by a combination of the following
School year plus summer graduates plus number of grade 9 dropouts four years prior plus number of grade 10 dropouts three years prior plus number of grade 11 dropouts two years prior plus number of grade 12 dropouts for this report card year The product is then multiplied by 100 to get the graduation rate
Consolidated State Application Accountability Workbook Revised August 16 2004 (approved USDOE August 18 2004) State Report Card
New Mexico ldquoGraduation raterdquo means the percentage of the students who graduated from a high school divided by the number of students who were enrolled in the schoolsrsquo 40th day of the same year This calculation will be used until four-year cohort data can be collected The 9th grade students from school year 2003-2004 will be the first cohorts graduating in school year 2006-2007
NMAC 6191 3 7 8 9 New Mexico 6191 NMAC 61917 (regulations adopted August 2004)
Education Commission of the States 700 Broadway Suite 1200 Denver CO 80203-3460 3032993600 Fax 3032968332 wwwecsorg
bull Page 32 bull
State Graduation Rate Definitions amp Notes Source New York Graduation rate is based upon the percentage of students measured
from the beginning of high school who graduate from high school with a regular diploma within four years (See below for an exception related to schools that offer a high school diploma and additional certification) In addition New York also holds schools accountable for students who transfer into a school after the beginning of high school New York uses as the denominator (beginning with the students who first entered 9th grade in the 2003ndash04 school year July 31ndashJune 30) the count of students who meet Condition 1 and either Condition 2 or Condition 3 below 1 Enrolled in 9th grade (anywhere) for the first time in a particular
year (year 1) or for ungraded students with disabilities attained age 17 during that school year AND
2 Were enrolled in the school or LEA on the first Wednesday of October in year 1 and did not transfer to another program leading to a high school diploma OR
3 Transferred into the school or LEA after the first Wednesday of October in year 1 and were continuously enrolled in the school or district for a period of five months (excluding July and August) except that students who first enrolled in the school after the first Wednesday in October of year 4 will not be included in the denominator
The graduation rate will be the percentage of these students who earned a regular high school diploma no later than the end of year 4 An exception will be made for high schools where a majority of students participate in a state-approved five-year program that results in the receipt of certification in a career or technology field in addition to a high school diploma For those schools the graduation rate will be the percentage of those students defined in Conditions 1 and 2 who earned a regular high school diploma no later than the end of year 5 The official count of school enrollment is taken each year on the first Wednesday in October Dropout rate measures the rate of dropouts which refers to any student regardless of age who left school prior to graduation for any reason except death and did not enter another school or high school equivalency preparation program or other diploma program
Understanding Your School Report Card February 2004 New York State Education Department
North Carolina Of the students who graduate with a regular diploma this reflects the percentage who graduated in four years or less It does not reflect all 9th graders who entered high school four years earlier Initially defining ldquograduation rate for public high schoolsrdquo as ldquo[t]he percentage of students who graduate from high school with a regular diploma in the standard number of yearsrdquo The 2002-03 ABCs masterbuild files will be coded to reflect diploma recipients The same files will indicate the date when students took End-of-Grade (EOG) tests in 8th grade Calculating the elapsed time between 8th grade EOG tests and diploma receipt will ascertain the number of years Schools will be given the capability to manually record the necessary information for students who do not have 8th
Report Card Consolidated State Application Accountability Workbook May 11 2004 (approved July 2004)
Education Commission of the States 700 Broadway Suite 1200 Denver CO 80203-3460 3032993600 Fax 3032968332 wwwecsorg
bull Page 33 bull
State Graduation Rate Definitions amp Notes Source grade EOG data (for example students who moved into the state after the 8th grade or who previously attended private schools) Timeline for Moving to a Cohort Definition of Graduation Rate For the longer term the first step establishes a baseline for membership in 9th grade during the 2002-03 school year Current student information management systems in North Carolina do not have the capability to track students over a four-year period anywhere in the state Therefore districts asked to generate student rosters for 9th graders in 2002-03 and retain them for future reference Local education agencies andor schools record the transition outcomes for each student on the roster over four years and maintain that information so that it could be matched with the diploma recipient information collected through the 2005-06 masterbuild files (or other data collection that may be more appropriate at that time) Thus the first year in which a cohort based graduation rate could be calculated would be the 2005-06 school year and the first year in which ldquoprogressrdquo could be ascertained using a cohort definition for two successive graduation rates would be 2006-07
North Dakota Graduate rate Counts as graduates within the standard number of years students with disabilities and limited English proficient students who graduate within the extended graduation schedule set forth in their individualized education plans developed by their IEP team or LEP service team
Number of Graduates divided by
Number of Graduates + Dropouts Yr1 + Dropouts Yr2 + Dropouts Yr3 + Dropouts Yr4
The schoolrsquos graduation rate is compared to the statersquos graduation goal and a test of statistical significance is performed where required to ensure the proper AYP status
Decision Letter August 17 2004 USDOE A Guide to the 2003-04 AYP Report North Dakota Department of Public Instruction
Ohio Sample calculation of FY2002 graduates + Summer 2002 Graduates
(Reported in FY2003K) divided by
of grade 9 dropouts in FY1999 + of grade 10 dropouts in FY2000 + of grade 11 dropouts in FY2001 + of grade 12 dropouts in FY 2002 +
of summer graduates 2002 (Reported in FY 2003K) X 100
The graduation rate is an estimated cohort group rate that is calculated by the method recommended by the National Center for Educational Statistics Students receiving non-standards based diplomas or GEDs are not included as graduates when calculating graduation rates The following website address contains the Student Data Elements section of Ohiorsquos educational management system httpwww odestateohusemisdocumentationmanual2003chapter_2asp and includes information about the calculation of the graduation rate
EMIS Guidelines State of Ohio Consolidated Application Accountability Workbook January 2003 (approved by USDOE)
Oklahoma Graduation rate is included (in the aggregate) for AYP and disaggregated (as necessary) for use when applying the exception
Consolidated State Application Accountability
Education Commission of the States 700 Broadway Suite 1200 Denver CO 80203-3460 3032993600 Fax 3032968332 wwwecsorg
bull Page 34 bull
State Graduation Rate Definitions amp Notes Source clause to make AYP Beginning in 2004-2005 the graduation rate is calculated using an estimated cohort group rate which is a recommended method by the National Center of Educational Statistics The calculation is shown below Number of Students Graduating with a Regular Diploma including summer graduates in 2003-2004
divided by
Number of Students Graduating with a Regular Diploma including summer graduates in 2003-2004
+ Number of Grade 12 Dropouts in 2003-2004
+ Number of Grade 11 Dropouts in 2002-2003
+ Number of Grade 10 Dropouts in 2001-2002
+ Number of Grade 9 Dropouts in 2000-2001
+ Number Receiving GEDs
Workbook August 26 2004 (approved by USDOE Sept 1 2004)
Oregon Weighted average of enrollment times graduation rate for each year Graduation rate = Number of students graduating with a regular diploma divided by (number of students graduating with a regular diploma + number of dropouts in grades 9 ndash 12) Graduates
bull Students are counted as graduates if they receive a regular high school diploma including an adult high school diploma The Oregon high school diploma requires at least 22 credits to earn
Not Graduates bull Students are not counted as graduates if they receive modified
diplomas based on completion of a special education individualized education program
bull Students are not counted as graduates if they receive credentials that require fewer than 22 credits to earn
bull Students are not counted as graduates if they finish their senior year and did not receive any credentials
bull Students are not counted as graduates if they earn a GED Enrollment is the number of students in membership in grades 9 ndash12 on October 1 Equivalent to percentage of Oregon 9th grade students who receive a regular diploma within four years
2003-04 AYP Policy and Technical Manual May 2004
Pennsylvania Graduation rate Measured over time by comparing the number of students receiving a regular high school diploma in a given year against the total number of students entering that 9th grade class four years earlier Uses the NCES calculation methodology for graduation rate both in the aggregate and when necessary disaggregated This calculation method utilizes the number of graduates that have earned a standard diploma in the numerator divided by the number of graduates and recipients of non-standard diplomas plus dropouts
Pennsylvania Consolidated State Application Accountability Workbook Revised May 8 2004 (approved USDOE)
X 100
Education Commission of the States 700 Broadway Suite 1200 Denver CO 80203-3460 3032993600 Fax 3032968332 wwwecsorg
bull Page 35 bull
State Graduation Rate Definitions amp Notes Source from the current year and the previous three years in the denominator Until cumulative four-year data are available will use the National Center for Educational Statistics (NCES) graduation rate synthetic methodology for reporting disaggregated data The synthetic formula uses the graduates in the numerator The graduates plus the 12th grade dropouts 11th grade dropouts 10th grade dropouts and 9th grade dropouts from the same (current) year are used in the denominator
Rhode Island The proposed formula for graduate rate is as follows Graduation of FY 2002 Graduates Rate = of FY 2002 Graduates + of Grade 9 dropouts in FY 1999 + of Grade 10 dropouts in FY 2000 + of Grade 11 dropouts in FY 2001 + of Grade 12 dropouts in FY 2002 + Then we will complete the transition to cohort reporting over the next three years as we implement a universal student identifier system The percentage of students from the Class of 2003 who dropped out of school this percentage is calculated using four years of data that is by tracking the students from this graduating class from the time they entered high school four years ago
Consolidated Application Accountability Workbook (approved by USDOE) Report Card
South Carolina The percentage of original 9th grade students who earn standard high school diplomas who graduate in four years or less (in other words on time) Formula SchoolDistrict 1 Student Count
9th Grade Student Count for school year beginning four years before year of graduation (count is taken from the 9th grade Master Classification List)
Subtract 9th grade repeaters Subtract all students who transferred out of schooldistrict Add all students who transferred into schooldistrict Equals Total Number of Students
2 Diplomas
Number of students receiving regular diplomas in four years Equals Total Number of Diplomas
3 Graduation Rate
Divide (Step Two by Step One)
All IEP non-diploma track student counts are included GED is not included Procedures Collected by state department office of research Reported by school districts Timeframe 190 Days ndash Available 2003 Addendum After Summer School
Report card httpwwwsdestatescus South Carolina Accountability Workbook Revised June 18 2004 (approved by USDOE)
Education Commission of the States 700 Broadway Suite 1200 Denver CO 80203-3460 3032993600 Fax 3032968332 wwwecsorg
bull Page 36 bull
State Graduation Rate Definitions amp Notes Source South Dakota Divide the total number of graduates (completers) by the total
number of graduates (completers) plus 11th and 12th grade dropouts The formula below will be fully implemented in four years In school year 2003 include 12th grade data only in school year 2004 include 11th and 12th grade data in school year 2005 include 10th through 12th grade and in school year 2006 full implementation with the inclusion of data for grades 9th through 12th grades
The formula
High School Completers in Year 4 Dropouts (Gr 9 year 1 + Gr 10 year 2 + Gr 11 year 3
+ Gr 12 year 4) + HS Completers Year 4 This calculation is based on the recommendation of NCES in a publication ldquoPublic High School Dropouts and Completers from Common Core of Data School Year 1998-99 through 1999-2000rdquo Definition of Terms (based on NCES recommendations) Dropout An individual who
bull Was enrolled in school at some time during the previous school year and
bull Was not enrolled at the beginning of the current school year and
bull Has not graduated from high school or completed a state or district approved educational program and
bull Does not meet any of the following exclusionary conditions o Transfer to another public school district private school
or state- or district-approved educational program (including correctional or health facility programs)
o Temporary absence due to suspension or school-excused illness or
o Death High School Completers
bull Diploma recipients ndash individuals who are awarded a high school diploma This would not include students that may receive a non-standard diploma (for example a GED or certificate of completion)
Students with disabilities who complete the required coursework for graduation will receive a regular high school diploma A student with an IEP who meets these criteria will be counted as a high school completer However students with an IEP who do not graduate in the standard number of years and who do not meet all required coursework for graduation will not be considered a high school completer
Report Card South Dakota Consolidated Application Accountability Workbook Approved by USDOE on June 17 2004
Tennessee Tennessee has a mandatory attendance software package which is used for calculating financial information based on average daily attendance as well as average daily membership In this way students are assigned student numbers and are coded as withdrawing transferring and dropouts The system is precise and monitored by state personnel as the per-pupil expenditure follows the student from system to system Each student is tracked from school to school and system to system with an identifying number for the entire state system This process guarantees that no student who has dropped out of school will be counted as a transfer or in any
Consolidated State Application Accountability Workbook Revised June 14 2004 (approved by USDOE)
Education Commission of the States 700 Broadway Suite 1200 Denver CO 80203-3460 3032993600 Fax 3032968332 wwwecsorg
bull Page 37 bull
State Graduation Rate Definitions amp Notes Source calculation of the Graduation Rate The state calculates graduation rates in a uniform manner for all schools and school districts The graduation rate does not include students who obtain a GED a special education diploma or certificate of attendance The graduation rate is a cumulative or longitudinal rate that will consider the number of students who actually graduate as a percent of those who were in membership and could have graduated over a four-year period from grade 9 through 12 including summer term attendance The number of graduates is divided by the sum of graduates plus dropouts + completers over four years The denominator for this rate is Grads + 12th grade dropouts from current year + completers + 11th grade dropouts one year previously + 10th grade dropouts two years previously + 9th grade dropouts three years previously Estimates the percent of students who complete high school on time with a regular diploma Regular On-Time Graduates divided by Regular On-Time Graduates + Other Graduates + Dropouts ldquoRegular on-time graduatesrdquo are students who receive a regular high school diploma within four years and one summer and special education students or English Language Learner (ELL) students who receive regular diplomas within five years and one summer ldquoOther graduatesrdquo include students receiving certificates of attendance special education diplomas and GED certificates Dropouts include students from the 2003-04 graduating class who dropped out of school in the 9th grade (2000-01) 10th grade (2001-02) 11th grade (2002-03) and 12th grade (2003-04)
httpwww2statetnusk-12aypgradratepdf
Texas Graduation Rates are rounded to one decimal place before improvement is calculated Therefore 01 is the minimum improvement required Districts and campuses that meet the 70 Graduation Rate standard are not also required to show improvement Graduation Rate Minimum Size Requirement All Students For the Graduation Rate to be evaluated in the AYP calculation at the all students-level the district or campus must have at least 40 students in the completionstudent status rate class Districts and campuses with fewer than 40 students in the completionstudent status rate class are not required to meet the Graduation Rate measures If a district or campus meets the minimum size requirement for the Graduation Rate for the current year improvement from the prior year is calculated even if the district or campus does not meet the minimum size requirement on the Graduation Rate for the prior year Improvement is not calculated if the district or campus does not have a Graduation Rate for the prior year
httpwwwteastatetxusayp2004guidepdf
Utah Utah restricts the cohort to grades 10 through 12 since Utah high schools which may implement any of three different grade spans have only these three grades in common in fact nearly half have only these three grades ndash Grades 7-12 (21 of high schools) Grades 9-12 (33) and Grades 10-12 (46) Specifically the cohort graduation rate will be operationalized as follows The number of students who graduated from 12th grade in the current year divided by the sum of (1) these same graduates and (2) the number of students who dropped out of 12th grade in the
Utah Consolidated Application (approved by USDOE)
Education Commission of the States 700 Broadway Suite 1200 Denver CO 80203-3460 3032993600 Fax 3032968332 wwwecsorg
bull Page 38 bull
State Graduation Rate Definitions amp Notes Source current year (3) 11th grade in the prior year and (4) 10th grade in the year before that Regular diploma graduates may include students with disabilities who can be retained as seniors until the age of 22 As long as such students are retained their cohort status will be adjusted so that their completion status will be included in the calculation of the graduation rate for the graduating class of the year in which it is finally determined
Vermont Academic indicator for all students is graduation rate Academic indicator for subgroups is grade 10 Basic Reading Counted as a graduate if received certificate of attendance or GED Also counted as a graduate if student is in an institution such as military that offers secondary education program On April 15 2003 the state board formally approved a five-year definition of graduation for the purposes of school accountability However this cannot be calculated and reported accurately until 2005 In the meantime Vermont will use the four-year calculation for the all-student AYP group Also will use the 10th grade New Standards Reference Exam Basic Reading indicator for subgroup disaggregation until 2005 when it will be possible to disaggregate the graduation rate Vermont has deferred a request for a five-year rate until 2005 when the impact data will be available to submit with the request to move to that rate The longitudinal completion rate is calculated by dividing the total number of graduates in a particular class and dividing it by the cumulative number of dropouts over the four-year period when the specified class would have attended high school This rate attempts to estimate the graduation rate for a single class of students when actual cohort data are unavailable
Report card httpdataedstatevtusaccountability03LEA_T129_03 pdf Consolidated Application Accountability Workbook State of Vermont Revised December 2 2004 Vermont School Report
Virginia The standard number of years for graduation is defined as four years or less A detailed explanation of the formula as it applies to Virginia follows GRi = G 1 Gi + (number of students receiving Special Diploma Modified Standard Diploma Certificate of Attendance and GED certificates for year) + Di + D (i ndash 1) + D(i ndash 2) + D(i ndash 3) Where GRi is the graduation rate for a given year (i) between 2002 and 2014 Gi is the number of students achieving a regular high school diploma (excluding Special Diploma Modified Standard Diploma Certificate of Attendance and GED certificates) for Year i Di the number of dropouts in grade 12 for year i D(i ndash 1) is the number of dropouts in grade 11 for the previous year (i-1)
Virginia Board of Education Consolidated State Application Amended Accountability Workbook Revised May 26 2004 Based on USED Letter of Approval May 25 2004 VBOE Letter of Response June 8 2004 httpwwwedgovadminsleadaccountlettersvadoc
Education Commission of the States 700 Broadway Suite 1200 Denver CO 80203-3460 3032993600 Fax 3032968332 wwwecsorg
bull Page 39 bull
State Graduation Rate Definitions amp Notes Source D(i ndash 2) is the number of dropouts in grade 10 for the previous year (i-2) D(i ndash 3) is the number of dropouts in grade 9 for the previous year (i-3) Graduation rates reflect only students who receive Standard or Advanced Studies Diplomas
Graduation rates are calculated by dividing the number of students receiving a diploma during a school year by the total of the following
bull The number of students receiving a diploma certificate of attendance or GED
bull The number of students who dropped out in grade 12
bull The number of students in grade 11 who dropped out during the previous year
bull The number of students in grade 10 who dropped out two years earlier
bull The number of students in grade 9 who dropped out three years earlier
Virginia currently defines graduation rate as ldquoa percent of 9th grade membership four years laterrdquo but plans to implement a student record system over the next three to five years that will enable Virginia to calculate a longitudinal rate and will decrease unreliability In the transition Virginia will calculate graduation rate using the NCES method For calculating lsquosafe harborrsquo Virginia uses an alternative additional indicator that can be disaggregated until 2005-06
Washington Estimated Cohort Graduation Rate (class of 2002) This rate represents only those students with an expected graduation year of 2002 These students would have started grade 9 in the fall of 1998 and were expected to graduate ldquoon timerdquo in four years Percentage of students who graduate from public high school with a regular diploma (not including a GED or any other diploma not fully aligned with the statersquos academic content standards) in the standard number of years The period of time required for students with disabilities to graduate is specified in each individualized education program (IEP) Students with disabilities who earn a diploma by completing the requirements of an IEP in the required period of time are counted as graduates The graduation rate is calculated as follows
The number of graduates with a regular diploma in four years divided by
The number of graduates with a regular diploma in four years plus the number of students who dropped out of high school in that cohort
grades 9 through 12 plus students who have continued to be enrolled but not graduated
Report Card httpwwwk12wausdataadmin Washingtonrsquos Consolidated Application Accountability Workbook Amendments Resubmitted June 16 2004 and approved June 18 2004
West Virginia 410 West Virginias graduation rate is measured using the number West Virginia Board of Education Policy 2520
Education Commission of the States 700 Broadway Suite 1200 Denver CO 80203-3460 3032993600 Fax 3032968332 wwwecsorg
bull Page 40 bull
State Graduation Rate Definitions amp Notes Source of students who graduate from a public high school with a regular diploma not including a Graduate Equivalency Diploma (GED) or any other diploma not fully aligned with the states academic standards in the standard number of years For students with disabilities the students Individualized Education Plan (IEP) will determine the standard number of years for graduation
4101 The calculation for the graduation rate is the method recommended by the National Center for Education Statistics (NCES) The formula is
Total number of four year graduates divided by the sum of the total number of four year graduates plus the dropouts for the four years of high school for this class of graduates
gt(gt+d12t+d11
(t-1)+d10(t-2)+d9
(t-3))
G = graduates d = dropouts t = year of graduation 12 11 10 and 9=class level
For the AYP determination the graduation rate calculation will be used for accountability at the public schoolLEAstate education agency (SEA) levels but will not be used for each subgroup However for public schoolsLEAs that use the safe harbor provision to meet AYP for the achievement indicator the graduation rate standard must be met by each of the nine subgroups Schools will be considered as having met the AYP if they meet or exceed the standard or if they have made improvement toward the standard
Wisconsin Graduation rate The number of ldquograduatesrdquo divided by the number of ldquograduatesrdquo plus ldquocohort dropoutsrdquo over four years expressed as a percentage Graduate A student who met graduation requirements for a regular diploma during a school year prior to the beginning of the fall semester of the next school year This would include any student who graduated at mid-year who transferred into or re-entered the high school during the year (even if the student was not included in the third Friday in September school enrollment count) who graduated in the spring of the school year or who accumulated required credits during summer school Students who receive an alternative diploma such as a HSED GED or ldquocertificate of attendancerdquo are not counted as graduates Dropout A student who was enrolled in the school at some time during a school year was not enrolled at the beginning of the next school year (third Friday in September) has not graduated from high school or completed a state or district-approved educational program and does not meet any of the following exclusionary conditions 1 Has not transferred to another public school district private school or state- or district-approved educational program 2 Is temporarily absent due to expulsion suspension or school-approved illness 3 Has died Cohort dropout Any student who was a 12th grade dropout for the year reported an 11th grade dropout for the prior year a 10th grade dropout for two years prior or a 9th grade dropout for three years
Report card Consolidated State Application Accountability Workbook Last Revised May 14 2004 (approved by USDOE)
Education Commission of the States 700 Broadway Suite 1200 Denver CO 80203-3460 3032993600 Fax 3032968332 wwwecsorg
bull Page 41 bull
State Graduation Rate Definitions amp Notes Source prior
Wyoming Defined as the total number of graduates divided by the total number of students who left school including students who completed high school and drop-outs from that class over the past four years The rate incorporates four years worth of data and thus is an estimated cohort rate It is calculated by dividing the number of students who receive a regular diploma by the sum of dropouts from grade 9 through 12 in consecutive years plus the number of students completing high school If a hypothetical graduating class began as 9th graders in Year 1 this four-year completion rate would look like
Students Receiving a Regular Diploma in Year 4 divided by
Dropouts (Grade 9 Year 1 + Grade 10 Year 2 + Grade 11 Year 3 +
Grade 12 Year 4) + Students Completing High School Year 4 This formula used by the department of education is an ldquoexiterrdquo rate The denominator is the total of all ldquoexitersrdquo from a school over a four-year period for a grade cohort The exiters are the 9th grade drop-outs three years ago the 10th grade drop-outs two years ago 11th grade drop-outs last year and this yearrsquos 12th grade drop-outs plus completers The numerator is the count of this yearrsquos regular diploma recipients The rate answers ldquoWhat percent of students exiting education do so with a regular diplomardquo
Consolidated Application Accountability Workbook 2003-2004 Revised Submission August 11 2004 (approved by USDOE)
Territories American Samoa
Could not locate
Puerto Rico Computes the high school graduation rate (HSGR) using and adaptation of the method recommended by the National Center for Education Statistics as follows
HSGR(i) = TG(i) TNC(i) x 100 wherehellip
TG(i) = NG(i) + NGS(i) TNC (i) = NG(i) + NGS(i) + N10DO(i-2) +
N11DO(i-1) + N12DO(i)
andhellip
i = The specific school year for which the computation is made HSGR(i) = High School Graduation Rate for school year i TG(i) = Total graduates with regular diploma who completed high school in three years for school year i TNC(i) = Estimated size of the high school cohort for school year i NG(i) = Number of graduates with regular diploma who completed high school in three years during the regular school year i NGS(i) = Number of graduates with regular diploma who completed high school in three years during the summer of school year i
Consolidated Application Accountability Workbook May 1 2003
Education Commission of the States 700 Broadway Suite 1200 Denver CO 80203-3460 3032993600 Fax 3032968332 wwwecsorg
bull Page 42 bull
State Graduation Rate Definitions amp Notes Source NG10DO(i -2) = Number of grade 10 dropouts in school year i -2 NG11DO(i-1) = Number of grade 11 dropouts in school year i -1 NG12DO(i) = Number of grade 12 dropouts in school year i Dropouts = Students who leave school prior to graduation for reasons other than transfer to another school in PR or moving from the island
Virgin Islands Could not locate
Kathy Christie vice president for knowledge management amp the ECS Clearinghouse compiled this StateNote copy 2005 by the Education Commission of the States (ECS) All rights reserved ECS is a nonprofit nationwide organization that helps state leaders shape education policy To request permission to excerpt part of this publication either in print or electronically please fax a request to the attention of the ECS Communications Department 3032968332 or e-mail ecsecsorg
Helping State Leaders Shape Education Policy
- Sources Used
- Highlights
- TABLE 1 State Targets for Attendance and Graduation Rates
- Territories
- TABLE 2 How Attendance Rates Are Calculated
- Accountability Workbook
- Territories
- TABLE 3 How Graduation Rates are Calculated
-
- February 2004
-
- Accountability Workbook
- Territories
-
- HSGR(i) = TG(i) TNC(i) x 100
-
- andhellip
- Helping State Leaders Shape Education Policy
-
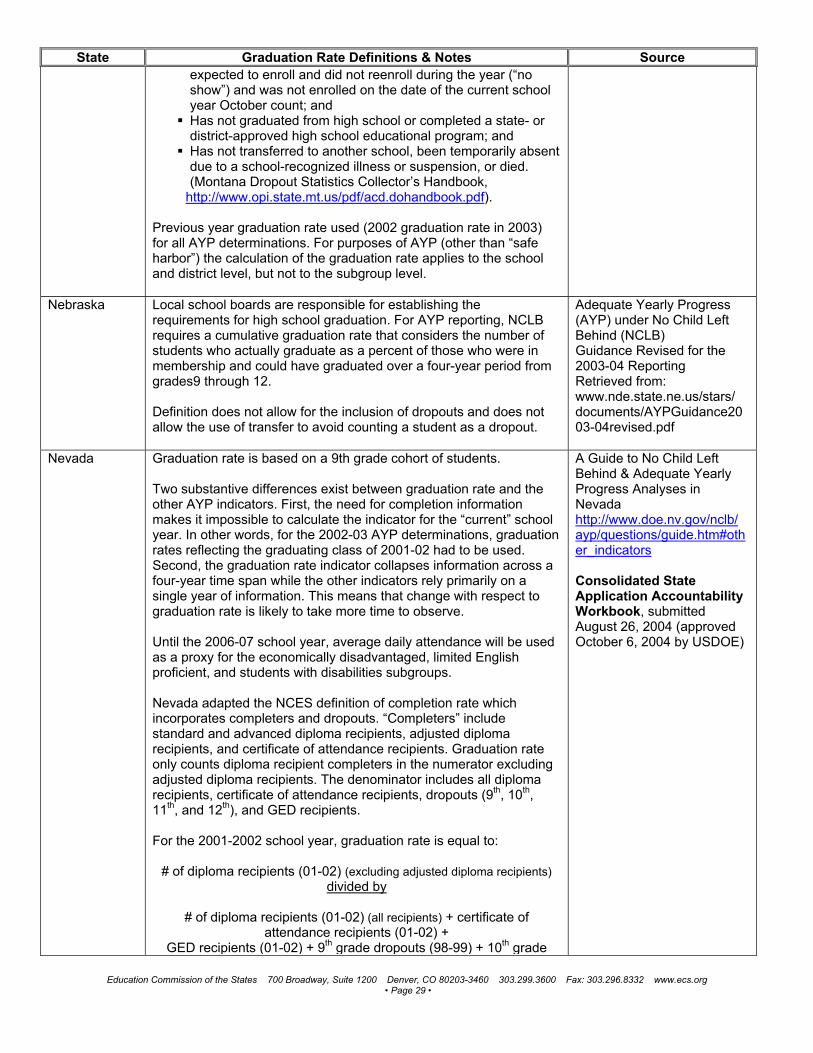
Education Commission of the States 700 Broadway Suite 1200 Denver CO 80203-3460 3032993600 Fax 3032968332 wwwecsorg
bull Page 42 bull
State Graduation Rate Definitions amp Notes Source NG10DO(i -2) = Number of grade 10 dropouts in school year i -2 NG11DO(i-1) = Number of grade 11 dropouts in school year i -1 NG12DO(i) = Number of grade 12 dropouts in school year i Dropouts = Students who leave school prior to graduation for reasons other than transfer to another school in PR or moving from the island
Virgin Islands Could not locate
Kathy Christie vice president for knowledge management amp the ECS Clearinghouse compiled this StateNote copy 2005 by the Education Commission of the States (ECS) All rights reserved ECS is a nonprofit nationwide organization that helps state leaders shape education policy To request permission to excerpt part of this publication either in print or electronically please fax a request to the attention of the ECS Communications Department 3032968332 or e-mail ecsecsorg
Helping State Leaders Shape Education Policy
- Sources Used
- Highlights
- TABLE 1 State Targets for Attendance and Graduation Rates
- Territories
- TABLE 2 How Attendance Rates Are Calculated
- Accountability Workbook
- Territories
- TABLE 3 How Graduation Rates are Calculated
-
- February 2004
-
- Accountability Workbook
- Territories
-
- HSGR(i) = TG(i) TNC(i) x 100
-
- andhellip
- Helping State Leaders Shape Education Policy
-