june 2015 torrance real estate market trends update
TRANSCRIPT


Table of
Contents
Key Statistics for June
Sales 2015 Residential Sales Stats Year-to-Year Total Sales by Map Area Median 2015 Median Sales Stats Year-to-Year Median Sales by Map Area Listings 2015 Active Listings by Map Area 2015 Total Active Listings vs. Total Sales Year-to-Year Active Listings by Map Area Inventory 2015 Months of Inventory by Map Area Year-to-Year Months of Inventory
Outlook for July
About Hady Chahine Contact Information

Key Statistics for June
Back to Table of Contents
= trending positive = trending positive
= trending negative = trending negative
Month-to-Month Comparison May 2015 June 2015 Delta (qty) Delta (%) Increase Decrease
Total Sales 107 106 -1 -0.9%
Median Sales Price 670,000 625,000 (45,000) -6.7%
Median Days to Sell 35 33 -2 -5.7%
Listings 169 169 0 0.0%
Sales/Listing Ratio 63.3% 62.7% -0.6% -0.9%
Months of Inventory 1.6 2 0.4 25.0%
Monthly Comparison Year-to-Year June 2014 June 2015 Delta Delta Increase Decrease
Total Sales 72 106 34 47.2%
Median Sales Price 661,500 625,000 (36,500) -5.5%
Median Days to Sell 24 33 9 37.5%
Listings 252 169 -83 -32.9%
Months of Inventory 3.0 2.0 -1 -33.3%

Back to Table of Contents
Total Sales Month-to-Month by Map Area Apr May Jun
Central Torrance 20 16 20
South East Torrance - West 11 7 7
Hollywood Riviera 8 13 14
South Torrance 8 8 7
Southwood 8 6 4
West Torrance 11 11 7
N Torrance - West 14 17 10
N Torrance - East 10 9 11
Old Torrance 9 13 18
South East Torrance - East 6 7 8
Total Sales 105 107 106
0
20
40
60
80
100
120
Apr May Jun
2015 Total Sales Month-to-Month by Map Area
Central Torrance
South East Torrance - West
Hollywood Riviera
South Torrance
Southwood
West Torrance
N Torrance - West
N Torrance - East
Old Torrance
South East Torrance - East
Total Sales

Back to Table of Contents
Total Sales Year-to-Year by Map Area 2013 2014 2015
Central Torrance 16 10 20
South East Torrance - West 2 5 7
Hollywood Riviera 20 9 14
South Torrance 8 6 7
Southwood 6 4 4
West Torrance 7 9 7
N Torrance - West 6 9 10
N Torrance - East 5 4 11
Old Torrance 14 9 18
South East Torrance - East 6 7 8
Total Sales 90 72 106
0
20
40
60
80
100
120
2013 2014 2015
Total Sales Year-to-Year by Map Area: June
Central Torrance
South East Torrance - West
Hollywood Riviera
South Torrance
Southwood
West Torrance
N Torrance - West
N Torrance - East
Old Torrance
South East Torrance - East
Total Sales

Back to Table of Contents
Median Sales Price Month-to-Month by Map Area Apr May Jun
Central Torrance 657,500 685,000 578,140
South East Torrance - West 410,000 699,900 410,000
Hollywood Riviera 1,072,500 1,159,000 1,082,500
South Torrance 892,500 770,000 740,000
Southwood 792,500 742,500 783,000
West Torrance 698,500 697,000 805,000
N Torrance - West 600,000 595,000 577,500
N Torrance - East 502,500 544,500 575,000
Old Torrance 585,000 525,000 589,500
South East Torrance - East 692,500 742,500 657,000
Market Median Sales Price 668,000 670,000 625,000
-
200,000
400,000
600,000
800,000
1,000,000
1,200,000
Apr May Jun
2015 Median Sales Price Month-to-Month by Map Area
Central Torrance
South East Torrance - West
Hollywood Riviera
South Torrance
Southwood
West Torrance
N Torrance - West
N Torrance - East
Old Torrance
South East Torrance - East
Market Median Sales Price

Back to Table of Contents
Median Sales Price Year-to-Year by Map Area 2013 2014 2015
Central Torrance 560,000 554,500 578,140
South East Torrance - West 570,500 735,000 410,000
Hollywood Riviera 923,750 900,000 1,082,500
South Torrance 647,000 989,500 740,000
Southwood 658,250 526,250 783,000
West Torrance 740,000 690,000 805,000
N Torrance - West 492,500 538,000 577,500
N Torrance - East 540,000 526,500 575,000
Old Torrance 508,500 550,000 589,500
South East Torrance - East 710,000 749,000 657,000
Market Median Sales Price 618,500 661,500 625,000
-
200,000
400,000
600,000
800,000
1,000,000
1,200,000
2013 2014 2015
Median Sales Price Year-to-Year by Map Area: June
Central Torrance
South East Torrance - West
Hollywood Riviera
South Torrance
Southwood
West Torrance
N Torrance - West
N Torrance - East
Old Torrance
South East Torrance - East
Market Median Sales Price

Back to Table of Contents
Active Listings vs. Total Sales by Map Area Jan Feb Mar Apr May Jun Jul Aug Sep Oct Nov Dec
Central Torrance 27 28 29 34 31 27
South East Torrance - West 16 17 12 13 13 15
Hollywood Riviera 20 18 16 21 15 21
South Torrance 11 13 16 17 13 14
Southwood 6 6 8 7 8 8
West Torrance 12 13 9 8 11 13
N Torrance - West 17 20 20 22 20 24
N Torrance - East 10 7 10 17 15 13
Old Torrance 20 21 22 25 27 22
South East Torrance - East 17 21 16 13 16 12
Total Active Listings 156 164 158 177 169 169
-
5
10
15
20
25
30
35
Jan Feb Mar Apr May Jun Jul Aug Sep Oct Nov Dec
2015 Active Listings by Map Area
Central Torrance
South East Torrance - West
Hollywood Riviera
South Torrance
Southwood
West Torrance
N Torrance - West
N Torrance - East
Old Torrance
South East Torrance - East

Back to Table of Contents
Active Listings vs. Total Sales by Map Area Jan Feb Mar Apr May Jun Jul Aug Sep Oct Nov Dec
Central Torrance 27 28 29 34 31 27
South East Torrance - West 16 17 12 13 13 15
Hollywood Riviera 20 18 16 21 15 21
South Torrance 11 13 16 17 13 14
Southwood 6 6 8 7 8 8
West Torrance 12 13 9 8 11 13
N Torrance - West 17 20 20 22 20 24
N Torrance - East 10 7 10 17 15 13
Old Torrance 20 21 22 25 27 22
South East Torrance - East 17 21 16 13 16 12
Total Active Listings 156 164 158 177 169 169
Total Sales 44 67 79 105 107 106
Sales/Listings Ratio 28.2% 40.9% 50.0% 59.3% 63.3% 62.7%
-
20
40
60
80
100
120
140
160
180
Jan Feb Mar Apr May Jun Jul Aug Sep Oct Nov Dec
2015 Total Active Listings vs. Total Sales
Total Active Listings Total Sales
Back to Table of Contents
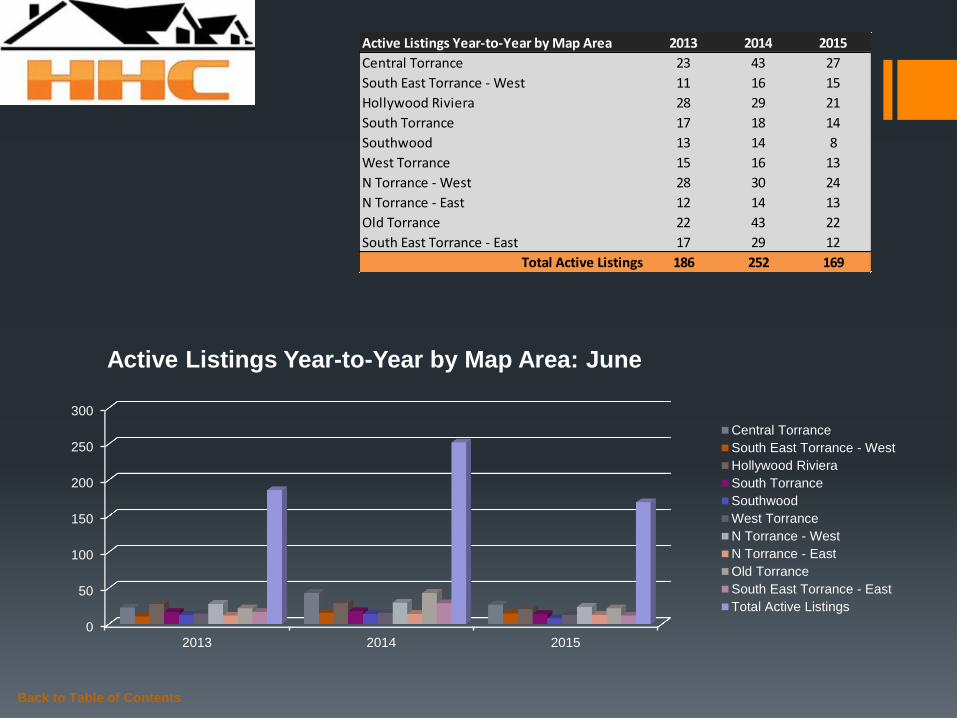
Active Listings Year-to-Year by Map Area 2013 2014 2015
Central Torrance 23 43 27
South East Torrance - West 11 16 15
Hollywood Riviera 28 29 21
South Torrance 17 18 14
Southwood 13 14 8
West Torrance 15 16 13
N Torrance - West 28 30 24
N Torrance - East 12 14 13
Old Torrance 22 43 22
South East Torrance - East 17 29 12
Total Active Listings 186 252 169
0
50
100
150
200
250
300
2013 2014 2015
Active Listings Year-to-Year by Map Area: June
Central Torrance
South East Torrance - West
Hollywood Riviera
South Torrance
Southwood
West Torrance
N Torrance - West
N Torrance - East
Old Torrance
South East Torrance - East
Total Active Listings

Back to Table of Contents
Months of Inventory by Map Area Jan Feb Mar Apr May Jun Jul Aug Sep Oct Nov Dec
Central Torrance 5.4 1.9 2.4 1.7 1.9 1.0
South East Torrance - West 2.7 8.5 1.3 1.2 1.9 2.0
Hollywood Riviera 5.0 2.3 1.2 2.6 1.2 2.0
South Torrance 2.8 2.6 16.0 2.1 1.6 2.0
Southwood 3.0 1.0 2.7 0.9 1.3 2.0
West Torrance 2.4 4.3 3.0 0.7 1.0 2.0
N Torrance - West 2.8 2.2 1.8 1.6 1.2 2.0
N Torrance - East 2.0 1.4 1.3 1.7 1.7 1.0
Old Torrance 5.0 1.8 1.8 2.8 2.1 1.0
South East Torrance - East 5.7 10.5 2.3 2.2 2.3 2.0
-
2.0
4.0
6.0
8.0
10.0
12.0
14.0
16.0
Jan Feb Mar Apr May Jun Jul Aug Sep Oct Nov Dec
2015 Months of Inventory by Map Area
Central Torrance
South East Torrance - West
Hollywood Riviera
South Torrance
Southwood
West Torrance
N Torrance - West
N Torrance - East
Old Torrance
South East Torrance - East

Back to Table of Contents
Months of Inventory Year-to-Year Jan Feb Mar Apr May Jun Jul Aug Sep Oct Nov Dec
2013 2.6 2.7 1.5 1.6 1.8 2.0 1.9 2.2 2.0 2.3 2.0 1.0
2014 2.0 2.0 2.0 2.2 2.1 3.0 2.1 2.1 2.7 2.2 2.3 1.8
2015 3.6 2.5 2.0 1.7 1.6 2.0
-
0.5
1.0
1.5
2.0
2.5
3.0
3.5
4.0
Jan Feb Mar Apr May Jun Jul Aug Sep Oct Nov Dec
Months of Inventory Year-to-Year
2013
2014
2015

Outlook for July
The Torrance real estate market recorded 106 closed escrows at a sales/listing ratio of 62.7% in June. Year-over-year, total sales are trending positive at 47+% despite a 5.5% reduction in the median sales price. In the news… According to C.A.R., “home sales reach highest level in two years” despite modest inventory constraints on housing supply (http://www.car.org/newsstand/newsreleases/2015releases/june2015sales/?view=Standard). Activity for July I expect to remain fairly consistent relative to June stats, given favorable interest rates and strong listings should continue to attract buyer’s engagement.
Back to Table of Contents
Month-to-Month Comparison May 2015 June 2015 Delta (qty) Delta (%) Increase Decrease
Total Sales 107 106 -1 -0.9%
Median Sales Price 670,000 625,000 (45,000) -6.7%
Median Days to Sell 35 33 -2 -5.7%
Listings 169 169 0 0.0%
Sales/Listing Ratio 63.3% 62.7% -0.6% -0.9%
Months of Inventory 1.6 2 0.4 25.0%

Back to Table of Contents
Serving South Bay Home Buyers and Sellers Since 2001
RE/MAX Top 4 Team in California – 2012
RE/MAX 100% Club - 2011
Shorewood Realtors Top 5% in Overall Sales 2001-2006, 2008-2010
About
Hady Chahine…

The information being provided by CARETS (CLAW, CRISNet MLS, DAMLS, CRMLS, i-Tech MLS, and/or VCRDS) is for the visitor’s personal, non-commercial use and may not be used for
any purpose other than to identify prospective properties visitor may be interested in purchasing. Any information relating to a property referenced on this web site comes from the Internet
Data Exchange (IDX) program of CARETS. This web site may reference real estate listing(s) held by a brokerage firm other than the broker and/or agent who owns this web site. The accuracy
of all information, regardless of source, including but not limited to square footages and lot sizes, is deemed reliable but not guaranteed and should be personally verified through personal
inspection by and/or with the appropriate professionals.
Back to Table of Contents
Listings MLS BLOG Website