february 2016 torrance real estate market trends update
TRANSCRIPT

Table of
Contents
Key Statistics for February
Sales 2016 Residential Sales Stats Year-to-Year Total Sales by Map Area Median 2016 Median Sales Stats Year-to-Year Median Sales by Map Area Listings 2016 Active Listings by Map Area 2016 Total Active Listings vs. Total Sales Year-to-Year Active Listings by Map Area Inventory 2016 Months of Inventory by Map Area Year-to-Year Months of Inventory
Summary
About Hady Chahine Contact Information
Key Statistics for February
Back to Table of Contents
= trending positive = trending positive
= trending negative = trending negative
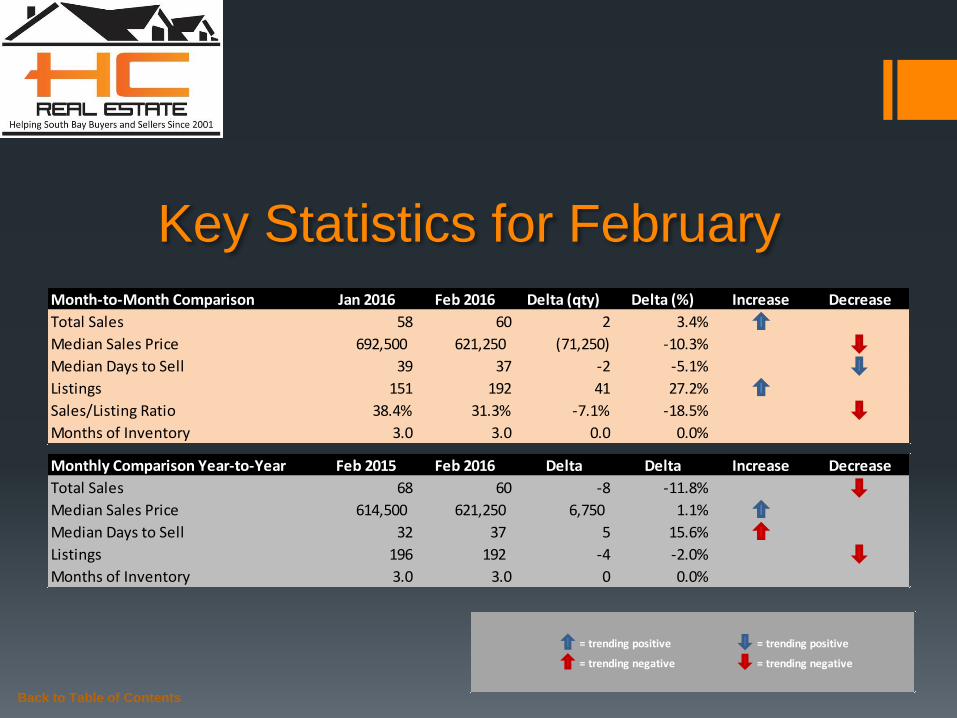
Month-to-Month Comparison Jan 2016 Feb 2016 Delta (qty) Delta (%) Increase Decrease
Total Sales 58 60 2 3.4%
Median Sales Price 692,500 621,250 (71,250) -10.3%
Median Days to Sell 39 37 -2 -5.1%
Listings 151 192 41 27.2%
Sales/Listing Ratio 38.4% 31.3% -7.1% -18.5%
Months of Inventory 3.0 3.0 0.0 0.0%
Monthly Comparison Year-to-Year Feb 2015 Feb 2016 Delta Delta Increase Decrease
Total Sales 68 60 -8 -11.8%
Median Sales Price 614,500 621,250 6,750 1.1%
Median Days to Sell 32 37 5 15.6%
Listings 196 192 -4 -2.0%
Months of Inventory 3.0 3.0 0 0.0%
Back to Table of Contents
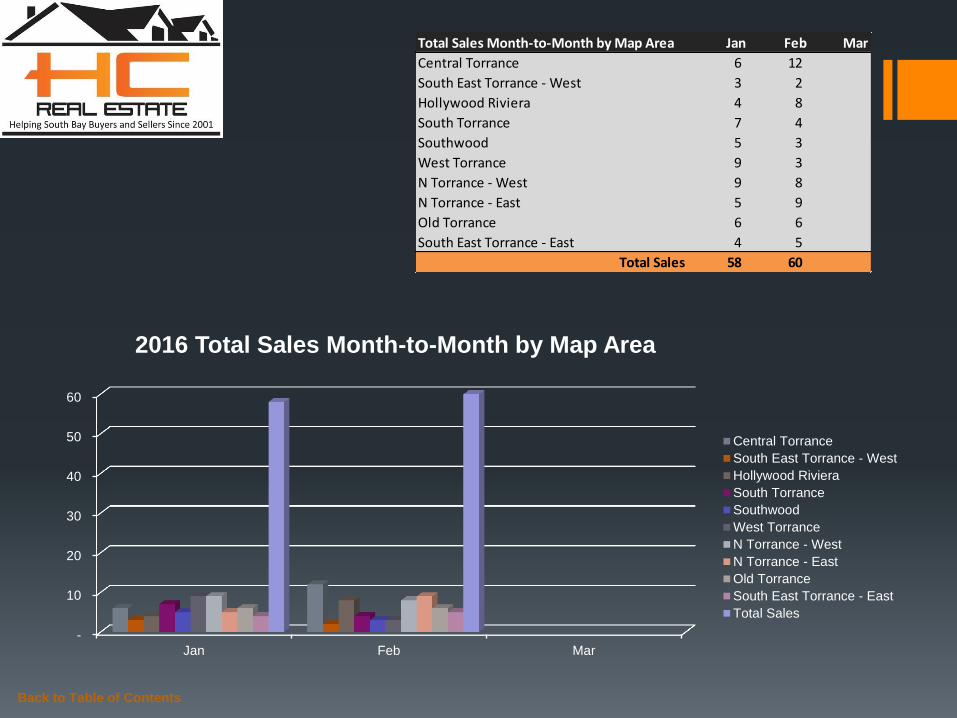
Total Sales Month-to-Month by Map Area Jan Feb Mar
Central Torrance 6 12
South East Torrance - West 3 2
Hollywood Riviera 4 8
South Torrance 7 4
Southwood 5 3
West Torrance 9 3
N Torrance - West 9 8
N Torrance - East 5 9
Old Torrance 6 6
South East Torrance - East 4 5
Total Sales 58 60
-
10
20
30
40
50
60
Jan Feb Mar
2016 Total Sales Month-to-Month by Map Area
Central Torrance
South East Torrance - West
Hollywood Riviera
South Torrance
Southwood
West Torrance
N Torrance - West
N Torrance - East
Old Torrance
South East Torrance - East
Total Sales
Back to Table of Contents
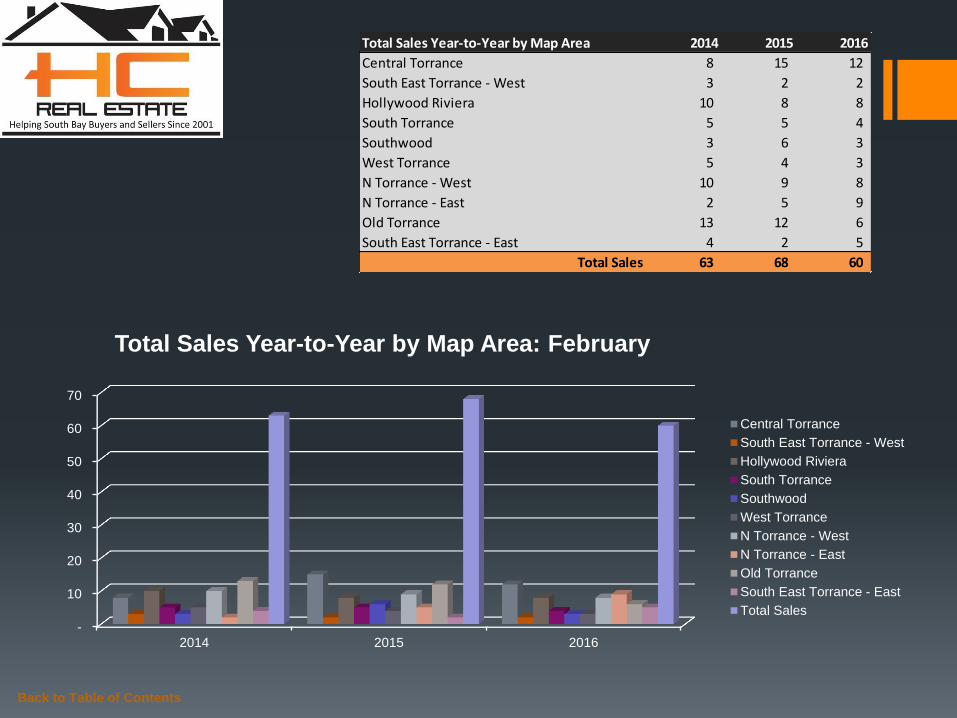
Total Sales Year-to-Year by Map Area 2014 2015 2016
Central Torrance 8 15 12
South East Torrance - West 3 2 2
Hollywood Riviera 10 8 8
South Torrance 5 5 4
Southwood 3 6 3
West Torrance 5 4 3
N Torrance - West 10 9 8
N Torrance - East 2 5 9
Old Torrance 13 12 6
South East Torrance - East 4 2 5
Total Sales 63 68 60
-
10
20
30
40
50
60
70
2014 2015 2016
Total Sales Year-to-Year by Map Area: February
Central Torrance
South East Torrance - West
Hollywood Riviera
South Torrance
Southwood
West Torrance
N Torrance - West
N Torrance - East
Old Torrance
South East Torrance - East
Total Sales

Back to Table of Contents
Median Sales Price Month-to-Month by Map Area Jan Feb Mar
Central Torrance 592,500 565,000
South East Torrance - West 911,700 766,000
Hollywood Riviera 1,222,500 1,002,500
South Torrance 730,000 742,500
Southwood 770,000 755,000
West Torrance 959,900 1,050,000
N Torrance - West 565,000 599,000
N Torrance - East 632,000 555,000
Old Torrance 592,500 612,450
South East Torrance - East 730,000 600,000
Market Median Sales Price 692,500 621,250
-
200,000
400,000
600,000
800,000
1,000,000
1,200,000
1,400,000
Jan Feb Mar
2016 Median Sales Price Month-to-Month by Map Area
Central Torrance
South East Torrance - West
Hollywood Riviera
South Torrance
Southwood
West Torrance
N Torrance - West
N Torrance - East
Old Torrance
South East Torrance - East
Market Median Sales Price

Back to Table of Contents
Median Sales Price Year-to-Year by Map Area 2014 2015 2016
Central Torrance 521,500 530,000 565,000
South East Torrance - West 420,000 619,500 766,000
Hollywood Riviera 1,202,000 935,000 1,002,500
South Torrance 710,000 695,000 742,500
Southwood 517,000 515,000 755,000
West Torrance 742,408 820,000 1,050,000
N Torrance - West 498,500 619,000 599,000
N Torrance - East 455,550 460,000 555,000
Old Torrance 515,000 607,500 612,450
South East Torrance - East 697,000 595,750 600,000
Market Median Sales Price 600,000 614,500 621,250
-
200,000
400,000
600,000
800,000
1,000,000
1,200,000
1,400,000
2014 2015 2016
Median Sales Price Year-to-Year by Map Area: February
Central Torrance
South East Torrance - West
Hollywood Riviera
South Torrance
Southwood
West Torrance
N Torrance - West
N Torrance - East
Old Torrance
South East Torrance - East
Market Median Sales Price
Back to Table of Contents
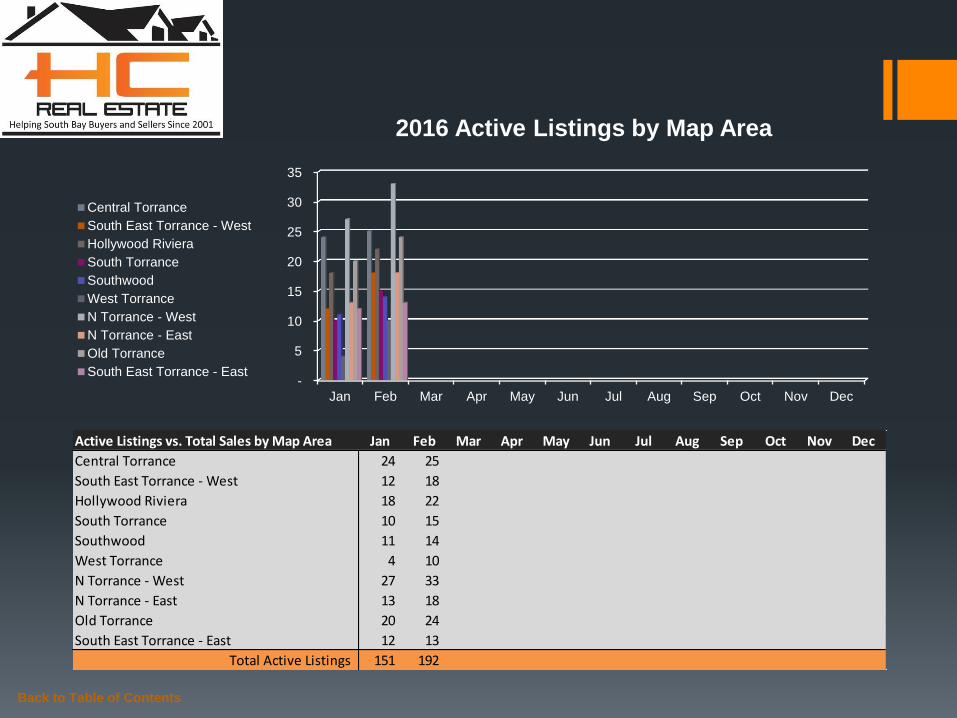
Active Listings vs. Total Sales by Map Area Jan Feb Mar Apr May Jun Jul Aug Sep Oct Nov Dec
Central Torrance 24 25
South East Torrance - West 12 18
Hollywood Riviera 18 22
South Torrance 10 15
Southwood 11 14
West Torrance 4 10
N Torrance - West 27 33
N Torrance - East 13 18
Old Torrance 20 24
South East Torrance - East 12 13
Total Active Listings 151 192
-
5
10
15
20
25
30
35
Jan Feb Mar Apr May Jun Jul Aug Sep Oct Nov Dec
2016 Active Listings by Map Area
Central Torrance
South East Torrance - West
Hollywood Riviera
South Torrance
Southwood
West Torrance
N Torrance - West
N Torrance - East
Old Torrance
South East Torrance - East

Back to Table of Contents
Active Listings vs. Total Sales by Map Area Jan Feb Mar Apr May Jun Jul Aug Sep Oct Nov Dec
Central Torrance 24 25
South East Torrance - West 12 18
Hollywood Riviera 18 22
South Torrance 10 15
Southwood 11 14
West Torrance 4 10
N Torrance - West 27 33
N Torrance - East 13 18
Old Torrance 20 24
South East Torrance - East 12 13
Total Active Listings 151 192
Total Sales 58 60
Sales/Listings Ratio 38.4% 31.3%
-
20
40
60
80
100
120
140
160
180
200
Jan Feb Mar Apr May Jun Jul Aug Sep Oct Nov Dec
2016 Total Active Listings vs. Total Sales
Total Active Listings Total Sales

Back to Table of Contents
Active Listings Year-to-Year by Map Area 2014 2015 2016
Central Torrance 24 32 25
South East Torrance - West 9 20 18
Hollywood Riviera 14 20 22
South Torrance 15 17 15
Southwood 6 5 14
West Torrance 11 14 10
N Torrance - West 26 24 33
N Torrance - East 8 12 18
Old Torrance 21 26 24
South East Torrance - East 13 26 13
Total Active Listings 147 196 192
-
20
40
60
80
100
120
140
160
180
200
2014 2015 2016
Active Listings Year-to-Year by Map Area: February
Central Torrance
South East Torrance - West
Hollywood Riviera
South Torrance
Southwood
West Torrance
N Torrance - West
N Torrance - East
Old Torrance
South East Torrance - East
Total Active Listings

Back to Table of Contents
Months of Inventory by Map Area Jan Feb Mar Apr May Jun Jul Aug Sep Oct Nov Dec
Central Torrance 4.0 2.0
South East Torrance - West 4.0 9.0
Hollywood Riviera 5.0 3.0
South Torrance 1.0 4.0
Southwood 2.0 5.0
West Torrance - 3.0
N Torrance - West 3.0 4.0
N Torrance - East 3.0 2.0
Old Torrance 3.0 4.0
South East Torrance - East 3.0 3.0
-
1.0
2.0
3.0
4.0
5.0
6.0
7.0
8.0
9.0
Jan Feb Mar Apr May Jun Jul Aug Sep Oct Nov Dec
2016 Months of Inventory by Map Area
Central Torrance
South East Torrance - West
Hollywood Riviera
South Torrance
Southwood
West Torrance
N Torrance - West
N Torrance - East
Old Torrance
South East Torrance - East
Back to Table of Contents
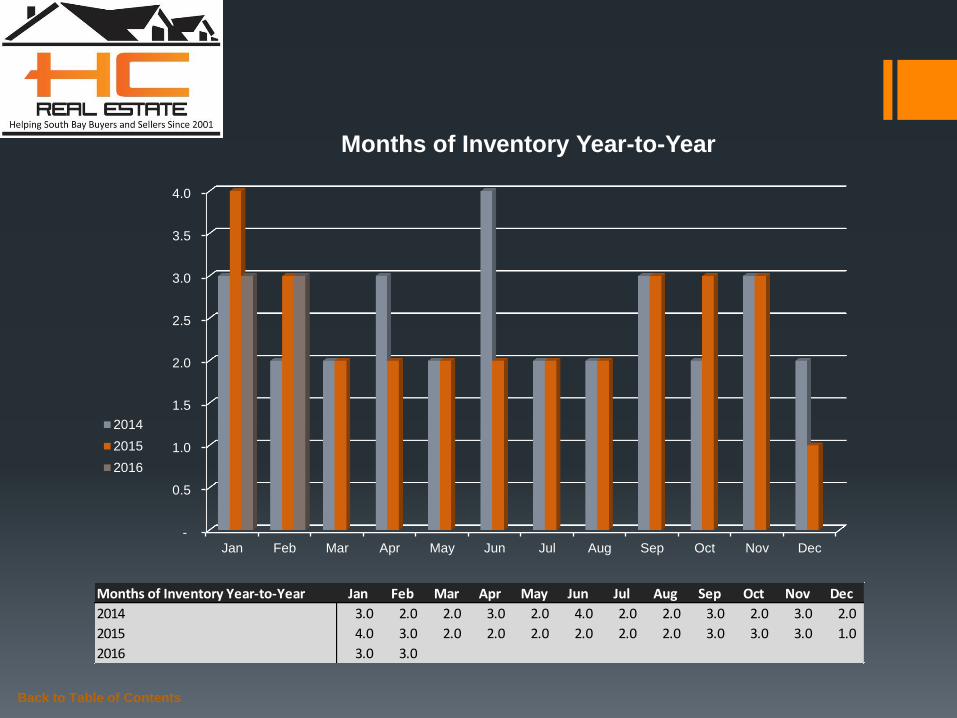
Months of Inventory Year-to-Year Jan Feb Mar Apr May Jun Jul Aug Sep Oct Nov Dec
2014 3.0 2.0 2.0 3.0 2.0 4.0 2.0 2.0 3.0 2.0 3.0 2.0
2015 4.0 3.0 2.0 2.0 2.0 2.0 2.0 2.0 3.0 3.0 3.0 1.0
2016 3.0 3.0
-
0.5
1.0
1.5
2.0
2.5
3.0
3.5
4.0
Jan Feb Mar Apr May Jun Jul Aug Sep Oct Nov Dec
Months of Inventory Year-to-Year
2014
2015
2016

Summary Noticeable improvements were recorded for total sales, median days to sell, and net listings metrics for the Torrance real estate market in February (respectively speaking, 3.4%, -5.1%, and 27.2%). However, the market median sales price and sales-listing ratio each fell by double digits. Year-over-year analysis shows the market median sales price climbed 1.1% or $6.75K.
In the news… According to C.A.R., “Existing, single-family home sales totaled 393,360 in February on a seasonally adjusted annualized rate, up 2.6 percent from January and 6.4 percent above February 2015.” http://www.car.org/newsstand/newsreleases/2016releases/february2016sales?view=Standard
For listing or buying guidance, or additional statistics on market trending behavior, please do not hesitate to contact me to schedule a time to discuss how I can be of service to you.
Back to Table of Contents
Monthly Comparison Year-to-Year Feb 2015 Feb 2016 Delta Delta Increase Decrease
Total Sales 68 60 -8 -11.8%
Median Sales Price 614,500 621,250 6,750 1.1%
Median Days to Sell 32 37 5 15.6%
Listings 196 192 -4 -2.0%
Months of Inventory 3.0 3.0 0 0.0%
Month-to-Month Comparison Jan 2016 Feb 2016 Delta (qty) Delta (%) Increase Decrease
Total Sales 58 60 2 3.4%
Median Sales Price 692,500 621,250 (71,250) -10.3%
Median Days to Sell 39 37 -2 -5.1%
Listings 151 192 41 27.2%
Sales/Listing Ratio 38.4% 31.3% -7.1% -18.5%
Months of Inventory 3.0 3.0 0.0 0.0%

Back to Table of Contents
Serving South Bay Home Buyers and Sellers Since 2001
RE/MAX Top 4 Team in California – 2012
RE/MAX 100% Club - 2011
Shorewood Realtors Top 5% in Overall Sales 2001-2006, 2008-2010
About
Hady Chahine…

The information being provided by CARETS (CLAW, CRISNet MLS, DAMLS, CRMLS, i-Tech MLS, and/or VCRDS) is for the visitor’s personal, non-commercial use and may not be used for
any purpose other than to identify prospective properties visitor may be interested in purchasing. Any information relating to a property referenced on this web site comes from the Internet
Data Exchange (IDX) program of CARETS. This web site may reference real estate listing(s) held by a brokerage firm other than the broker and/or agent who owns this web site. The accuracy
of all information, regardless of source, including but not limited to square footages and lot sizes, is deemed reliable but not guaranteed and should be personally verified through personal
inspection by and/or with the appropriate professionals.
Back to Table of Contents
Listings MLS BLOG Website
Hady Chahine
• 310-404-5361