november 2014 torrance real estate market trends update
TRANSCRIPT
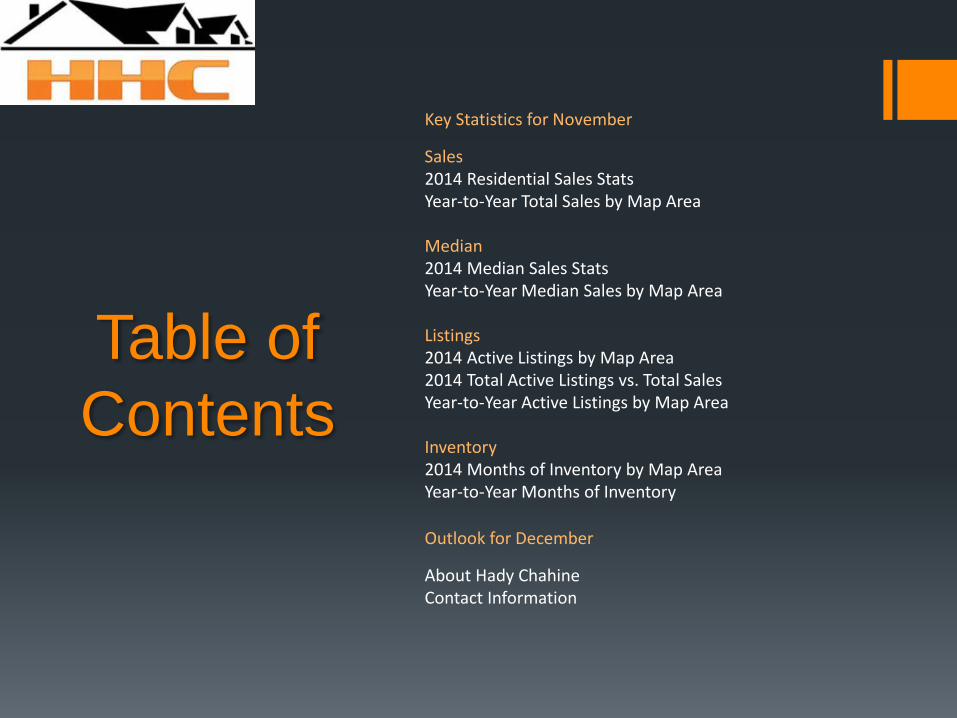
Table of
Contents
Key Statistics for November
Sales 2014 Residential Sales Stats Year-to-Year Total Sales by Map Area Median 2014 Median Sales Stats Year-to-Year Median Sales by Map Area Listings 2014 Active Listings by Map Area 2014 Total Active Listings vs. Total Sales Year-to-Year Active Listings by Map Area Inventory 2014 Months of Inventory by Map Area Year-to-Year Months of Inventory
Outlook for December
About Hady Chahine Contact Information
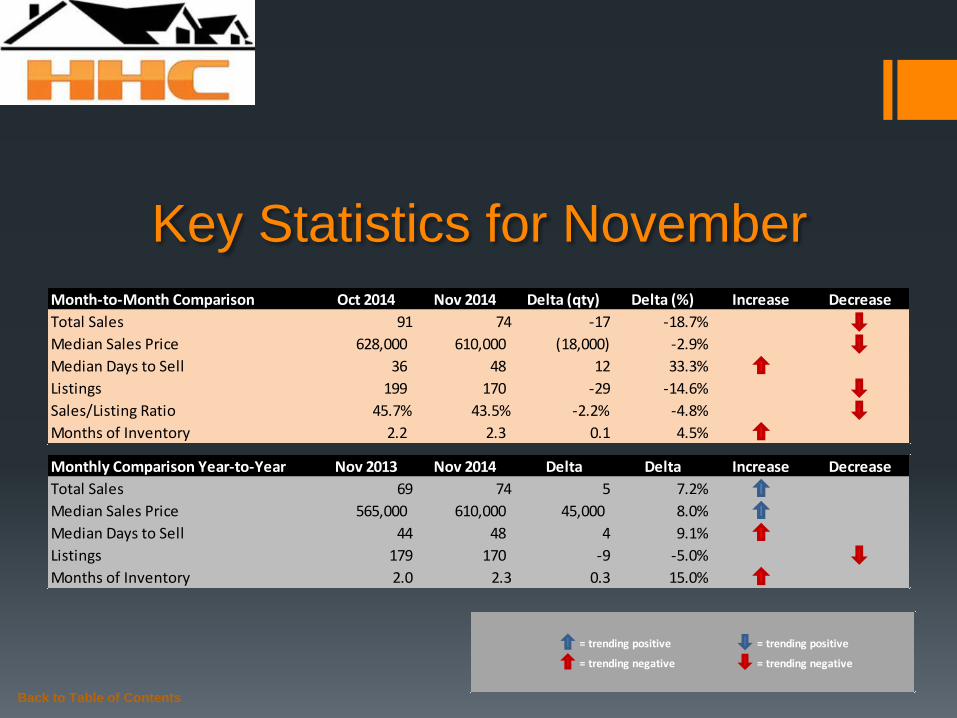
Key Statistics for November
Back to Table of Contents
= trending positive = trending positive
= trending negative = trending negative
Month-to-Month Comparison Oct 2014 Nov 2014 Delta (qty) Delta (%) Increase Decrease
Total Sales 91 74 -17 -18.7%
Median Sales Price 628,000 610,000 (18,000) -2.9%
Median Days to Sell 36 48 12 33.3%
Listings 199 170 -29 -14.6%
Sales/Listing Ratio 45.7% 43.5% -2.2% -4.8%
Months of Inventory 2.2 2.3 0.1 4.5%
Monthly Comparison Year-to-Year Nov 2013 Nov 2014 Delta Delta Increase Decrease
Total Sales 69 74 5 7.2%
Median Sales Price 565,000 610,000 45,000 8.0%
Median Days to Sell 44 48 4 9.1%
Listings 179 170 -9 -5.0%
Months of Inventory 2.0 2.3 0.3 15.0%
Back to Table of Contents
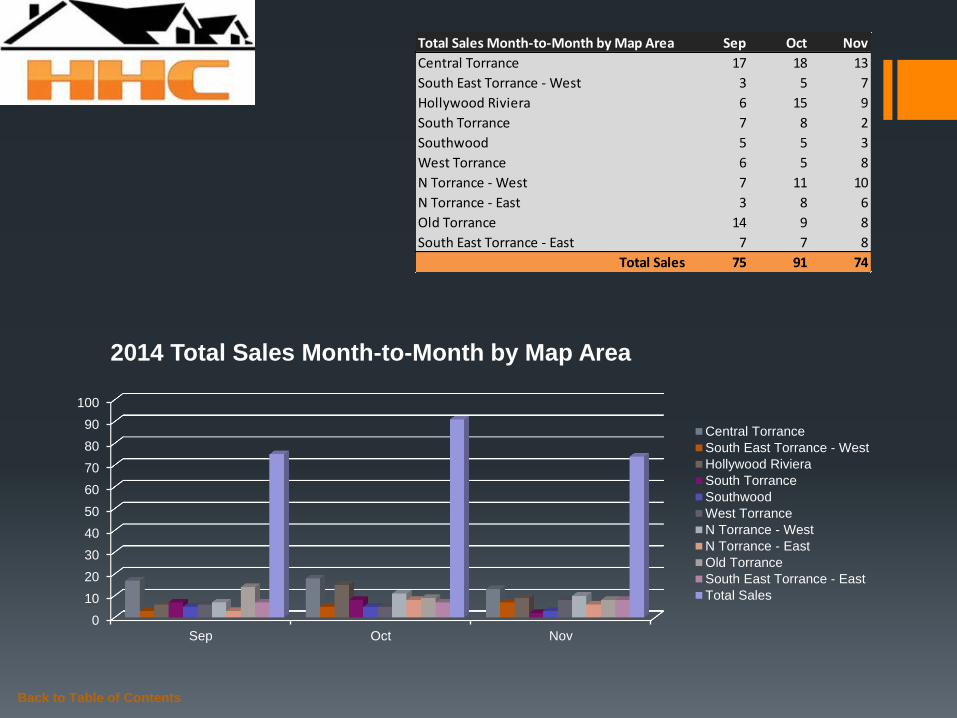
Total Sales Month-to-Month by Map Area Sep Oct Nov
Central Torrance 17 18 13
South East Torrance - West 3 5 7
Hollywood Riviera 6 15 9
South Torrance 7 8 2
Southwood 5 5 3
West Torrance 6 5 8
N Torrance - West 7 11 10
N Torrance - East 3 8 6
Old Torrance 14 9 8
South East Torrance - East 7 7 8
Total Sales 75 91 74
0
10
20
30
40
50
60
70
80
90
100
Sep Oct Nov
2014 Total Sales Month-to-Month by Map Area
Central Torrance
South East Torrance - West
Hollywood Riviera
South Torrance
Southwood
West Torrance
N Torrance - West
N Torrance - East
Old Torrance
South East Torrance - East
Total Sales
Back to Table of Contents
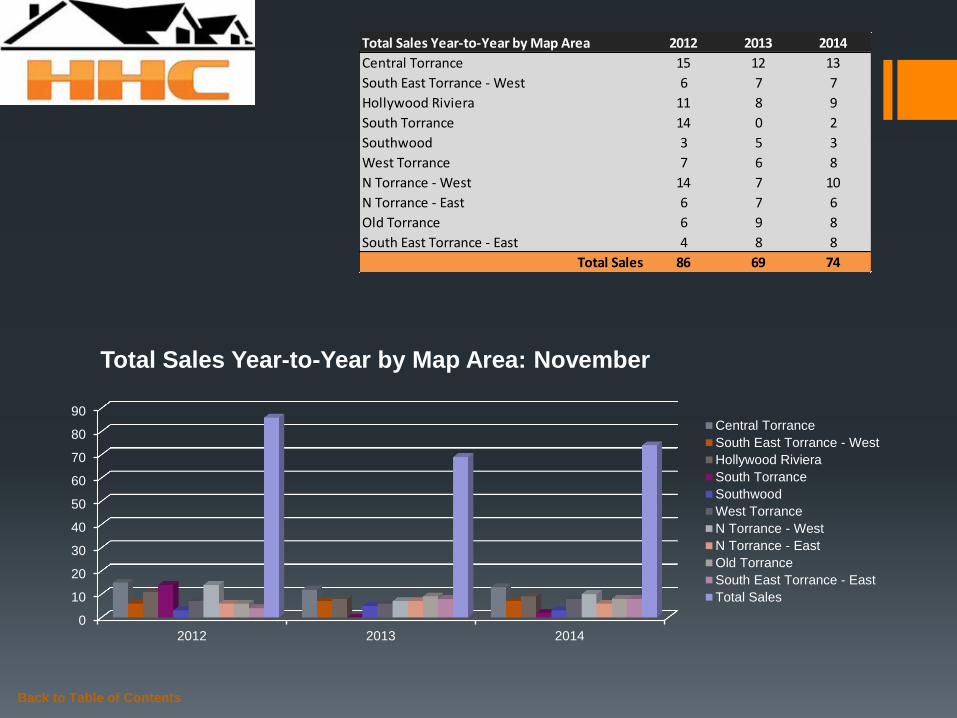
Total Sales Year-to-Year by Map Area 2012 2013 2014
Central Torrance 15 12 13
South East Torrance - West 6 7 7
Hollywood Riviera 11 8 9
South Torrance 14 0 2
Southwood 3 5 3
West Torrance 7 6 8
N Torrance - West 14 7 10
N Torrance - East 6 7 6
Old Torrance 6 9 8
South East Torrance - East 4 8 8
Total Sales 86 69 74
0
10
20
30
40
50
60
70
80
90
2012 2013 2014
Total Sales Year-to-Year by Map Area: November
Central Torrance
South East Torrance - West
Hollywood Riviera
South Torrance
Southwood
West Torrance
N Torrance - West
N Torrance - East
Old Torrance
South East Torrance - East
Total Sales
Back to Table of Contents
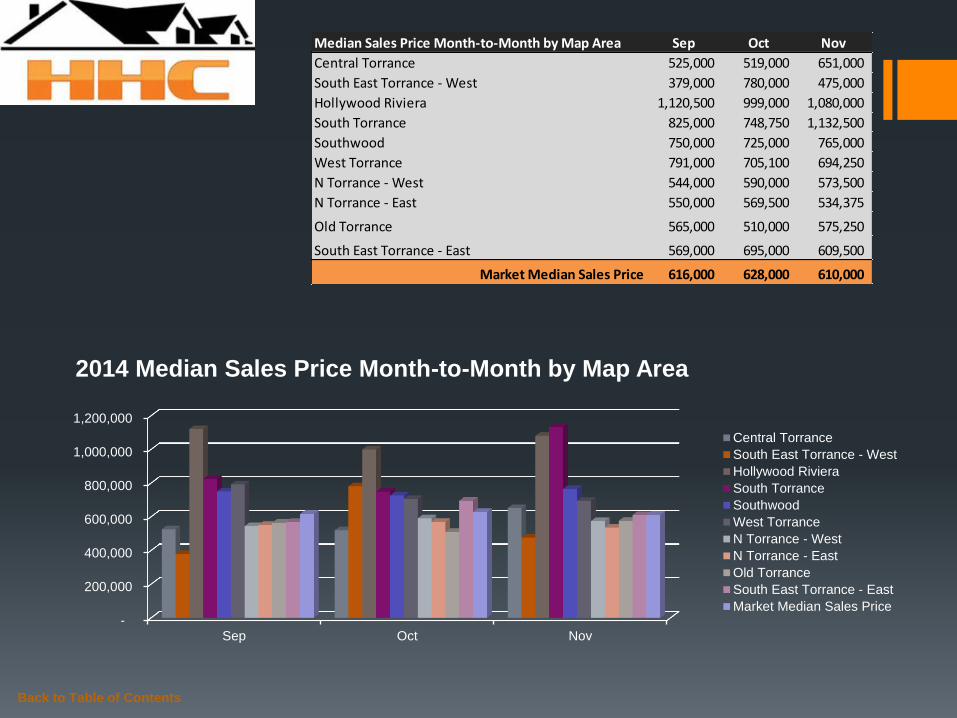
Median Sales Price Month-to-Month by Map Area Sep Oct Nov
Central Torrance 525,000 519,000 651,000
South East Torrance - West 379,000 780,000 475,000
Hollywood Riviera 1,120,500 999,000 1,080,000
South Torrance 825,000 748,750 1,132,500
Southwood 750,000 725,000 765,000
West Torrance 791,000 705,100 694,250
N Torrance - West 544,000 590,000 573,500
N Torrance - East 550,000 569,500 534,375
Old Torrance 565,000 510,000 575,250
South East Torrance - East 569,000 695,000 609,500
Market Median Sales Price 616,000 628,000 610,000
-
200,000
400,000
600,000
800,000
1,000,000
1,200,000
Sep Oct Nov
2014 Median Sales Price Month-to-Month by Map Area
Central Torrance
South East Torrance - West
Hollywood Riviera
South Torrance
Southwood
West Torrance
N Torrance - West
N Torrance - East
Old Torrance
South East Torrance - East
Market Median Sales Price
Back to Table of Contents
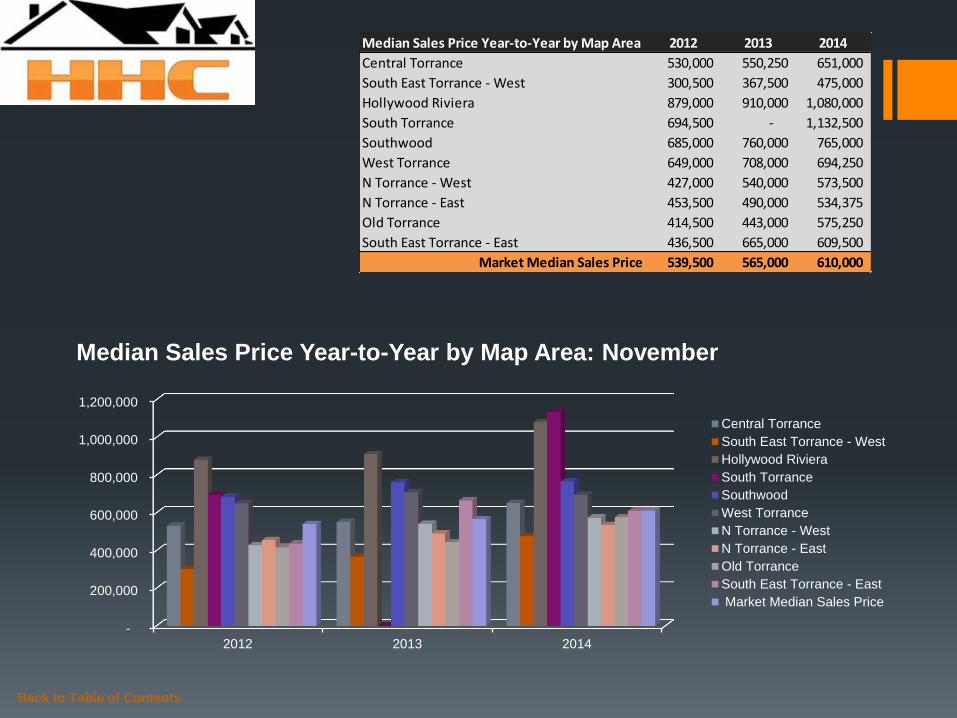
Median Sales Price Year-to-Year by Map Area 2012 2013 2014
Central Torrance 530,000 550,250 651,000
South East Torrance - West 300,500 367,500 475,000
Hollywood Riviera 879,000 910,000 1,080,000
South Torrance 694,500 - 1,132,500
Southwood 685,000 760,000 765,000
West Torrance 649,000 708,000 694,250
N Torrance - West 427,000 540,000 573,500
N Torrance - East 453,500 490,000 534,375
Old Torrance 414,500 443,000 575,250
South East Torrance - East 436,500 665,000 609,500
Market Median Sales Price 539,500 565,000 610,000
-
200,000
400,000
600,000
800,000
1,000,000
1,200,000
2012 2013 2014
Median Sales Price Year-to-Year by Map Area: November
Central Torrance
South East Torrance - West
Hollywood Riviera
South Torrance
Southwood
West Torrance
N Torrance - West
N Torrance - East
Old Torrance
South East Torrance - East
Market Median Sales Price
Back to Table of Contents
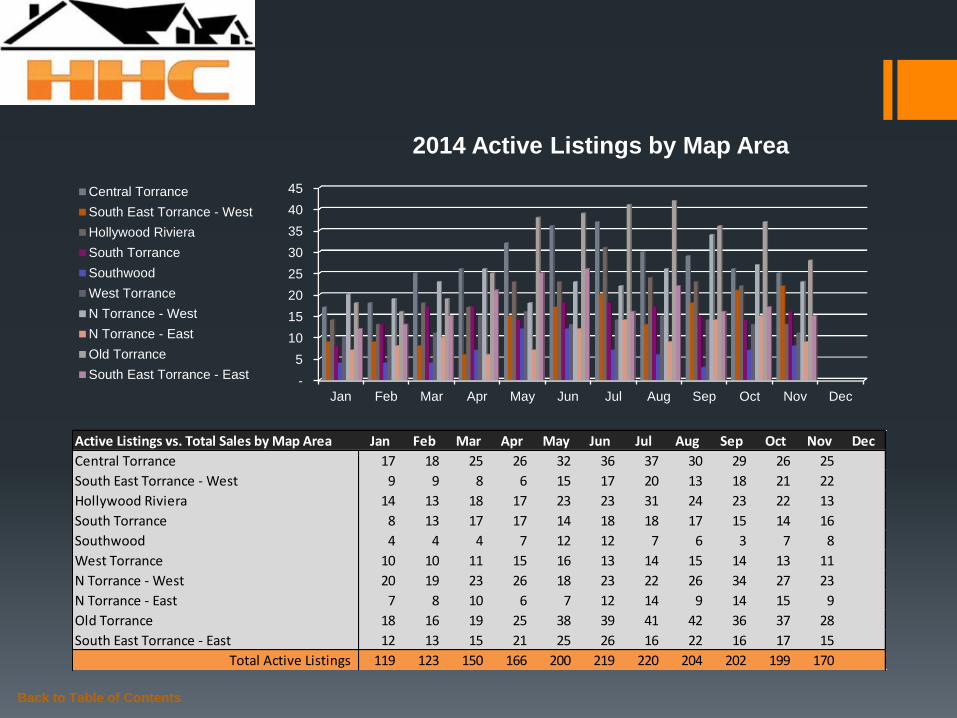
Active Listings vs. Total Sales by Map Area Jan Feb Mar Apr May Jun Jul Aug Sep Oct Nov Dec
Central Torrance 17 18 25 26 32 36 37 30 29 26 25
South East Torrance - West 9 9 8 6 15 17 20 13 18 21 22
Hollywood Riviera 14 13 18 17 23 23 31 24 23 22 13
South Torrance 8 13 17 17 14 18 18 17 15 14 16
Southwood 4 4 4 7 12 12 7 6 3 7 8
West Torrance 10 10 11 15 16 13 14 15 14 13 11
N Torrance - West 20 19 23 26 18 23 22 26 34 27 23
N Torrance - East 7 8 10 6 7 12 14 9 14 15 9
Old Torrance 18 16 19 25 38 39 41 42 36 37 28
South East Torrance - East 12 13 15 21 25 26 16 22 16 17 15
Total Active Listings 119 123 150 166 200 219 220 204 202 199 170
-
5
10
15
20
25
30
35
40
45
Jan Feb Mar Apr May Jun Jul Aug Sep Oct Nov Dec
2014 Active Listings by Map Area
Central Torrance
South East Torrance - West
Hollywood Riviera
South Torrance
Southwood
West Torrance
N Torrance - West
N Torrance - East
Old Torrance
South East Torrance - East
Back to Table of Contents
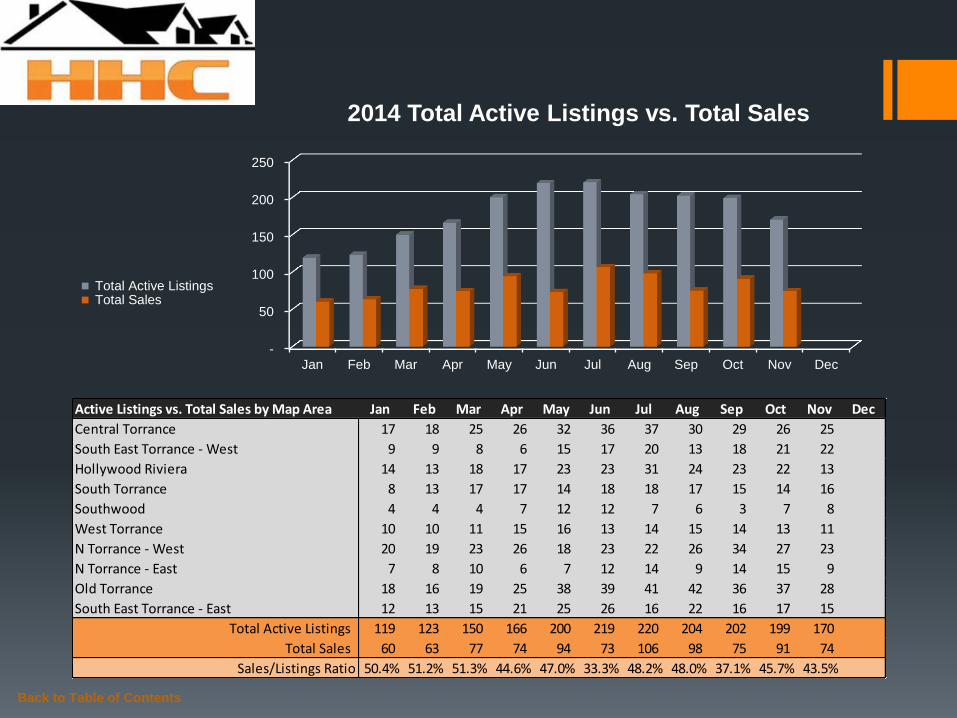
Active Listings vs. Total Sales by Map Area Jan Feb Mar Apr May Jun Jul Aug Sep Oct Nov Dec
Central Torrance 17 18 25 26 32 36 37 30 29 26 25
South East Torrance - West 9 9 8 6 15 17 20 13 18 21 22
Hollywood Riviera 14 13 18 17 23 23 31 24 23 22 13
South Torrance 8 13 17 17 14 18 18 17 15 14 16
Southwood 4 4 4 7 12 12 7 6 3 7 8
West Torrance 10 10 11 15 16 13 14 15 14 13 11
N Torrance - West 20 19 23 26 18 23 22 26 34 27 23
N Torrance - East 7 8 10 6 7 12 14 9 14 15 9
Old Torrance 18 16 19 25 38 39 41 42 36 37 28
South East Torrance - East 12 13 15 21 25 26 16 22 16 17 15
Total Active Listings 119 123 150 166 200 219 220 204 202 199 170
Total Sales 60 63 77 74 94 73 106 98 75 91 74
Sales/Listings Ratio 50.4% 51.2% 51.3% 44.6% 47.0% 33.3% 48.2% 48.0% 37.1% 45.7% 43.5%
-
50
100
150
200
250
Jan Feb Mar Apr May Jun Jul Aug Sep Oct Nov Dec
2014 Total Active Listings vs. Total Sales
Total Active Listings Total Sales
Back to Table of Contents
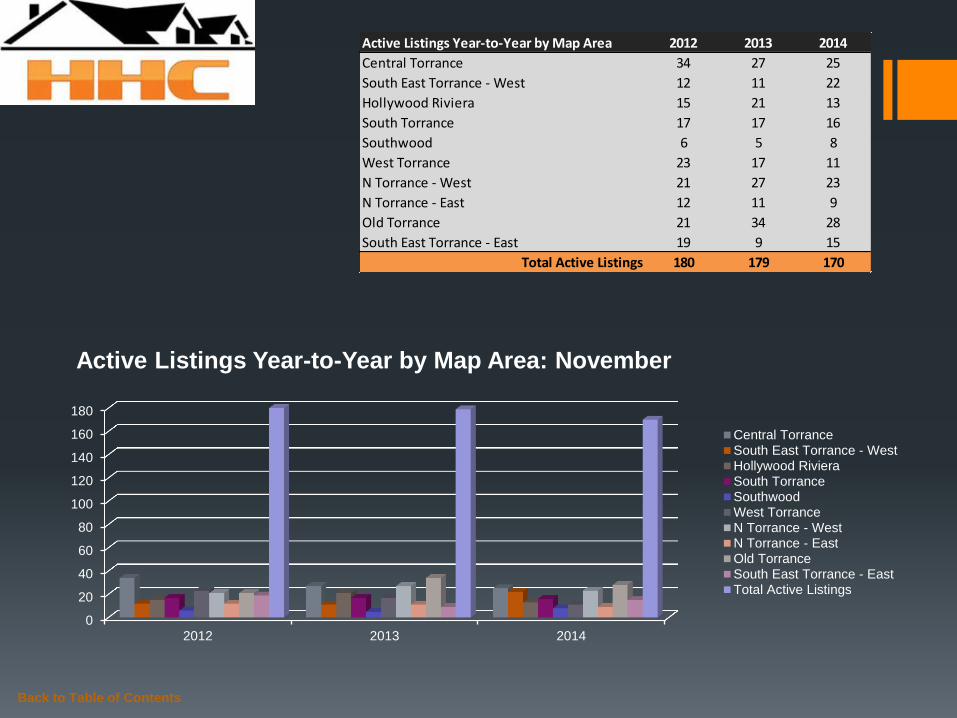
Active Listings Year-to-Year by Map Area 2012 2013 2014
Central Torrance 34 27 25
South East Torrance - West 12 11 22
Hollywood Riviera 15 21 13
South Torrance 17 17 16
Southwood 6 5 8
West Torrance 23 17 11
N Torrance - West 21 27 23
N Torrance - East 12 11 9
Old Torrance 21 34 28
South East Torrance - East 19 9 15
Total Active Listings 180 179 170
0
20
40
60
80
100
120
140
160
180
2012 2013 2014
Active Listings Year-to-Year by Map Area: November
Central TorranceSouth East Torrance - WestHollywood RivieraSouth TorranceSouthwoodWest TorranceN Torrance - WestN Torrance - EastOld TorranceSouth East Torrance - EastTotal Active Listings
Back to Table of Contents
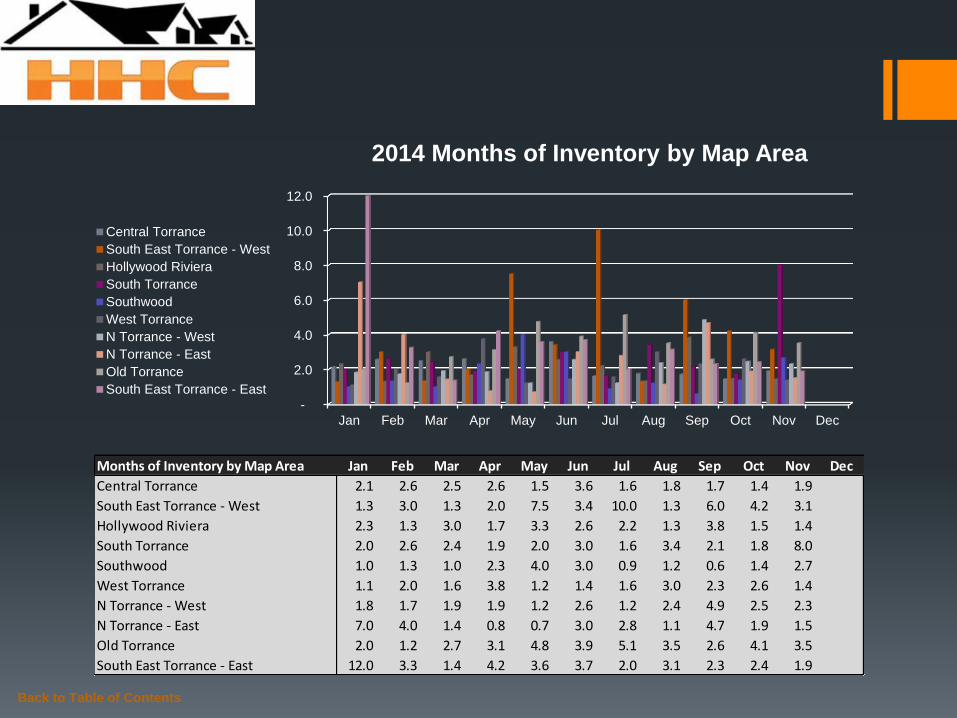
Months of Inventory by Map Area Jan Feb Mar Apr May Jun Jul Aug Sep Oct Nov Dec
Central Torrance 2.1 2.6 2.5 2.6 1.5 3.6 1.6 1.8 1.7 1.4 1.9
South East Torrance - West 1.3 3.0 1.3 2.0 7.5 3.4 10.0 1.3 6.0 4.2 3.1
Hollywood Riviera 2.3 1.3 3.0 1.7 3.3 2.6 2.2 1.3 3.8 1.5 1.4
South Torrance 2.0 2.6 2.4 1.9 2.0 3.0 1.6 3.4 2.1 1.8 8.0
Southwood 1.0 1.3 1.0 2.3 4.0 3.0 0.9 1.2 0.6 1.4 2.7
West Torrance 1.1 2.0 1.6 3.8 1.2 1.4 1.6 3.0 2.3 2.6 1.4
N Torrance - West 1.8 1.7 1.9 1.9 1.2 2.6 1.2 2.4 4.9 2.5 2.3
N Torrance - East 7.0 4.0 1.4 0.8 0.7 3.0 2.8 1.1 4.7 1.9 1.5
Old Torrance 2.0 1.2 2.7 3.1 4.8 3.9 5.1 3.5 2.6 4.1 3.5
South East Torrance - East 12.0 3.3 1.4 4.2 3.6 3.7 2.0 3.1 2.3 2.4 1.9
-
2.0
4.0
6.0
8.0
10.0
12.0
Jan Feb Mar Apr May Jun Jul Aug Sep Oct Nov Dec
2014 Months of Inventory by Map Area
Central Torrance
South East Torrance - West
Hollywood Riviera
South Torrance
Southwood
West Torrance
N Torrance - West
N Torrance - East
Old Torrance
South East Torrance - East
Back to Table of Contents
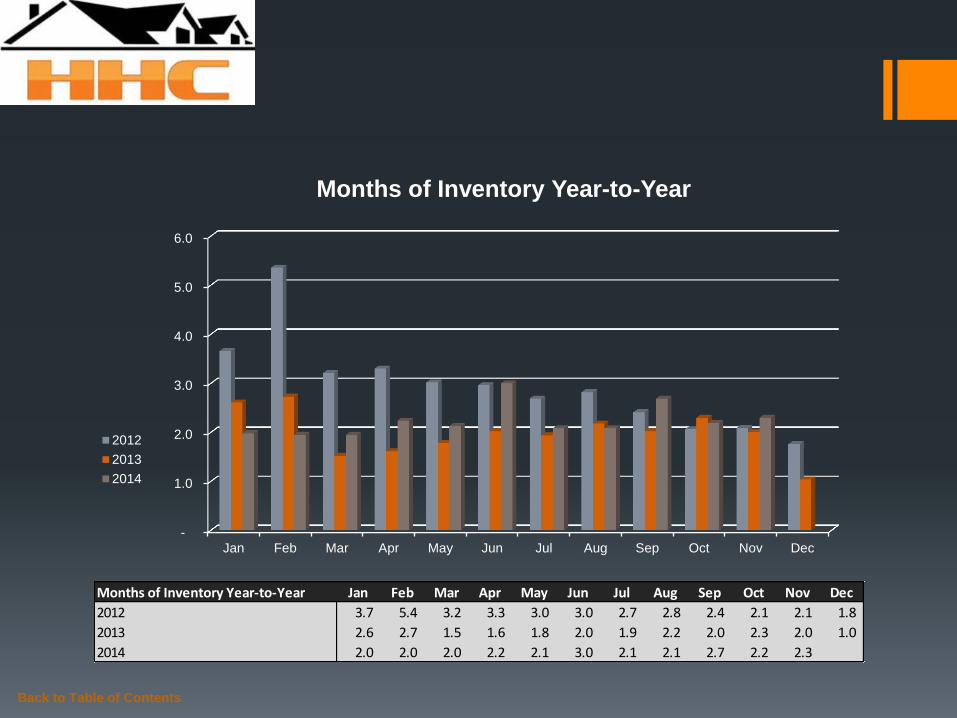
Months of Inventory Year-to-Year Jan Feb Mar Apr May Jun Jul Aug Sep Oct Nov Dec
2012 3.7 5.4 3.2 3.3 3.0 3.0 2.7 2.8 2.4 2.1 2.1 1.8
2013 2.6 2.7 1.5 1.6 1.8 2.0 1.9 2.2 2.0 2.3 2.0 1.0
2014 2.0 2.0 2.0 2.2 2.1 3.0 2.1 2.1 2.7 2.2 2.3
-
1.0
2.0
3.0
4.0
5.0
6.0
Jan Feb Mar Apr May Jun Jul Aug Sep Oct Nov Dec
Months of Inventory Year-to-Year
2012
2013
2014
Outlook for October
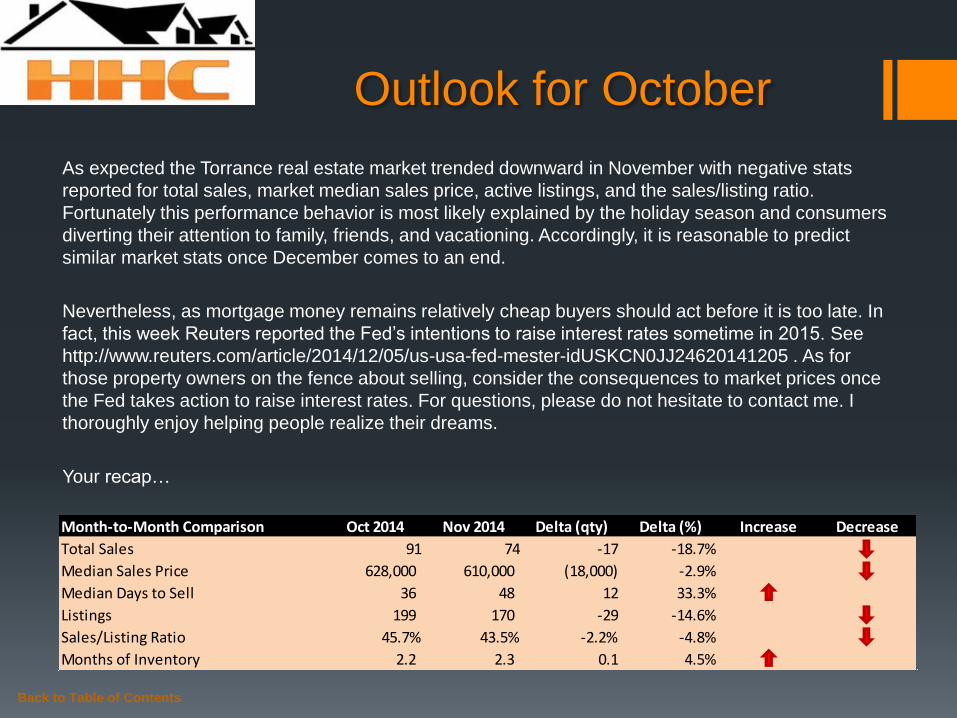
As expected the Torrance real estate market trended downward in November with negative stats
reported for total sales, market median sales price, active listings, and the sales/listing ratio.
Fortunately this performance behavior is most likely explained by the holiday season and consumers
diverting their attention to family, friends, and vacationing. Accordingly, it is reasonable to predict
similar market stats once December comes to an end.
Nevertheless, as mortgage money remains relatively cheap buyers should act before it is too late. In
fact, this week Reuters reported the Fed’s intentions to raise interest rates sometime in 2015. See
http://www.reuters.com/article/2014/12/05/us-usa-fed-mester-idUSKCN0JJ24620141205 . As for
those property owners on the fence about selling, consider the consequences to market prices once
the Fed takes action to raise interest rates. For questions, please do not hesitate to contact me. I
thoroughly enjoy helping people realize their dreams.
Your recap…
Back to Table of Contents
Month-to-Month Comparison Oct 2014 Nov 2014 Delta (qty) Delta (%) Increase Decrease
Total Sales 91 74 -17 -18.7%
Median Sales Price 628,000 610,000 (18,000) -2.9%
Median Days to Sell 36 48 12 33.3%
Listings 199 170 -29 -14.6%
Sales/Listing Ratio 45.7% 43.5% -2.2% -4.8%
Months of Inventory 2.2 2.3 0.1 4.5%
Back to Table of Contents
Serving South Bay Home Buyers and Sellers Since 2001
RE/MAX Top 4 Team in California – 2012
RE/MAX 100% Club - 2011
Shorewood Realtors Top 5% in Overall Sales 2001-2006, 2008-2010
About
Hady Chahine…

The information being provided by CARETS (CLAW, CRISNet MLS, DAMLS, CRMLS, i-Tech MLS, and/or VCRDS) is for the visitor’s personal, non-commercial use and may not be used for
any purpose other than to identify prospective properties visitor may be interested in purchasing. Any information relating to a property referenced on this web site comes from the Internet
Data Exchange (IDX) program of CARETS. This web site may reference real estate listing(s) held by a brokerage firm other than the broker and/or agent who owns this web site. The accuracy
of all information, regardless of source, including but not limited to square footages and lot sizes, is deemed reliable but not guaranteed and should be personally verified through personal
inspection by and/or with the appropriate professionals.
Back to Table of Contents
Listings MLS BLOG Website