february 2015 torrance real estate market trends update
TRANSCRIPT

Table of
Contents
Key Statistics for February
Sales 2015 Residential Sales Stats Year-to-Year Total Sales by Map Area Median 2015 Median Sales Stats Year-to-Year Median Sales by Map Area Listings 2015 Active Listings by Map Area 2015 Total Active Listings vs. Total Sales Year-to-Year Active Listings by Map Area Inventory 2015 Months of Inventory by Map Area Year-to-Year Months of Inventory
Outlook for March
About Hady Chahine Contact Information

Key Statistics for February
Back to Table of Contents
= trending positive = trending positive
= trending negative = trending negative
Month-to-Month Comparison Jan 2015 Feb 2015 Delta (qty) Delta (%) Increase Decrease
Total Sales 44 67 23 52.3%
Median Sales Price 637,500 610,000 (27,500) -4.3%
Median Days to Sell 57 32 -25 -43.9%
Listings 156 164 8 5.1%
Sales/Listing Ratio 28.2% 40.9% 12.7% 45.0%
Months of Inventory 3.6 2.5 -1.1 -30.6%
Monthly Comparison Year-to-Year Feb 2014 Feb 2015 Delta Delta Increase Decrease
Total Sales 63 67 4 6.3%
Median Sales Price 600,000 610,000 10,000 1.7%
Median Days to Sell 34 32 -2 -5.9%
Listings 140 164 24 17.1%
Months of Inventory 2.0 2.5 0.5 25.0%

Back to Table of Contents
Total Sales Month-to-Month by Map Area Jan Feb Mar
Central Torrance 5 15
South East Torrance - West 6 2
Hollywood Riviera 4 8
South Torrance 4 5
Southwood 2 6
West Torrance 5 3
N Torrance - West 6 9
N Torrance - East 5 5
Old Torrance 4 12
South East Torrance - East 3 2
Total Sales 44 67
0
10
20
30
40
50
60
70
Jan Feb Mar
2015 Total Sales Month-to-Month by Map Area
Central Torrance
South East Torrance - West
Hollywood Riviera
South Torrance
Southwood
West Torrance
N Torrance - West
N Torrance - East
Old Torrance
South East Torrance - East
Total Sales

Back to Table of Contents
Total Sales Year-to-Year by Map Area 2013 2014 2015
Central Torrance 9 8 15
South East Torrance - West 5 3 2
Hollywood Riviera 10 10 8
South Torrance 4 5 5
Southwood 2 3 6
West Torrance 6 5 3
N Torrance - West 8 10 9
N Torrance - East 2 2 5
Old Torrance 4 13 12
South East Torrance - East 1 4 2
Total Sales 51 63 67
0
10
20
30
40
50
60
70
2013 2014 2015
Total Sales Year-to-Year by Map Area: February
Central Torrance
South East Torrance - West
Hollywood Riviera
South Torrance
Southwood
West Torrance
N Torrance - West
N Torrance - East
Old Torrance
South East Torrance - East
Total Sales

Back to Table of Contents
Median Sales Price Month-to-Month by Map Area Jan Feb Mar
Central Torrance 615,000 530,000
South East Torrance - West 751,500 619,500
Hollywood Riviera 984,500 935,000
South Torrance 692,500 695,000
Southwood 927,500 515,000
West Torrance 771,000 740,000
N Torrance - West 565,000 619,000
N Torrance - East 583,000 460,000
Old Torrance 585,500 607,500
South East Torrance - East 675,000 595,750
Market Median Sales Price 637,500 610,000
-
100,000
200,000
300,000
400,000
500,000
600,000
700,000
800,000
900,000
1,000,000
Jan Feb Mar
2015 Median Sales Price Month-to-Month by Map Area
Central Torrance
South East Torrance - West
Hollywood Riviera
South Torrance
Southwood
West Torrance
N Torrance - West
N Torrance - East
Old Torrance
South East Torrance - East
Market Median Sales Price

Back to Table of Contents
Median Sales Price Year-to-Year by Map Area 2013 2014 2015
Central Torrance 575,000 521,500 530,000
South East Torrance - West 314,000 420,000 619,500
Hollywood Riviera 977,500 1,202,000 935,000
South Torrance 617,500 710,000 695,000
Southwood 662,000 517,000 515,000
West Torrance 637,500 742,408 740,000
N Torrance - West 438,500 498,500 619,000
N Torrance - East 479,425 455,550 460,000
Old Torrance 445,000 515,000 607,500
South East Torrance - East 550,000 697,000 595,750
Market Median Sales Price 575,000 600,000 610,000
-
200,000
400,000
600,000
800,000
1,000,000
1,200,000
1,400,000
2013 2014 2015
Median Sales Price Year-to-Year by Map Area: February
Central Torrance
South East Torrance - West
Hollywood Riviera
South Torrance
Southwood
West Torrance
N Torrance - West
N Torrance - East
Old Torrance
South East Torrance - East
Market Median Sales Price
Back to Table of Contents
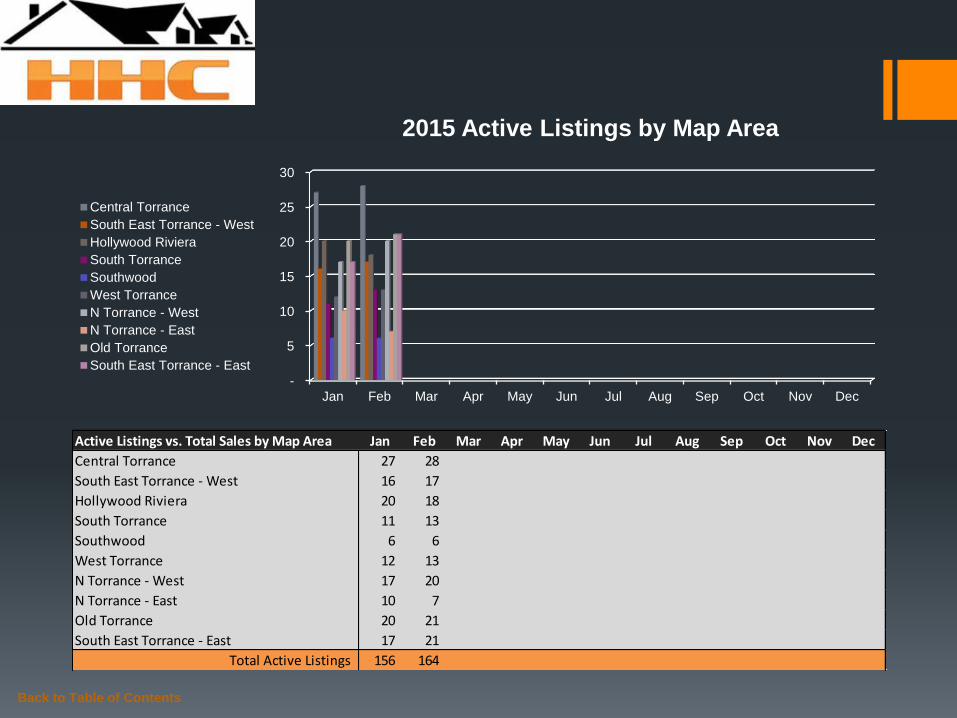
Active Listings vs. Total Sales by Map Area Jan Feb Mar Apr May Jun Jul Aug Sep Oct Nov Dec
Central Torrance 27 28
South East Torrance - West 16 17
Hollywood Riviera 20 18
South Torrance 11 13
Southwood 6 6
West Torrance 12 13
N Torrance - West 17 20
N Torrance - East 10 7
Old Torrance 20 21
South East Torrance - East 17 21
Total Active Listings 156 164
-
5
10
15
20
25
30
Jan Feb Mar Apr May Jun Jul Aug Sep Oct Nov Dec
2015 Active Listings by Map Area
Central Torrance
South East Torrance - West
Hollywood Riviera
South Torrance
Southwood
West Torrance
N Torrance - West
N Torrance - East
Old Torrance
South East Torrance - East

Back to Table of Contents
Active Listings vs. Total Sales by Map Area Jan Feb Mar Apr May Jun Jul Aug Sep Oct Nov Dec
Central Torrance 27 28
South East Torrance - West 16 17
Hollywood Riviera 20 18
South Torrance 11 13
Southwood 6 6
West Torrance 12 13
N Torrance - West 17 20
N Torrance - East 10 7
Old Torrance 20 21
South East Torrance - East 17 21
Total Active Listings 156 164
Total Sales 44 67
Sales/Listings Ratio 28.2% 40.9%
-
20
40
60
80
100
120
140
160
180
Jan Feb Mar Apr May Jun Jul Aug Sep Oct Nov Dec
2015 Total Active Listings vs. Total Sales
Total Active Listings
Total Sales

Back to Table of Contents
Active Listings Year-to-Year by Map Area 2013 2014 2015
Central Torrance 16 24 28
South East Torrance - West 11 8 17
Hollywood Riviera 18 14 18
South Torrance 13 15 13
Southwood 9 6 6
West Torrance 15 11 13
N Torrance - West 14 25 20
N Torrance - East 3 8 7
Old Torrance 25 21 21
South East Torrance - East 16 8 21
Total Active Listings 140 140 164
0
20
40
60
80
100
120
140
160
180
2013 2014 2015
Active Listings Year-to-Year by Map Area: February
Central Torrance
South East Torrance - West
Hollywood Riviera
South Torrance
Southwood
West Torrance
N Torrance - West
N Torrance - East
Old Torrance
South East Torrance - East
Total Active Listings

Back to Table of Contents
Months of Inventory by Map Area Jan Feb Mar Apr May Jun Jul Aug Sep Oct Nov Dec
Central Torrance 5.4 1.9
South East Torrance - West 2.7 8.5
Hollywood Riviera 5.0 2.3
South Torrance 2.8 2.6
Southwood 3.0 1.0
West Torrance 2.4 4.3
N Torrance - West 2.8 2.2
N Torrance - East 2.0 1.4
Old Torrance 5.0 1.8
South East Torrance - East 5.7 10.5
-
2.0
4.0
6.0
8.0
10.0
12.0
Jan Feb Mar Apr May Jun Jul Aug Sep Oct Nov Dec
2015 Months of Inventory by Map Area
Central Torrance
South East Torrance - West
Hollywood Riviera
South Torrance
Southwood
West Torrance
N Torrance - West
N Torrance - East
Old Torrance
South East Torrance - East

Back to Table of Contents
Months of Inventory Year-to-Year Jan Feb Mar Apr May Jun Jul Aug Sep Oct Nov Dec
2013 2.6 2.7 1.5 1.6 1.8 2.0 1.9 2.2 2.0 2.3 2.0 1.0
2014 2.0 2.0 2.0 2.2 2.1 3.0 2.1 2.1 2.7 2.2 2.3 1.8
2015 3.6 2.5
-
0.5
1.0
1.5
2.0
2.5
3.0
3.5
4.0
Jan Feb Mar Apr May Jun Jul Aug Sep Oct Nov Dec
Months of Inventory Year-to-Year
2013
2014
2015
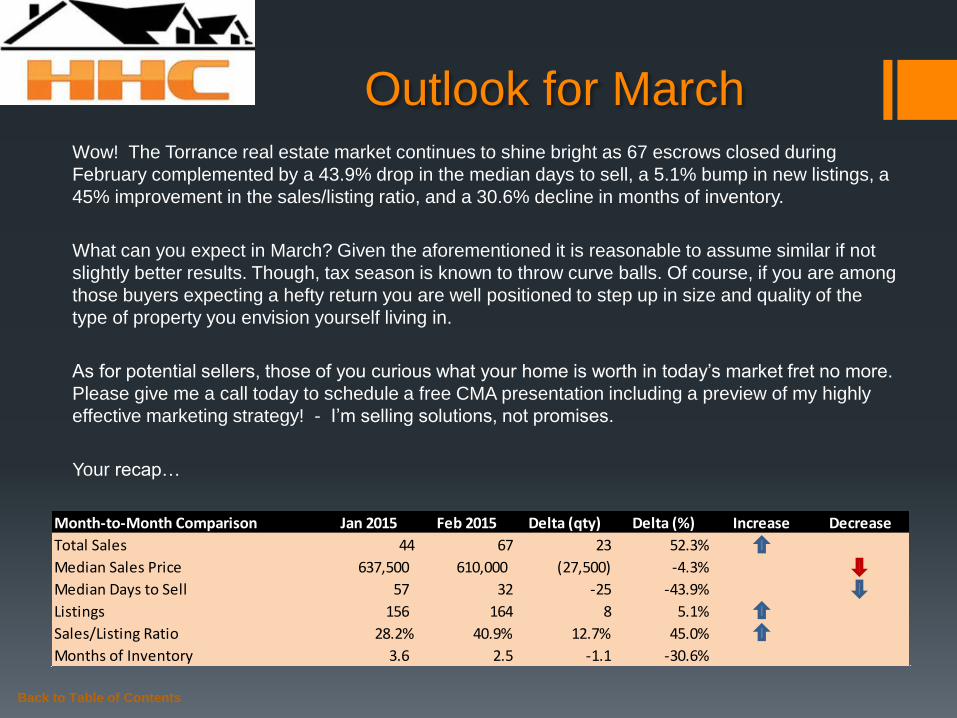
Outlook for March Wow! The Torrance real estate market continues to shine bright as 67 escrows closed during
February complemented by a 43.9% drop in the median days to sell, a 5.1% bump in new listings, a
45% improvement in the sales/listing ratio, and a 30.6% decline in months of inventory.
What can you expect in March? Given the aforementioned it is reasonable to assume similar if not
slightly better results. Though, tax season is known to throw curve balls. Of course, if you are among
those buyers expecting a hefty return you are well positioned to step up in size and quality of the
type of property you envision yourself living in.
As for potential sellers, those of you curious what your home is worth in today’s market fret no more.
Please give me a call today to schedule a free CMA presentation including a preview of my highly
effective marketing strategy! - I’m selling solutions, not promises.
Your recap…
Back to Table of Contents
Month-to-Month Comparison Jan 2015 Feb 2015 Delta (qty) Delta (%) Increase Decrease
Total Sales 44 67 23 52.3%
Median Sales Price 637,500 610,000 (27,500) -4.3%
Median Days to Sell 57 32 -25 -43.9%
Listings 156 164 8 5.1%
Sales/Listing Ratio 28.2% 40.9% 12.7% 45.0%
Months of Inventory 3.6 2.5 -1.1 -30.6%

Back to Table of Contents
Serving South Bay Home Buyers and Sellers Since 2001
RE/MAX Top 4 Team in California – 2012
RE/MAX 100% Club - 2011
Shorewood Realtors Top 5% in Overall Sales 2001-2006, 2008-2010
About
Hady Chahine…

The information being provided by CARETS (CLAW, CRISNet MLS, DAMLS, CRMLS, i-Tech MLS, and/or VCRDS) is for the visitor’s personal, non-commercial use and may not be used for
any purpose other than to identify prospective properties visitor may be interested in purchasing. Any information relating to a property referenced on this web site comes from the Internet
Data Exchange (IDX) program of CARETS. This web site may reference real estate listing(s) held by a brokerage firm other than the broker and/or agent who owns this web site. The accuracy
of all information, regardless of source, including but not limited to square footages and lot sizes, is deemed reliable but not guaranteed and should be personally verified through personal
inspection by and/or with the appropriate professionals.
Back to Table of Contents
Listings MLS BLOG Website