a decision support framework for intermodal transport policy · service. an increased level of...
TRANSCRIPT
ORIGINAL PAPER
A decision support framework for intermodaltransport policy
Cathy Macharis & An Caris & Bart Jourquin &
Ethem Pekin
Received: 13 March 2011 /Accepted: 3 November 2011 /Published online: 22 November 2011# The Author(s) 2011. This article is published with open access at SpringerLink.com
AbstractPurpose In recent years intermodal transport has receivedan increased attention due to problems of road congestion,environmental concerns and traffic safety. A growingrecognition of the external effects of transport urges to gotowards more sustainable transport modes. As a conse-quence, research and policy interest in intermodal freighttransportation problems is growing.Methods In this paper the strengths of Operations Research(OR) modelling techniques applicable to decisions relatedto intermodal transport are used to develop a particularframework that is able to assess the performance of currentand potential policy measures which affects the intermodaltransport industry. The assessment framework includesthree core models necessary to evaluate all relevanttransport modes and aggregation levels.Results In the last section of the paper, the assessmentframework is applied to a case study related to the locationof a new intermodal barge terminal for which the optimal
location is searched, the market area is analysed and theimpact on the performance of the network is discussed.
Keywords Intermodal transport . Decision support system .
Terminal location . Inland navigation
1 Introduction
In recent years intermodal transport has received an increasedattention due to problems of road congestion, environmentalconcerns and traffic safety. A growing recognition of thestrategic importance of speed and agility in the supply chain isforcing firms to reconsider traditional logistic services. As aconsequence, research and policy interest in intermodalfreight transportation problems is growing. Macharis andBontekoning [18] define intermodal transport as thecombination of at least two modes of transport in a singletransport chain, without a change of container for thegoods, with most of the route travelled by rail, inlandwaterway or ocean-going vessel and with the shortestpossible initial and final journeys by road. Intermodaltransport may include various types of transport modes. Inthis paper we concentrate on the combination rail/road andwaterways/road using containers as loading units.
The intermodal transport industry is characterized bymultiple decision makers who need to work in collaborationin order for the transport system to run smoothly. Anoverview of the state-of-the-art research on planningproblems in intermodal freight transport is presented byCaris et al. [1]. Intermodal transport, is a combination ofdifferent transport modes that has unique characteristics thatdistinguish it from other transport modes. Intermodaltransport arises as a new transport mode when the chain isfully integrated and can be seen as a complete door-to-door
C. Macharis (*) : E. PekinVrije Universiteit Brussel,Pleinlaan 2,Brussel B-1050, Belgiume-mail:[email protected]
A. CarisTransportation Research Institute (IMOB), Universiteit Hasselt,FWO Vlaanderen,Wetenschapspark 5,Diepenbeek B-3590, Belgiume-mail: [email protected]
B. JourquinUniversité Catholique de Louvain - UCL Mons,Chaussée de Binche 151,Mons B-7000, Belgiume-mail: [email protected]
Eur. Transp. Res. Rev. (2011) 3:167–178DOI 10.1007/s12544-011-0062-5

service. An increased level of coordination is necessary toorganize the intermodal transport flow. Decision-makingsupport tools may assist the actors and stakeholdersinvolved in intermodal operations.
Litman [17] and Rassafi and Vaziri [26] examine keysustainable transport goals, objectives and performanceindicators. Sustainability can be grouped under three majorgoals: economic, social and environmental. Many indica-tors can be derived from the objectives defined with thesegoals. The main aim is to achieve an integrated, compre-hensive and inclusive planning to allocate transport fundingon alternative transport modes in a most beneficial way.This is possible through good governance and planning. Inthis paper we focus on the economic and environmentalaspects of transport policy making for intermodal transport.
As several transport modes are included in an intermodaltransport chain, intermodal transport costs involve a varietyof transport activities. Figure 1 represents the intermodalcost function. Taking a door-to-door intermodal transportchain, the function allows calculating total intermodaltransport cost between an origin and a destination.
At the port intermodal barge transport has larger handlingcosts compared to unimodal road transport. This is due to thecranes that are being used for the transhipment of containers onbarges. The main haulage is carried by barge. The advantage ofintermodal transport lies in the smaller variable costs duringmain haulage, as a result of the scale economies that areobtained by the large capacities that can be used. Scaleeconomies, gained by the main haulage leg of an intermodaltransport chain, can further be increased by an introduction oflarger vessels. As the variable costs of barge transport ischeaper compared to road-only transport, longer distancecovered by the intermodal leg will make intermodal bargetransport more efficient than road-only transport. At the end ofthe chain, this advantage is partly compensated by the extrahandling cost that has to be paid for the terminal handling.Terminal operations necessary to tranship the goods from onemode to another imply a vertical leap in the cost curve. Reliableterminal operations will contribute to prevent costs that takeplace in transhipping a container from the main haulage to thedrayage. In order to achieve reliable operations and optimise
the terminal processes, ICTapplications will be needed. Specialattention for empty containers is also required. The posthaulage in the intermodal transport chain is performed by road.The cost curve of intermodal freight transport thus runs parallelto unimodal road transport. Once the total intermodal cost iscalculated, it is possible to make comparisons with road-onlytransport, opening the way to a series of possible scenarios thatcan be assessed using an appropriate set of tools.
The attention of policy makers for intermodal transport,is based next to the economic efficiency, on the willingnessto lower the externalities of transport and by doing so tocome to a more sustainable transport system. Externalitiesare changes in welfare caused by economic activitieswithout these changes being reflected in market prices[29]. In the field of transport these externalities arisewhen transport consumers/producers impose additionalcosts on society without having to bear these coststhemselves. External costs are externalities expressed inmonetary terms.
In economic literature, the most important external costsof transport are [7]:
& Accidents;& Noise;& Air pollution;& Climate change;& Congestion;
Calculation of the relevant external costs in this specificcase is based on best practices in the field of external costassessment currently available in scientific literature [19].Although there is growing consensus on the main method-ological issues, there remain many uncertainties whenperforming an external cost assessment in practice. Marginalexternal costs of transport activities depend strongly onparameters such as fuel type, location (urban, interurban,rural), driving conditions (peak, off-peak, night) and vehiclecharacteristics (EURO standards) [8]. This explains thevariety in results sometimes observed when looking atdifferent external transport cost studies. According to Mihicet al. [20], water transport enables to achieve modern high-capacity transport of freight without harming the environment
road transport
seaport
main haulage
road posthaulage
intermodal transport
Fig. 1 Intermodal cost functionPekin [24]
168 Eur. Transp. Res. Rev. (2011) 3:167–178
too much, meaning that it does not create much pollution andit does not harm the view of the landscape.
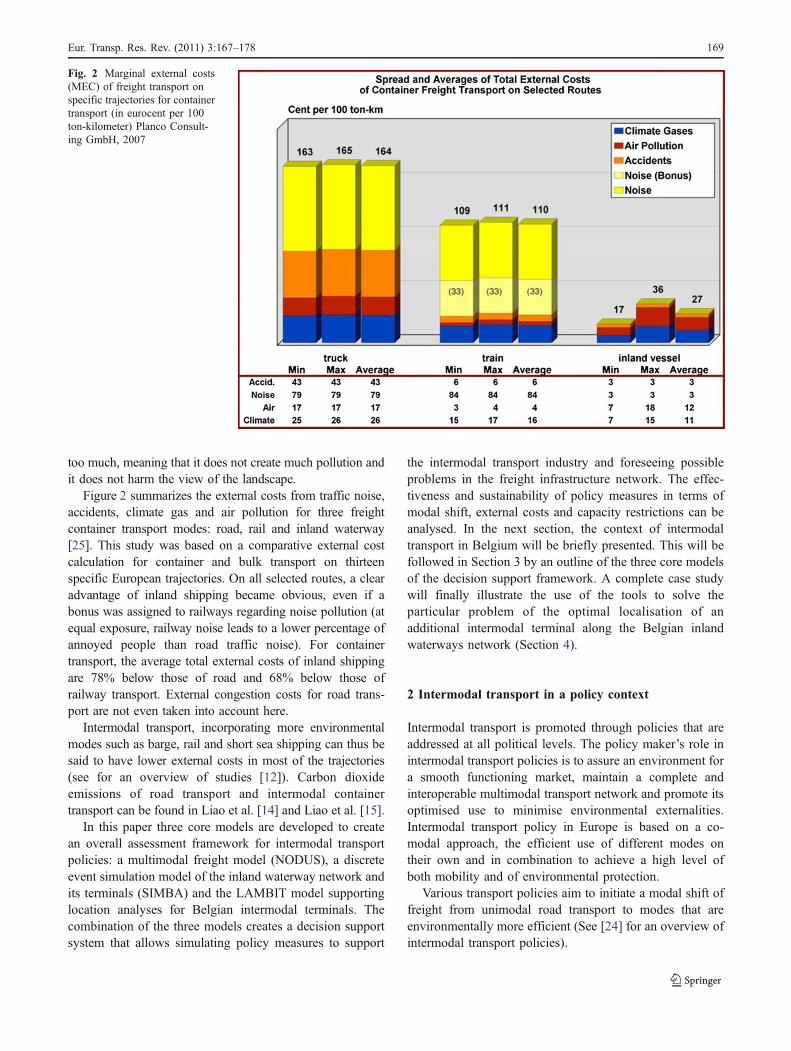
Figure 2 summarizes the external costs from traffic noise,accidents, climate gas and air pollution for three freightcontainer transport modes: road, rail and inland waterway[25]. This study was based on a comparative external costcalculation for container and bulk transport on thirteenspecific European trajectories. On all selected routes, a clearadvantage of inland shipping became obvious, even if abonus was assigned to railways regarding noise pollution (atequal exposure, railway noise leads to a lower percentage ofannoyed people than road traffic noise). For containertransport, the average total external costs of inland shippingare 78% below those of road and 68% below those ofrailway transport. External congestion costs for road trans-port are not even taken into account here.
Intermodal transport, incorporating more environmentalmodes such as barge, rail and short sea shipping can thus besaid to have lower external costs in most of the trajectories(see for an overview of studies [12]). Carbon dioxideemissions of road transport and intermodal containertransport can be found in Liao et al. [14] and Liao et al. [15].
In this paper three core models are developed to createan overall assessment framework for intermodal transportpolicies: a multimodal freight model (NODUS), a discreteevent simulation model of the inland waterway network andits terminals (SIMBA) and the LAMBIT model supportinglocation analyses for Belgian intermodal terminals. Thecombination of the three models creates a decision supportsystem that allows simulating policy measures to support
the intermodal transport industry and foreseeing possibleproblems in the freight infrastructure network. The effec-tiveness and sustainability of policy measures in terms ofmodal shift, external costs and capacity restrictions can beanalysed. In the next section, the context of intermodaltransport in Belgium will be briefly presented. This will befollowed in Section 3 by an outline of the three core modelsof the decision support framework. A complete case studywill finally illustrate the use of the tools to solve theparticular problem of the optimal localisation of anadditional intermodal terminal along the Belgian inlandwaterways network (Section 4).
2 Intermodal transport in a policy context
Intermodal transport is promoted through policies that areaddressed at all political levels. The policy maker’s role inintermodal transport policies is to assure an environment fora smooth functioning market, maintain a complete andinteroperable multimodal transport network and promote itsoptimised use to minimise environmental externalities.Intermodal transport policy in Europe is based on a co-modal approach, the efficient use of different modes ontheir own and in combination to achieve a high level ofboth mobility and of environmental protection.
Various transport policies aim to initiate a modal shift offreight from unimodal road transport to modes that areenvironmentally more efficient (See [24] for an overview ofintermodal transport policies).
Fig. 2 Marginal external costs(MEC) of freight transport onspecific trajectories for containertransport (in eurocent per 100ton-kilometer) Planco Consult-ing GmbH, 2007
Eur. Transp. Res. Rev. (2011) 3:167–178 169
In 2007, the European Commission (EC) announced aEuropean freight transport action plan. One of the conceptsintroduced is that of “green transport corridors”. Greentransport corridors include shortsea shipping, rail, inlandwaterways and road transport combinations to enable environ-mentally friendly transport solutions for the European industry.The EC also proposes to revise the Directive on the charging ofroad transport for infrastructure use (Eurovignette).
Addressed to potential customers, who mainly use roadonly transport, the policy aims to create awareness of thecapabilities and advantages of the intermodal transportindustry. A lot of initiatives are taken at the European level,but this section will limit the topic to what is proposed inBelgium, as the case study in Section 4 is concerned with thisparticular country.
Belgium has an extensive transport network to distributecontainers that are arriving to the ports of Antwerp andZeebrugge. The country is composed of two regions,Flanders and Wallonia. In the last decade, the Flemishgovernment introduced various subsidy schemes for con-tainer barge waterways transport. The Walloon governmentfollows this trend as well.
Regarding intermodal rail transport, the Flemish aid (N 566/02) for combined transport provided an annual budget of € 3million for the acquisition of combined transport equipment,transshipment equipment and aid for information systems. Thesubsidy scheme, which expired end of 2003, coveredinvestment costs of the railway operators with the objectiveto offer new combined transport operations, i.e. a new route,new types of traffic or a new contract, to expand existingcombined transport operations or to maintain the capacity ofexisting combined transport operations. A new subsidy (N249/04) is specifically designed to national intermodal railtransport. The Belgian government grants an annual budget of€ 30 million to the intermodal operators, which offer transportservices within Belgium of minimum 51 km. The subsidy iscomposed of a fixed part (20 Euros) and a variable part(maximum 0.40 Euros per kilometre). The objective of the aidscheme, which is extended till end 2008 (N 656/07), is to helpmaintain existing rail traffic levels of 300,000 ITU and toincrease rail traffic by 20% over a period of 3 years.
In order to promote inland navigation, the Flemishgovernment developed a policy measure that stimulates theconstruction of new quay walls coupled with a reduction ofcanal-dues. The public private partnership programme allowsthe co-financing of the construction of quay walls for 80% bythe Flemish government and 20% by the private sector. Thequays stay property of the Flemish government and the privateinvestor guarantees that a fixed tonnage of freight will betransported by inland waterways in the 10 years to come. Theprogramme, which established the support of the EuropeanCommission until 2010 (N 550/01 and N 344/04), realized a66.5% growth in the inland waterways transport over the
previous 5 years. In May 2007, the European Commissionauthorized another Flemish measure to grant a subsidy of 20Euros per container transshipped at a Flemish inland containerterminal from or to an inland waterway vessel (N 682/06).
Similar initiatives are developed in Wallonia. In March2005, the European Commission authorized a Walloonmeasure to grant a subsidy scheme to promote intermodalbarge transport in the Walloon region (N 247/04 and N 4/04).According to the government decision of December 2004, theWalloon government, with the objective of developing regularcontainer services in Wallonia, started to subsidize invest-ments at terminals, for example for transshipment infrastruc-ture. The government decision also aims to modernize thefleet. In addition to the investment aid, a subsidy of 12 Eurosis foreseen for containers that are transshipped at a Wallooninland container terminal from or to an inlandwaterway vessel(OPVN, 2006). Finally, a subsidy of 12 Euros is also appliedfor the terminal in Brussels (N 720/06).
3 Decision support framework for intermodal transport
3.1 General framework
Intermodal transport solutions are becoming increasinglyimportant in Belgium. The growing attention on the intermodaltransport sector from federal and regional governments issupported by academics. Within the DSSITP (DecisionSupport System for Intermodal Transport Policy) project, anassessment framework has been developed using threedifferent models that are capable of assessing policies intendedto enhance the growth of intermodal inland waterway and railtransport. Both combinations have a particularmarket structureand operations, but it is important to analyse them together inorder to take care of potential competition distortions. Theassessment of transport policy measures has been performedon a European scale by Tsamboulas et al. [28]. The authorsfocus on the potential of policy measures to produce a modalshift in favour of intermodal transport. Tan et al. [27] discussa simulation model for a state-wide intermodal freighttransportation network, with the objective to demonstrateinteractions between transport modes under various inter-modal policy changes. A strategic decision support system toplan logistics and distribution activities of manufacturers hasbeen constructed by Moynihan et al. [21]. The DSSITPframework assesses policy measures and planning decisionsrelated to the intermodal transport sector, taking multipleindicators into account. The impact of policy measures aremeasured on all related transport modes and at multipleaggregation levels.
The DSSITP framework, composed by the three coremodels acts as a platform to evaluate intermodal transportpolicies. Interaction between each model enables to achieve
170 Eur. Transp. Res. Rev. (2011) 3:167–178

an integrated approach in transport modelling. An exercisehas been performed to document inputs and outputs of themodels.
Three core models, LAMBIT, SIMBA and NODUSmake up the decision support system for intermodaltransport policy making. The individual models will beshortly presented in the following subsections. Figure 3presents the general assessment framework, in which thethree models are integrated. Due to the combination of thethree models, the analysis of policy measures is performedon multiple levels of aggregation over multiple transportmodes. Each model has its specific purpose and outputs.The multimodal freight model NODUS is situated on thehighest level of aggregation and constitutes the first step inthe analysis of a potential policy measure. The NODUSmodel provides traffic prognoses which serve as inputs forthe LAMBIT model and SIMBA model. The variousoutputs of the assessment framework are also stated in thesame figure. The NODUS model produces aggregatedoutputs (flows) of the various transport modes, such astheir accessibility, environmental impact and share in themodal split. Total costs of an intermodal service aremeasured. In addition, a module was developed forNODUS in order to provide optimal locations of terminals.These optimal locations can be introduced in the LAMBITand SIMBA models. The LAMBIT model is scaled on theBelgian intermodal network. The model analyses thepotential market area of a new terminal and assesses theimpacts on existing terminals. It further produces costcomparison and potential modal shifts. The SIMBA modelis situated on the lowest level of aggregation and producesdetailed output related to the reliability, speed and capacityutilization of the waterway network. With the SIMBAmodel, the impact of volume increases in the network or theintroduction of new intermodal barge terminals can besimulated. Also alternative consolidation strategies may becompared.
In order to demonstrate the capabilities of the generalframework, first the individual transport models will beexplained in the next subsections.
3.2 NODUS
A geographical multimodal transport network is made oflinks like roads, railways or waterways, on which vehiclesmoves; at its nodes, connecting infrastructures like termi-nals or logistics platforms where goods are loaded,unloaded, transhipped or processed in different ways cansometimes be found. To analyse transport operations overthe network, costs or weights must be attached to thesegeographical links over which goods are transported and tothe connecting points where goods are handled. However,most of these infrastructures can be used in different waysand with different costs. For example, ships of differentsizes and operating costs can use the same waterway; at aterminal a truck's load can be transshipped on a train,bundled with some others on a ship or simply unloaded as itreached its destination. Normally, the costs of thesealternative operations should be different, and a simplegeographic network does not provide an adequate basis fordetailed analyses of transports operations where the sameinfrastructure is used in different ways. To solve thisproblem, the basic idea is to create a virtual link with aspecific cost for a particular use of an infrastructure [4, 6].
NODUS is a Geographic Information System (GIS)based software that proposes a methodology and analgorithm which creates in a systematic and quasi-automatic way a complete “virtual network” with all thevirtual links corresponding to the different operations whichare feasible on every real link or node of a geographicnetwork [9, 11]. This permits to apply the methodology toextensive multimodal networks. In this way, a network withmultiple modes and means can be represented by a uniquebut more complex network on which each link correspondsto a unique operation with a specific cost (see also [16]).Applying a shortest path algorithm on such a networkprovides a “route” that corresponds to the chain ofoperations from the loading point to the final destina-tion. This route can very well correspond to anintermodal shipment. Nodus is also able to find out aset of alternative paths between each origin anddestination, making it possible to spread the demandover several modes. A more in-depth discussion of thismethodology can be found in [10].
Once a complete origin–destination demand matrix hasbeen assigned on the network and calibrated, the amount oftons-km carried out by each transportation modes is used tocompute the total emissions. Comparing these emissions fortwo scenarios (without and with an additional terminal)make it possible to evaluate the environmental impact.Fig. 3 DSSITP framework
Eur. Transp. Res. Rev. (2011) 3:167–178 171

3.3 LAMBIT
The Location Analysis Model for Belgian Intermodal Termi-nals (LAMBIT) is based on three main inputs: transportationnetworks (GIS), transport prices and container flows from themunicipalities to and from the port of Antwerp. The GISnetwork has two main tasks. First of all, it visualises the realtransportation network including the terminals. The secondand vital characteristic of the network is its capability inserving as a database to include transport prices.
The transport prices are calculated based on the real marketprice structures for each transport mode and they are associatedwith the network layers. The variable costs are applied to thenetwork layers and the fixed costs are attached to the nodes,which also indicate the origin and destination for each path.
The total price of intermodal transport is composed of thetransshipment cost in the port of Antwerp to a barge or awagon, the cost of the intermodal main haul (barge or rail), thetransshipment cost in the inland terminal to a truck and thecost of final haulage by truck. The total intermodal transportcost is obtained by adding all of these fixed and variable costs.
Using a shortest path algorithm in ArcInfo, varioussimulations are conducted in order to find the shortest pathand the attached transport costs from the port of Antwerp toeach Belgian municipality via intermodal terminals and viaroad only. For each destination, the total transport costs forunimodal road, inland waterways/road and rail/road trans-port are compared and the cheapest option is selected. Themarket areas of each inland terminal are then highlighted onmaps, which help to see how large the market area of eachintermodal terminal is. The market area of a terminal ismeasured by the number of municipalities that are cheaperby intermodal transport. As a further step, the BelgianInstitute for Statistics (ADSEI) data are used to show theamount of containers that are currently transported by roadto the municipalities within the market area, which give anindication of the existing potential volume that can still beshifted from road transport to intermodal transport. This isparticularly useful when a location of a new terminal needsto be analysed.
3.4 SIMBA
The discrete event Simulation model for InterModal BArgetransport (SIMBA) covers the hinterland waterway networkof the port of Antwerp, in order to analyze effects of futurepolicy measures for intermodal barge transport or toanalyze planning decisions of private stakeholders [2, 3].The SIMBA and LAMBIT models are complementary tothe NODUS model, which considers the whole set oforigins and possible destinations on the observed network.SIMBA is also complementary to the LAMBIT model, asthe latter proposes a macro-level approach.
Three interrelated components can be identified in theintermodal hinterland network. The first component in theintermodal freight transport network is the inland waterwaynetwork. From a simulation point of view, the inlandwaterway network is made up of terminals, waterwayconnections and container flows. Entities are defined asbarges which originate from the different inland terminalsand carry containers in round trips to the various ports. Asecond component is the port area of Antwerp. Barges mayvisit sea terminals on the left river bank and right river bank inthe same round trip, go to Rotterdam or Amsterdam via theScheldt-Rhine connection or sail to Zeebrugge via the Scheldtestuary. On the right and left river bank, barges queue forhandling at the sea terminals. Barges moor as soon as enoughquay length is available. The handling time at the sea terminaldepends on the number of containers that need to be unloadedfrom or loaded into the inland vessel. In the inland waterwaynetwork as well as in the port area multiple locks are present.Therefore, lock planning constitutes a third major component.The operation of locks is one of the elements which moststrongly affect waiting times of barges for lockage. A numberof decision rules are defined to make the operations of thelocks in the simulation model reasonably realistic.
To obtain the necessary input data, all intermodal terminalsin the inland waterway network are asked for information toidentify current container flows in the network. Real data onshuttle services is used as an input for the simulationmodel. Foreach shuttle service the following information is required:which type of barge is used, which destinations are visited andwhat is the average number of import and export containers foreach destination. Container transport interacts with other freightflows. Therefore, the flow of non-containerized goods on theinland waterway network is introduced as an input in thesimulation model. These flows affect the waiting times at locks.Information is also necessary on the network connections. Thewaterway administrators (Waterwegen en Zeekanaal nv, nv DeScheepvaart en Gemeentelijk Havenbedrijf Antwerpen) pro-vided information on the number of locks on each waterway,distances between locks, average lockage times, number oflock chambers and size of the chambers. In the port area ofAntwerp three clusters of locks connect the inner port area withthe sea side. Data is required on the choice of locks whensailing in the port area. The average quay length available forhandling inland navigation at sea terminals gives an indicationof the service capacity in the port area of Antwerp. The portauthority provided the average mooring time and time forloading and unloading in order to model service times of inlandcontainer barges in the port area. Service times in the port areainclude the time for mooring at each sea terminal plus thehandling time of all import and export containers.
The SIMBA model produces detailed outputs related tothe functioning of the waterway transport network. Realdata on shuttle services is used as an input for the
172 Eur. Transp. Res. Rev. (2011) 3:167–178

simulation model, constructed in the Arena simulationsoftware. Arena is a simulation package based on queuingtheory. It is designed for modeling discrete event simu-lations. For each shuttle service the following informationis required in the simulation model: which type of barge isused, which destinations are visited and what is the averagenumber of import and export containers for each destina-tion. Container transport interacts with other freight flows.Therefore, the flow of non-containerized goods on theinland waterway network is introduced as an input in thesimulation model. These flows affect the waiting times atlocks. Information is also necessary on the networkconnections. The performance of the network elementswith respect to reliability, speed and capacity utilization ismeasured. Table 1 gives an overview of performancemeasures which are generated by the simulation model.The turnaround time of shuttles is defined as the total timenecessary for a barge to sail from an inland containerterminal to the port area, visit all sea terminals and return tothe inland terminal. The turnaround time depends on thewaiting times at locks and in the port area. The outputsmeasured at locks are the percentage of barges that have towait, the number of barges that have to queue and thewaiting time of barges in the queue. In the port area thewaiting time before handling is measured, as well as thenumber of vessels queueing for service. A final group ofperformance measures concerns the capacity utilization. Inthe port area this is expressed as the average percentage ofquay length occupied. In the hinterland network the averageand maximum number of barges on each network connec-tion is recorded. Other performance measures can be addedto the simulation model when necessary for future analyses.
4 An integrated case study
In the case study presented in this paper, the optimallocation for an additional container terminal along theBelgian waterways is computed and its impact on themarket area and network performances is assessed.
An additional module is developed in NODUS in order toimplement an optimal location algorithm. The theoreticalbackground involved will first be outlined. This will befollowed by a brief description of the digitised network thatwas used. The obtained result (the new optimal location) andits potential impact on the modal shift are then discussed.Once the optimal location determined and the global impact ofits implementation estimated, the second step of this caseanalyses the market area of the identified new terminallocation. This result will be achieved using the LAMBITmodel. Finally, the SIMBA model will be used during a thirdstep in order to estimate the impact of the newly locatedterminal on the performances of the transport system.
4.1 Optimal location of a new terminal using NODUS
4.1.1 Optimal location of a new terminal
One of the possible policy measures to increase freightflows using intermodal transport is the opening of newcontainer terminals on inland waterways or along railconnections. Such a terminal must be well located in orderto reach this goal, which means that it will be chosenfollowing a set of criteria as the geographic distribution offreight flows and their costs for transhipment. To achievethis work, an algorithm using these parameters has beenimplemented in NODUS. It locates new terminals takingthe existing ones into account and considering the terminalsas hubs. It is the p-Hub Median problem (p-HMP) firstformulated by O’Kelly [22]. In the standard multiple-hubnetwork problem (see [23]) for the different problemclasses), three constraints are traditionally identified: it isassumed that all the hubs are connected directly to eachother, that there is no direct connection between non-hubnodes, and that the non-hub nodes are each connected to asingle hub. The inter-hub links consolidate the total flowcoming from the origin hub (or any of its spoke nodes) tothe destination hub (or any of its spoke nodes). The locationof the hubs must be chosen from the set of nodes, N,considered as potential locations. Economies of scale canbe associated with the transportation system between thehubs. The objective is to minimise the total transportationcost. Other problem formulations are available, but this onehas been chosen because it enables to take explicitly intoaccount the costs for pre- and post-haulage by road inaddition to the cost of the main haul, which is an advantagewhen locating terminals in an intermodal context. Theformulation used for the p-HMP is the one by Ernst andKrishnamoorthy [5] that considerably reduces the requiredcomputing time. The objective function of this problemtends to minimise the generalised cost (1) which comprisesthe costs for pre- and post-haulage by road plus the mainhaulage using the waterways (including possible economies
Table 1 Performance measures
Shuttles turnaround time
Locks percentage of barges waiting
number of barges waiting in queue
waiting time of barges in queue
Port area number of barges waiting in queue
waiting time of barges in queue
Capacity utilisation quay length
network connections
Eur. Transp. Res. Rev. (2011) 3:167–178 173

of scale) and the transhipment at the terminals. The problemcan be formulated as:
Inputs
p number of terminals to locatehij flow between origin i and destination jOi total flow from node iDi total flow to node iχ relative cost of pre-haulageα inter-hub discount (0≤α ≤1)δ the relative cost of post-haulageCik unit cost for route between node i and terminal
located at node kCkm unit cost for route between terminals located at nodes
k and mT transhipment cost at terminal
Decision variables
Xik=1 if node i is assigned to the terminal located atnode k 8i; k 2 N0 otherwiseYikm≥0 is the traffic from node i that passes byterminals located at nodes k and m 8i; k;m 2 N
MinimiseX
i2N
X
k2NCik :T :Xikð#Oi þ dDiÞ þ
X
i2N
X
k2N
X
m2NaCkm:Y
ikm ð1Þ
Constraints
X
x2NXkk ¼ p ð1:1Þ
X
k2NXik ¼ 1 8i 2 N ð1:2Þ
Xik � Xkk 8i; k 2 N ð1:3Þ
X
m2NY ikm �
X
m2NY imk ¼ OiXik �
X
j2NhijXjk 8i; j; k;m 2 N
ð1:4Þ
Xij 2 f0; 1g 8i; j 2 N ð1:5Þ
Y ikm � 0 8i; k;m 2 N ð1:6Þ
The algorithm finds p optimal locations in a set ofdetermined potential locations on the network (1.1).Another constraint is that each centroid (aggregated originor destination point of the freight) must be connected to asingle terminal in order to reduce the size of the problem(1.2). In constraint (1.3), a centroid cannot be assigned to aterminal if the latter is not activated as so. Equation 1.4 isthe divergence equation for commodity i at node k in acomplete graph, where the demand and supply at the nodesis determined by the allocations Xik. The latter enables tokeep the flows at the terminals. Constraints (1.5) and (1.6)are standard integrity constraints.
Each (i,j) pair in a p-HMP is analogous to a demandpoint in a p median problem (p-MP) in which the demandnodes are assigned to the nearest facilities. As it may not beideal to assign the demand nodes to their nearest hub, the p-HMP relaxes this constraint.
In the application set up in the framework of the DSSITPproject, 11 existing terminals were taken into accountincluding those located into the ports of Antwerp andZeebrugge. They were added to 50 other potential locations(N=61) on the Belgian inland waterways and then the p-HMP was applied to this case in order to find oneadditional new optimally located terminal. These 50potential new locations were selected homogeneously onthe waterways network. Note that only network connectionswith a gauge at least equal to 1350 T are taken into account.
4.1.2 Network database
A network model able to assess the impact of the additionof a new terminal was developed. We used the origin–destination (OD) matrices for the year 2000, produced byNEA Transport Research and Training. The matrices giveinformation about the type of commodity being transported,classified according to the Standard Goods Classificationfor Transport Statistics/Revised (NST/R chapters). Only thefigures for NST/R Chapter 9, containing the demand forcontainers amongst other manufactured products, are takeninto account in the model. The database contains region-to-region relations at the NUTS2 (Nomenclature of TerritorialUnits for Statistics) level, for the area of the EU25, plusNorway and Switzerland, and at the NUTS5 level forBelgium. The matrix provided by NEA is at the NUTS2level. Therefore, in order to obtain figures at the communal(NUTS5) level for Belgium, an older matrix (1995)available at the NUTS5 level was used to disaggregate thematrix for 2000.
A digital representation of the networks for the differenttransportation modes (roads, railways and inland water-ways) is also needed. The railway and road networks weretaken from the Digital Chart of the World (DCW) andupdated. The DCW is an Environmental Systems Research
174 Eur. Transp. Res. Rev. (2011) 3:167–178

Institute, Inc. product originally developed for the USDefence Mapping Agency (DMA) using DMA data. Theinland waterways network was digitised at the GroupTransport & Mobility (GTM) research lab.
Finally, the borders of the NUTS 2 regions wereprovided by Geophysical Instrument Supply Co (GISCO)and a centroid for each region was located at the centre ofthe most urbanised area of the zone. These centroids aretaken as the origins or destinations for the commodities.The same was done at the NUTS5 level for Belgium.
All these separate layers were finally connected togetherby the creation of “connectors” from each centroid to eachmodal layer. The complete set of layers can be consideredas a geographical graph, comprising about 110,000 edgesand 90,000 vertices.
A validation of the network model, comparing assignedflows and real counts along the networks was performed.The quality of the assignment can be considered assatisfactory, taking into account the fact that the demanddata is nearby 10 years old. However, the methodology isrobust and can be applied easily to newer data, if it wereavailable.
5 Results
An optimal location was found at Roucourt on the Nimy-Blaton-Péronnes canal. Note that a new terminal iscurrently planned in this region, in Vaux. An analysis ofthe changes induced by the opening of such a terminal wasfurther performed. It is indeed possible to estimate theimpact on the modal split, on the total generalisedtransportation cost on the network and on the amount ofcontainers handled at the existing terminals when Roucourtis introduced in the NODUS network model.
The modal share for intermodal transport (Table 2)increases by 2.87% in tons while road-only transportdecreases by 0.07%. Expressed in tons.km, the modal share
increases by 0.78% for waterways, and decreases by 0.02%for road. The total generalised cost on the networkdecreases by 0.05% with the additional terminal. Theamount of containers handled at the terminals increasesfor all the existing terminals except for Avelgem fromwhich Roucourt seems to catch some market area. This isprobably due to their relative close locations on thenetwork. Indeed, Roucourt can serve an area in Hainautthat is normally assigned to Avelgem. The total increase canbe explained by the fact that the new terminal covers a newarea currently not yet exploited by the existing terminals.This new terminal influences the distribution of freightflows in favour of intermodal transport. Even if the relativedifference seems to be weak, it represents several millionsof tons transferred from road to waterways, which can beconsidered as a good evolution towards a sustainabletransport system.
5.1 Market area and potential of the new terminalusing LAMBIT
With the LAMBIT model the market area and potentialvolume of the new intermodal terminal in Roucourt cannow be analysed. The optimal location, which NODUSprovided, is included as an additional inland waterwaysterminal in the LAMBIT model. Figure 4 visualises a smallmarket area for the new terminal, based on the currentmarket prices.
A terminal in Roucourt, takes 3 municipalities that arecurrently served by unimodal road transport. The newterminal in Roucourt is 28 km away from the terminal inAvelgem. The location of new terminal points at a possiblecommon market area problem. Although the terminal inRoucourt is located in proximity with the terminal inAvelgem, it attracts municipalities that are outside themarket area of Avelgem. This situation complements theoutcome of NODUS, which showed that the new terminalinfluences the distribution of freight flows in favour ofintermodal transport.
5.2 Impact on waterways network performanceusing SIMBA
In this subsection, the SIMBA model is applied to analysethe impact of the new intermodal barge terminal inRoucourt on the waterways network. The impact onnetwork characteristics such as average and maximumwaiting times at locks and in the port area can be measured.Potential bottlenecks and necessary capacity investmentsmay also be deducted. The location and volume of a newintermodal barge terminal result from the NODUS andLAMBIT models. The container volume of the newterminal location is derived from the proportional market
Table 2 Impact of Roucourt on the modal split
Mode Relative difference
Tons
Road −0.07%Rail −0.18%Water −0.09%Intermodal +2.87%
Tons.km
Road −0.02%Rail −0.10%Water +0.78%
Generalised cost −0.05%
Eur. Transp. Res. Rev. (2011) 3:167–178 175

area of the new location compared with the current marketarea of existing terminals. The results of NODUS show thatthe terminal of Roucourt will have more or less the samesize as the terminal in Gent and one third of the volume ofAvelgem. A potential volume of 7,000 containers per yearwith the port of Antwerp as origin or destination isassumed. Vessels will sail via the Upper Scheldt to theport area in Antwerp. The Nimy-Blaton-Péronnes canal isnavigable for vessels up to 1350 tons. As the terminalcurrently does not exist, assumptions have to be maderegarding the service schedule offered to customers. Vesselsof size 32 TEU and 66 TEU sail in a roundtrip to the portarea. Three departures are equally distributed in a weeklyschedule. Vessels may visit both clusters of sea terminals onthe right and left river bank in a single roundtrip. As thenew terminal is situated in the southern part of Belgium, ittakes almost a day to sail from the hinterland to the port ofAntwerp. Barges depart in the morning of day one inRoucourt and arrive at sea terminals in the morning of daytwo. No changes are made to the schedules of the existinginland terminals. A separate random-number stream isdedicated to each source of randomness in the model inorder to synchronise the current and new situation as muchas possible.
Performance measures relevant for the comparison of thecurrent and new situation can be calculated. The current andfuture situation are both simulated for a time period of 672 h or28 days. Ten simulation runs, each taking up only a few
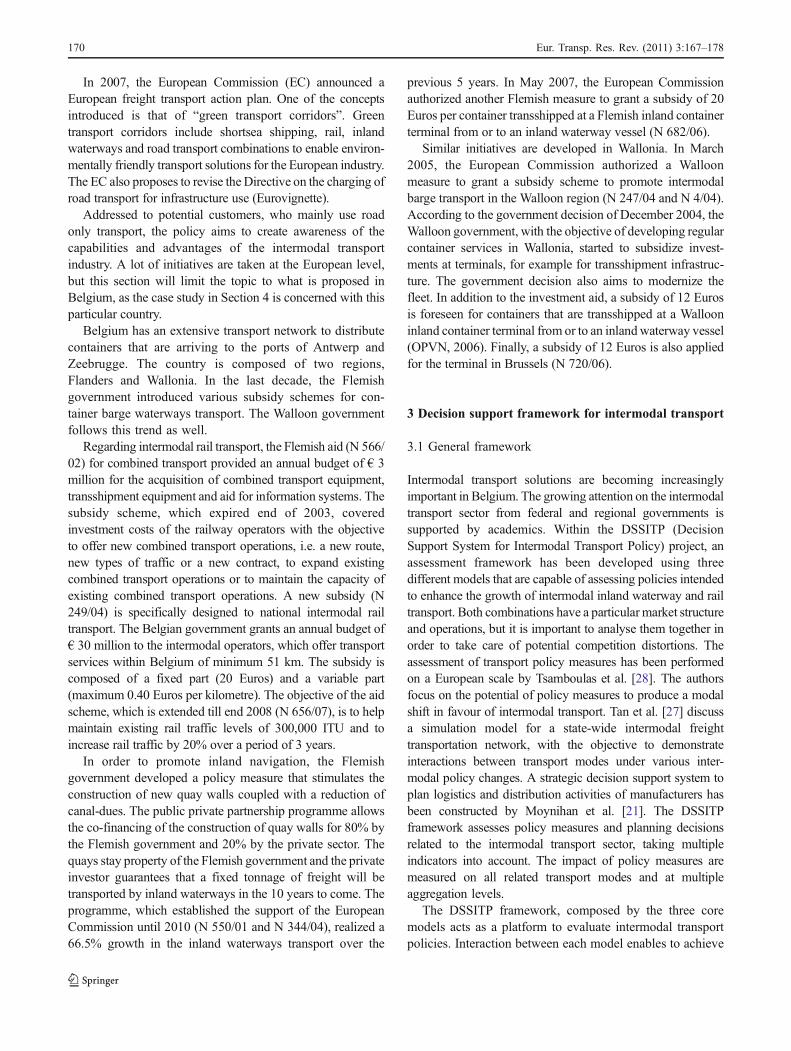
minutes of computation time, are performed to make astatistical comparison between the current and new situation.Table 3 gives the average turnaround times of all inlandterminals, expressed in hours in the current and futuresituation. Inland vessels may only sail to Antwerp (Antw) orthey can make a combined trip to Antwerp and Rotterdam(Rdam) or Amsterdam (Adam). The standard deviation ismentioned between brackets next to the average turnaroundtime. From Table 3 may be concluded that the introductionof a new terminal has no influence on the turnaround timesof existing terminals. Shuttle services offered by the terminalin Roucourt incur a turnaround time of 63.31 h.
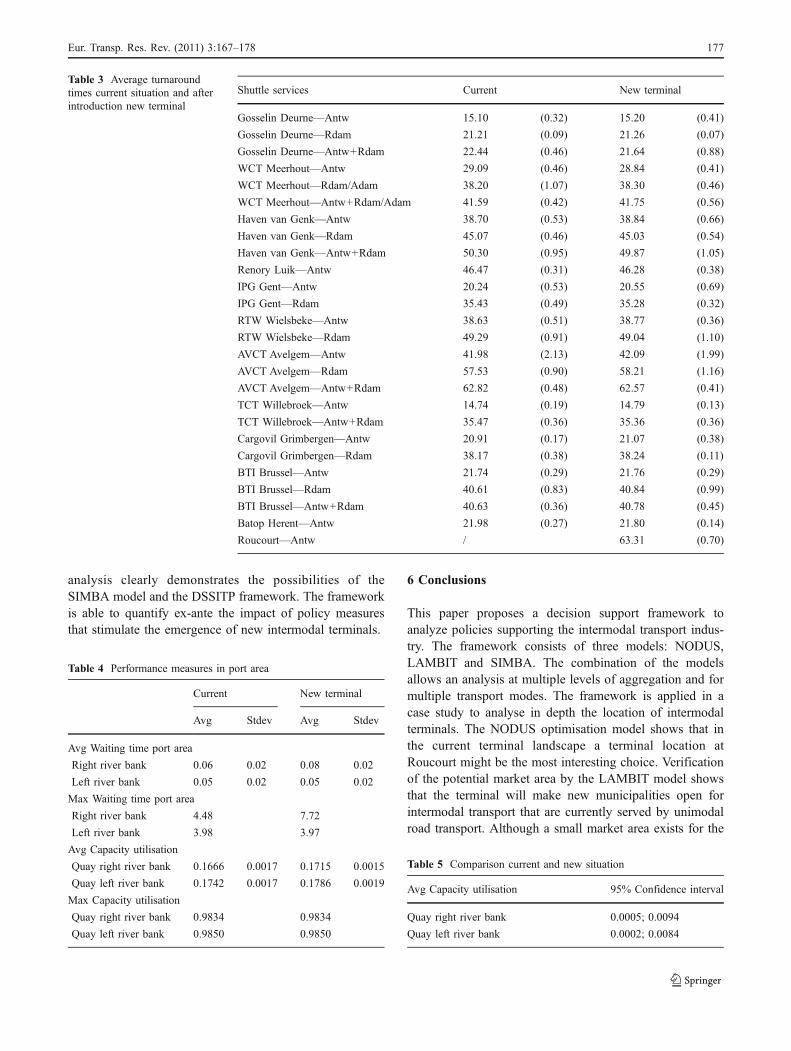
Table 4 summarises performance measures in the portarea. The average and maximum waiting time beforehandling, expressed in hours, are given for the sea terminalson the right and left river bank. Next, the average andmaximum utilisation of the quays on the right and left riverbank are measured.
Paired-t confidence intervals are constructed to comparethe results [13]. Table 5 presents the 95% confidenceintervals for which the difference between the introductionof a new terminal in Roucourt and the current situation issignificant. The average handling time in both clusters ofsea terminals on the left and right river bank increasesslightly due to the introduction of a new terminal in thewaterways network. An increase of 0.5% is only a minoreffect. No large impact is to be expected in light of thesmall market area of the new inland terminal. However, the
Fig. 4 Market area of the newterminal
176 Eur. Transp. Res. Rev. (2011) 3:167–178
analysis clearly demonstrates the possibilities of theSIMBA model and the DSSITP framework. The frameworkis able to quantify ex-ante the impact of policy measuresthat stimulate the emergence of new intermodal terminals.
6 Conclusions
This paper proposes a decision support framework toanalyze policies supporting the intermodal transport indus-try. The framework consists of three models: NODUS,LAMBIT and SIMBA. The combination of the modelsallows an analysis at multiple levels of aggregation and formultiple transport modes. The framework is applied in acase study to analyse in depth the location of intermodalterminals. The NODUS optimisation model shows that inthe current terminal landscape a terminal location atRoucourt might be the most interesting choice. Verificationof the potential market area by the LAMBIT model showsthat the terminal will make new municipalities open forintermodal transport that are currently served by unimodalroad transport. Although a small market area exists for the
Table 3 Average turnaroundtimes current situation and afterintroduction new terminal
Shuttle services Current New terminal
Gosselin Deurne—Antw 15.10 (0.32) 15.20 (0.41)
Gosselin Deurne—Rdam 21.21 (0.09) 21.26 (0.07)
Gosselin Deurne—Antw+Rdam 22.44 (0.46) 21.64 (0.88)
WCT Meerhout—Antw 29.09 (0.46) 28.84 (0.41)
WCT Meerhout—Rdam/Adam 38.20 (1.07) 38.30 (0.46)
WCT Meerhout—Antw+Rdam/Adam 41.59 (0.42) 41.75 (0.56)
Haven van Genk—Antw 38.70 (0.53) 38.84 (0.66)
Haven van Genk—Rdam 45.07 (0.46) 45.03 (0.54)
Haven van Genk—Antw+Rdam 50.30 (0.95) 49.87 (1.05)
Renory Luik—Antw 46.47 (0.31) 46.28 (0.38)
IPG Gent—Antw 20.24 (0.53) 20.55 (0.69)
IPG Gent—Rdam 35.43 (0.49) 35.28 (0.32)
RTW Wielsbeke—Antw 38.63 (0.51) 38.77 (0.36)
RTW Wielsbeke—Rdam 49.29 (0.91) 49.04 (1.10)
AVCT Avelgem—Antw 41.98 (2.13) 42.09 (1.99)
AVCT Avelgem—Rdam 57.53 (0.90) 58.21 (1.16)
AVCT Avelgem—Antw+Rdam 62.82 (0.48) 62.57 (0.41)
TCT Willebroek—Antw 14.74 (0.19) 14.79 (0.13)
TCT Willebroek—Antw+Rdam 35.47 (0.36) 35.36 (0.36)
Cargovil Grimbergen—Antw 20.91 (0.17) 21.07 (0.38)
Cargovil Grimbergen—Rdam 38.17 (0.38) 38.24 (0.11)
BTI Brussel—Antw 21.74 (0.29) 21.76 (0.29)
BTI Brussel—Rdam 40.61 (0.83) 40.84 (0.99)
BTI Brussel—Antw+Rdam 40.63 (0.36) 40.78 (0.45)
Batop Herent—Antw 21.98 (0.27) 21.80 (0.14)
Roucourt—Antw / 63.31 (0.70)
Table 4 Performance measures in port area
Current New terminal
Avg Stdev Avg Stdev
Avg Waiting time port area
Right river bank 0.06 0.02 0.08 0.02
Left river bank 0.05 0.02 0.05 0.02
Max Waiting time port area
Right river bank 4.48 7.72
Left river bank 3.98 3.97
Avg Capacity utilisation
Quay right river bank 0.1666 0.0017 0.1715 0.0015
Quay left river bank 0.1742 0.0017 0.1786 0.0019
Max Capacity utilisation
Quay right river bank 0.9834 0.9834
Quay left river bank 0.9850 0.9850
Table 5 Comparison current and new situation
Avg Capacity utilisation 95% Confidence interval
Quay right river bank 0.0005; 0.0094
Quay left river bank 0.0002; 0.0084
Eur. Transp. Res. Rev. (2011) 3:167–178 177

new terminal, it complements a market for intermodaltransport together with the terminal in Avelgem. TheSIMBA model shows that the introduction of a newterminal has no influence on the turnaround times ofexisting terminals. The average handling time at seaterminals in the port area increases only slightly due tothe introduction of a new terminal in the waterwaysnetwork. The case study demonstrates the possibilities ofthe framework for supporting the decision makers inintermodal freight transport sector. The methodology canalso be applied to other policy measures such as subsidies,internalisation of external costs and intermodal network.
Acknowledgement We thank the Belgian Science Policy (BELSPO)for their support on our research project DSSITP (Decision SupportSystem for Intermodal Transport Policy) in the research programme"Science for a Sustainable Development—call 2", under contractnumber SD/TM/08A.
Open Access This article is distributed under the terms of theCreative Commons Attribution License which permits any use,distribution and reproduction in any medium, provided the originalauthor(s) and source are credited.
References
1. Caris A, Macharis C, Janssens GK (2008) Planning problems inintermodal freight transport: accomplishments and prospects.Transport Plann Tech 31(3):277–302
2. Caris A, Macharis C, Janssens GK (2011) Network analysis ofcontainer barge transport in the port of Antwerp by means ofsimulation. J Transport Geogr 19(1):125–133
3. Caris A, Janssens GK, Macharis C (2009) Modelling ComplexIntermodal Freight Flows. In: Aziz-Alaoui MA, Bertelle C (eds)Understanding complex systems series: from system complexityto emergent properties. Springer, Berlin, pp 291–300
4. Crainic TG, Florian M, Guélat J, Spiess H (1990) Strategicplanning of freight transportation: stan, an interactive graphicsystem. Transport Res Rec 1283:97–124
5. Ernst AT, Krishnamoorthy M (1996) Efficient algorithms for theuncapacitated single allocation p-hub median problem. LocationScience 4(3):139–154
6. Harker PT (1987) Predicting intercity freight flows. VNU, Utrecht7. INFRAS/IWW (2004) External costs of transport: update study.
INFRAS/IWW, Zürich8. Int Panis L, Mayeres I (2006) Externe kosten van person-
envervoer. In: M. Despontin and C. Macharis (eds.), Mobiliteiten (groot)stedenbeleid. 27ste Vlaams Wetenschappelijk Econo-misch congres, 19 and 20 October 2006, Brussels, 417-446
9. Jourquin B, Beuthe M (1996) Transportation policy analysis witha geographic information system: the virtual network of freighttransportation in Europe. Transport Res C 4(6):359–371
10. Jonkeren O, Jourquin B, Rietveld P (2009) Modal-split effects ofclimate change: the effect of low water levels on the competitiveposition of inland waterway transport in the river Rhine area,
Transportation Research A, doi:10.1016/j.tra.2009.01.004, Avail-able online 28 February 2009
11. Jourquin B (1995) Un outil d'analyse économique des transportsde marchandises sur des réseaux multi-modaux et multi-produits:Le réseau virtuel, concepts, méthodes et applications. PhD thesis,Facultés Universitaires Catholiques de Mons
12. Kreutzberger E, Macharis C, Woxenius J (2006) Intermodalversus unimodal road freight transport—a review of comparisonsof the external costs. In: Jourquin B, Rietveld P, Westin K (eds)Transportation economics—towards better performing transportnetworks. Routledge, New York
13. Law AM (2007) Simulation modeling & analysis: Fourth edition,McGraw Hill
14. Liao CH, Tseng P-H, Lu C-S (2009) Comparing carbon dioxideemissions of trucking and intermodal container transport inTaiwan. Transport Res D Transport Environ 14(7):493–496
15. Liao C-H, Tseng P-H, Cullinane K, Lu C-S (2010) The impact ofan emerging port on the carbon dioxide emissions of inlandcontainer transport. Energ Pol 38(9):5251–5257
16. Limbourg S, Jourquin B (2009) Optimal rail-road containerterminal locations on the European network. Transport Res E45:551–563
17. Litman T (2011) Well measured. Developing indicators forcomprehensive and sustainable transport planning. VictoriaTransport Policy Institute
18. Macharis C, Bontekoning YM (2004) Opportunities for OR inintermodal freight transport research: a review. Eur J Oper Res153:400–416
19. Maibach M, Schreyer C, Sutter D (INFRAS), Van Essen HP,Boon BH, Smokers R, Schroten A (CE Delft), Doll C (FraunhoferGesellschaft-ISI), Pawlowska B, Bak M (University of Gdansk)(2008) Handbook on estimation of external cost in the transportsector. Internalisation Measures and Policies for All external Costof Transport (IMPACT), Version 1.1., European Commission DGTREN, Delft, CE, The Netherlands
20. Mihic S, Golusin M, Mihajlovic M (2011) Policy and promotionof sustainable inland waterway transport in Europe—DanubeRiver. Renew Sustain Energy Rev 15(4):1801–1809
21. Moynihan GP, Raj PS, Sterling JU, Nichols WG (1995)Decision support system for strategic logistics planning.Comput Ind 26:75–84
22. O’Kelly M (1987) A quadratic integer program for the location ofinteraction hub facilities. Eur J Oper Res 32:393–404
23. O’Kelly M, Miller H (1994) The hub network design problem: areview and synthesis. J Transport Geogr 2(1):31–40
24. Pekin E (2010) Intermodal transport policy: a GIS-basedintermodal transport policy evaluation model. PhD Thesis.Brussels. VUB
25. Planco Consulting GmbH (2007) Economical and ecological compar-ison of transport modes: road, railways, inland waterways. Summaryof findings. Study prepared on behalf of the Federal GermanWater andShipping Administration represented by the Water and ShippingDirectorate East, November 2007, Essen, Germany, p 39
26. Rassafi AA, Vaziri M (2005) Sustainable transport indicators:definition and integration. Int J Environ Sci Tech 21:83–96
27. Tan A, Bowden R, Zhang Y (2004) Virtual simulation of statewideintermodal freight traffic. Transport Res Rec 1873:53–63
28. Tsamboulas D, Vrenken H, Lekka AM (2007) Assessment oftransport policy potential for intermodal mode shift on a Europeanscale. Transport Res A 41(8):715–733
29. Weinreich et al (1998) External quality valuation. contribution tothe final report of the QUITS project, Mannheim
178 Eur. Transp. Res. Rev. (2011) 3:167–178