measuring logistics performance in intermodal freight … · *imt *imt measuring logistics...
TRANSCRIPT

*IMT *IMT
Measuring logistics performance in intermodal freight transport corridors:
An integrated decision analysis framework
Miguel Gastón Cedillo-Campos; Giovanni Lizarraga-Lizarraga; Carlos Martner Peyrelongue
2014
MEXICAN INSTITUTE OF TRANSPORTATION UNIVERSIDAD AUTÓNOMA DE NUEVO LEÓN [email protected]
I-TED 2014 International Transportation Economic Development Conference
April 9-11, 2014, Dallas, Texas, U.S.A.

*IMT
Competitive advantage of intermodal logistics compared to over-the-road logistics is not only based on cost, but also on added services allowing postponement practices. However, the increase of product variety, and multiple interfaces needed to deliver products have raised their vulnerability to variability and at the same time, added costs related to the use of logistics platforms. In manufacturing industries, variability not only affects the desired service level of the product availability, but also the total landed cost. In front of challenges rising by just-in-time systems used by competitive manufacturing clusters located in the NAFTA (North American Free Trade Agreement) corridors, a systemic analytic tool for improving the use of intermodal freight transport in small and medium enterprises (SME) was designed. Consequently, the paper, from an emerging markets approach, proposes an integrated decision analysis framework calibrating the impact of specific improvements on logistics performance (time, cost, and reliability of lead times) to compare different intermodal freight corridors when a SME is selecting the best path to transport their products.
2 ABSTRACT
[email protected] © 2014 *GC

*IMT
AGENDA
1. Background 2. Objectives 3. Methodology 4. Analysis and findings 5. Conclusions and future research
3
© 2014 *GC

*IMT
BACKGROUND
A “reverse globalization” is today a reality as firms back off from low-cost countries to North American region for sourcing and manufacturing requirements. As Ghemawat (2005) argues there are today two crucial truths:
1. Geographic and other regional distinctions are increasing in significance;
2. Regionally focused strategies, used in conjunction with local and global initiatives, can significantly boost a company's performance.
4
© 2014 *GC

*IMT
An archipelago economy or in network
BACKGROUND 5
© 2014 *GC
Manuel Castells
Pierre Veltz
Michel Savy
Jean-Paul Rodrigue
Yossef Sheffi

*IMT
SUPPLY CHAIN CLUSTERING 6
© 2014 *GC
Cluster n
Cluster n+1
Cluster n-1
Supply Chain
Region n+1 Region n Region n-1

*IMT
SUPPLY CHAIN CLUSTERING 7
© 2014 *GC © 2010 Gastón Cedillo
IndustrialCluster
AutomotiveSupply Chains
InformaticsSupply Chains
Financial ServicesSupply Chains
AerospaceSupply Chains
Technology Servicesfor Supply Chains

© 2014 *GC
Supply Chain Clustering HUB
Supply Chain Clustering HUB
SUPPLY CHAIN CLUSTERING HUBS
Logistics Platform Logistics
Platform Supply Chain
Hub
© 2014 *GC
EE.UU.
Belice
Guatemala
Honduras
El Salvador
Eje estructurante nacional consolidado
Eje estructurante nacional a consolidar
LEYENDA
Ciudades principales
Nodos logísticos secundarios
Nodos logísticos principales
Relaciones logísticas
Corredores logísticos consolidados primer niv el
Corredores logísticos consolidados segundo niv el
Corredores logísticos en proceso de consolidación
Corredores logísticos a consolidar
TijuanaMexicali
Ensenada
S. Luis Río Colorado
Nogales
La Paz
Cabo San Lucas
Hermosillo
GuaymasCd. Obregón
Navojoa
ChihuahuaCuauhtémoc
Culiacán
Guasave
Mazatlán
Durango
Tepic
Puerto Vallarta
Colima
Guadalaj ara
Cd de México
Zacatecas
Aguascalientes
S. Luis PotosíCiudad Vallés
Ciudad Victoria
Monterrey
Nuevo LaredoMonclova
Piedras Negras
Ciudad Acuña
Torreón
Cd. Juárez
Saltillo
Reynosa
Matamoros
Tampico
Uruapan
Zamora
Lázaro CárdenasAcapulco
ChilpancingoOaxaca
TehuacánTuxtepec
Salina Cruz
Veracruz
S. Andrés Tuxtla
Tuxtla Gutiérrez
Tapachula
Campeche
Mérida
Cancún
Playa del Carmen
ChetumalCuernavacaPuebla
Poza Rica
Tuxpam
Morelia
Toluca
QuerétaroGuanajuato
Silao
XalapaTlaxcala
Altamira
Los Ángeles
HoustonSan Antonio
Tucson
Phoenix
Corpus Christi
Coatzacoalcos
Ahome
Ojinaga
Progreso
Minatitlán
Ocosingo
Gómez Palacio
El Porvenir
Celaya
León
Fresnillo
Irapuato
Salamanca
San Juan del Río
Pachuca
Cd del Carmen
Huimanguillo
Papantla
Reforma
San Cristóbal de las Casas
Villahermosa
Córdoba
Topolobampo
Manzanillo
Ciudad Hidalgo
El Ceibo
Arrriaga
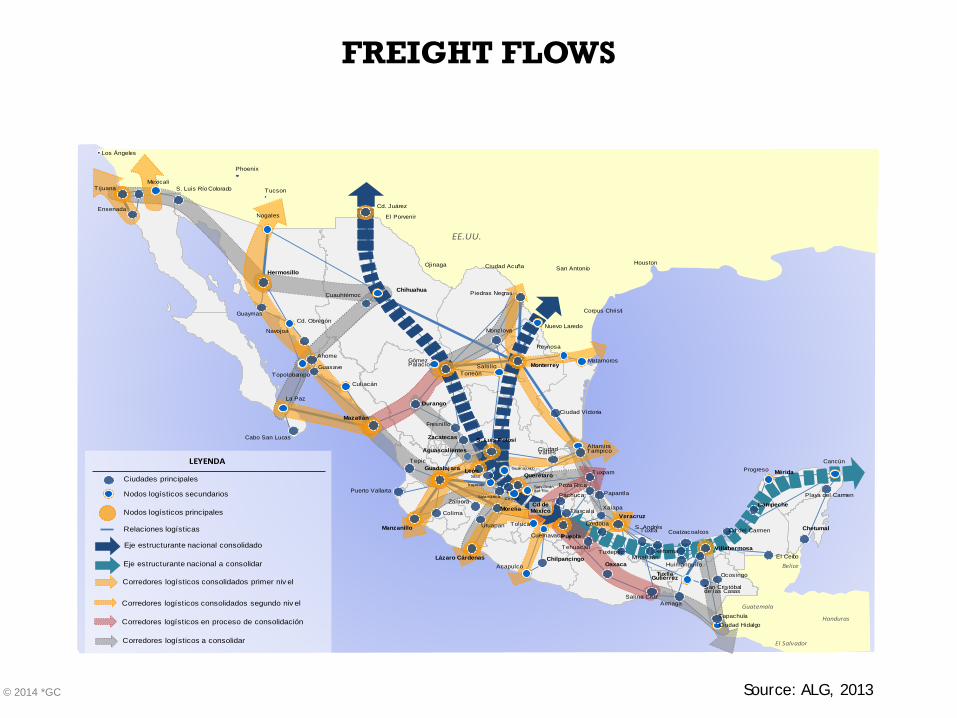
FREIGHT FLOWS
Source: ALG, 2013

EE.UU.
Belice
Guatemala
Honduras
El Salvador
TijuanaMexicali
Ensenada
S. Luis Río Colorado
Nogales
La Paz
Cabo San Lucas
Hermosillo
GuaymasCd. Obregón
Navojoa
ChihuahuaCuauhtémoc
Culiacán
Guasave
Mazatlán
Durango
Tepic
Puerto Vallarta
Colima
Guadalajara
Cd de México
Zacatecas
Aguascalientes
S. Luis Potosí
Ciudad Vallés
Ciudad Victoria
Monterrey
Nuevo LaredoMonclova
Piedras Negras
Ciudad Acuña
Torreón
Cd. Juárez
Saltillo
Reynosa
Matamoros
Tampico
Uruapan
Zamora
Lázaro CárdenasAcapulco
ChilpancingoOaxaca
TehuacánTuxtepec
Salina Cruz
Veracruz
S. Andrés Tuxtla
Tuxtla Gutiérrez
Tapachula
Campeche
Mérida
Cancún
Playa del Carmen
ChetumalCuernavaca Puebla
Poza Rica
Tuxpam
Morelia
Toluca
QuerétaroGuanajuato
Silao
XalapaTlaxcala
Altamira
HoustonSan Antonio
Tucson
Phoenix
Corpus Christi
Coatzacoalcos
Ahome
Ojinaga
Progreso
Minatitlán
Ocosingo
Gómez Palacio
El Porvenir
Celaya
León
Fresnillo
Irapuato
Salamanca
San Juan del Río
Pachuca
Cd del Carmen
Huimanguillo
Papantla
Reforma
San Cristóbal de las Casas
Villahermosa
Córdoba
Topolobampo
Manzanillo
Ciudad Hidalgo
El Ceibo
Arriaga
LEYENDA
Ciudades principales
Nodos logísticos secundarios
Nodos logísticos principales
Relaciones logísticas consolidadas
© 2014 *GC
LOGISTICS HUBS
Source: ALG, 2013

EE.UU.
Belice
Guatemala
Honduras
El Salvador
LEYENDA
Macroámbitos funcionales
Ciudades principales
Nodos logísticos secundarios
Nodos logísticos principales
Relaciones logísticas consolidadas
TijuanaMexicali
Ensenada
S. Luis Río Colorado
Nogales
La Paz
Cabo San Lucas
Hermosillo
GuaymasCd. Obregón
Navojoa
ChihuahuaCuauhtémoc
Culiacán
Guasave
Mazatlán
Durango
Tepic
Puerto Vallarta
Colima
Guadalajara
Cd de México
Zacatecas
Aguascalientes
S. Luis PotosíCiudad Vallés
Ciudad Victoria
Monterrey
Nuevo LaredoMonclova
Piedras Negras
Ciudad Acuña
Torreón
Cd. Juárez
Saltillo
Reynosa
Matamoros
Tampico
Uruapan
Zamora
Lázaro CárdenasAcapulco
ChilpancingoOaxaca
TehuacánTuxtepec
Salina Cruz
Veracruz
S. Andrés Tuxtla
Tuxtla Gutiérrez
Tapachula
Campeche
Mérida
Cancún
Playa del Carmen
ChetumalCuernavacaPuebla
Poza Rica
Tuxpam
Morelia
Toluca
QuerétaroGuanajuato
Silao
XalapaTlaxcala
Altamira
HoustonSan Antonio
Tucson
Phoenix
Corpus Christi
Coatzacoalcos
Ahome
Ojinaga
Progreso
Minatitlán
Ocosingo
Gómez Palacio
El Porvenir
Celaya
León
Fresnillo
Irapuato
Salamanca
San Juan del Río
Pachuca
Cd del Carmen
Huimanguillo
Papantla
Reforma
San Cristóbal de las Casas
Villahermosa
Córdoba
Topolobampo
Manzanillo
Ciudad Hidalgo
El Ceibo
Arrriaga
© 2014 *GC
LOGISTICS HINTERLANDS
Source: ALG, 2013

*IMT
OBJECTIVES • To Identify the processes involved when Mexican export-
oriented small or medium enterprises (SME) are selecting the best intermodal path to transport their products;
• To propose a quantitative model to compare different intermodal freight corridors;
• To analyze the impact of specific improvements on logistics performance (time, cost, and reliability of lead times);
• To provide insights for improving logistics performance in SME based on an emerging markets approach.
1 2
© 2014 *GC

*IMT
1 3
© 2014 *GC
AUTOMOTIVE ASSEMBLY PLANTS

*IMT
1 4
© 2014 *GC
World wide producer of light vehicles (2.55 million units)
8th
5th
World wide producer of commercial vehicles (136,678 units) 2
World´s largest vehicle producer (2.69 million units) 1
19 of the top leading automakers are located in 15 states of Mexico.
The automotive industry in Mexico represents:
6th
8th
6th Exporter of light vehicles (2.14 million units) 1
Exporter of commercial vehicles* (95,175 units) 2
Occupied workers4: 68,895
States with automotive production
1 Source AMIA 2 Source: OICA 3 Source: Ministry of Economics 4 Source: INEGI 5 Source: Business Monitor International *Estimated
6% of the Foreign Direct Investment 6
4% of the National GDP 7
20% of the manufacturing GDP 7
23% of total exportations 8

*IMT
KEY PROBLEM
1 5
© 2014 *GC
18 days
12 days
4 days
27 APPRI’s 12 FTA’s 6 ACE’s

*IMT
KEY PROBLEM
1 6
© 2014 *GC
Clúster n+1

*IMT
KEY PROBLEM
1 7
© 2014 *GC
A B
rs
lrd
Logistics Hub “A” Logistics Hub “B”
Intermediatelogistics platforms
i
Based on: Cheng, 2012

*IMT
RELATIONSHIP BETWEEN TRANSPORT COST AND DISTANCE 1 8
© 2014 *GC
Assumption
l1 l2
L iz
Unimodal
Intermodal

*IMT
METHODOLOGY 1 9
© 2014 *GC
Analysis & Conclusions
Problem Identification
KPI’s Identification
Mapping Process
Scenarios based on a mathematical model
(quantitative approach)
Operations context = Systems point of view
Key data = ƒ (Lead time, reliability, cost)
Field Work + Literature = Abductive approach
Modeling = Quantitative approach
¹ Changrui Ren and Jin Dong, “Linking strategic objectives to operations: Towards a more effective supply chain decision making”. Winter Simulation Conference (2006), pp1422-1430.
1
2
3
4 Analysis = Quanti & Quali approach
*IMT
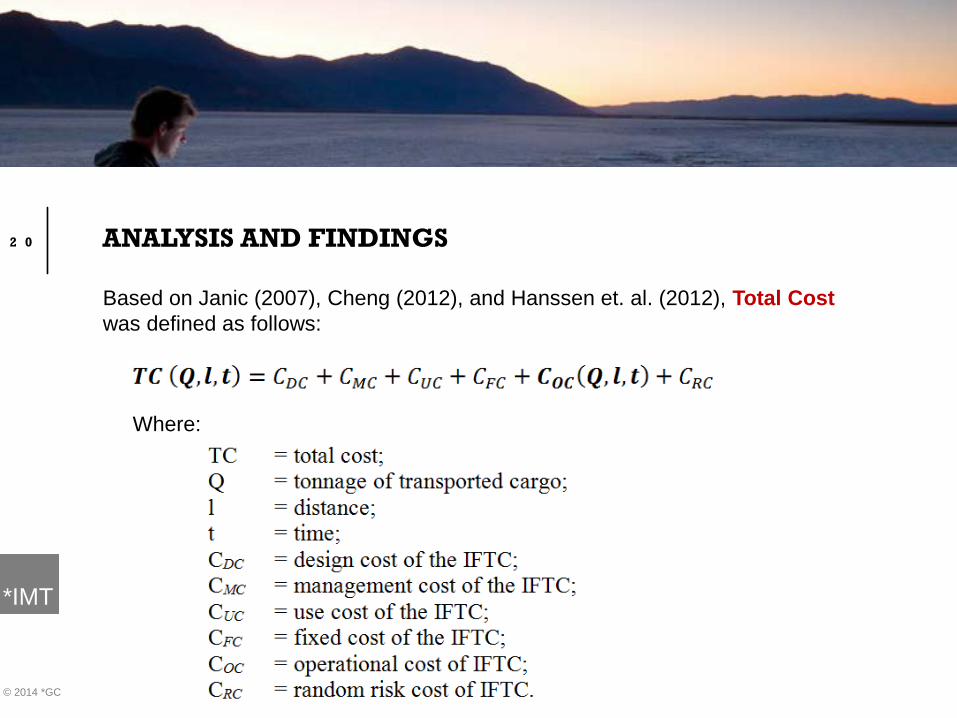
ANALYSIS AND FINDINGS
Based on Janic (2007), Cheng (2012), and Hanssen et. al. (2012), Total Cost was defined as follows: Where:
2 0
© 2014 *GC
*IMT
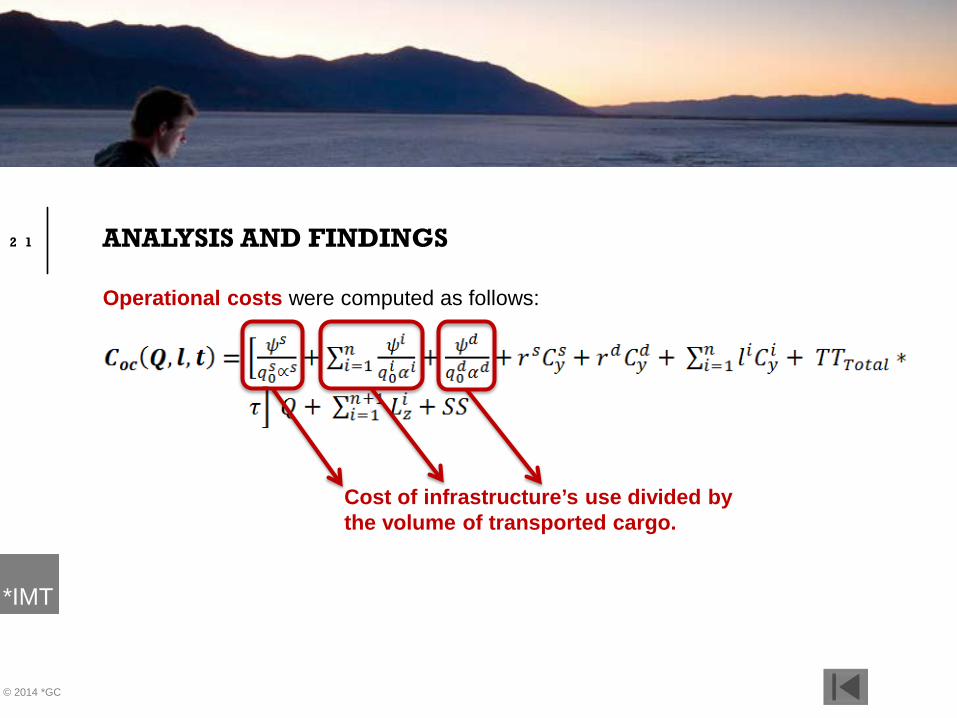
ANALYSIS AND FINDINGS
Operational costs were computed as follows:
2 1
© 2014 *GC
Cost of infrastructure’s use divided by the volume of transported cargo.

*IMT
ANALYSIS AND FINDINGS
Operational costs were computed as follows:
2 2
© 2014 *GC
Hinterland for each region multiplied by the transportation cost for each vehicle used.

*IMT
ANALYSIS AND FINDINGS
Operational costs were computed as follows:
2 3
© 2014 *GC
Average transit time multiplied by the cost value of the time.
VARIABILITY.

*IMT
ANALYSIS AND FINDINGS
Operational costs were computed as follows:
2 4
© 2014 *GC
Tonnage of transported cargo.
VARIABILITY.
*IMT
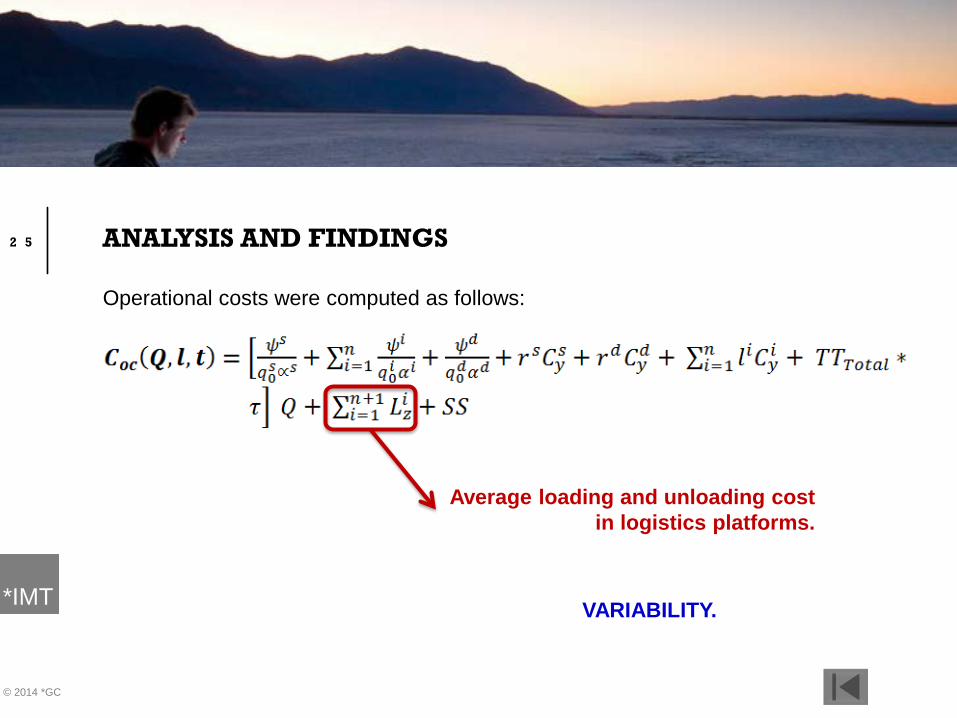
ANALYSIS AND FINDINGS
Operational costs were computed as follows:
2 5
© 2014 *GC
Average loading and unloading cost in logistics platforms.
VARIABILITY.

*IMT
ANALYSIS AND FINDINGS
Operational costs were computed as follows:
2 6
© 2014 *GC
Safety stock
VARIABILITY.

*IMT
ANALYSIS AND FINDINGS
The logistics platform costs are related to the process followed by the freight that this infrastructure uses :
2 7
© 2014 *GC

*IMT
ANALYSIS AND FINDINGS
The logistics platform costs are a critical element when defining a transport path, since it influences the costs slope and consequently, the total cost of a defined path.
2 8
© 2014 *GC
l1 l2
L iz
Unimodal
Intermodal

*IMT
ANALYSIS AND FINDINGS
Logistics platform costs were computed as follows: Where:
2 9
© 2014 *GC

*IMT
ANALYSIS AND FINDINGS
Based on Richarson (2004), handling costs were understood as “the total number of touch points”. Thus, touch points represent the effort needed to unload from a vehicle, sort, store, and load freight to another vehicle. They were computed as follows:: Where:
3 0
© 2014 *GC

*IMT
ANALYSIS AND FINDINGS
Handling cost were computed as follows:
3 1
© 2014 *GC
Cost of handle every ton in a vehicle multiplied by the number of vehicles needed to transport all the cargo

*IMT
Storage cost. The freight can be stored in the logistics platform during ten days without cost. After this period of time, an extra cost per day is charged and is calculated as follows: Where:
ANALYSIS AND FINDINGS 3 2
© 2014 *GC
0

*IMT
In-house transport costs are related to the movement of transported units inside the different logistics platform’s areas. The cost is computed as follows: Where:
ANALYSIS AND FINDINGS 3 3
© 2014 *GC

*IMT
Consolidation costs represent the effort to integrate the transported units (pallets, box, etc.) into another vehicle. The consolidation cost is computed as follows: Where:
ANALYSIS AND FINDINGS 3 4
© 2014 *GC

*IMT
Damage costs are related to the percentage of loss derived of damage caused to the freight all along the different processes as unloading, storage, in-house transport, and loading inside the logistics platform. The damage costs are calculated as follows: Where:
ANALYSIS AND FINDINGS 3 5
© 2014 *GC

*IMT
Variability. It is generally accepted that reducing the variability of the lead time can offer significant benefits to process efficiency.
According to Germain et al. (2008) supply chain variability can be defined as the level of variation in the flow of goods into and out of the industrial cluster.
ANALYSIS AND FINDINGS 3 6
© 2014 *GC

*IMT
Transit time (TT) from a variability approach can be solved as follows: Where:
ANALYSIS AND FINDINGS 3 7
© 2014 *GC
Variability

*IMT
Transit time (TT) from a variability approach can be solved as follows:
ANALYSIS AND FINDINGS 3 8
© 2014 *GC
Variability factor in every section
Utilization factor
Time

*IMT
Safety stock is calculated as follows, taking into account the times of standard deviation of average daily demand during transit time (𝜎𝐷𝐷𝐷𝐷) : Where:
ANALYSIS AND FINDINGS 3 9
© 2014 *GC

*IMT
The 𝜎𝐷𝐷𝐷𝐷 can be calculated based on Fetter and Dalleck (1961) as follows:: Where:
ANALYSIS AND FINDINGS 4 0
© 2014 *GC

*IMT
NUMERICAL EXAMPLE 4 1
© 2014 *GC
¿$?

*IMT
NUMERICAL EXAMPLE 4 2
© 2014 *GC

*IMT
NUMERICAL EXAMPLE
Best Case
4 3
© 2014 *GC US$ 95,274 US$ 95,121
3,524.00
16,647.82
22,813.58
5,516.79
46,771.92
Route 1
BASIC COSTS
OPERATIVECOSTS
LOGISTICSPLATFORMCOSTSTRANSIT TIMEVARIABILITY
3,128.00 16,577.57
27,232.85
3,823.80
44,359.38
Route 2
BASIC COSTS
OPERATIVECOSTS
LOGISTICSPLATFORMCOSTSTRANSIT TIMEVARIABILITY
Almost equal cost

*IMT
NUMERICAL EXAMPLE 4 4
© 2014 *GC
¿$?

*IMT
NUMERICAL EXAMPLE
Worst Case
4 5
© 2014 *GC US$ 95,274 US$ 153,121
Time spent in the port’s backyard Is critical
3,524.00
16,647.82
22,813.58
5,516.79
46,771.92
Route 1
BASIC COSTS
OPERATIVECOSTS
LOGISTICSPLATFORMCOSTSTRANSIT TIMEVARIABILITY
3,128.00 16,577.57
37,232.85
51,823.80
44,359.38
Route 2
BASIC COSTS
OPERATIVECOSTS
LOGISTICSPLATFORMCOSTSTRANSIT TIMEVARIABILITY

*IMT
CONCLUSIONS
Contribution • An easy and friendly-user method to get an optimal transport path
when using intermodal transport;
• A flexible and custom-made tool;
• A solution which takes into account variability of time along the intermodal corridors which is a key element when designing inventory policies;
4 6
© 2014 *GC

*IMT
CONCLUSIONS
Key issues • Supply chain visibility in export-oriented SME (cost,
processes, practices, etc); • Trade facilitation and risk assessment; • Supply chain clustering identification.
4 7
© 2014 *GC

*IMT
CONCLUSIONS
Future research • Supply chain visibility. Designing a social networking service
among export-oriented companies which, for example, share interests, activities or backgrounds to improve trust and potentially establish a “NAFTA Security Certification” in collaboration with programs as C-TPAT, NEEC, and PIP;
• Trade facilitation and risk assessment. Developing a risk self assessment tool for SME which could take into account risk costs;
• Supply chain clustering approach. Providing insights about the advantages as a result of consolidation of supply chains along the National System of Logistics Platforms in Mexico.
4 8
© 2014 *GC

*IMT *IMT MEXICAN INSTITUTE OF TRANSPORTATION UNIVERSIDAD AUTÓNOMA DE NUEVO LEÓN [email protected]
http://www.imt.mx