world population and its effects, especially global warming climate change and global warming the...
TRANSCRIPT
World population and its effects, especially global warming
Climate change and global warming
• The causes and the evidence• Effects on the environment – droughts, floods• Biological effects on plants and animals
• Effects on humans – sea level rise, water supply, fires, diseases• More effects on humans – agriculture, migrations, wars and territorial conflicts• Societal responses to climate change – limits and adaptation
Human population expansion
• How many is too many?• The effects of increased populations – “human ecology”

Human population expansion
Suggested reading in Minkoff and Bakerpp 282-295, 319-321.
The present situation:
On April 8, 2008 the current world population was estimated to be just over 6.8 billion
(US Census Bureau World POPClock; http://www.ibiblio.org/lunarbin/worldpop)
How did we get here?

World population has exploded very recently.

For early years, it’s easier to see changes in growth rate on a semilog plot.
agricultural phase
industrial phase

Focusing on just the last few decades shows the recent increases more clearly. We are adding another billion people about every 13 years!

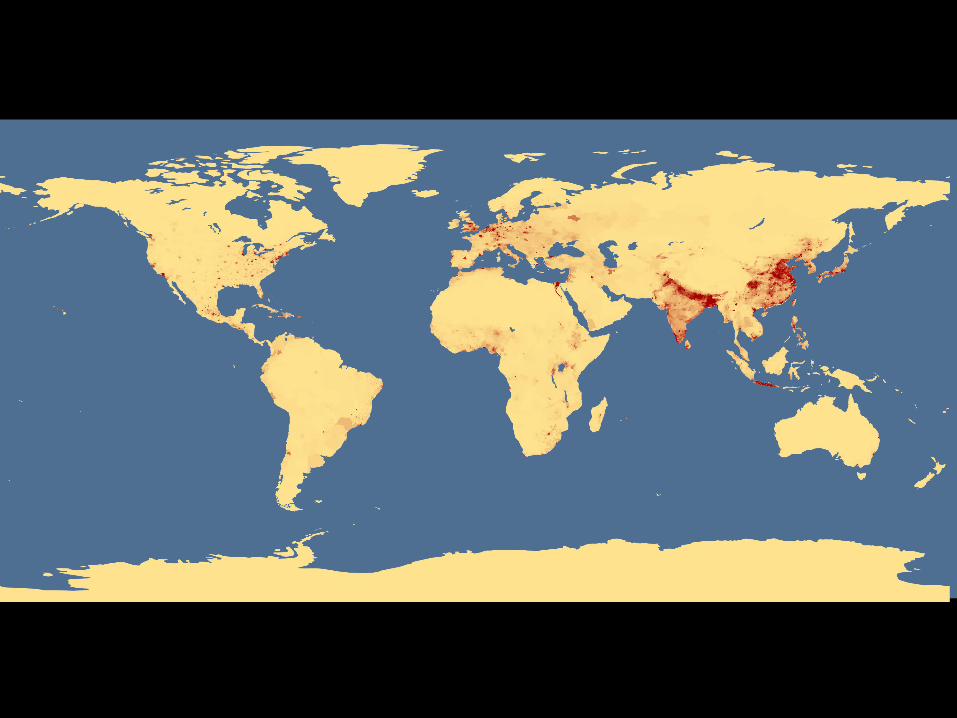
The current population is unprecedented but just looking at the overall numbers can be misleading. There is a tremendous variation in density.
In 1989 there were 5.2 billion people and about 13 billion hectares was inhabited, for an average of 0.4 persons/hectare (or 40 per sq. km., or 104 per sq. mile)
Vietnam had about 2/hectare, Belgium 3/hectare.
About 4 billion (2/3) lived at <2/hectare.
Even these country averages are misleading, however, since there are large differences in density within countries. For example, some US cities have high densities, but we have great deserts and mountains that are uninhabited. There has been a major migration into cities. In 1800 1/50 lived in cities, and now more than 1/2 live in cities. The increase in city dwellers is twenty times greater than the increase in total population.


Measuring the growth rate of populations Rates are expressed as a fractional change per year in the population size. The important variables are:
B = new births/ND = deaths/N I = new immigrants entering the population/N M = emigrants leaving the population/NN = total population size.
Then, B x N = the actual number of new births, etc.
The change in a population/yr = N(B-D+I-M) . The four variables (B-D+I-M) can be combined to give the total rate, “r”.If r remains the same from year to year, then the change in population size in any given time interval is:
dN/dT = rN.
This gives an exponential (geometric) increase in population with time and can also be expressed as
N = N0erT

N = N0erT
This equation makes it easy to calculate a doubling time.doubling time = 0.69/r
The world now has an overall growth rate ( r) of ~ 1.6%, so we’d
predict that it would take about 43 years to double to 12 billion.
However for human populations r is not a constant.
For example, if Adam and Eve and all their descendants had increased at that rate, Adam and Eve would have started things only 1370 years ago.
Or to put it another way, if humans had increased at that rate (from a start of 2) since the end of the ice age 12,000 years ago, there would now be 5.3 x 1082 persons, a number greater than the number of particles in the universe!

The rate of growth, r, is not a constant for human populations .
During early parts of our population growth, r was low. More recently, as agriculture flourished and particularly when the industrial revolution took off in the 1800s, r has grown dramatically. Thus the final part of the curve is much steeper than a simple exponential.

Populationin billions
1 2 3 4 5 6 7 8 9
Year 1804 1927 1961 1974 1987 1999 2011 2024 2042
Years to next billion
123 34 13 13 12 12 13 18
Milestones
The following table shows estimates of when each billion milestone was or will be met:
These numbers show that the world's population has tripled in 72 years, and doubled in 38 years up to the year 1999.

Doubling times show the same trend. These two tables use the same underlying population data but start at different times. Note how, during the 2nd millennium, each doubling has taken roughly half as long as the previous doubling.
Population in billions
0.25 0.5 1 2 4 8
Year 950 1600 1804 1927 1974 2024
Years to next doubling
650 204 123 47 50
Population in billions
0.375 0.75 1.5 3 6
Year 1420 1720 1875 1961 1999
Years to next doubling
300 155 86 38
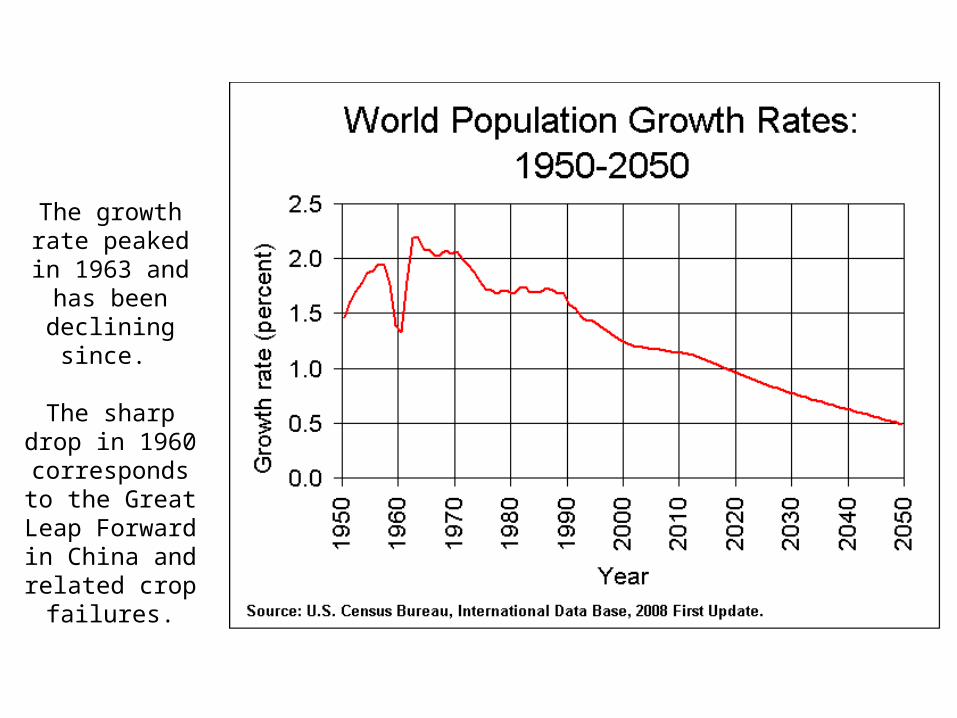
The growth rate peaked in 1963 and has been declining
since.
The sharp drop in 1960
corresponds to the Great Leap
Forward in China and
related crop failures.

Despite the declines in rate since 1963, the
number of people added to the population
each year continued to increase until
1990.This
demographic momentum results when more people reach child
bearing age . Population
pyramids help to illustrate this
principle.

A population pyramid shows the age distribution in a population. It is two back-to-back bar graphs, with the population plotted on the X-axis
and age on the Y-axis. By convention, the number of males is shown on the left, females on the right in five-year age groups.
Population pyramids illustrate a lot about birth and death rates, and they suggest how the future population will be distributed. Notice that typically there are more
females than males in the older age groups, due to females' longer life expectancy.
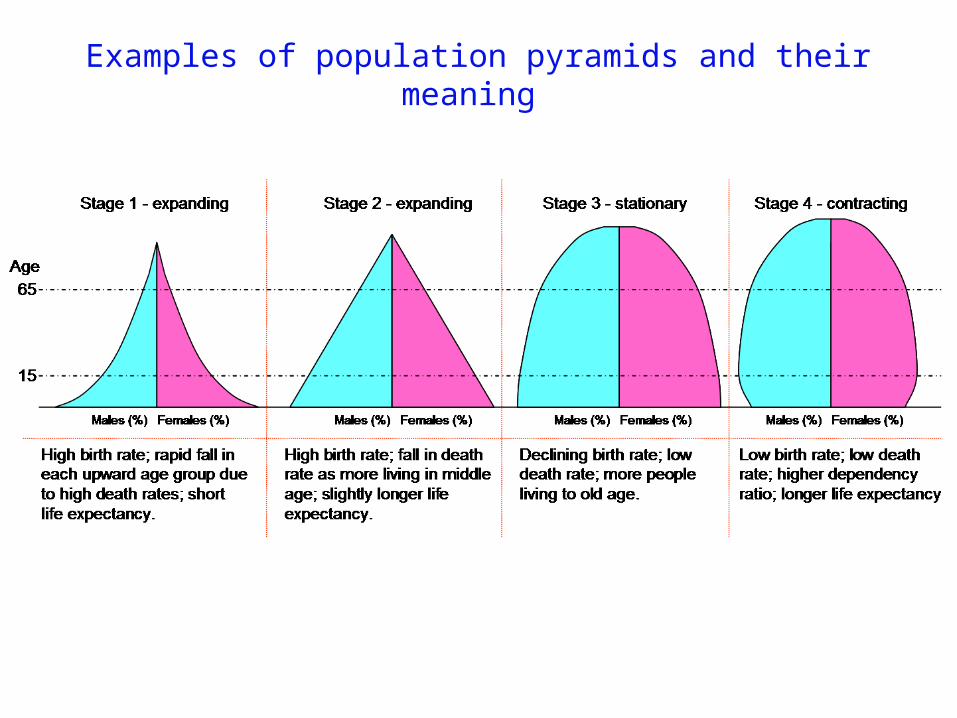
Examples of population pyramids and their meaning

Canadian Population Pyramid, 1961

A typical example of a high birth rate and high death rate pyramid. Life expectancy is low.

An even more extreme example of high birth and death rates.
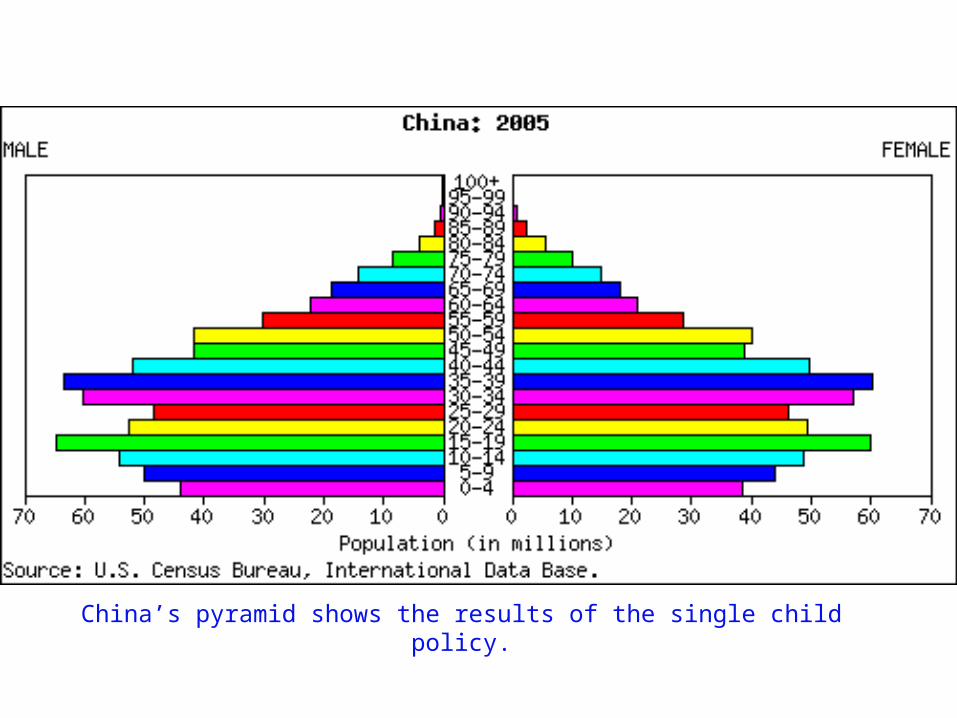
China’s pyramid shows the results of the single child policy.

The US pyramid shows the results of the baby boom (1946-66) and maybe the “baby bounce” 25-30 years later

Obviously populations cannot continue to grow at this rate, or even at a reduced but still exponential rate. At some point the resources of the globe will
be exhausted.

dN/dT = rN(K - N)/K
In experimental situations, populations reach a maximum as resources (food supply, energy input, etc.) are exhausted and waste products accumulate. The equation describing this kind of growth is called the logistic equation. The new parameter introduced here is the carrying capacity, K, or plateau value.


Demographic transitions