possible effects of global warming on tropical cyclone
TRANSCRIPT

Possible Effects of Global Warming on Tropical Cyclone Activity
Johnny ChanGuy Carpenter Asia-Pacific Climate Impact Centre
City University of Hong Kong

1Guy Carpenter Asia-Pacific Climate Impact Centre, City University of Hong Kong
Outline
Background
Relationship between global warming and
frequency of intense tropical cyclone
occurrence
Variations of tropical cyclone
characteristics in the western North
Pacific
Summary

2Guy Carpenter Asia-Pacific Climate Impact Centre, City University of Hong Kong
Background
Global warming leads to
– an increase in the temperature near the earth’s
surface (land and ocean)
– an increase in the amount of water vapour in the
atmosphere due to an increase in ocean temperature
and a higher atmospheric temperature capable of
holding more water vapour
No study has definitively demonstrated that the
dynamic factors are modified by global warming
(although some have suggested an increase in
vertical wind shear).
3Guy Carpenter Asia-Pacific Climate Impact Centre, City University of Hong Kong
Background
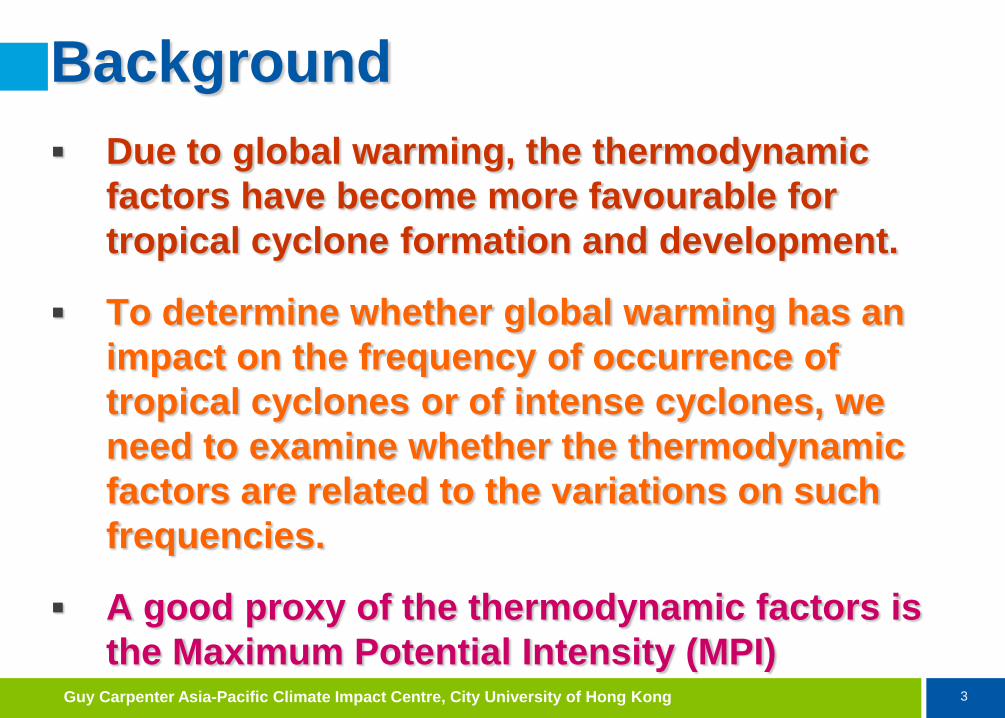
Due to global warming, the thermodynamic
factors have become more favourable for
tropical cyclone formation and development.
To determine whether global warming has an
impact on the frequency of occurrence of
tropical cyclones or of intense cyclones, we
need to examine whether the thermodynamic
factors are related to the variations on such
frequencies.
A good proxy of the thermodynamic factors is
the Maximum Potential Intensity (MPI)

4Guy Carpenter Asia-Pacific Climate Impact Centre, City University of Hong Kong
•MPI = f(ocean temperature, outflow temperature, net
amount of energy available for convection)
•Because MPI gives the maximum possible intensity, a
higher value of MPI summed over the ocean basin and
over a season should imply a more thermodynamically
energetic atmosphere, and more TCs could reach
higher intensities
a season with a higher value of MPI
should have more intense TCs if the
dominant control is thermodynamic
Background

5Guy Carpenter Asia-Pacific Climate Impact Centre, City University of Hong Kong
Atlantic
0
1
2
3
4
5
6
1960 1965 1970 1975 1980 1985 1990 1995 2000 2005
Year
Nu
mb
er
of
Cat4
5
54
56
58
60
62
64
66
68
MP
I
Cat45
NCEP MPI

6Guy Carpenter Asia-Pacific Climate Impact Centre, City University of Hong Kong
Western North Pacific
0
2
4
6
8
10
12
1960 1965 1970 1975 1980 1985 1990 1995 2000 2005
Year
Cat4
5
60
62
64
66
68
70
72
74
MP
I
Jul-Nov Cat45
NCEP MPI

7Guy Carpenter Asia-Pacific Climate Impact Centre, City University of Hong Kong
21-year running correlations with NCat45
Ocean Basin Period Correlation
(best track)
Correlation
(Kossin et al. 2007)
Atlantic 1960-2007 0.45
1970-2007 0.59
1980-2007 0.63
1979-2006 0.61 0.61
Western North Pacific 1960-2007 -0.01
1970-2007 -0.06
1980-2007 -0.08
1981-2006 -0.13 -0.36
Eastern North Pacific 1960-2007 0.29
1970-2007 0.35
1980-2007 0.34
South Indian Ocean 1981-2007 0.35
South Pacific 1981-2007 0.03

8Guy Carpenter Asia-Pacific Climate Impact Centre, City University of Hong Kong
21-year running correlations of MPI with NCat45
-0.6
-0.4
-0.2
0.0
0.2
0.4
0.6
0.8
1980 1985 1990 1995 2000 2005
Atlantic WNP ENP
21-year running correlations with NCat45

9Guy Carpenter Asia-Pacific Climate Impact Centre, City University of Hong Kong
21-year running correlations with Atlantic NCat45
-0.8
-0.6
-0.4
-0.2
0.0
0.2
0.4
0.6
0.8
1980 1985 1990 1995 2000 2005
MPI CAPE T0 SST
21-year running correlations with NCat45 - Atlantic

10Guy Carpenter Asia-Pacific Climate Impact Centre, City University of Hong Kong
21-year running correlations with ENP NCat45
-0.8
-0.6
-0.4
-0.2
0.0
0.2
0.4
0.6
1980 1985 1990 1995 2000 2005
MPI CAPE T0 SST
21-year running correlations with NCat45 - ENP

11Guy Carpenter Asia-Pacific Climate Impact Centre, City University of Hong Kong
21-year running correlations with WNP NCat45
-0.6
-0.4
-0.2
0.0
0.2
0.4
0.6
1980 1985 1990 1995 2000 2005
MPI CAPE T0 SST
21-year running correlations with NCat45 - WNP

12Guy Carpenter Asia-Pacific Climate Impact Centre, City University of Hong Kong
Summary
Thermodynamic control on the frequency
of intense TCs is important only in the
Atlantic
Estimating the effect of global warming on
the frequency of intense TCs therefore
must also assess such an effect on the
dynamic processes.

13Guy Carpenter Asia-Pacific Climate Impact Centre, City University of Hong Kong
Western North PacificTropical Cyclones

14Guy Carpenter Asia-Pacific Climate Impact Centre, City University of Hong Kong
Number and Intensity

15Guy Carpenter Asia-Pacific Climate Impact Centre, City University of Hong Kong
Annual number of TSs and Cat45 TCs over the WNP
15
20
25
30
35
40
1950 1955 1960 1965 1970 1975 1980 1985 1990 1995 2000 2005
0
2
4
6
8
10
12
14
TS
10-yr filtered TS
Cat45
10-yr filtered Cat45
Annual Number of TCs and Intense TCs in the WNP

16Guy Carpenter Asia-Pacific Climate Impact Centre, City University of Hong Kong
Webster et al.’s (2005) Science paper

17Guy Carpenter Asia-Pacific Climate Impact Centre, City University of Hong Kong
1975-89 1990-2004
Number 75 115
Percentage 32 42
No. of Category 4 and 5 Typhoons

18Guy Carpenter Asia-Pacific Climate Impact Centre, City University of Hong Kong
1960-74 1975-89 1990-2004
Number 105 75 115
Percentage 37 32 42
No. of Category 4 and 5 Typhoons

19Guy Carpenter Asia-Pacific Climate Impact Centre, City University of Hong Kong
ACE vs.. VORT, SHEAR and MSE
-2.5
-2.0
-1.5
-1.0
-0.5
0.0
0.5
1.0
1.5
2.0
2.5
3.0
1960 1965 1970 1975 1980 1985 1990 1995 2000 2005
ACE
VORT EOF1
SHEAR EOF1
MSE EOF2
0.580.72 0.67
Science, 311, 1713b, Tellus 2007

20Guy Carpenter Asia-Pacific Climate Impact Centre, City University of Hong Kong
Wavelet Analysis of Intense Typhoon Occurrence Frequency
2-7 yr
16-32 yr
Period A1 Period B Period A2
21Guy Carpenter Asia-Pacific Climate Impact Centre, City University of Hong Kong
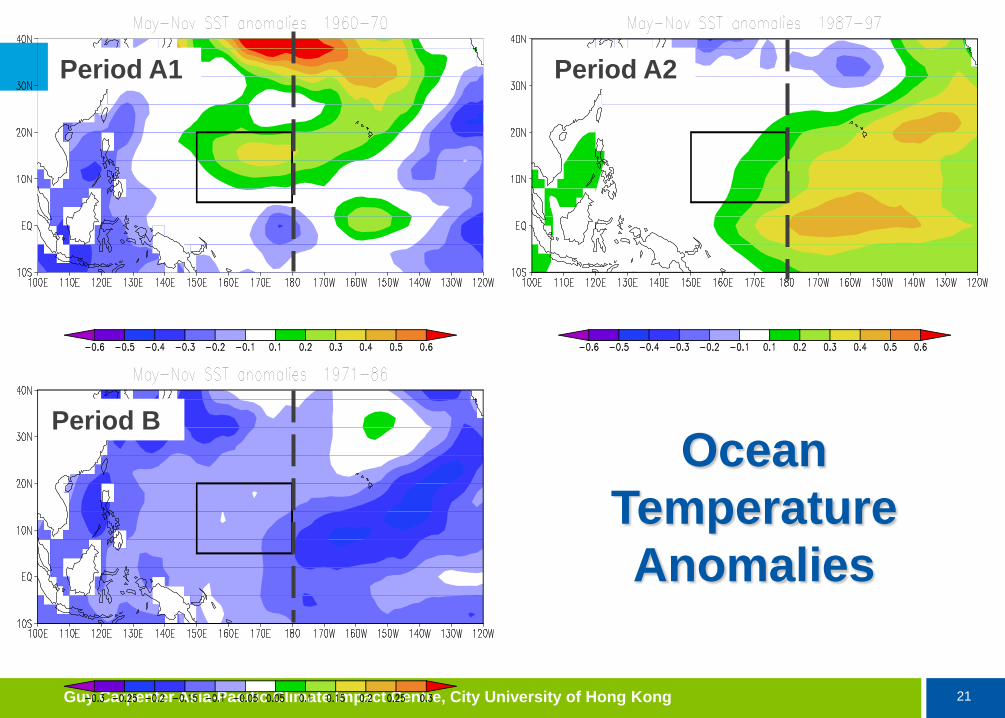
Ocean
Temperature
Anomalies
Period A1
Period B
Period A2

22Guy Carpenter Asia-Pacific Climate Impact Centre, City University of Hong Kong
Saturated Moist
Static Energy
Anomalies
Period A1 Period A2
Period B

23Guy Carpenter Asia-Pacific Climate Impact Centre, City University of Hong Kong
Anomalies of Vertical
Gradient (1000 minus
600 hPa) of Moist
Static Energy
Period A1 Period A2
Period B

24Guy Carpenter Asia-Pacific Climate Impact Centre, City University of Hong Kong
Rainfall Anomalies
Period A1 Period A2
Period B

25Guy Carpenter Asia-Pacific Climate Impact Centre, City University of Hong Kong
Vertical Wind ShearPeriod A1 minus Period B Period A2 minus Period B

26Guy Carpenter Asia-Pacific Climate Impact Centre, City University of Hong Kong
Frequency of
Occurrence of Intense
Typhoons
Period A1 Period A2
Period B

27Guy Carpenter Asia-Pacific Climate Impact Centre, City University of Hong Kong
Blue shading: 95% Green shading: 90%
Period A1 minus Period B Period A2 minus Period B
Difference in the Frequency of Occurrence of Intense Typhoons
Proceedings, Royal Society A (2008)

28Guy Carpenter Asia-Pacific Climate Impact Centre, City University of Hong Kong
Track and Landfall Variations

29Guy Carpenter Asia-Pacific Climate Impact Centre, City University of Hong Kong
No. of TCs Making Landfall in Japan and Korea Every 5-year period (1970-2004)
No. of Tropical Cyclones Making Landfall in Japan and Korea
0
5
10
15
20
25
30
1970-74 1975-79 1980-84 1985-89 1990-94 1995-99 2000-04
Year
Nu
mb
er
30Guy Carpenter Asia-Pacific Climate Impact Centre, City University of Hong Kong
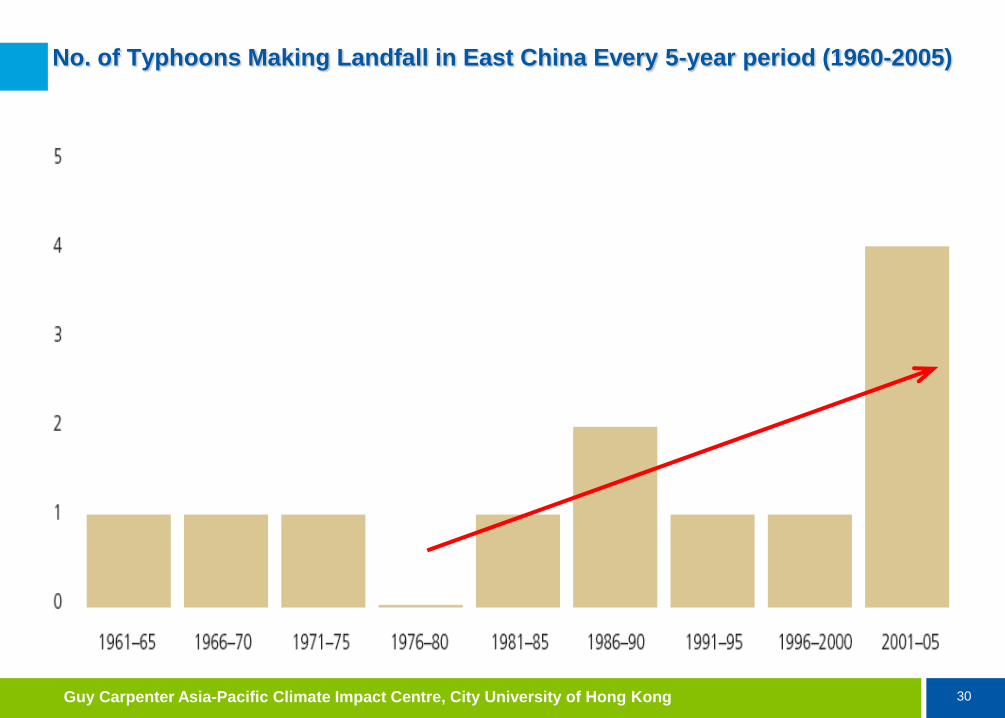
No. of Typhoons Making Landfall in East China Every 5-year period (1960-2005)
31Guy Carpenter Asia-Pacific Climate Impact Centre, City University of Hong Kong
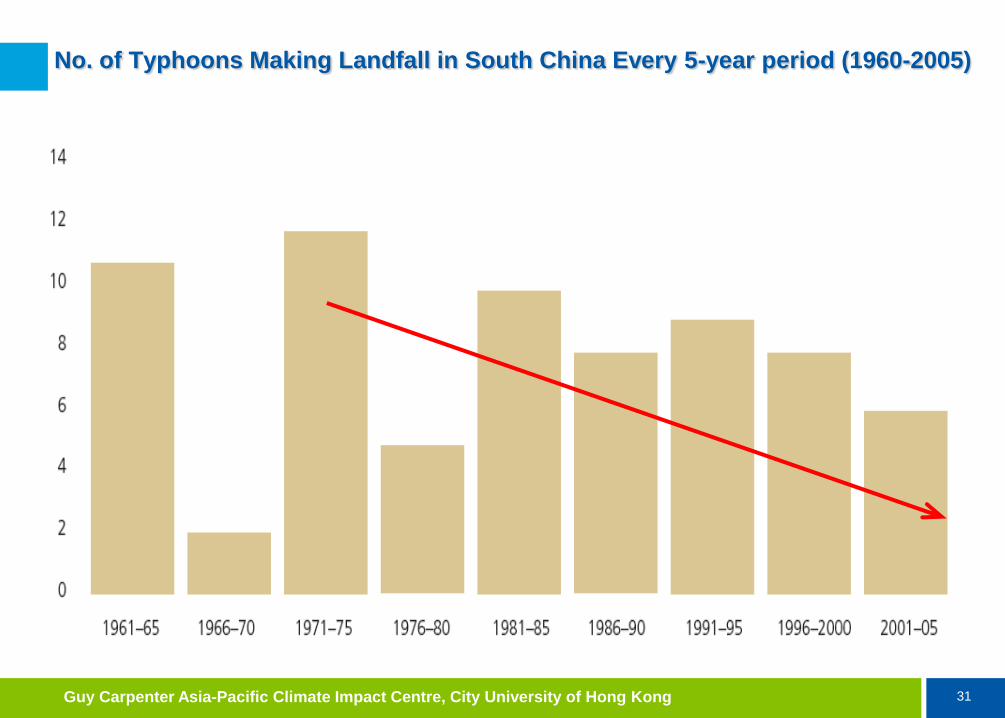
No. of Typhoons Making Landfall in South China Every 5-year period (1960-2005)

32Guy Carpenter Asia-Pacific Climate Impact Centre, City University of Hong Kong
Variations of Landfall in Each Area at Various Oscillation PeriodsSTC
-3
-2
-1
0
1
2
3
4
1945 1950 1955 1960 1965 1970 1975 1980 1985 1990 1995 2000
Year
Standa
rdized
anoma
lies
-1.5
-1
-0.5
0
0.5
1
1.5
2
Standardized anomalies
original
2-8 yr
8-16 yr
16-32 yr
sta
nd
ard
ize
d a
no
ma
lie
ss
tan
da
rdiz
ed
an
om
alie
s
MTC
-3
-2
-1
0
1
2
3
4
1945 1950 1955 1960 1965 1970 1975 1980 1985 1990 1995 2000
Year
Stand
ardize
d ano
malies
-1.5
-1
-0.5
0
0.5
1
1.5
2
Standardized anomalies
original
2-8 yr
8-16 yr
16-32 yr
sta
nd
ard
ize
d a
no
ma
lies
sta
nd
ard
ize
d a
no
ma
lies
sta
nd
ard
ize
d a
no
ma
lie
ss
tan
da
rdiz
ed
an
om
ali
es
South China, Philippines and
Vietnam
East China
Japan/Korea

33Guy Carpenter Asia-Pacific Climate Impact Centre, City University of Hong Kong
Patt
ern
s o
f T
C o
ccu
rren
ce a
no
mali
es
TC
occu
rren
ce a
no
malie
s1977-88
1964-76
1989-97
Pattern 1
Pattern 2
Pattern 3

34Guy Carpenter Asia-Pacific Climate Impact Centre, City University of Hong Kong
SummaryNo significant trend in any of the TC
characteristics (number, intensity, track
types, landfall locations) can be identified.
In other words, TC activity in the western
North Pacific does not follow the trend in
the global increase in atmospheric or sea-
surface temperature.
Instead, all such characteristics go
through large interannual and interdecadal
variations.

35Guy Carpenter Asia-Pacific Climate Impact Centre, City University of Hong Kong
Summary
Such variations are very much related and
apparently caused by similar variations in the
planetary-scale atmospheric and oceanographic
features that also do not have the same trend as
the global increase in air temperature
Unless the temporal variations of such features
become linear, these TC characteristics are not
expected to vary linearly with time.

36Guy Carpenter Asia-Pacific Climate Impact Centre, City University of Hong Kong
Summary
Even if the observed global warming
has an effect, it is probably in the
noise level relative to the large
interdecadal variations and therefore
is not detectable.