effects of climate change on water resources.ppthome.olemiss.edu/~cmchengs/global warming/session 9...
TRANSCRIPT

Effects of Climate Change onEffects of Climate Change onEffects of Climate Change on Effects of Climate Change on Water ResourcesWater Resources
Cristiane Queiroz Surbeck, P.E., Ph.D. Assistant ProfessorAssistant Professor
Department of Civil EngineeringThe University of Mississippi
Global Warming co rseGlobal Warming course
February 18, 2009

Outline• The Global Perspective• The Watershed Perspectivep• The Water Budget• Rainfall Analysis• Rainfall Analysis

The Global Conveyor Belt• Thermohaline circulation
W t i hill d i th N th Atl ti• Water is chilled in the North Atlantic, gets saltier (more dense), sinksD t th th lit• Deep water moves south then splits towards the Indian Ocean and the western Pacificwestern Pacific
• The two branches warm and rise, then return to North Atlanticreturn to North Atlantic
• Deep sea currents: base of food chain

The Global Conveyor Belt

The Global Conveyor Belt

The Global Conveyor Belt

The Global Conveyor Belt

Effect of Global Warming on O C B ltOcean Conveyor Belt
• Warmer, less dense water, won’t sink– Change in currents– Decreased salinity– Ecosystem
• Rise in sea levels

Distribution of Earth’s Water
Fresh water 3% Rivers 2%
Surface
Other 0.9%
Surface water 0.3%
Fresh surface
Fresh water
Earth’s water
water (liquid)
waterwater

The Hydrologic Cycle

Effects of Climate ChangeEffects of Climate Changeon Water Resources
• An increase in net solar radiation or temperature speeds up the processes within the hydrologic cyclethe hydrologic cycle
• More evaporation (loss of water), droughts• Earlier snowmelt more streamflow earlier• Earlier snowmelt, more streamflow, earlier
peak discharges• Lower dissolved oxygen levels (effect on yg (
aquatic life)• Different climate effects throughout globe

Effect of Climate Change onEffect of Climate Change on Water Quality
• Reduced dissolved oxygen levels• Less dilution of pollutants duringLess dilution of pollutants during
droughts• Increased pollution and sedimentation• Increased pollution and sedimentation
during increased rainfallI d li it i t l t• Increased salinity in coastal water bodies

Effects of Climate ChangeEffects of Climate Changeon North America
• Alaska, Yukon, and Coastal British Columbia– Increased flooding– Increased stress on salmonIncreased stress on salmon
• Southeast, Gulf, and Mid-Atlantic– Risk of extreme precipitation events, hurricanes
Possible longer droughts– Possible longer droughts– River flow variability
• Varying effects in other regions• http://www.epa.gov/climatechange/effects/water/north
america.html

Th K k k Ri B i b D i IN ThTh K k k Ri B i b D i IN ThThe Kankakee River Basin above Davis, IN. The The Kankakee River Basin above Davis, IN. The dashed lines divide the watersheddashed lines divide the watershed

(a) Schematic diagram of a hydrologic system, (b) mass (a) Schematic diagram of a hydrologic system, (b) mass ( ) g y g y , ( )( ) g y g y , ( )balance diagram of a hydrologic subsystembalance diagram of a hydrologic subsystem


Hydrologic Water Budget
Source: USGS WSP 2425

Hydrologic Water BudgetMass balance of inflows and outflows
Pn ET
SiSo
V/ t
GoG
TV/ t
∆V P + S +G ET S G ± T
GoGi
∆t= Pn + Si +Gi − ET − So −Go ± T

R i f ll A l iRainfall Analysis• Intensity (rainfall depth/time)
D ti (ti )• Duration (time)• Frequency (1/time) or return q y ( )
period (time)

Intensity-duration-frequency curvesIntensity duration frequency curves

Possible climate change effect l i f ll di t ib tion annual rainfall distribution
6
4
5
pth
(in
.)
1
2
3
Rain
fall d
e
0
1
anua
rybr
uary
March
April
May
June July
Augu
stte
mbe
rOct
ober
vem
ber
embe
rR
Jan
Feb M Au
Sept
e Oc
Nove
Dece
No climate change effect Climate change effect
Total annual rainfall in both cases: 13.8 inches
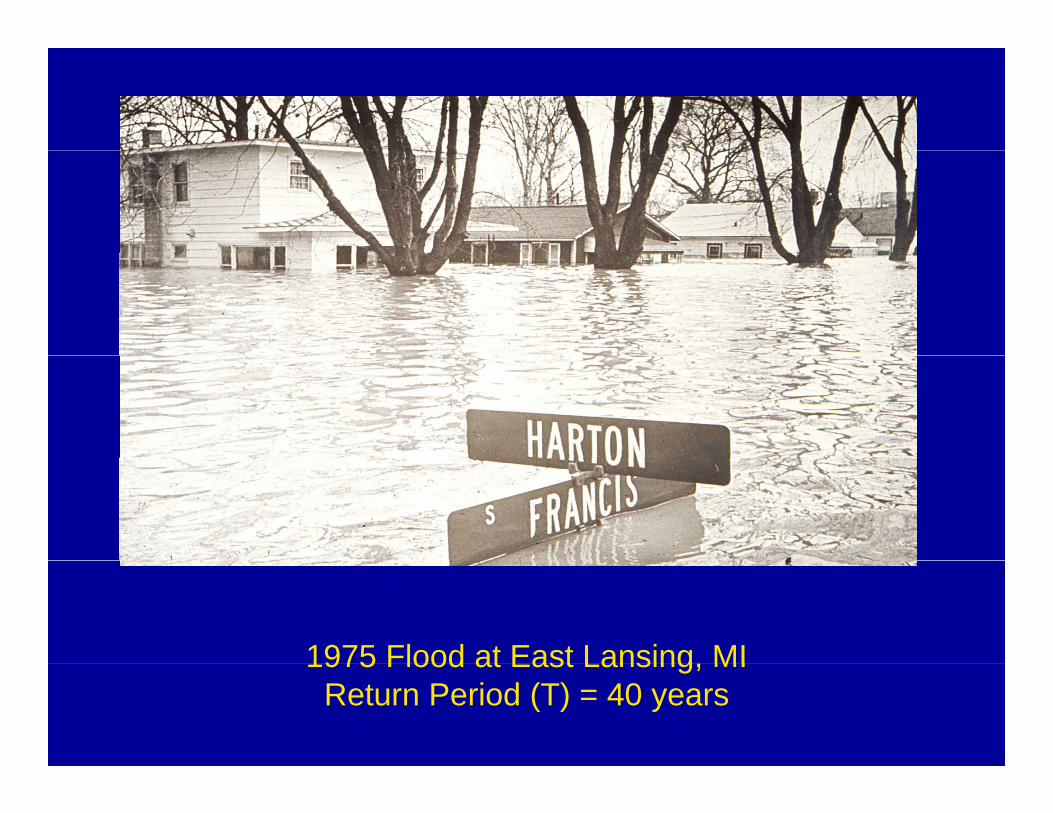
1975 Flood at East Lansing MI1975 Flood at East Lansing, MIReturn Period (T) = 40 years

Return Period (T)
• T = 1/P• P = exceedence probability• Return period: the average lengthof time
between events that have the same depth and durationand duration
• Exceedence probability: the probability that an event having a specified depth and g p pduration will be exceeded in one time period (usually one year).

Conclusionsand
QuestionsQuestions