wisdom of crowds enterprise performance management
TRANSCRIPT

June 30, 2021
Dresner Advisory Services, LLC
2021 Edition
Wisdom of Crowds®
Enterprise Performance Management Market Study
Licensed to OneStream
2021 Wisdom of Crowds® EPM Market Study
http://www.dresneradvisory.com Copyright 2021 – Dresner Advisory Services, LLC
2
Disclaimer
This report should be used for informational purposes only. Vendor and product selections should be made
based on multiple information sources, face-to-face meetings, customer reference checking, product
demonstrations, and proof-of-concept applications.
The information contained in all Wisdom of Crowds® Market Study Reports reflects the opinions expressed in
the online responses of individuals who chose to respond to our online questionnaire and does not represent
a scientific sampling of any kind. Dresner Advisory Services, LLC shall not be liable for the content of
reports, study results, or for any damages incurred or alleged to be incurred by any of the companies
included in the reports as a result of the content.
Reproduction and distribution of this publication in any form without prior written permission is forbidden.
2021 Wisdom of Crowds® EPM Market Study
http://www.dresneradvisory.com Copyright 2021 – Dresner Advisory Services, LLC
3
Definitions An enterprise performance management system is a key element of performance
management. It allows an organization to plan for the impact of various internal and
external factors on its future performance and business outcomes. This includes
strategic, operational, and financial planning and forecasting. EPM systems also include
reporting and analytics capabilities that allow organizations to set goals and objectives
and monitor performance against those objectives.
EPM systems can vary significantly in complexity and automation capabilities, from
relatively straightforward spreadsheet replacements to sophisticated multi-user systems
that support collaborative planning, provide a wide range of analytics, and use
advanced technologies such as in-memory computing and machine learning.

2021 Wisdom of Crowds® EPM Market Study
http://www.dresneradvisory.com Copyright 2021 – Dresner Advisory Services, LLC
4
Introduction In 2021, we mark the 14th anniversary of Dresner Advisory Services. Our thanks to all
of you for your continued support and ongoing encouragement. Since our founding in
2007, we worked hard to set the “bar” high—challenging ourselves to innovate and lead
the market—offering ever greater value with each successive year.
At the time of publication of this report, the COVID-19 pandemic continues to affect
millions worldwide and impacts businesses and how they leverage data and business
intelligence. As our data collection took place during Q1 and Q2 of 2021, the data and
resulting analyses continue to reflect the pandemic’s impact.
Through this period, we separately conducted specific COVID-19 research, which is not
reflected in this report but is available on our blog at no cost. Additionally, we will
continue to collect this data and will continue to publish research through the duration of
the pandemic.
This year’s Wisdom of Crowds® Enterprise Performance Management Market Study
analyzes user perceptions, intentions, and realities associated with enterprise
performance management (EPM) and compares them to previous years.
We hope you enjoy this report!
Best
Howard Dresner Chief Research Officer Dresner Advisory Services

2021 Wisdom of Crowds® EPM Market Study
http://www.dresneradvisory.com Copyright 2021 – Dresner Advisory Services, LLC
5
Contents Definitions ....................................................................................................................... 3
Introduction ..................................................................................................................... 4
Benefits of the Study ....................................................................................................... 7
Consumer Guide .......................................................................................................... 7
Supplier Tool ................................................................................................................ 7
External Awareness .................................................................................................. 7
Internal Planning ....................................................................................................... 7
About Howard Dresner and Dresner Advisory Services .................................................. 8
Executive Summary ...................................................................................................... 10
Study Demographics ..................................................................................................... 11
Geography ................................................................................................................. 11
Respondent Functions ............................................................................................... 12
Vertical Industries ...................................................................................................... 13
Organization Size ....................................................................................................... 14
Analysis and Trends ...................................................................................................... 16
Adoption Trends and Plans to Use Enterprise Performance Management ................ 16
Importance of Enterprise Performance Management ................................................ 23
Enterprise Performance Management Implementation Strategy ................................ 28
Enterprise Performance Management Sourcing Strategy .......................................... 30
Planning Priorities in Enterprise Performance Management ...................................... 34
Use of Rolling Forecasts in Enterprise Performance Management ............................ 38
Enterprise Performance Management and Data Driven Decision Making ................. 41
Impact of Artificial Intelligence on Enterprise Performance Management .................. 42
Deployment Options for Enterprise Performance Management ................................. 45
Industry Capabilities ...................................................................................................... 48
Industry – Strategy Management Capabilities............................................................ 50
Industry – Financial Planning Capabilities ................................................................. 51
Industry – Operational Planning Capabilities ............................................................. 52
Industry – Budgeting and Planning Process Support ................................................. 53

2021 Wisdom of Crowds® EPM Market Study
http://www.dresneradvisory.com Copyright 2021 – Dresner Advisory Services, LLC
6
Industry – Planning and Modeling Capabilities .......................................................... 54
Industry – Data Science and Machine Learning ......................................................... 55
Industry – Technical Architecture Features ................................................................ 56
Vendor Rankings ........................................................................................................... 57
Enterprise Performance Management Market Models .................................................. 58
Customer Experience Model ...................................................................................... 58
Vendor Credibility Model ............................................................................................ 60
Detailed Vendor Ratings ............................................................................................... 61
Anaplan Detailed Score .......................................................................................... 62
Board International Detailed Score ......................................................................... 63
Centage Detailed Score .......................................................................................... 64
IBM Detailed Score ................................................................................................. 65
Jedox Detailed Score .............................................................................................. 66
OneStream Detailed Score ..................................................................................... 67
Oracle Detailed Score ............................................................................................. 68
Planful Detailed Score ............................................................................................ 69
Prophix Detailed Score ........................................................................................... 70
SAP Detailed Score ................................................................................................ 71
Solver Detailed Score ............................................................................................. 72
Syntellis Detailed Score .......................................................................................... 73
Unit4 Detailed Score ............................................................................................... 74
Vena Solutions Detailed Score ............................................................................... 75
Wolters Kluwer (CCH Tagetik) Detailed Score ....................................................... 76
Workday (Adaptive Planning) Detailed Score ......................................................... 77
Other Dresner Advisory Services Research Reports .................................................... 78
Appendix - The 2021 Wisdom of Crowds® Enterprise Performance Management Survey
Instrument ..................................................................................................................... 79

2021 Wisdom of Crowds® EPM Market Study
http://www.dresneradvisory.com Copyright 2021 – Dresner Advisory Services, LLC
7
Benefits of the Study The Wisdom of Crowds® Enterprise Performance Management Market Study provides a
wealth of information and analysis—offering value to both consumers and producers of
enterprise performance management technology and services.
Consumer Guide
As an objective source of industry research, consumers use the Wisdom of Crowds®
Enterprise Performance Management Market Study to understand how their peers
leverage and invest in planning and related technologies.
Using our trademark 33-criteria vendor performance measurement system, users glean
key insights into enterprise performance management software supplier performance,
enabling:
Comparisons of current vendor performance to industry norms
Identification and selection of new vendors
Supplier Tool
Vendor Licensees use the Wisdom of Crowds® Enterprise Performance Management
Market Study in several important ways such as:
External Awareness
- Build awareness for the enterprise performance management market and supplier
brand, citing Wisdom of Crowds® Enterprise Performance Management Market
Study trends and vendor performance
- Create lead and demand-generation for supplier offerings through association with
Wisdom of Crowds® Enterprise Performance Management Market Study brand,
findings, webinars, etc.
Internal Planning
- Refine internal product plans and align with market priorities and realities as
identified in Wisdom of Crowds® Enterprise Performance Management Market Study
- Better understand customer priorities, concerns, and issues
- Identify competitive pressures and opportunities

2021 Wisdom of Crowds® EPM Market Study
http://www.dresneradvisory.com Copyright 2021 – Dresner Advisory Services, LLC
8
About Howard Dresner and Dresner Advisory Services The Wisdom of Crowds® Enterprise Performance Management Market Study was
conceived, designed and executed by Dresner Advisory Services, LLC—an
independent advisory firm—and Howard Dresner, its President, Founder and Chief
Research Officer.
Howard Dresner is one of the foremost thought leaders in business intelligence and
performance management, having coined the term “Business Intelligence” in 1989. He
has published two books on the subject, The Performance
Management Revolution – Business Results through Insight
and Action (John Wiley & Sons, Nov. 2007) and Profiles in
Performance – Business Intelligence Journeys and the
Roadmap for Change (John Wiley & Sons, Nov. 2009). He
lectures at forums around the world and is often cited by the
business and trade press.
Prior to Dresner Advisory Services, Howard served as chief
strategy officer at Hyperion Solutions and was a research fellow at Gartner, where he
led its business intelligence research practice for 13 years.
Howard has conducted and directed numerous in-depth primary research studies over
the past two decades and is an expert in analyzing these markets.
Through our Wisdom of Crowds® market research reports, we engage with a global
community to redefine how research is created and shared. Other research reports
include:
- Wisdom of Crowds® Flagship BI Market Study - Cloud Computing and Business Intelligence - Data Pipelines - Data Preparation - Data Science and Machine Learning - Guided Analytics - Embedded Business Intelligence - Self-Service BI
Howard (www.twitter.com/howarddresner) conducts a weekly Twitter “tweetchat” on
alternate Fridays at 1:00 p.m. ET. The hashtag is #BIWisdom. During these live events,
the #BIWisdom community discusses a wide range of business intelligence topics.
You can find more information about Dresner Advisory Services at
www.dresneradvisory.com.

2021 Wisdom of Crowds® EPM Market Study
http://www.dresneradvisory.com Copyright 2021 – Dresner Advisory Services, LLC
9
Executive
Summary

2021 Wisdom of Crowds® EPM Market Study
http://www.dresneradvisory.com Copyright 2021 – Dresner Advisory Services, LLC
10
Executive Summary
There is a moderate increase in adoption, with 51 percent of respondents
currently using enterprise performance management, while fewer than 1 percent
plan to decrease their enterprise performance management user base. This is
further evidence of market maturity that we first highlighted in 2020.
Adoption increased most in large organizations (1,001-10,000 employees)
compared to 2020, while small organizations remain least likely to adopt
enterprise performance management software.
Current usage levels remain lower in Asia Pacific and Latin America, showing
that these markets are less mature. Organizations in Latin America have the
greatest resistance to adoption of enterprise performance management software.
Enterprise performance management remains an important technology. The
most notable change in 2021 is an increase in the percentage of respondents
rating EPM as critically important, up by 3 percent to nearly 25 percent.
Finance climbs back to the top of the rankings in 2021 as the function rating
enterprise performance management most important overall, most likely due to
its role in helping organizations navigate the challenges of COVID-19.
The 2021 data show a continuing trend towards sourcing of enterprise
performance management solutions from specialist vendors regardless of their
affiliation with any ERP vendor, up to nearly 49 percent in 2021.
The top three planning priorities remain unchanged from 2020 (annual financial
budgets, cash-flow forecasting, and headcount planning). These likely reflect the
capabilities that are most valuable in navigating the COVID-19 crisis.
Rolling forecast adoption appears to have peaked as adoption levels fell slightly
in 2021. It does not appear that rolling forecasts will replace annual budgets as
the primary control mechanism for enterprise performance management.
There is a slight shift in attitudes to AI in 2021, with resistance to AI-based
forecasting and planning softening somewhat (down to 14 percent from 20
percent in 2020). However, 52 percent of respondents remain uncertain about
the business value of machine learning and AI.
Respondents prefer cloud enterprise performance management solutions
compared to on-premises deployment, but deployment choices do not appear to
be of critical importance in evaluations.
Vendor rankings are displayed on pages 57-77.

2021 Wisdom of Crowds® EPM Market Study
http://www.dresneradvisory.com Copyright 2021 – Dresner Advisory Services, LLC
11
Study Demographics Our 2021 survey base provides a cross-section of data across geographies, functions,
organization sizes, and vertical industries. We believe that, unlike other industry
research, this supports a more representative sample and better indicator of true market
dynamics. We constructed cross-tab analyses using these demographics to identify and
illustrate important industry trends.
Geography
Survey respondents represent the span of geographies. North America (including the
United States, Canada, and Puerto Rico) accounts for the largest group with 55.9
percent of all respondents. EMEA accounts for 31.4 percent, Asia Pacific for 8.3
percent, and Latin America 4.4 percent (fig. 1).
Figure 1 – Geographies represented
55.9%
31.4%
8.3%
4.4%
0%
10%
20%
30%
40%
50%
60%
North America Europe, Middle East andAfrica
Asia Pacific Latin America
Geographies Represented

2021 Wisdom of Crowds® EPM Market Study
http://www.dresneradvisory.com Copyright 2021 – Dresner Advisory Services, LLC
12
Respondent Functions
IT is the function most represented among respondents, with 32 percent of the sample
(fig. 2). Finance follows with 23 percent, while Executive Management represents 15
percent. These three functions account for over 70 percent of respondents.
The BI Competency Center, Research & Development (R&D), Operations, Marketing
and Sales, Strategic Planning, and Human Resources are the next most represented.
Only five percent of respondents do not fall into our functional breakout.
Tabulating results by respondent function helps us create analyses that represent
different perspectives by function.
Figure 2 – Functions represented
32.2%
22.8%
15.2%
9.0%
4.6% 4.4% 3.4% 2.9%
0.6%
4.9%
0%
5%
10%
15%
20%
25%
30%
35%
Functions Represented

2021 Wisdom of Crowds® EPM Market Study
http://www.dresneradvisory.com Copyright 2021 – Dresner Advisory Services, LLC
13
Vertical Industries
Survey respondents are from a broad range of industries with no individual industry
dominating the responses. Manufacturing and Business Services are the most
represented industries, accounting for 25 percent and 17 percent of the sample
respectively (fig. 3). Financial Services, Technology, and Consumer Services are the
next most represented, with only around 4 percent not falling into our industry
classifications.
Tabulating results across industries helps us develop analyses that reflect the maturity
and direction of different business sectors.
Figure 3 – Vertical industries represented
25.0%
16.8%
11.6% 11.5% 10.2%
7.8% 7.4%
3.9%
2.3% 3.5%
0%
5%
10%
15%
20%
25%
30%
Vertical Industries Represented

2021 Wisdom of Crowds® EPM Market Study
http://www.dresneradvisory.com Copyright 2021 – Dresner Advisory Services, LLC
14
Organization Size
Survey respondents represent organizations of all sizes (measured by global employee
head count). Small organizations (1-100 employees) represent 20 percent of
respondents, mid-size organizations (101-1,000 employees) account for over 31
percent, and large organizations (>1,000 employees) account for the remaining 49
percent (fig. 4).
Tabulating results by organization size reveals important differences in practices,
planning, and maturity.
Figure 4 – Organization sizes represented
20.0%
31.2% 30.6%
18.3%
0%
5%
10%
15%
20%
25%
30%
35%
1-100 101-1,000 1,001-10,000 More than 10,000
Organization Sizes Represented

2021 Wisdom of Crowds® EPM Market Study
http://www.dresneradvisory.com Copyright 2021 – Dresner Advisory Services, LLC
15
Analysis and
Trends

2021 Wisdom of Crowds® EPM Market Study
http://www.dresneradvisory.com Copyright 2021 – Dresner Advisory Services, LLC
16
Analysis and Trends
Adoption Trends and Plans to Use Enterprise Performance Management
There is a moderate increase in adoption of enterprise performance management in
2021. Fifty-one percent of organizations currently use enterprise performance
management software compared to 47 percent in 2020, while 11 percent are currently
evaluating. Fifteen percent may use performance management software in the future,
while 23 percent of respondents currently have no plans to use enterprise performance
management software (fig. 5). These numbers are down compared to 2020 (17 percent
and 27 percent, respectively).
This data is clear evidence of the increased maturity of the EPM market that we initially
identified in our 2020 Market Study. There was a significant jump in adoption from 2019
to 2020, and the 2021 data shows the majority of respondents deployed an EPM
solution.
Figure 5 – EPM software use, 2019-2021
0%
10%
20%
30%
40%
50%
60%
70%
80%
90%
100%
2019 2020 2021
EPM Software Use 2019-2021
No, we have no plans to use enterprise performance management software at all
We may use planning and enterprise performance management in the future
We are currently evaluating enterprise performance management software
Yes, we use enterprise performance management software today

2021 Wisdom of Crowds® EPM Market Study
http://www.dresneradvisory.com Copyright 2021 – Dresner Advisory Services, LLC
17
There remain significant variations in adoption of enterprise performance management
by organizations of different sizes. Current adoption levels are higher in large
organizations (those with more than 1,000 employees) compared to small and mid-
sized organizations. Sixty-one percent of organizations with 1,001-10,000 employees
and 56 percent of organizations with more than 10,000 employees currently use
enterprise performance management software, compared to 50 percent of mid-sized
organizations (101-1,000 employees) and 24 percent of small organizations (less than
100 employees) (fig. 6).
Current usage increased most in large organizations (1,001-10,000 employees)
compared to 2020, up to 61 percent from 54 percent. Small organizations remain least
likely to adopt enterprise performance management software, with 40 percent stating
they have no plans to adopt. This is up slightly from 37 percent in 2020.
Figure 6 – EPM software use by organization size
0%
10%
20%
30%
40%
50%
60%
70%
80%
90%
100%
1-100 101-1,000 1,001-10,000 More than 10,000
EPM Software Use by Organization Size
No, we have no plans to use enterprise performance management software at all
We may use planning and enterprise performance management in the future
We are currently evaluating enterprise performance management software
Yes, we use enterprise performance management software today

2021 Wisdom of Crowds® EPM Market Study
http://www.dresneradvisory.com Copyright 2021 – Dresner Advisory Services, LLC
18
Organizations in North America and EMEA have higher adoption levels of enterprise
performance management compared to Asia Pacific and Latin America (fig. 7). Current
usage levels are higher in North America compared to EMEA (55 percent and 50
percent, respectively) because adoption levels in North America increased by 4 percent
in 2021 while they dropped slightly in EMEA (down by 2 percent). Resistance to
adoption of enterprise performance management software declined somewhat in both
regions, down by 3 percent in North America and 5 percent in EMEA.
Current usage levels remain lower in Asia Pacific and Latin America (33 percent and 14
percent, respectively), showing that these markets are less mature. Organizations in
Latin America have the greatest resistance to adoption; and, as in 2020, with no
respondents currently undertaking evaluations, we expect adoption levels to remain low
in this region.
Figure 7 – EPM software use by geography
0%
10%
20%
30%
40%
50%
60%
70%
80%
90%
100%
North America Europe, Middle East andAfrica
Asia Pacific Latin America
EPM Software Use by Geography
No, we have no plans to use enterprise performance management software at all
We may use planning and enterprise performance management in the future
We are currently evaluating enterprise performance management software
Yes, we use enterprise performance management software today

2021 Wisdom of Crowds® EPM Market Study
http://www.dresneradvisory.com Copyright 2021 – Dresner Advisory Services, LLC
19
Analysis of this data by function shows that the Finance function has the highest level of
EPM adoption at 73 percent, up 12 percent from 2020 (fig. 8). This is understandable,
because Finance has the most frequent users of the planning and reporting capabilities
that form a key part of any EPM solution. Increased adoption by Finance since 2020 is
likely in response to the COVID-19 crisis.
Adoption is broadly similar across other functions, and there is a notable drop in current
usage by the operations function compared to 2020, down by 19 percent to 38 percent,
which may indicate some disillusionment among users. IT professionals supporting
EPM initiatives should ensure that the functional needs of Operations personnel can be
met by existing EPM solutions, or if additional capabilities need to be deployed.
Figure 8 - EPM software use by function
0%
10%
20%
30%
40%
50%
60%
70%
80%
90%
100%
Finance ExecutiveManagement
Operations BICC IT Marketing &Sales
StrategicPlanningFunction
EPM Software Use by Function
No, we have no plans to use enterprise performance management software at all
We may use planning and enterprise performance management in the future
We are currently evaluating enterprise performance management software
Yes, we use enterprise performance management software today

2021 Wisdom of Crowds® EPM Market Study
http://www.dresneradvisory.com Copyright 2021 – Dresner Advisory Services, LLC
20
There are notable increases in adoption of enterprise performance management among
Healthcare and Consumer Services (fig. 9). The healthcare vertical jumps from seventh
place to first in the industry adoption ranking, with current usage increasing by 30
percent to 62 percent. Adoption among Education and Technology verticals remains
low, while the Retail and Wholesale vertical has the highest level of skepticism, with 36
percent of respondents stating they have no plans to adopt.
Adoption of enterprise performance management software remains varied by industry
vertical, meaning that vendors will need to choose their industry targets with care to
ensure their sales and implementation resources are not spread too thinly. IT
professionals supporting enterprise performance management evaluations should
ensure potential vendors have the capabilities and implementation resources to support
their industry needs.
Figure 9 – EPM software use by industry
0%
10%
20%
30%
40%
50%
60%
70%
80%
90%
100%
EPM Software Use by Industry
No, we have no plans to use enterprise performance management software at all
We may use planning and enterprise performance management in the future
We are currently evaluating enterprise performance management software
Yes, we use enterprise performance management software today

2021 Wisdom of Crowds® EPM Market Study
http://www.dresneradvisory.com Copyright 2021 – Dresner Advisory Services, LLC
21
Adoption plans remain skewed for future years, with 69 percent of organizations
considering enterprise performance management software planning to do so beyond
next year (fig. 10). This is up slightly in 2021 and reflects both the adoption during 2020
and the increased maturity of the market.
Figure 10 – EPM software adoption plans, 2019-2021
0%
10%
20%
30%
40%
50%
60%
70%
80%
90%
100%
2019 2020 2021
EPM Software Adoption Plans 2019-2021
Will Adopt This Year Will Adopt Next Year Will Adopt Beyond Next Year

2021 Wisdom of Crowds® EPM Market Study
http://www.dresneradvisory.com Copyright 2021 – Dresner Advisory Services, LLC
22
Among organizations that already use enterprise performance management software,
the user base in organizations is most likely to stay the same or increase in 2021. Sixty
percent of respondents say that their enterprise performance management user base
will stay about the same, while over 39 percent said it will increase (up from 33 percent
in 2020). Less than 1 percent of respondents will decrease their enterprise performance
management user base (fig.11).
This data confirms the increasing maturity of the enterprise performance management
market. EPM clearly demonstrates value in the organizations that implemented it, as
hardly any organizations plan to reduce their user base, while a greater percentage than
in 2020 plan to increase their user base.
Figure 11 – EPM software user base plans
39.5%
59.9%
0.6% 0%
10%
20%
30%
40%
50%
60%
70%
The number of enterpriseperformance management users
will increase
The number of enterpriseperformance management users
will stay about the same
The number of enterpriseperformance management users
will decrease
EPM Software User Base Plans

2021 Wisdom of Crowds® EPM Market Study
http://www.dresneradvisory.com Copyright 2021 – Dresner Advisory Services, LLC
23
Importance of Enterprise Performance Management
We asked respondents how important enterprise performance management software is
to their organization (fig. 12). Seventy-six percent of respondents rate enterprise
performance management as “critical”, “very important,” or “important.” Nearly 25
percent of respondents rate enterprise performance management of critical importance
in their organization.
Figure 12 – EPM software importance
24.7%
28.6%
22.6%
14.5%
9.6%
0%
5%
10%
15%
20%
25%
30%
35%
Critical Very Important Important SomewhatImportant
Not Important
EPM Software Importance

2021 Wisdom of Crowds® EPM Market Study
http://www.dresneradvisory.com Copyright 2021 – Dresner Advisory Services, LLC
24
These responses are broadly in line with 2019 and 2020, showing that enterprise
performance management is an important capability to most organizations (fig.13). The
most notable change in 2021 compared to 2020 is an increase in the percentage of
respondents rating EPM as critically important, which is up by 3 percent to nearly 25
percent. This may be due to the role of enterprise performance management solutions
in helping organizations navigate the challenges of the COVID-19 crisis. However, there
is also an increase in the percentage of organizations rating EPM as not important,
which is up by over 5 percent to nearly 10 percent. This may be a corollary to the
previous point in that some organizations may now see their way through the COVID-19
crisis and thus rate EPM less important in their overall priorities.
Figure 13 – EPM importance, 2019-2021
0%
10%
20%
30%
40%
50%
60%
70%
80%
90%
100%
2019 2020 2021
EPM Software Importance 2019-2021
Critical Very Important Important Somewhat Important Not Important

2021 Wisdom of Crowds® EPM Market Study
http://www.dresneradvisory.com Copyright 2021 – Dresner Advisory Services, LLC
25
The importance of enterprise performance management software varies by organization
size (fig. 14). Large organizations overall rate enterprise performance management
software more important than small and mid-sized organizations. Sixty-four percent of
large organizations (1,001-10,000 employees) and 60 percent of very large
organizations (more than 10,000 employees) rate enterprise performance management
either “critical” or “very important.” Small (1-100 employees) and mid-sized (101-1,000
employees) organizations overall rate enterprise performance management less
important than larger organizations; this difference is most notable in “critical”
importance. Fifteen and 16 percent of small and mid-sized organizations respectively
rate EPM of “critical” importance, compared to 35 percent and 36 percent of large and
very large organizations, respectively.
Figure 14 – EPM importance by organization size
0%
10%
20%
30%
40%
50%
60%
70%
80%
90%
100%
1-100 101-1,000 1,001-10,000 More than 10,000
EPM Software Importance by Organization Size
Critical Very Important Important Somewhat Important Not Important

2021 Wisdom of Crowds® EPM Market Study
http://www.dresneradvisory.com Copyright 2021 – Dresner Advisory Services, LLC
26
Finance moved back to the top of the enterprise performance management importance
ratings by function, with 87 percent of finance respondents rating it either “critical,” “very
important,” or “important” (fig. 15). This is most likely due to Finance’s use of enterprise
performance management to help organizations respond to the COVID-19 crisis.
Overall importance rankings are similar for most other functions, ranging from 67-74
percent, showing that most functions regard enterprise performance management as an
important capability.
Strategic planning is the notable exception, with no respondents rating it of “critical”
importance and only 42 percent rating it “very important” or “important.” This is likely
because strategic planning functions frequently use complex spreadsheet-based
systems or other specialized solutions, and there may be an opportunity to explore
replacing these with capabilities in enterprise performance management solutions.
Figure 15 – EPM importance by function
0%
10%
20%
30%
40%
50%
60%
70%
80%
90%
100%
Finance Operations IT BICC ExecutiveManagement
Strategic PlanningFunction
EPM Software Importance by Function
Critical Very Important Important Somewhat Important Not Important
2021 Wisdom of Crowds® EPM Market Study
http://www.dresneradvisory.com Copyright 2021 – Dresner Advisory Services, LLC
27
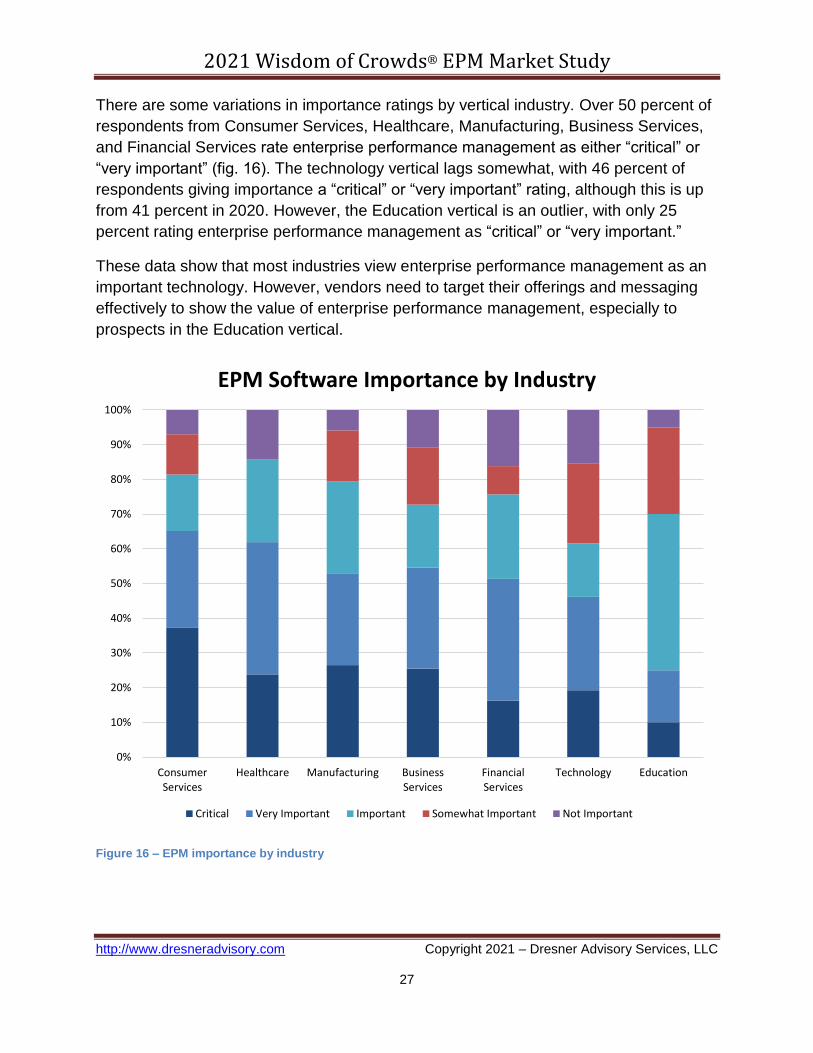
There are some variations in importance ratings by vertical industry. Over 50 percent of
respondents from Consumer Services, Healthcare, Manufacturing, Business Services,
and Financial Services rate enterprise performance management as either “critical” or
“very important” (fig. 16). The technology vertical lags somewhat, with 46 percent of
respondents giving importance a “critical” or “very important” rating, although this is up
from 41 percent in 2020. However, the Education vertical is an outlier, with only 25
percent rating enterprise performance management as “critical” or “very important.”
These data show that most industries view enterprise performance management as an
important technology. However, vendors need to target their offerings and messaging
effectively to show the value of enterprise performance management, especially to
prospects in the Education vertical.
Figure 16 – EPM importance by industry
0%
10%
20%
30%
40%
50%
60%
70%
80%
90%
100%
ConsumerServices
Healthcare Manufacturing BusinessServices
FinancialServices
Technology Education
EPM Software Importance by Industry
Critical Very Important Important Somewhat Important Not Important

2021 Wisdom of Crowds® EPM Market Study
http://www.dresneradvisory.com Copyright 2021 – Dresner Advisory Services, LLC
28
Enterprise Performance Management Implementation Strategy
We asked respondents to identify how they implemented enterprise performance
management (fig. 17). Although its name implies that implementations should always be
deployed at an “enterprise” level, the reality is that many organizations deploy these
solutions as a performance management system at a departmental level. There is
nothing wrong with this, because enterprise performance management software can
deliver a more holistic performance management solution to a business entity such as a
large department or specific operating unit. Often, organizations implement enterprise
performance management in part of their organization before rolling it out more widely.
The survey shows that nearly 32 percent of organizations use enterprise performance
management as a departmental solution, while 68 percent use it at a country, regional,
or global level; this is clear evidence that the majority of organizations use enterprise
performance management to manage significant business entities.
Figure 17 – EPM implementation strategy
36.6%
31.7%
25.0%
6.7%
0%
5%
10%
15%
20%
25%
30%
35%
40%
As the primary solutionfor the entire
organization (where theorganization only
operates in a singlecountry)
At a departmental level inpart of the organization
As a global solution (usedwidely across multiple
regions)
As a regional solution
EPM Implementation Strategy

2021 Wisdom of Crowds® EPM Market Study
http://www.dresneradvisory.com Copyright 2021 – Dresner Advisory Services, LLC
29
The implementation trends of 2020 are largely repeated in 2021 (fig. 18). There is a
slight rise in respondents stating they used enterprise performance management as a
departmental solution, from 30 percent in 2020 to 32 percent in 2021. However, this
does not reverse the significant shift away from departmental solutions observed in
2020. This is further evidence of market maturity.
Figure 18 – EPM implementation strategy, 2019-2021
0%
10%
20%
30%
40%
50%
60%
70%
80%
90%
100%
2019 2020 2021
EPM Implementation Strategy 2019-2021
As a regional solution
As a global solution (used widely across multiple regions)
At a departmental level in part of the organization
As the primary solution for the entire organization (where the organization only operates in a single country)

2021 Wisdom of Crowds® EPM Market Study
http://www.dresneradvisory.com Copyright 2021 – Dresner Advisory Services, LLC
30
Enterprise Performance Management Sourcing Strategy
Fifty-six percent of respondents state their organization uses an enterprise resource
planning (ERP) system. ERP software provides an integrated finance, administrative,
and operational transaction processing environment; and most ERP vendors offer their
own enterprise performance management solutions that complement and extend the
transaction-processing capabilities of ERP software.
ERP vendors can be aggressive in marketing their enterprise performance management
solutions; despite this, most respondents take an objective approach to sourcing these
capabilities. Only around 9 percent of respondents prefer to source enterprise
performance management from their ERP vendor, whereas 26 percent consider all
types of vendors and 65 percent prefer to source these capabilities from a specialist
enterprise performance management vendor (fig. 19).
Figure 19 – EPM sourcing preferences
4.0%
4.8%
16.1%
26.2%
48.8%
0% 10% 20% 30% 40% 50% 60%
We prefer to source Enterprise PerformanceManagement software from the same vendor as our
primary ERP/finance system, even if this is aseparate or acquired product
We prefer to source Enterprise PerformanceManagement software from the same vendor as ourprimary ERP/finance system, but only if it is tightly
integrated with their ERP/finance system (i.e.,…
We prefer to source Enterprise PerformanceManagement software from a specialist vendor that
has a strong partnership with the vendor of ourprimary ERP/finance system
We have no preference; we will consider allpotential vendors
We prefer to source Enterprise PerformanceManagement software from a vendor that
specializes in this software and is open to workingwith any ERP/finance system
EPM Sourcing Preferences

2021 Wisdom of Crowds® EPM Market Study
http://www.dresneradvisory.com Copyright 2021 – Dresner Advisory Services, LLC
31
The 2021 data show a continuing trend towards sourcing of enterprise performance
management solutions from specialist vendors regardless of their affiliation with any
ERP vendor. This increased significantly from 35 percent in 2019 to 42 percent in 2020
and nearly 49 percent in 2021 (fig. 20).
This is important evidence of increasing maturity in the market because specialist EPM
vendors are clearly able to communicate their value proposition and overcome any
potential issues regarding integration with underlying ERP systems.
Figure 20 – EPM sourcing preferences 2019-2021
0%
10%
20%
30%
40%
50%
60%
70%
80%
90%
100%
2019 2020 2021
EPM Sourcing Preferences 2019-2021
Specialist vendor open to working with any ERP/finance system
We have no preference; we will consider all potential vendors
Specialist vendor with a strong partnership with the vendor of primary ERP/finance system
Same vendor as primary ERP/finance system if it is tightly integrated with their ERP/finance system
Same vendor as primary ERP/finance system, even if this is a separate or acquired product

2021 Wisdom of Crowds® EPM Market Study
http://www.dresneradvisory.com Copyright 2021 – Dresner Advisory Services, LLC
32
Organization size does not appear to have a major impact on EPM sourcing strategy
(fig. 21). Although small organizations (1-100 employees) have the highest preference
for enterprise performance management solutions from ERP vendors, their level of
preference for specialist EPM vendors is not significantly different to that of large and
very large organizations (46 percent compared to 52 and 54 percent, respectively).
Mid-sized organizations (101-1,000 employees) have the strongest preference for
solutions from enterprise performance management vendors that have a strong
partnership with ERP vendors (21 percent) but again, their overall preferences are not
significantly different to organizations of other sizes.
Figure 21 – EPM sourcing preferences by organization size
0%
10%
20%
30%
40%
50%
60%
70%
80%
90%
100%
1-100 101-1,000 1,001-10,000 More than 10,000
EPM Sourcing Preferences by Organization Size
Same vendor as primary ERP/finance system, even if this is a separate or acquired product
Same vendor as primary ERP/finance system if it is tightly integrated with their ERP/finance system
Specialist vendor with a strong partnership with the vendor of primary ERP/finance system
We have no preference; we will consider all potential vendors
Specialist vendor open to working with any ERP/finance system

2021 Wisdom of Crowds® EPM Market Study
http://www.dresneradvisory.com Copyright 2021 – Dresner Advisory Services, LLC
33
Respondents in Asia Pacific still show the greatest preference for sourcing enterprise
performance management solutions that are closely aligned with their ERP strategy (fig.
22), but this dropped significantly from 47 percent in 2020 to 18 percent in 2021. There
seems to have been a shift in regional sourcing preferences away from enterprise
performance management solutions closely aligned with ERP vendors. This is evidence
that the enterprise performance management market is maturing on a global basis.
Figure 22 – EPM sourcing preferences by geography
0%
10%
20%
30%
40%
50%
60%
70%
80%
90%
100%
North America Europe, Middle East and Africa Asia Pacific
EPM Sourcing Preferences by Geography
Same vendor as primary ERP/finance system, even if this is a separate or acquired product
Same vendor as primary ERP/finance system if it is tightly integrated with their ERP/finance system
Specialist vendor with a strong partnership with the vendor of primary ERP/finance system
We have no preference; we will consider all potential vendors
Specialist vendor open to working with any ERP/finance system

2021 Wisdom of Crowds® EPM Market Study
http://www.dresneradvisory.com Copyright 2021 – Dresner Advisory Services, LLC
34
Planning Priorities in Enterprise Performance Management
Budgeting and planning capabilities are a foundational aspect of any enterprise
performance management solution. Respondents in our 2021 study rate annual
financial budgets as the most important planning capability (fig. 23), which is consistent
with all our previous studies.
The top three priorities remain unchanged from 2020, and these likely reflect the
capabilities that are most valuable in navigating the COVID-19 crisis. There is an
increased prioritization of strategic planning functions; strategic planning moved up
three places in the rankings to sixth, while linking strategic plans to annual budgets
entered the top ten priorities for the first time. This may reflect an increased interest in
longer-term planning for post COVID-19 recovery scenarios.
Figure 23 – EPM planning priorities
0% 10% 20% 30% 40% 50% 60% 70% 80% 90% 100%
Monte Carlo and Other Statistical Analyses
Model and Plan Optimal Sales Territories and…
Zero-based Budgeting
Optimize Workforce Plans and Staffing to Meet…
Top-down Planning
Product or Customer Profitability Analysis
Project-based Financial Planning and Budgeting
Driver-based Budgeting/Planning
Sales and Operations Planning
Linking Strategic Plans to Annual Budget
Capital Asset Planning and Budgeting
Rolling Forecasts
Revenue / Demand Planning
Strategic Planning (3-5 Years)
Bottom-up Budgeting
Balance Sheet Planning
Headcount, Salary and Compensation Planning
Cash-flow Forecasting/Planning
Annual Financial Budgets
EPM Planning Priorities
Critical Very Important Important Somewhat Important Not Important

2021 Wisdom of Crowds® EPM Market Study
http://www.dresneradvisory.com Copyright 2021 – Dresner Advisory Services, LLC
35
Overall, organization size does not have a major impact on planning and budgeting
priorities (fig. 24). However, small (101-1,000 employees) and mid-sized (101-1,000
employees) organizations attribute lower priority ratings to some capabilities, primarily
capital asset planning, workforce optimization, and project planning. These are clearly
more relevant to larger and more complex organizations.
These data show that organizations of all sizes expect a good range of functional
capabilities in enterprise performance management solutions. Vendors should not
assume that small and mid-sized organizations will be happy with “cut down” enterprise
performance management solutions with limited functionality.
Figure 24 – EPM planning priorities by organization size
1
1.5
2
2.5
3
3.5
4
4.5
5Annual Financial Budgets
Cash-flow Forecasting
Headcount Planning
Balance Sheet Planning
Bottom-up Budgeting
Strategic Planning
Revenue / DemandPlanning
Rolling Forecasts
Capital Asset Planning
Strategy Linked to BudgetsSales and Ops. Planning
Driver-based Planning
Project-based Planning
Top-down Planning
Product Profitability
Workforce Optimization
Zero-based Budgeting
Sales Planning
Monte Carlo Analysis
EPM Planning Priorities by Organization Size
1-100 101-1,000 1,001-10,000 More than 10,000

2021 Wisdom of Crowds® EPM Market Study
http://www.dresneradvisory.com Copyright 2021 – Dresner Advisory Services, LLC
36
The survey reveals some differences in planning prioritization by function (fig. 25).
These reflect each function’s responsibilities; for example, finance and executive
management have the highest prioritization for annual financial budgets, while the
strategic planning function prioritizes both strategic planning capabilities and linking
strategy to budgets.
Executive management increased its prioritization of cash-flow forecasting and balance
sheet planning compared to both its 2020 rankings and those of other functions in 2021.
This likely reflects the increased need for executive management to focus on liquidity
and financing in response to the COVID-19 crisis.
Figure 25 – EPM planning priorities by function
1
1.5
2
2.5
3
3.5
4
4.5
5Annual Financial Budgets
Cash-flow Forecasting
Headcount Planning
Balance Sheet Planning
Bottom-up Budgeting
Strategic Planning
Revenue / Demand Planning
Rolling Forecasts
Capital Asset Planning
Strategy Linked to BudgetsSales and Ops. Planning
Driver-based Planning
Project-based Planning
Top-down Planning
Product Profitability
Workforce Optimization
Zero-based Budgeting
Sales Planning
Monte Carlo Analysis
EPM Planning Priorities by Function
Executive Management Strategic Planning Function Finance BICC IT Operations

2021 Wisdom of Crowds® EPM Market Study
http://www.dresneradvisory.com Copyright 2021 – Dresner Advisory Services, LLC
37
Planning priorities also vary by vertical industry (fig. 26). Although all industries rate
annual financial budgets most important, ratings for many other capabilities vary
according to industry needs. For example, Financial Services organizations prioritize
balance sheet planning because they have many unique needs in managing financial
assets and liabilities. Healthcare respondents prioritize many aspects of planning and
budgeting more highly than other industries. The low rankings for many aspects by
Education respondents reflects the overall low importance rating for enterprise
performance management in this vertical.
Consequently, vendors and implementation partners need to develop appropriate
functional capabilities and implementation templates for their target industries. End
users should evaluate performance management software based on their industry
needs.
Figure 26 – EPM priorities by industry
1
1.5
2
2.5
3
3.5
4
4.5
5Annual Financial Budgets
Cash-flow Forecasting
Headcount Planning
Balance Sheet Planning
Bottom-up Budgeting
Strategic Planning
Revenue / DemandPlanning
Rolling Forecasts
Capital Asset Planning
Strategy Linked to BudgetsSales and Ops. Planning
Driver-based Planning
Project-based Planning
Top-down Planning
Product Profitability
Workforce Optimization
Zero-based Budgeting
Sales Planning
Monte Carlo Analysis
EPM Planning Priorities by Industry
Healthcare Financial Services Technology Business Services
Manufacturing Consumer Services Education

2021 Wisdom of Crowds® EPM Market Study
http://www.dresneradvisory.com Copyright 2021 – Dresner Advisory Services, LLC
38
Use of Rolling Forecasts in Enterprise Performance Management
Rolling forecasts are a method of continuous planning allowing management to look
forward over a specific period, e.g., 12 or 18 months. Organizations revise forecasts
every month or quarter, providing a rolling forward view of predicted performance. This
contrasts with traditional annual budgeting cycles, where the view of future performance
narrows as the year progresses, creating a skew towards short-term goals.
Rolling forecast usage is largely unchanged from 2020 (fig. 27). Sixty-two percent of
respondents use rolling forecasts today (64 percent in 2019), and 14 percent replaced
annual budgets with rolling forecasts (16 percent in 2019).
It appears from this data that rolling forecast adoption has peaked. Dresner Advisory
Services predicted that rolling forecast usage would increase during 2020 to help
navigate the challenges created by the COVID-19 crisis. However, this does not appear
to be the case, and it appears that rolling forecasts will not replace annual budgets as
the primary control mechanism for enterprise performance management.
Figure 27 – Rolling forecast use 2019-2021
0%
10%
20%
30%
40%
50%
60%
70%
80%
90%
100%
2019 2020 2021
Rolling Forecast Use 2019-2021
We do not currently use rolling forecasts and have no plans to use them in future
We do not currently use rolling forecasts, but we will use them at some point in the future
We use rolling forecasts to provide an additional, forward-looking view to complement annual budgets, but westill manage performance against annual budgets
We use rolling forecasts instead of annual budgets to manage performance against plans and targets

2021 Wisdom of Crowds® EPM Market Study
http://www.dresneradvisory.com Copyright 2021 – Dresner Advisory Services, LLC
39
Similar to the 2020 survey, the use of rolling forecasts varies by organization size (fig.
28). Usage patterns are broadly similar for mid-sized (101-1,000 employees), large
(1,001-10,000 employees), and very large (greater than 10,000 employees)
organizations. Unsurprisingly, very large organizations have the highest adoption level
for replacing annual budgets with rolling forecasts (21 percent). Small organizations (1-
100 employees) remain the least likely to adopt rolling forecasts, with 21 percent of
respondents stating they have no plans to adopt.
Figure 28 – Rolling forecast use by organization size
0%
10%
20%
30%
40%
50%
60%
70%
80%
90%
100%
1-100 101-1,000 1,001-10,000 More than 10,000
Rolling Forecast Use by Organization Size
We do not currently use rolling forecasts and have no plans to use them in future
We do not currently use rolling forecasts, but we will use them at some point in the future
We use rolling forecasts to provide an additional, forward-looking view to complement annual budgets, but westill manage performance against annual budgets
We use rolling forecasts instead of annual budgets to manage performance against plans and targets

2021 Wisdom of Crowds® EPM Market Study
http://www.dresneradvisory.com Copyright 2021 – Dresner Advisory Services, LLC
40
Adoption of rolling forecasts does not appear to from part of an overall “best practice”
approach to BI. Twenty-two percent of respondents that are completely successful with
BI have no plans to adopt rolling forecasts, which is higher than the 17 percent of
respondents that are somewhat unsuccessful or unsuccessful with BI and have no
plans to adopt rolling forecasts. Therefore, rolling forecasts are an important capability
for some organizations, but it appears unlikely that traditional approaches to planning
and budgeting will be replaced any time soon.
Figure 29 – Rolling forecast use by success with BI
0%
10%
20%
30%
40%
50%
60%
70%
80%
90%
100%
Completely Successful Somewhat Successful Somewhat Unsuccessful &Unsuccessful
Rolling Forecast Use by Success with BI
We do not currently use rolling forecasts and have no plans to use them in future
We do not currently use rolling forecasts, but we will use them at some point in the future
We use rolling forecasts to provide an additional, forward-looking view to complement annual budgets, but westill manage performance against annual budgets
We use rolling forecasts instead of annual budgets to manage performance against plans and targets

2021 Wisdom of Crowds® EPM Market Study
http://www.dresneradvisory.com Copyright 2021 – Dresner Advisory Services, LLC
41
Enterprise Performance Management and Data Driven Decision Making
Organizations use enterprise performance management software to replace informal
and spreadsheet-based performance management practices and processes, and this
has a clear impact in their approach to decision-making (fig. 30). Fifty-five percent of
organizations that currently use enterprise performance management state that all
decisions are data driven, while 60 percent of organizations in which decisions are
infrequently data driven have no plans to adopt enterprise performance management.
These data show that enterprise performance management can help improve the
quality of decision making in an organization. However, the software on its own does
not guarantee improvements in data-driven decision-making, as 40 percent of
organizations in which decisions are infrequently data driven use EPM. IT professionals
supporting enterprise performance management initiatives should work to ensure EPM
is not simply used as a financial control mechanism but, instead, forms part of a wider
BI strategy.
Figure 30 – EPM software use by data-driven decision-making
0%
10%
20%
30%
40%
50%
60%
70%
80%
90%
100%
All Data-Driven Decisions Mostly Data-DrivenDecisions
Some Data-Driven Decisions Infrequently Data-DrivenDecisions
EPM Software Use by Data-Driven Decision-Making
No, we have no plans to use enterprise performance management software at all
We may use planning and enterprise performance management in the future
We are currently evaluating enterprise performance management software
Yes, we use enterprise performance management software today

2021 Wisdom of Crowds® EPM Market Study
http://www.dresneradvisory.com Copyright 2021 – Dresner Advisory Services, LLC
42
Impact of Artificial Intelligence on Enterprise Performance Management
Artificial intelligence (AI) and machine learning are emerging technologies in enterprise
performance management. Machine learning has the potential to significantly improve
forecast accuracy in planning applications, and it is possible to envisage a new
generation of enterprise performance management applications built on AI platforms.
There is a slight shift in attitudes to AI in 2021, with resistance to AI-based forecasting
and planning softening somewhat (down to 14 percent from 20 percent in 2020) (fig.
31). The split between respondents that see significant potential in AI and machine
learning and those whose users will likely resist its adoption remains. Most respondents
are undecided; 52 percent view the technology as unproven and potentially costly,
making it hard to build a compelling business case. This increased slightly from 49
percent in 2020.
Figure 31 – AI impact on EPM
0%
10%
20%
30%
40%
50%
60%
70%
80%
90%
100%
2019 2020 2021
AI Impact on EPM 2019-2021
Our users are likely to resist the "black box" automation of forecasting and planning processes throughmachine learning and AI
They will have a significant positive impact, likely improving forecast accuracy and further automating time-consuming processes
It's currently hard to see how they will improve our budgeting and planning processes and building a businesscase will be difficult

2021 Wisdom of Crowds® EPM Market Study
http://www.dresneradvisory.com Copyright 2021 – Dresner Advisory Services, LLC
43
There are some significant differences in attitudes to AI and machine learning across
business functions (fig. 32). Operations, IT, and Finance see the biggest potential
impacts (40 percent, 38 percent, and 34 percent, respectively), while strategic planning
has the greatest level of resistance to AI (27 percent) and sees the least benefit (9
percent). This is further evidence that the strategic planning function prefers to use its
own capabilities for planning and forecasting and will likely resist automation of these
using AI in enterprise performance management.
Figure 32 – AI impact on EPM by function
0%
10%
20%
30%
40%
50%
60%
70%
80%
90%
100%
Operations IT BICC Finance ExecutiveManagement
Strategic PlanningFunction
AI Impact on EPM by Function
Our users are likely to resist the "black box" automation of forecasting and planning processes throughmachine learning and AI
It's currently hard to see how they will improve our budgeting and planning processes and building a businesscase will be difficult
They will have a significant positive impact, likely improving forecast accuracy and further automating time-consuming processes

2021 Wisdom of Crowds® EPM Market Study
http://www.dresneradvisory.com Copyright 2021 – Dresner Advisory Services, LLC
44
We also asked respondents how they would source AI and machine learning
capabilities for EPM software (fig. 33). The results show little change in attitudes from
2020. Most organizations expect these capabilities to be bundled in a future release by
enterprise performance management vendors (77 percent in 2021 compared to 75
percent in 2020). The percentage of organizations prepared to be early adopters of AI
and machine learning capabilities is up slightly to 34 percent (31 percent in 2020). This
is encouraging news for enterprise performance management vendors, as success with
early adopters will trigger wider adoption.
Figure 33 – EPM deployment of AI and machine learning 2020-2021
Overall, with 52 percent of respondents uncertain about the business value of machine
learning and AI, and with 77 percent expecting these to be bundled with enterprise
performance management software, there is still a clear opportunity for vendors to
differentiate themselves in the market with machine learning and AI.
0%
10%
20%
30%
40%
50%
60%
70%
80%
90%
100%
2020 2021
EPM Deployment of AI and Machine Learning 2020-2021
We will build it ourselves by employing data scientists and using third-party technologies to add machinelearning and AI capabilities to our existing Enterprise Performance Management software
We expect our enterprise performance management software vendor to provide these capabilities in afuture release of their software and are prepared to be an early adopter
We expect our enterprise performance management (EPM) software vendor to provide these capabilities ina future release of their software but will only use these capabilities when they are proven by other users

2021 Wisdom of Crowds® EPM Market Study
http://www.dresneradvisory.com Copyright 2021 – Dresner Advisory Services, LLC
45
Deployment Options for Enterprise Performance Management
Respondents overall rate cloud deployment options for enterprise performance
management solutions more important than on-premises deployment (fig. 34). In 2021,
private cloud / hosted solutions moved slightly ahead of SaaS / public cloud solutions;
68 percent of respondents rate private cloud / hosted solutions either “critical,” “very
important,” or “important,” compared to 65 percent for SaaS / public cloud. In 2020,
these percentages were 63 percent and 65 percent, respectively.
On-premises deployment in 2021 declines in importance as a deployment option for
enterprise performance management, with 38 percent of respondents rating it “not
important.” This is an increase from 31 percent in 2020.
Figure 34 – Importance of deployment options for EPM
0%
10%
20%
30%
40%
50%
60%
70%
80%
90%
100%
On-premises System SaaS/Public Cloud Service Private Cloud/Hosted Solution
Importance of Deployment Options for EPM
Critical Very Important Important Somewhat Important Not Important

2021 Wisdom of Crowds® EPM Market Study
http://www.dresneradvisory.com Copyright 2021 – Dresner Advisory Services, LLC
46
There are some differences in importance of deployment options by geography (fig. 35).
Respondents from Asia Pacific and North America rate cloud deployment as more
important than on-premises deployment, while the situation is less clear for EMEA.
Respondents from EMEA rate on-premises deployment options as more important than
SaaS / public cloud solutions but slightly less important than private cloud / hosted
solutions.
Figure 35 – Mean importance of deployment options for EPM by geography
1
1.5
2
2.5
3
3.5
4
4.5
5
Asia Pacific North America Europe, Middle East and Africa
Mean Importance of Deployment Options for EPM by Geography
Private Cloud/Hosted Solution SaaS/Public Cloud Service On-premises System

2021 Wisdom of Crowds® EPM Market Study
http://www.dresneradvisory.com Copyright 2021 – Dresner Advisory Services, LLC
47
The importance of cloud as a deployment option also varies by organization size (fig.
36). Small organizations (1-100 employees) and mid-sized organizations (101–1,000
employees) clearly rate SaaS and hosted/private cloud more important than on-
premises deployment, while the difference is less marked for large (1,001–10,000
employees) and very large organizations (more than 10,000 employees).
Overall importance ratings for all deployment options are not high, with few mean
importance ratings greater than 3.5. This implies that deployment capabilities are not a
major factor in enterprise performance management evaluations, and vendors should
be wary of pushing a specific deployment option. Offering cloud deployment options will
not compensate for functional deficiencies in competitive situations.
Figure 36 – Mean importance of EPM deployment options by organization size
1
1.5
2
2.5
3
3.5
4
4.5
5
1-100 101-1,000 1,001-10,000 More than 10,000
Mean Importance of Deployment Options for EPM by Organization Size
Private Cloud/Hosted Solution SaaS/Public Cloud Service On-premises System

2021 Wisdom of Crowds® EPM Market Study
http://www.dresneradvisory.com Copyright 2021 – Dresner Advisory Services, LLC
48
Industry and
Vendor
Analysis

2021 Wisdom of Crowds® EPM Market Study
http://www.dresneradvisory.com Copyright 2021 – Dresner Advisory Services, LLC
49
Industry Capabilities In our 2021 study, we analyzed vendor responses about the functional and architectural
capabilities of their products in the following categories:
Strategy Management – features and functions that support setting high-level goals
and objectives, creating strategic plans (typically higher level and with longer time
horizons than financial and operational plans). They also model the impact of complex
strategic decisions (such as acquiring a company and different corporate financing
strategies) and help senior management connect strategic objectives to financial and
operational activities.
Financial Planning – capabilities that help the CFO and finance team create and
manage financial plans and budgets. These are built using financial logic and frequently
use coding structures found in the general ledger (GL). They need to manage the
accounting conventions of debits and credits and typically follow the format of the
primary financial reports (balance sheet, income statement, and cash-flow statement).
They use these reports to predict likely financial performance and compare it against
actuals.
Operational Planning – features and functions that line-of-business managers use to
help plan their activities using measures and drivers that are relevant to their function.
Examples include workforce planning tools that would be used by the human resources
team, or territory and quota planning tools that would be used by the sales function.
There are many specialist domain planning solutions, but a comprehensive enterprise
performance management solution.
Planning and Budgeting Process Support – capabilities that support the entry,
amendment, review, and approval of plans and budgets of all types.
Planning and Modeling Capabilities – how the solution supports the modeling aspect
of planning and budgeting. This includes forecasting, simulation, and “what-if”
capabilities, along with the flexibility and sophistication of the underlying model or
models.
Data Science and Machine Learning – includes statistics, modeling, machine
learning, and data mining to analyze facts to make predictions about future or otherwise
unknown events. This year we aligned the analysis with the capabilities defined in our
Data Science and Machine Learning Market Study.
Technical Architecture – features of the underlying technical and application
architecture, including delivery models supported and data architecture.

2021 Wisdom of Crowds® EPM Market Study
http://www.dresneradvisory.com Copyright 2021 – Dresner Advisory Services, LLC
50
Industry – Strategy Management Capabilities
Most vendors provide broad support for strategy management capabilities (fig. 37).
However, there are some gaps, and more specialized capabilities like debt vs. equity
financing and mergers and acquisition analysis are not on the product road map for a
minority of vendors.
Strategy management is one of the areas of enterprise performance management that
elevates any implementation beyond a focus on budgeting and planning. Organizations
evaluating enterprise performance management software need to challenge their users,
particularly executive management, to consider how they will leverage this functionality.
Figure 37 – Industry – strategy management capabilities
0%
10%
20%
30%
40%
50%
60%
70%
80%
90%
100%
Ability to define andmonitor strategic,operational and
financialmetrics/KPIs
Strategic goals andmetrics linked to
budgets
Debt vs. equityfinancing analysis
Long-range financialplanning (i.e. 5, 10 -
50 years)
Mergers &acquisitions analysis
Industry - Strategy Management Capabilities
Today 12 Months 24 Months No Plans

2021 Wisdom of Crowds® EPM Market Study
http://www.dresneradvisory.com Copyright 2021 – Dresner Advisory Services, LLC
51
Industry – Financial Planning Capabilities
Financial planning capabilities are primarily intended for the finance function, and the
CFO and finance function requirements heavily influence many enterprise performance
management evaluations. Therefore, it is not surprising that vendors provide good
coverage of capabilities in this area (fig. 38).
However, there are some notable areas where some vendor solutions lack support for
key financial planning activities. For example, some vendors have no plans to support
pre-defined asset and depreciation calculations, and support for industry variants of
financial planning is also lacking. A minority of vendors also lack built-in financial
intelligence, which could add complexity to an implementation.
Organizations evaluating enterprise performance management software must ensure
they clearly define and rank their financial planning requirements, as this will help
differentiate between vendors.
Figure 38 – Industry – financial planning capabilities
0% 10% 20% 30% 40% 50% 60% 70% 80% 90% 100%
Industry-specific financial planning modules
Pre-built asset and depreciation calculations
Built-in financial intelligence
Online data entry at summary and detail levels
Journal entries on budget and forecast scenarios
Enter multiple levels of line item detail
Integrated b/sheet, income and cash flow planning
Financial budgeting for operating expenses
Balance sheet planning & budgeting
Rolling forecasts
Integrate historic data from GL and other systems
Financial statement reporting templates
Forecasts based on actual and budget data
Cash flow modeling and forecasting
Allocate revenue and costs
User-driven reporting tool
Automatic variance and exception reporting
Industry - Financial Planning Capabilities
Today 12 Months 24 Months No Plans

2021 Wisdom of Crowds® EPM Market Study
http://www.dresneradvisory.com Copyright 2021 – Dresner Advisory Services, LLC
52
Industry – Operational Planning Capabilities
Support for operational planning capabilities is fairly broad (fig. 39). However, where
there are gaps, some vendors do not have plans to fill them. This means enterprise
performance management solutions will vary in their operational planning capabilities in
the foreseeable future.
Therefore, organizations looking to source planning capabilities outside financial
planning from an enterprise performance management vendor need to evaluate domain
capabilities closely and consider augmenting an enterprise performance management
solution with a domain specialist solution if these do not go deep enough.
Figure 39 – Industry – operational planning capabilities
0% 10% 20% 30% 40% 50% 60% 70% 80% 90% 100%
Model and plan optimal sales territories & quotas
Supply chain planning
Manufacturing production planning
Headcount, salary and compensation planning
Capital asset planning & budgeting
Optimize workforce plans and staffing to meetdemand
Project-based financial planning & budgeting
Revenue / demand planning
Sales & operations planning
Profitability modelling and analysis for products,customers etc.
Industry - Operational Planning Capabilities
Today 12 Months 24 Months No Plans

2021 Wisdom of Crowds® EPM Market Study
http://www.dresneradvisory.com Copyright 2021 – Dresner Advisory Services, LLC
53
Industry – Budgeting and Planning Process Support
Most vendors provide comprehensive support for the processes that underpin the entry,
amendment, review, and approval of budgets (fig. 40). There are some notable
exceptions. For example, some solutions do not provide Excel data entry or support
uploads from Excel, and vendors do not plan to fill these gaps. This likely reflects the
cloud-based architecture of these systems, but it will likely require a mindset shift on the
part of users to adopt this type of solution (and dropping use of Excel).
Consequently, organizations evaluating enterprise performance management solutions
should not assume that all vendors will meet all their required budgeting and planning
process needs. They may also need to challenge some perceived user needs when
adopting cloud-based enterprise performance management solutions.
Figure 40 – Industry - planning and budgeting process support
0% 10% 20% 30% 40% 50% 60% 70% 80% 90% 100%
Upload existing Excel models
Locking of data and prevention of revisions unless…
Data validation at point of entry
Audit trail/log of all activity and changes
Task lists to guide casual users
Export budgets and plans to other systems and tools
Workflow for reviews and approvals, process status
Excel-based data entry
Textual annotations
Import historic data from external systems
Industry - Planning and Budgeting Process Support
Today 12 Months 24 Months No Plans
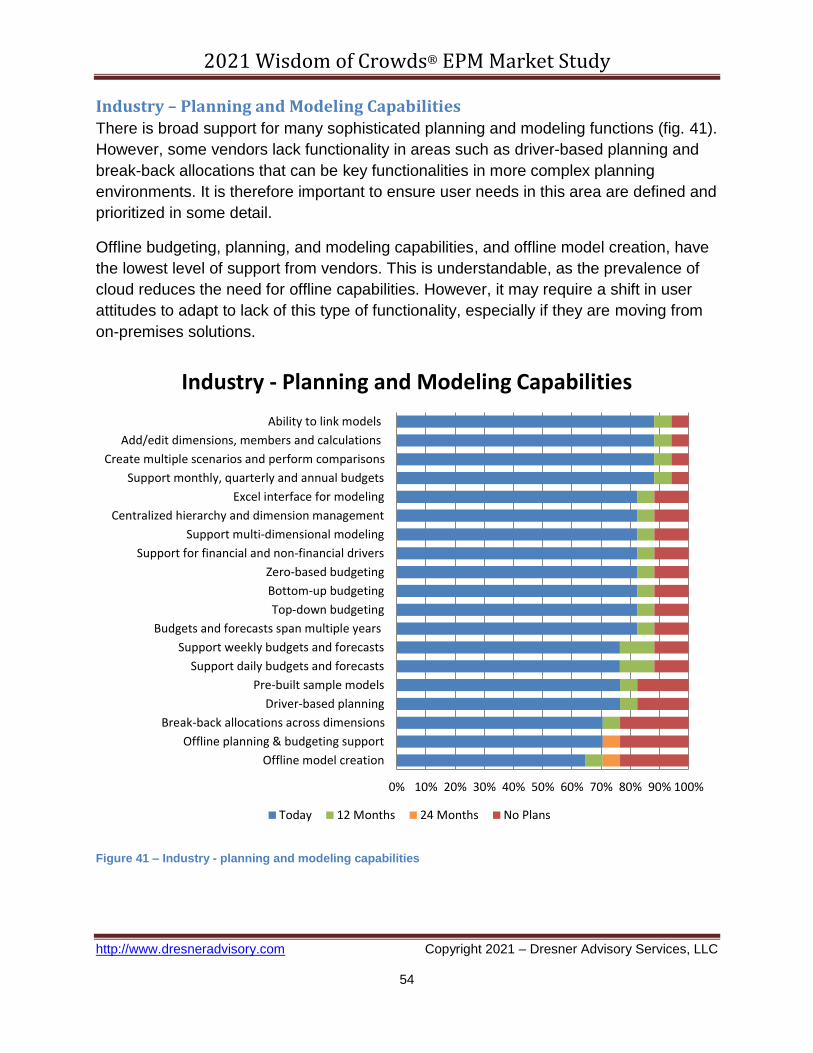
2021 Wisdom of Crowds® EPM Market Study
http://www.dresneradvisory.com Copyright 2021 – Dresner Advisory Services, LLC
54
Industry – Planning and Modeling Capabilities
There is broad support for many sophisticated planning and modeling functions (fig. 41).
However, some vendors lack functionality in areas such as driver-based planning and
break-back allocations that can be key functionalities in more complex planning
environments. It is therefore important to ensure user needs in this area are defined and
prioritized in some detail.
Offline budgeting, planning, and modeling capabilities, and offline model creation, have
the lowest level of support from vendors. This is understandable, as the prevalence of
cloud reduces the need for offline capabilities. However, it may require a shift in user
attitudes to adapt to lack of this type of functionality, especially if they are moving from
on-premises solutions.
Figure 41 – Industry - planning and modeling capabilities
0% 10% 20% 30% 40% 50% 60% 70% 80% 90% 100%
Offline model creation
Offline planning & budgeting support
Break-back allocations across dimensions
Driver-based planning
Pre-built sample models
Support daily budgets and forecasts
Support weekly budgets and forecasts
Budgets and forecasts span multiple years
Top-down budgeting
Bottom-up budgeting
Zero-based budgeting
Support for financial and non-financial drivers
Support multi-dimensional modeling
Centralized hierarchy and dimension management
Excel interface for modeling
Support monthly, quarterly and annual budgets
Create multiple scenarios and perform comparisons
Add/edit dimensions, members and calculations
Ability to link models
Industry - Planning and Modeling Capabilities
Today 12 Months 24 Months No Plans

2021 Wisdom of Crowds® EPM Market Study
http://www.dresneradvisory.com Copyright 2021 – Dresner Advisory Services, LLC
55
Industry – Data Science and Machine Learning
Support for data science and machine learning is currently limited among enterprise
performance management vendors (fig. 42). Only four capabilities are supported by
more than 50 percent of vendors, with the highest level of support for regression models
(78 percent). More advanced capabilities have lower levels of support, but vendors have
many of these capabilities on their road maps for delivery between 12-24 months from
now.
This is understandable because the majority of users are still undecided about the value
of data science and machine learning in enterprise performance management solutions.
Many users may be waiting for vendors to bundle these capabilities with their enterprise
performance management solutions; so, uptake is likely to increase over the next 12-24
months if vendors deliver on their road map intentions.
Figure 42 – Industry - data science and machine learning
0% 10% 20% 30% 40% 50% 60% 70% 80% 90% 100%
Automatic feature selection like principal component analysis(PCA)
Vector machine (SVM) approaches for classification andestimation
Recommendation engine included
Ensemble learning
Bayesian methods, including Naïve Bayes and Bayesian Networks
Geospatial analysis
Text analytic functions and sentiment analysis
Causal analysis
Hierarchical clustering, expectation maximization, k-Means, andvariants of self-organizing maps
Various approaches to CART (e.g., ID3, C4.5, CHAID, MARS,random forests, gradient boosting)
Textbook statistical functions for descriptive statistics
Range of regression models, from linear, logistic to nonlinear
Industry - Data Science and Machine Learning
Today 12 Months 24 Months No Plans

2021 Wisdom of Crowds® EPM Market Study
http://www.dresneradvisory.com Copyright 2021 – Dresner Advisory Services, LLC
56
Industry – Technical Architecture Features
All vendors support core technology capabilities such as automated alerting and access
controls (fig. 43). Also, all vendors now support in-memory databases. Thirteen percent
currently do not support multi-language capabilities but plan to address this within 24
months.
There is a clear split between vendors in terms of deployment capabilities. A minority of
vendors do not offer SaaS / public cloud delivery but likely will offer hosted/private
cloud, while some vendors are “SaaS only” and do not plan to offer hosted/private cloud
or on-premises solutions. Sixty-seven percent of vendors still offer an on-premises
deployment option; so it is clear that vendors will not force their users to move to cloud
in the short term.
Figure 43 – Industry - technical architecture
0% 10% 20% 30% 40% 50% 60% 70% 80% 90% 100%
On-premises deployment
Hosted/private cloud deployment
SaaS / public cloud delivery
Multi-language support
In-memory database support
Access control based on users and roles
Automated alerts and notifications, including emailalerting
Industry - Technical Architecture
Today 12-months 24-months No plans
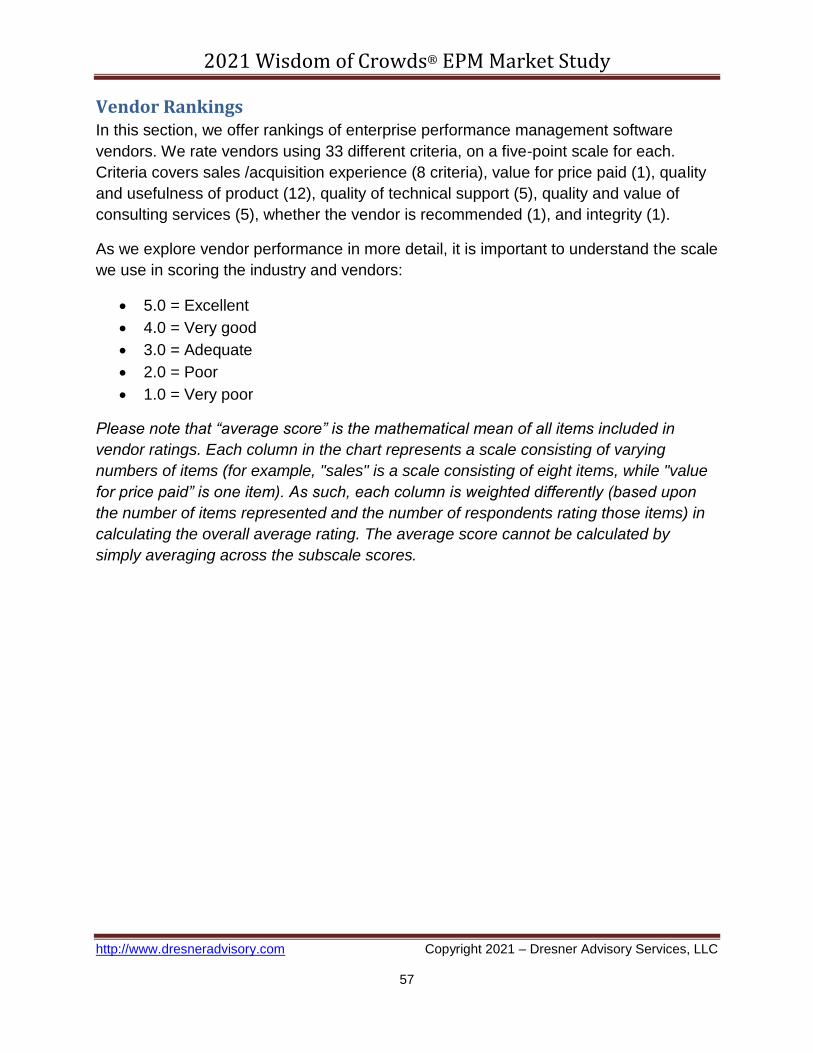
2021 Wisdom of Crowds® EPM Market Study
http://www.dresneradvisory.com Copyright 2021 – Dresner Advisory Services, LLC
57
Vendor Rankings In this section, we offer rankings of enterprise performance management software
vendors. We rate vendors using 33 different criteria, on a five-point scale for each.
Criteria covers sales /acquisition experience (8 criteria), value for price paid (1), quality
and usefulness of product (12), quality of technical support (5), quality and value of
consulting services (5), whether the vendor is recommended (1), and integrity (1).
As we explore vendor performance in more detail, it is important to understand the scale
we use in scoring the industry and vendors:
5.0 = Excellent
4.0 = Very good
3.0 = Adequate
2.0 = Poor
1.0 = Very poor
Please note that “average score” is the mathematical mean of all items included in
vendor ratings. Each column in the chart represents a scale consisting of varying
numbers of items (for example, "sales" is a scale consisting of eight items, while "value
for price paid” is one item). As such, each column is weighted differently (based upon
the number of items represented and the number of respondents rating those items) in
calculating the overall average rating. The average score cannot be calculated by
simply averaging across the subscale scores.

2021 Wisdom of Crowds® EPM Market Study
http://www.dresneradvisory.com Copyright 2021 – Dresner Advisory Services, LLC
58
Enterprise Performance Management Market Models
In 2015, we developed two new models for examining and understanding markets.
Using quadrants, we plotted aggregated user sentiment into x and y axes.
Customer Experience Model
The customer experience model considers the real-world experience of customers
working with EPM products daily (fig. 44). For the x axis, we combine all vendor touch
points—including the sales and acquisition process (8 measures), technical support (5
measures), and consulting services (5 measures)—into a single “sales and service”
dimension. On the y axis, we plot customer sentiment surrounding product, derived from
the 12 product and technology measures used to rank vendors. On the resulting four
quadrants, we plot vendors based on these measures.
The upper-right quadrant contains the highest-scoring vendors and is named “overall
experience leaders.” Technology leaders (upper-left quadrant) identifies vendors with
strong product offerings but relatively lower services scores. Contenders (lower-left
quadrant) would benefit from varying degrees of improvement to product, services, or
both.
User sentiment surrounding outliers (outside of the four quadrants) suggests that
significant improvements are required to product and services.

2021 Wisdom of Crowds® EPM Market Study
http://www.dresneradvisory.com Copyright 2021 – Dresner Advisory Services, LLC
59
Figure 44 – Customer experience model

2021 Wisdom of Crowds® EPM Market Study
http://www.dresneradvisory.com Copyright 2021 – Dresner Advisory Services, LLC
60
Vendor Credibility Model
The vendor credibility model considers how customers “feel” about their vendor (fig. 45).
The x axis plots perceived value for the price paid. The y axis combines the integrity
and recommend measures, creating a “confidence” dimension. The resulting four
quadrants position vendors based on these dimensions.
The upper-right quadrant contains the highest-scoring vendors and is named “credibility
leaders.” Trust leaders (upper-left quadrant) identifies vendors with solid perceived
confidence but relatively lower value scores. Contenders (lower-left quadrant) would
benefit by working to improve customer value, confidence, or both.
User sentiment surrounding outliers (outside of the four quadrants) suggests that
significant improvements are required to improve perceived value and confidence.
Figure 45 – Vendor credibility model

2021 Wisdom of Crowds® EPM Market Study
http://www.dresneradvisory.com Copyright 2021 – Dresner Advisory Services, LLC
61
Detailed Vendor Ratings In this section, we offer detailed vendor scores. Using our 33-criteria evaluation model
(table 1), we compare each vendor’s performance to its previous year’s performance
and to the average for all vendors (all records in the study population).
The detailed criteria are below. We add “clock” position information to assist in locating
specific scores.
In most cases we present two years of vendor performance details. For vendors that
were not included in the 2020 report, only 2021 ratings are shown.
Table 1 - Detailed vendor rating criteria
- Sales/acquisition experience(12 - 2 o’clock)
o Professionalism o Product knowledge o Understanding our
business/needs o Responsiveness o Flexibility/accommodation o Business practices o Contractual terms and
conditions o Follow-up after the sale
- Value for price (3 o’clock)
- Quality and usefulness of product
(3 - 7 o’clock) o Robustness/sophistication of
technology o Completeness of functionality o Reliability of technology o Scalability o Integration of components
within product o Integration with third-party
technologies o Overall usability o Ease of installation o Ease of administration
- Quality and usefulness of product (continued)
o Customization and extensibility
o Ease of upgrade/migration to new versions
o Online forums and documentation
- - Quality of technical support
(8 - 9 o’clock) o Professionalism o Product knowledge o Responsiveness o Continuity of personnel o Time to resolve problems
- Quality and value of consulting
services (9 - 10 o’clock) o Professionalism o Product knowledge o Experience o Continuity o Value
- Integrity (11 o’clock)
- Whether vendor is
recommended (12 o’clock)

2021 Wisdom of Crowds® EPM Market Study
http://www.dresneradvisory.com Copyright 2021 – Dresner Advisory Services, LLC
62
Anaplan Detailed Score
Figure 46 – Anaplan detailed score
For 2021, Anaplan’s scores are generally in line with or above the overall sample. It is
considered an Overall Leader in the Customer Experience Model and a Trust Leader in
the Vendor Credibility Model. It has a perfect recommend score.
1.0
1.5
2.0
2.5
3.0
3.5
4.0
4.5
5.0Sales: professionalism
Product knowledgeUnderstanding our…
Responsiveness
Flexibility/accommodation
Business practices
Contractual terms and…
Follow up after the sale
Value
Product: robustness/…
Completeness of…
Reliability of technology
Scalability
Integration of…
Integration with third-…Overall usability
Ease of installationEase of administrationCustomization and…
Ease of…
Online training, forums…
Support: professionalism
Product knowledge
Responsiveness
Continuity of personnel
Time to resolve problems
Consult: professionalism
Product knowledge
Experience
Continuity
Value
IntegrityRecommend
Anaplan
Anaplan 2021 Overall Sample

2021 Wisdom of Crowds® EPM Market Study
http://www.dresneradvisory.com Copyright 2021 – Dresner Advisory Services, LLC
63
Board International Detailed Score
Figure 47 – Board International detailed score
For 2021, Board International’s scores remain above the overall sample, with key
improvements across most categories of measurement compared to 2020, including
value, product, support, and consulting. It is an Overall Leader in the Customer
Experience Model and a Trust Leader in the Vendor Credibility Model. It maintains a
perfect recommend score.
1.0
1.5
2.0
2.5
3.0
3.5
4.0
4.5
5.0Sales: professionalism
Product knowledgeUnderstanding our…
Responsiveness
Flexibility/accommodation
Business practices
Contractual terms and…
Follow up after the sale
Value
Product: robustness/…
Completeness of…
Reliability of technology
Scalability
Integration of…
Integration with third-…Overall usability
Ease of installationEase of administrationCustomization and…
Ease of…
Online training, forums…
Support: professionalism
Product knowledge
Responsiveness
Continuity of personnel
Time to resolve problems
Consult: professionalism
Product knowledge
Experience
Continuity
Value
IntegrityRecommend
Board
Board 2020 Board 2021 Overall Sample
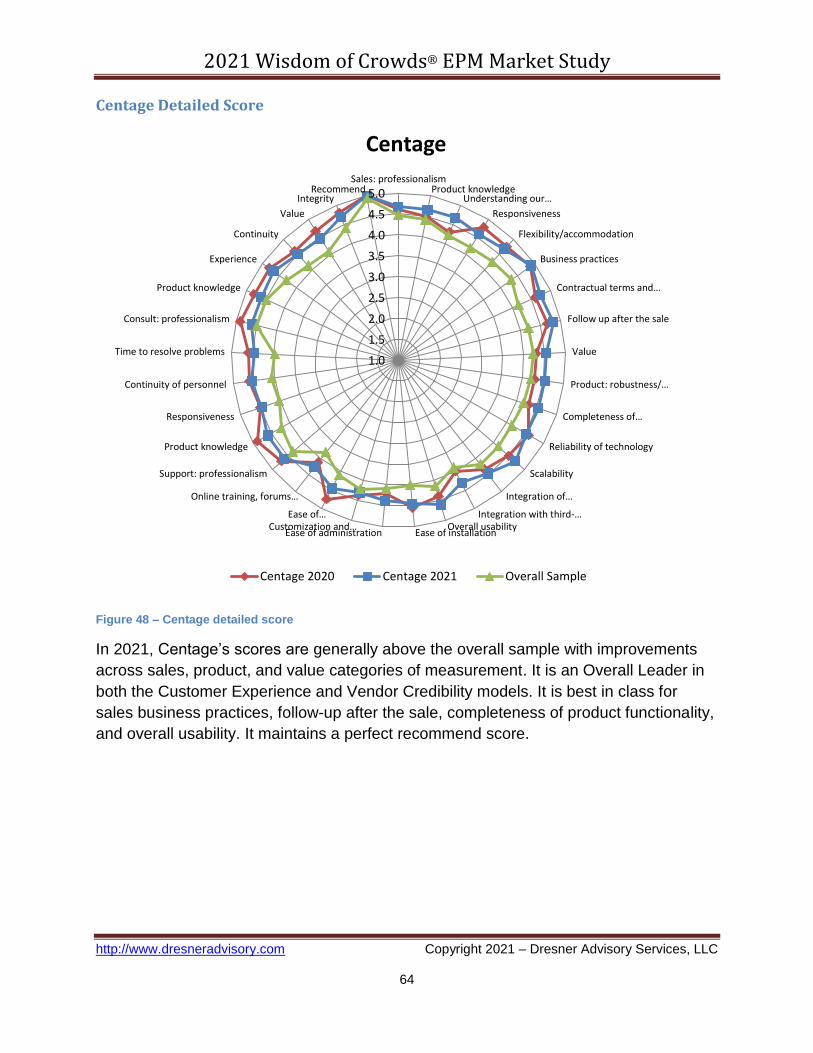
2021 Wisdom of Crowds® EPM Market Study
http://www.dresneradvisory.com Copyright 2021 – Dresner Advisory Services, LLC
64
Centage Detailed Score
Figure 48 – Centage detailed score
In 2021, Centage’s scores are generally above the overall sample with improvements
across sales, product, and value categories of measurement. It is an Overall Leader in
both the Customer Experience and Vendor Credibility models. It is best in class for
sales business practices, follow-up after the sale, completeness of product functionality,
and overall usability. It maintains a perfect recommend score.
1.0
1.5
2.0
2.5
3.0
3.5
4.0
4.5
5.0Sales: professionalism
Product knowledgeUnderstanding our…
Responsiveness
Flexibility/accommodation
Business practices
Contractual terms and…
Follow up after the sale
Value
Product: robustness/…
Completeness of…
Reliability of technology
Scalability
Integration of…
Integration with third-…Overall usability
Ease of installationEase of administrationCustomization and…
Ease of…
Online training, forums…
Support: professionalism
Product knowledge
Responsiveness
Continuity of personnel
Time to resolve problems
Consult: professionalism
Product knowledge
Experience
Continuity
Value
IntegrityRecommend
Centage
Centage 2020 Centage 2021 Overall Sample
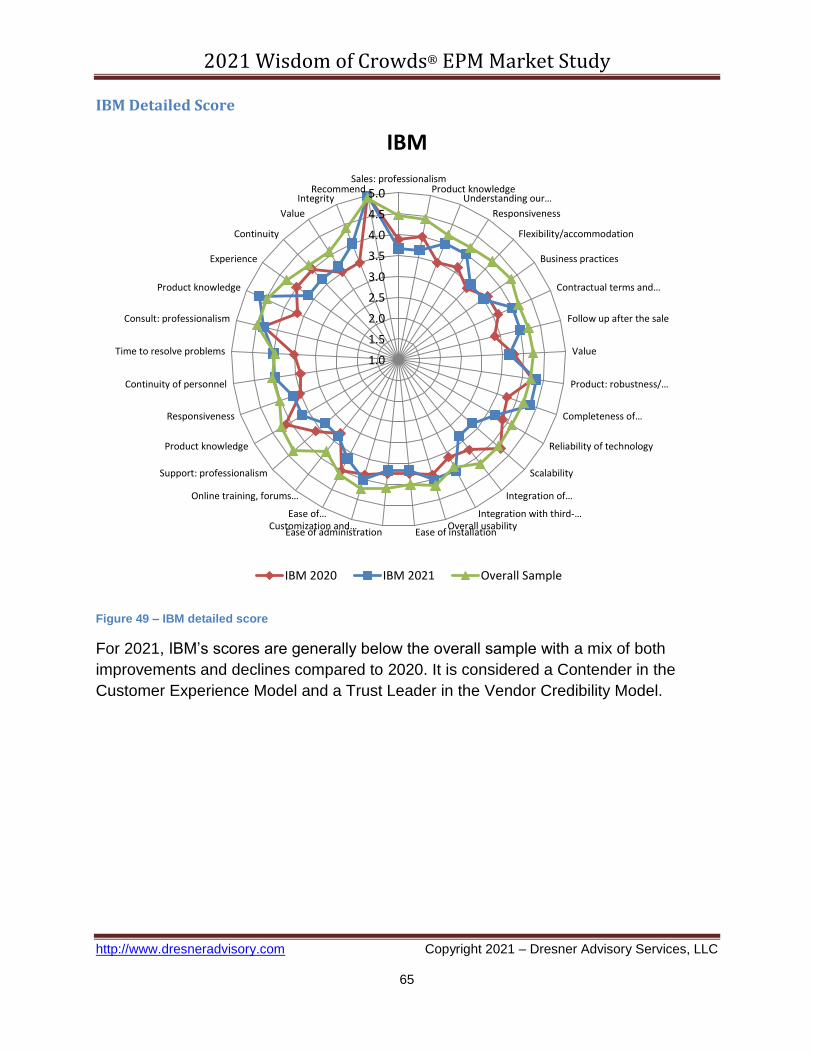
2021 Wisdom of Crowds® EPM Market Study
http://www.dresneradvisory.com Copyright 2021 – Dresner Advisory Services, LLC
65
IBM Detailed Score
Figure 49 – IBM detailed score
For 2021, IBM’s scores are generally below the overall sample with a mix of both
improvements and declines compared to 2020. It is considered a Contender in the
Customer Experience Model and a Trust Leader in the Vendor Credibility Model.
1.0
1.5
2.0
2.5
3.0
3.5
4.0
4.5
5.0Sales: professionalism
Product knowledgeUnderstanding our…
Responsiveness
Flexibility/accommodation
Business practices
Contractual terms and…
Follow up after the sale
Value
Product: robustness/…
Completeness of…
Reliability of technology
Scalability
Integration of…
Integration with third-…Overall usability
Ease of installationEase of administrationCustomization and…
Ease of…
Online training, forums…
Support: professionalism
Product knowledge
Responsiveness
Continuity of personnel
Time to resolve problems
Consult: professionalism
Product knowledge
Experience
Continuity
Value
IntegrityRecommend
IBM
IBM 2020 IBM 2021 Overall Sample

2021 Wisdom of Crowds® EPM Market Study
http://www.dresneradvisory.com Copyright 2021 – Dresner Advisory Services, LLC
66
Jedox Detailed Score
Figure 50 – Jedox detailed score
For 2021, Jedox is generally above the overall sample, with improvements across most
categories of measurement. It is an Overall Leader in both the Customer Experience
and Vendor Credibility Models. It is best in class for integration with third-party
technology and maintains a perfect recommend score.
1.0
1.5
2.0
2.5
3.0
3.5
4.0
4.5
5.0Sales: professionalism
Product knowledgeUnderstanding our…
Responsiveness
Flexibility/accommodation
Business practices
Contractual terms and…
Follow up after the sale
Value
Product: robustness/…
Completeness of…
Reliability of technology
Scalability
Integration of…
Integration with third-…Overall usability
Ease of installationEase of administrationCustomization and…
Ease of…
Online training, forums…
Support: professionalism
Product knowledge
Responsiveness
Continuity of personnel
Time to resolve problems
Consult: professionalism
Product knowledge
Experience
Continuity
Value
IntegrityRecommend
Jedox
Jedox 2020 Jedox 2021 Overall Sample

2021 Wisdom of Crowds® EPM Market Study
http://www.dresneradvisory.com Copyright 2021 – Dresner Advisory Services, LLC
67
OneStream Detailed Score
Figure 51 – OneStream detailed score
In 2021, OneStream remains consistently above the overall sample for all measures
and is an Overall Leader in the Customer Experience and Vendor Credibility models. It
is best in class for product robustness/sophistication of technology, reliability, scalability,
ease of upgrade/migration to new versions, support professionalism, support product
knowledge, support responsiveness, and time to resolve problems. It maintains a
perfect recommend score.
1.0
1.5
2.0
2.5
3.0
3.5
4.0
4.5
5.0Sales: professionalism
Product knowledgeUnderstanding our…
Responsiveness
Flexibility/accommodation
Business practices
Contractual terms and…
Follow up after the sale
Value
Product: robustness/…
Completeness of…
Reliability of technology
Scalability
Integration of…
Integration with third-…Overall usability
Ease of installationEase of administrationCustomization and…
Ease of…
Online training, forums…
Support: professionalism
Product knowledge
Responsiveness
Continuity of personnel
Time to resolve problems
Consult: professionalism
Product knowledge
Experience
Continuity
Value
IntegrityRecommend
OneStream
OneStream 2020 OneStream 2021 Overall Sample

2021 Wisdom of Crowds® EPM Market Study
http://www.dresneradvisory.com Copyright 2021 – Dresner Advisory Services, LLC
68
Oracle Detailed Score
Figure 52 – Oracle detailed score
In 2021, Oracle’s scores remain generally below the overall sample, with improvements
across all measures and its overall score compared to 2020. It is considered a
Technology Leader in the Customer Experience Model and a Contender in the Vendor
Credibility Model.
1.0
1.5
2.0
2.5
3.0
3.5
4.0
4.5
5.0Sales: professionalism
Product knowledgeUnderstanding our…
Responsiveness
Flexibility/accommodation
Business practices
Contractual terms and…
Follow up after the sale
Value
Product: robustness/…
Completeness of…
Reliability of technology
Scalability
Integration of…
Integration with third-…Overall usability
Ease of installationEase of administrationCustomization and…
Ease of…
Online training, forums…
Support: professionalism
Product knowledge
Responsiveness
Continuity of personnel
Time to resolve problems
Consult: professionalism
Product knowledge
Experience
Continuity
Value
IntegrityRecommend
Oracle
Oracle 2020 Oracle 2021 Overall Sample

2021 Wisdom of Crowds® EPM Market Study
http://www.dresneradvisory.com Copyright 2021 – Dresner Advisory Services, LLC
69
Planful Detailed Score
Figure 53 – Planful detailed score
In 2021, Planful has scores that remain well above the overall sample and has
improvements in both sales and technical support measures. It is an Overall Leader in
the Customer Experience Model and a Trust Leader in the Vendor Credibility Model. It
is best in class for sales professionalism and product knowledge, and online training,
forums and documentation. It maintains a perfect recommend score.
1.0
1.5
2.0
2.5
3.0
3.5
4.0
4.5
5.0Sales: professionalism
Product knowledgeUnderstanding our…
Responsiveness
Flexibility/accommodation
Business practices
Contractual terms and…
Follow up after the sale
Value
Product: robustness/…
Completeness of…
Reliability of technology
Scalability
Integration of…
Integration with third-…Overall usability
Ease of installationEase of administrationCustomization and…
Ease of…
Online training, forums…
Support: professionalism
Product knowledge
Responsiveness
Continuity of personnel
Time to resolve problems
Consult: professionalism
Product knowledge
Experience
Continuity
Value
IntegrityRecommend
Planful
Planful 2020 Planful 2021 Overall Sample

2021 Wisdom of Crowds® EPM Market Study
http://www.dresneradvisory.com Copyright 2021 – Dresner Advisory Services, LLC
70
Prophix Detailed Score
Figure 54 – Prophix detailed score
With scores consistently above the overall sample, Prophix is an Overall Leader in both
Customer Experience and Vendor Credibility models. It is best in class for
understanding customer business/needs, sales responsiveness, sales
flexibility/accommodation, and contractual terms and conditions, product ease of
installation, and ease of administration, support continuity of personnel, all consulting
measures, and overall integrity. It maintains a perfect recommend score.
1.0
1.5
2.0
2.5
3.0
3.5
4.0
4.5
5.0Sales: professionalism
Product knowledgeUnderstanding our…
Responsiveness
Flexibility/accommodation
Business practices
Contractual terms and…
Follow up after the sale
Value
Product: robustness/…
Completeness of…
Reliability of technology
Scalability
Integration of…
Integration with third-…Overall usability
Ease of installationEase of administrationCustomization and…
Ease of…
Online training, forums…
Support: professionalism
Product knowledge
Responsiveness
Continuity of personnel
Time to resolve problems
Consult: professionalism
Product knowledge
Experience
Continuity
Value
IntegrityRecommend
Prophix
Prophix 2020 Prophix 2021 Overall Sample

2021 Wisdom of Crowds® EPM Market Study
http://www.dresneradvisory.com Copyright 2021 – Dresner Advisory Services, LLC
71
SAP Detailed Score
Figure 55 – SAP detailed score
In 2021, SAP’s scores improved across most measures, and it is generally in line with
or somewhat below the overall sample. It is considered a Service Leader in the
Customer Experience Model and an outlier in the Vendor Credibility Model.
1.0
1.5
2.0
2.5
3.0
3.5
4.0
4.5
5.0Sales: professionalism
Product knowledgeUnderstanding our…
Responsiveness
Flexibility/accommodation
Business practices
Contractual terms and…
Follow up after the sale
Value
Product: robustness/…
Completeness of…
Reliability of technology
Scalability
Integration of…
Integration with third-…Overall usability
Ease of installationEase of administrationCustomization and…
Ease of…
Online training, forums…
Support: professionalism
Product knowledge
Responsiveness
Continuity of personnel
Time to resolve problems
Consult: professionalism
Product knowledge
Experience
Continuity
Value
IntegrityRecommend
SAP
SAP 2020 SAP 2021 Overall Sample

2021 Wisdom of Crowds® EPM Market Study
http://www.dresneradvisory.com Copyright 2021 – Dresner Advisory Services, LLC
72
Solver Detailed Score
Figure 56 – Solver detailed score
For 2021, Solver’s scores remain generally in line with the overall sample with some
improvements in value and product and declines in technical support. It is considered
an Overall Leader in both the Customer Experience and Vendor Credibility Models and
maintains a perfect recommend score.
1.0
1.5
2.0
2.5
3.0
3.5
4.0
4.5
5.0Sales: professionalism
Product knowledgeUnderstanding our…
Responsiveness
Flexibility/accommodation
Business practices
Contractual terms and…
Follow up after the sale
Value
Product: robustness/…
Completeness of…
Reliability of technology
Scalability
Integration of…
Integration with third-…Overall usability
Ease of installationEase of administrationCustomization and…
Ease of…
Online training, forums…
Support: professionalism
Product knowledge
Responsiveness
Continuity of personnel
Time to resolve problems
Consult: professionalism
Product knowledge
Experience
Continuity
Value
IntegrityRecommend
Solver
Solver 2020 Solver 2021 Overall Sample

2021 Wisdom of Crowds® EPM Market Study
http://www.dresneradvisory.com Copyright 2021 – Dresner Advisory Services, LLC
73
Syntellis Detailed Score
Figure 57 – Syntellis detailed score
In its first year of coverage, Syntellis scores generally in line with or slightly below the
overall sample. It is considered a Contender in the Customer Experience Model and an
Overall Leader in the Vendor Credibility Model. It has a perfect recommend score.
1.0
1.5
2.0
2.5
3.0
3.5
4.0
4.5
5.0Sales: professionalism
Product knowledgeUnderstanding our…
Responsiveness
Flexibility/accommodation
Business practices
Contractual terms and…
Follow up after the sale
Value
Product: robustness/…
Completeness of…
Reliability of technology
Scalability
Integration of…
Integration with third-…Overall usability
Ease of installationEase of administrationCustomization and…
Ease of…
Online training, forums…
Support: professionalism
Product knowledge
Responsiveness
Continuity of personnel
Time to resolve problems
Consult: professionalism
Product knowledge
Experience
Continuity
Value
IntegrityRecommend
Syntellis
Syntellis 2021 Overall Sample

2021 Wisdom of Crowds® EPM Market Study
http://www.dresneradvisory.com Copyright 2021 – Dresner Advisory Services, LLC
74
Unit4 Detailed Score
Figure 58 – Detailed score for Unit4
In its first year of coverage, Unit4 is generally in line with the overall sample and is best
in class for product customization and extensibility. It is considered an Overall Leader in
both Customer Experience and Vendor Credibility models and has a perfect
recommend score.
1.0
1.5
2.0
2.5
3.0
3.5
4.0
4.5
5.0Sales: professionalism
Product knowledgeUnderstanding our…
Responsiveness
Flexibility/accommodation
Business practices
Contractual terms and…
Follow up after the sale
Value
Product: robustness/…
Completeness of…
Reliability of technology
Scalability
Integration of…
Integration with third-…Overall usability
Ease of installationEase of administrationCustomization and…
Ease of…
Online training, forums…
Support: professionalism
Product knowledge
Responsiveness
Continuity of personnel
Time to resolve problems
Consult: professionalism
Product knowledge
Experience
Continuity
Value
IntegrityRecommend
Unit4
Unit4 2021 Overall Sample
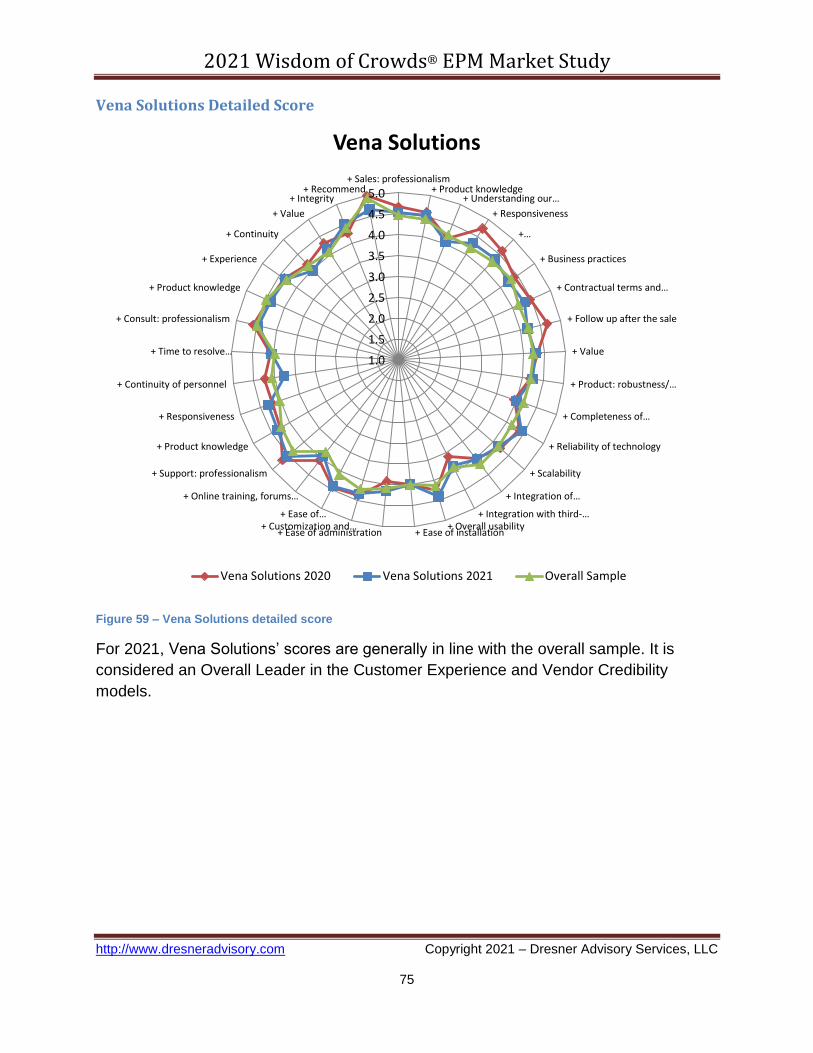
2021 Wisdom of Crowds® EPM Market Study
http://www.dresneradvisory.com Copyright 2021 – Dresner Advisory Services, LLC
75
Vena Solutions Detailed Score
Figure 59 – Vena Solutions detailed score
For 2021, Vena Solutions’ scores are generally in line with the overall sample. It is
considered an Overall Leader in the Customer Experience and Vendor Credibility
models.
1.0
1.5
2.0
2.5
3.0
3.5
4.0
4.5
5.0+ Sales: professionalism
+ Product knowledge+ Understanding our…
+ Responsiveness
+…
+ Business practices
+ Contractual terms and…
+ Follow up after the sale
+ Value
+ Product: robustness/…
+ Completeness of…
+ Reliability of technology
+ Scalability
+ Integration of…
+ Integration with third-…+ Overall usability
+ Ease of installation+ Ease of administration+ Customization and…
+ Ease of…
+ Online training, forums…
+ Support: professionalism
+ Product knowledge
+ Responsiveness
+ Continuity of personnel
+ Time to resolve…
+ Consult: professionalism
+ Product knowledge
+ Experience
+ Continuity
+ Value
+ Integrity+ Recommend
Vena Solutions
Vena Solutions 2020 Vena Solutions 2021 Overall Sample

2021 Wisdom of Crowds® EPM Market Study
http://www.dresneradvisory.com Copyright 2021 – Dresner Advisory Services, LLC
76
Wolters Kluwer (CCH Tagetik) Detailed Score
Figure 60 – Wolters Kluwer (CCH Tagetik) detailed score
In its first year of coverage, Wolters Kluwer (CCH Tagetik) scores generally above the
overall sample and is considered best in class for value. It is an Overall Leader in both
Customer Experience and Vendor Credibility models and has a perfect recommend
score.
1.0
1.5
2.0
2.5
3.0
3.5
4.0
4.5
5.0Sales: professionalism
Product knowledgeUnderstanding our…
Responsiveness
Flexibility/accommodation
Business practices
Contractual terms and…
Follow up after the sale
Value
Product: robustness/…
Completeness of…
Reliability of technology
Scalability
Integration of…
Integration with third-…Overall usability
Ease of installationEase of administrationCustomization and…
Ease of…
Online training, forums…
Support: professionalism
Product knowledge
Responsiveness
Continuity of personnel
Time to resolve problems
Consult: professionalism
Product knowledge
Experience
Continuity
Value
IntegrityRecommend
Wolters Kluwer (CCH Tagetik)
Wolters Kluwer 2021 Overall Sample
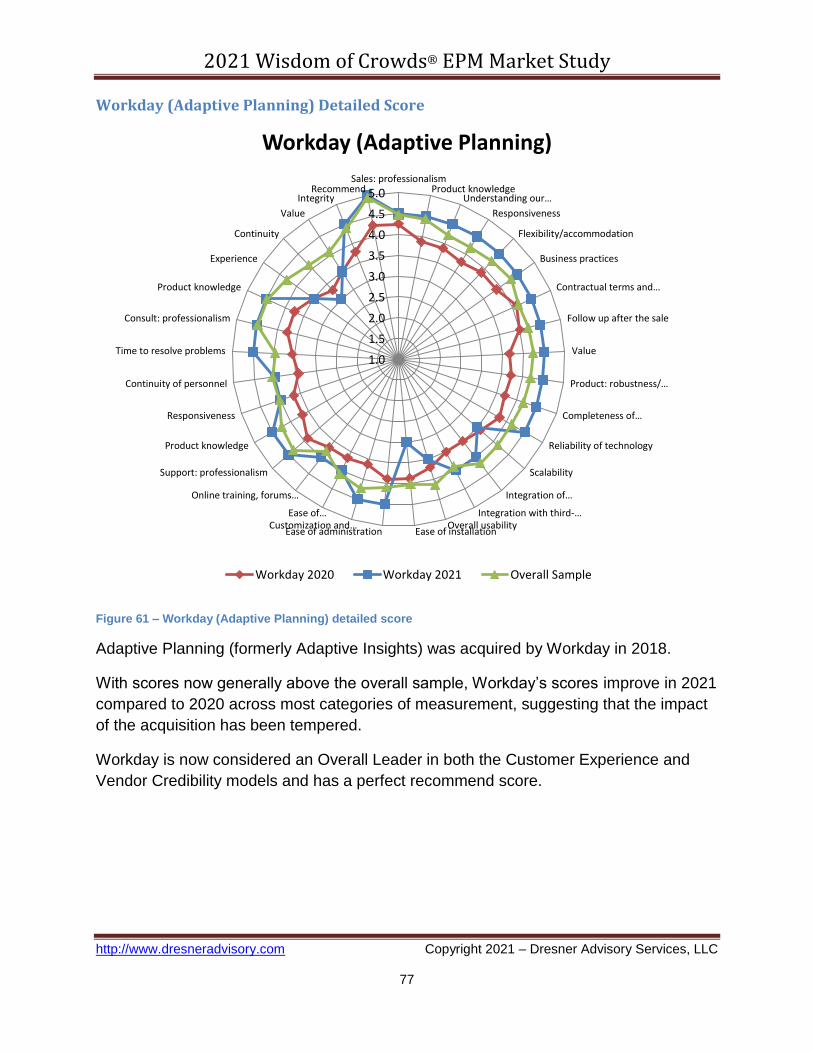
2021 Wisdom of Crowds® EPM Market Study
http://www.dresneradvisory.com Copyright 2021 – Dresner Advisory Services, LLC
77
Workday (Adaptive Planning) Detailed Score
Figure 61 – Workday (Adaptive Planning) detailed score
Adaptive Planning (formerly Adaptive Insights) was acquired by Workday in 2018.
With scores now generally above the overall sample, Workday’s scores improve in 2021
compared to 2020 across most categories of measurement, suggesting that the impact
of the acquisition has been tempered.
Workday is now considered an Overall Leader in both the Customer Experience and
Vendor Credibility models and has a perfect recommend score.
1.0
1.5
2.0
2.5
3.0
3.5
4.0
4.5
5.0Sales: professionalism
Product knowledgeUnderstanding our…
Responsiveness
Flexibility/accommodation
Business practices
Contractual terms and…
Follow up after the sale
Value
Product: robustness/…
Completeness of…
Reliability of technology
Scalability
Integration of…
Integration with third-…Overall usability
Ease of installationEase of administrationCustomization and…
Ease of…
Online training, forums…
Support: professionalism
Product knowledge
Responsiveness
Continuity of personnel
Time to resolve problems
Consult: professionalism
Product knowledge
Experience
Continuity
Value
IntegrityRecommend
Workday (Adaptive Planning)
Workday 2020 Workday 2021 Overall Sample

2021 Wisdom of Crowds® EPM Market Study
http://www.dresneradvisory.com Copyright 2021 – Dresner Advisory Services, LLC
78
Other Dresner Advisory Services Research Reports
- Wisdom of Crowds® “Flagship” Business Intelligence Market Study
- Analytical Data Infrastructure
- BI Competency Center
- Big Data Analytics
- Cloud Computing and Business Intelligence
- Data Catalog
- Data Pipelines and Integration
- Data Preparation
- Data Science and Machine Learning
- Embedded Business Intelligence
- Guided Analytics
- Natural Language Analytics
- Sales Performance Management
- Self-Service Business Intelligence
- Small and Mid-Sized Enterprise Business Intelligence
- Small and Mid-Sized Enterprise Performance Management

2021 Wisdom of Crowds® EPM Market Study
http://www.dresneradvisory.com Copyright 2021 – Dresner Advisory Services, LLC
79
Appendix - The 2021 Wisdom of Crowds® Enterprise Performance
Management Survey Instrument
Please enter your contact information below
First Name*: _________________________________________________
Last Name*: _________________________________________________
Title: _________________________________________________
Company Name*: _________________________________________________
Street Address: _________________________________________________
City: _________________________________________________
State: _________________________________________________
Zip: _________________________________________________
Country: _________________________________________________
Email Address*: _________________________________________________
Phone Number: _________________________________________________
URL: _________________________________________________
May we contact you to discuss your responses and for additional information?
( ) Yes
( ) No
What major geography do you reside in?*
( ) North America
( ) Europe, Middle East and Africa
( ) Latin America
( ) Asia Pacific

2021 Wisdom of Crowds® EPM Market Study
http://www.dresneradvisory.com Copyright 2021 – Dresner Advisory Services, LLC
80
Please identify your primary industry*
( ) Advertising
( ) Aerospace
( ) Agriculture
( ) Apparel & Accessories
( ) Automotive
( ) Aviation
( ) Biotechnology
( ) Broadcasting
( ) Business Services
( ) Chemical
( ) Construction
( ) Consulting
( ) Consumer Products
( ) Defense
( ) Distribution & Logistics
( ) Education (Higher Ed)
( ) Education (K-12)
( ) Energy
( ) Entertainment and Leisure
( ) Executive search
( ) Federal Government
( ) Financial Services

2021 Wisdom of Crowds® EPM Market Study
http://www.dresneradvisory.com Copyright 2021 – Dresner Advisory Services, LLC
81
( ) Food, Beverage and Tobacco
( ) Healthcare (Payer)
( ) Healthcare (Provider)
( ) Hospitality
( ) Insurance
( ) Legal
( ) Manufacturing
( ) Mining
( ) Motion Picture and Video
( ) Not for Profit
( ) Pharmaceuticals
( ) Publishing
( ) Real Estate (Commercial)
( ) Real Estate (Residential)
( ) Retail and Wholesale
( ) Sports
( ) State and Local Government
( ) Technology
( ) Telecommunications
( ) Transportation
( ) Travel
( ) Utilities
( ) Other - Please specify below

2021 Wisdom of Crowds® EPM Market Study
http://www.dresneradvisory.com Copyright 2021 – Dresner Advisory Services, LLC
82
How many employees does your company employ worldwide?
( ) 1-100
( ) 101-1,000
( ) 1,001-2,000
( ) 2,001-5,000
( ) 5,001-10,000
( ) More than 10,000
What function do you report into?
( ) Business Intelligence Competency Center
( ) Executive Management
( ) Finance
( ) Human Resources
( ) Information Technology (IT)
( ) Marketing
( ) Operations (e.g., Manufacturing, Supply Chain, Services)
( ) Research and Development (R&D)
( ) Sales
( ) Strategic Planning Function
( ) Other - Write In

2021 Wisdom of Crowds® EPM Market Study
http://www.dresneradvisory.com Copyright 2021 – Dresner Advisory Services, LLC
83
Does your organization use or intend to use enterprise performance management
software?
( ) Yes, we use enterprise performance management software today
( ) No, we have no plans to use enterprise performance management software at all
( ) We are currently evaluating enterprise performance management software
( ) We may use planning and enterprise performance management in the future
How will your user base for enterprise performance management change over the
coming year?
( ) The number of enterprise performance management users will stay about the same
( ) The number of enterprise performance management users will increase
( ) The number of enterprise performance management users will decrease
What are your plans for enterprise performance management software in the future?
( ) Will Adopt This Year
( ) Will Adopt Next Year
( ) Will Adopt Beyond Next Year
What is your preference for how you source enterprise performance management
software?
( ) We prefer to source Enterprise Performance Management software from a vendor
that specializes in this software and is open to working with any ERP/finance system
( ) We prefer to source Enterprise Performance Management software from a specialist
vendor that has a strong partnership with the vendor of our primary ERP/finance system
( ) We prefer to source Enterprise Performance Management software from the same
vendor as our primary ERP/finance system, even if this is a separate or acquired
product
2021 Wisdom of Crowds® EPM Market Study
http://www.dresneradvisory.com Copyright 2021 – Dresner Advisory Services, LLC
84
( ) We prefer to source Enterprise Performance Management software from the same
vendor as our primary ERP/finance system, but only if it is tightly integrated with their
ERP/finance system (i.e., shares the same data model and technology platform)
( ) We have no preference; we will consider all potential vendors
How is Enterprise Performance Management software deployed in your organization?
Select all that apply.
( ) At a departmental level in part of the organization
( ) As the primary solution for the entire organization (where the organization only
operates in a single country)
( ) As a regional solution in North America
( ) As a regional solution in Europe, Middle East and Africa
( ) As a regional solution in Latin America
( ) As a regional solution in Asia Pacific
( ) As a global solution (used widely across multiple regions)
How will machine learning and Artificial Intelligence impact your performance
management (including budgeting and planning) processes in the next 3 to 5 years?
( ) They will have a significant positive impact, likely improving forecast accuracy and
further automating time-consuming processes
( ) It’s currently hard to see how they will improve our budgeting and planning processes
and building a business case will be difficult
( ) Our users are likely to resist the “black box” automation of forecasting and planning
processes through machine learning and AI

2021 Wisdom of Crowds® EPM Market Study
http://www.dresneradvisory.com Copyright 2021 – Dresner Advisory Services, LLC
85
How do you expect to deploy machine learning and Artificial Intelligence to support your
performance management (including budgeting and planning) processes?
( ) We will build it ourselves by employing data scientists and using third-party
technologies to add machine learning and AI capabilities to our existing Enterprise
Performance Management software
( ) We expect our enterprise performance management software vendor to provide
these capabilities in a future release of their software and are prepared to be an early
adopter
( ) We expect our enterprise performance management (EPM) software vendor to
provide these capabilities in a future release of their software but will only use these
capabilities when they are proven by other users
How important is enterprise performance management to your organization?
( ) Critical
( ) Very Important
( ) Important
( ) Somewhat Important
( ) Not Important
Which functions use (or will use) enterprise performance management
software/solutions in your organization?
Use
Today
Will
Use in
12
Months
Will
Use in
24
Months
No
Plans
Finance ( ) ( ) ( ) ( )
Human ( ) ( ) ( ) ( )

2021 Wisdom of Crowds® EPM Market Study
http://www.dresneradvisory.com Copyright 2021 – Dresner Advisory Services, LLC
86
Resources
Information
Technology
(IT)
( ) ( ) ( ) ( )
Manufacturing ( ) ( ) ( ) ( )
Marketing ( ) ( ) ( ) ( )
Operations ( ) ( ) ( ) ( )
Research and
Development
(R&D)
( ) ( ) ( ) ( )
Sales ( ) ( ) ( ) ( )
Strategic
Planning
Function
( ) ( ) ( ) ( )
Supply Chain ( ) ( ) ( ) ( )
Customer
Service
( ) ( ) ( ) ( )
Please prioritize the following planning and budgeting capabilities for your organization.
Critical
Very
Important Important
Somewhat
Important
Not
Important
Annual Financial
Budgets
( ) ( ) ( ) ( ) ( )
Balance Sheet
Planning
( ) ( ) ( ) ( ) ( )
Bottom-up
Budgeting
( ) ( ) ( ) ( ) ( )

2021 Wisdom of Crowds® EPM Market Study
http://www.dresneradvisory.com Copyright 2021 – Dresner Advisory Services, LLC
87
Capital Asset
Planning and
Budgeting
( ) ( ) ( ) ( ) ( )
Cash-flow
Forecasting/Planning
( ) ( ) ( ) ( ) ( )
Driver-based
Budgeting/Planning
( ) ( ) ( ) ( ) ( )
Headcount, Salary
and Compensation
Planning
( ) ( ) ( ) ( ) ( )
Linking Strategic
Plans to Annual
Budget
( ) ( ) ( ) ( ) ( )
Model and Plan
Optimal Sales
Territories and
Quotas
( ) ( ) ( ) ( ) ( )
Monte Carlo and
Other Statistical
Analyses
( ) ( ) ( ) ( ) ( )
Optimize Workforce
Plans and Staffing to
Meet Demand
( ) ( ) ( ) ( ) ( )
Product or Customer
Profitability
Analysis
( ) ( ) ( ) ( ) ( )
Project-based
Financial Planning
and Budgeting
( ) ( ) ( ) ( ) ( )
Revenue / Demand
Planning
( ) ( ) ( ) ( ) ( )

2021 Wisdom of Crowds® EPM Market Study
http://www.dresneradvisory.com Copyright 2021 – Dresner Advisory Services, LLC
88
Rolling Forecasts ( ) ( ) ( ) ( ) ( )
Sales and Operations
Planning
( ) ( ) ( ) ( ) ( )
Strategic Planning
(3-5 Years)
( ) ( ) ( ) ( ) ( )
Top-down Planning ( ) ( ) ( ) ( ) ( )
Zero-based
Budgeting
( ) ( ) ( ) ( ) ( )
With what frequency are plans/budgets and forecasts created/updated in your
organization?
Daily Weekly Monthly Quarterly
Bi-
annually Annually
Planning/
Budgeting
( ) ( ) ( ) ( ) ( ) ( )
Forecasting ( ) ( ) ( ) ( ) ( ) ( )
How does your organization use rolling forecasts?
( ) We use rolling forecasts instead of annual budgets to manage performance against
plans and targets
( ) We use rolling forecasts to provide an additional, forward-looking view to
complement annual budgets, but we still manage performance against annual budgets
( ) We do not currently use rolling forecasts and have no plans to use them in future
( ) We do not currently use rolling forecasts, but we will use them at some point in the
future
How important are the following deployment options for performance management?

2021 Wisdom of Crowds® EPM Market Study
http://www.dresneradvisory.com Copyright 2021 – Dresner Advisory Services, LLC
89
Critical
Very
Important Important
Somewhat
Important
Not
Important
Private
Cloud/Hosted
Solution
( ) ( ) ( ) ( ) ( )
On-premises
System
( ) ( ) ( ) ( ) ( )
SaaS/Public
Cloud
Service
( ) ( ) ( ) ( ) ( )
How do you currently deploy enterprise performance management software, and how
do you see that changing in the future?
Today
In 12
months
In 24
months
Mostly
on-
premises
( ) ( ) ( )
Mostly
private
cloud
( ) ( ) ( )
Mostly
hybrid
cloud
( ) ( ) ( )
Mostly
public
cloud
( ) ( ) ( )

2021 Wisdom of Crowds® EPM Market Study
http://www.dresneradvisory.com Copyright 2021 – Dresner Advisory Services, LLC
90
How does your management team measure and manage the performance of your
organization?
( ) Mainly using financial budgetary control mechanisms. Business entities (business units,
departments and functions) are set financial budgets and their performance is primarily measured
against these using budget variance analysis
( ) Using a combination of financial budgetary control mechanisms and key performance
indicators (KPIs).
( ) Mainly using KPIs. Business entity performance is primarily measured against KPIs, financial
budgets are of much less importance.
( ) Other - Write In: _________________________________________________
( ) Other - Write In: _________________________________________________
How important are the following KPIs in your organization?
Critical
Very
important Important
Somewhat
important
Not
important
Financial
KPIs (e.g.,
revenues,
profitability,
earnings per
share)
( ) ( ) ( ) ( ) ( )
Customer
experience
KPIs (e.g.
churn,
promoter
score,
retention)
( ) ( ) ( ) ( ) ( )
HR KPIs (e.g.
cost to hire,
employee
churn,
employee
retention)
( ) ( ) ( ) ( ) ( )
Operational ( ) ( ) ( ) ( ) ( )
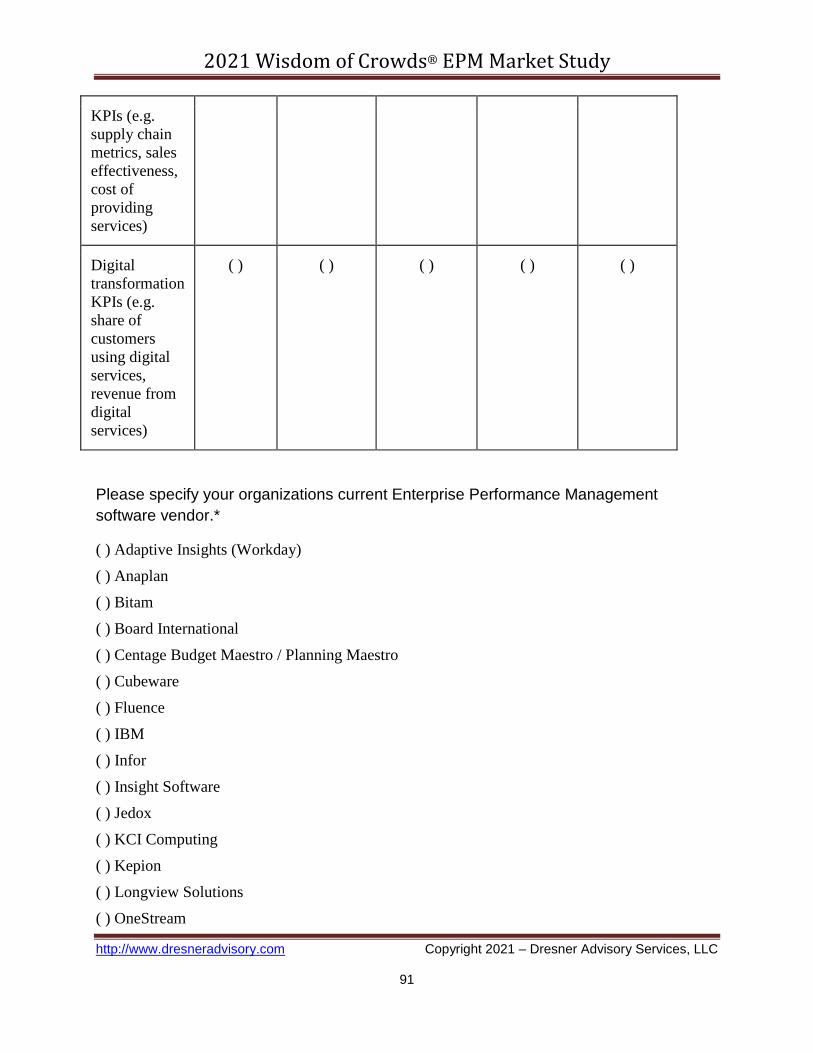
2021 Wisdom of Crowds® EPM Market Study
http://www.dresneradvisory.com Copyright 2021 – Dresner Advisory Services, LLC
91
KPIs (e.g.
supply chain
metrics, sales
effectiveness,
cost of
providing
services)
Digital
transformation
KPIs (e.g.
share of
customers
using digital
services,
revenue from
digital
services)
( ) ( ) ( ) ( ) ( )
Please specify your organizations current Enterprise Performance Management
software vendor.*
( ) Adaptive Insights (Workday)
( ) Anaplan
( ) Bitam
( ) Board International
( ) Centage Budget Maestro / Planning Maestro
( ) Cubeware
( ) Fluence
( ) IBM
( ) Infor
( ) Insight Software
( ) Jedox
( ) KCI Computing
( ) Kepion
( ) Longview Solutions
( ) OneStream

2021 Wisdom of Crowds® EPM Market Study
http://www.dresneradvisory.com Copyright 2021 – Dresner Advisory Services, LLC
92
( ) Oracle Hyperion
( ) Planful (f.k.a. Host Analytics)
( ) Planview
( ) Prevero (Unit4)
( ) Prophix
( ) SAP
( ) SAS Institute
( ) Sage Intaact
( ) Solver
( ) Syntellis (f.k.a. Kaufman Hall)
( ) Tagetik (Wolters Kluwer)
( ) XLerant
( ) Vena Solutions
( ) Other - Write In: _________________________________________________
Please specify the product name and version for the selected vendor.*
_________________________________________________
How long has this product been in use?
( ) Less than 1 year
( ) 1-2 years
( ) 3-5 years
( ) 6-10 years
( ) More than 10 years
How many users currently use this product?
( ) 1-5
( ) 6-10

2021 Wisdom of Crowds® EPM Market Study
http://www.dresneradvisory.com Copyright 2021 – Dresner Advisory Services, LLC
93
( ) 11-20
( ) 21-50
( ) 51-100
( ) 101-200
( ) 201-500
( ) 501-1,000
( ) More than 1,000
How would you characterize the sales/acquisition experience with this vendor?
Excellent
Very
Good Adequate Poor
Very
Poor
Don't
Know
Professionalism ( ) ( ) ( ) ( ) ( ) ( )
Product Knowledge ( ) ( ) ( ) ( ) ( ) ( )
Understanding our
Business Needs
( ) ( ) ( ) ( ) ( ) ( )
Responsiveness ( ) ( ) ( ) ( ) ( ) ( )
Flexibility/Accommodation ( ) ( ) ( ) ( ) ( ) ( )
Business Practices ( ) ( ) ( ) ( ) ( ) ( )
Contractual Terms and
Conditions
( ) ( ) ( ) ( ) ( ) ( )
Follow-up after the Sale ( ) ( ) ( ) ( ) ( ) ( )
How would you characterize the value for the price paid?
( ) Great Value (Well exceeded expectations)

2021 Wisdom of Crowds® EPM Market Study
http://www.dresneradvisory.com Copyright 2021 – Dresner Advisory Services, LLC
94
( ) Good Value (Somewhat exceeded expectations)
( ) Average Value (Met expectations)
( ) Poor Value (Fell short of expectations)
( ) Very Poor Value (Fell far short of expectations)
How would you characterize the quality and usefulness of the product?
Excellent
Very
Good Adequate Poor
Very
Poor
Don't
Know
Robustness/Sophistication
of Technology
( ) ( ) ( ) ( ) ( ) ( )
Completeness of
Functionality
( ) ( ) ( ) ( ) ( ) ( )
Reliability of Technology ( ) ( ) ( ) ( ) ( ) ( )
Scalability ( ) ( ) ( ) ( ) ( ) ( )
Integration of
Components within
Product
( ) ( ) ( ) ( ) ( ) ( )
Integration with Third-
party Technologies
( ) ( ) ( ) ( ) ( ) ( )
Overall Usability ( ) ( ) ( ) ( ) ( ) ( )
Ease of Installation ( ) ( ) ( ) ( ) ( ) ( )
Ease of Administration ( ) ( ) ( ) ( ) ( ) ( )
Customization and
Extensibility
( ) ( ) ( ) ( ) ( ) ( )
Ease of
Upgrade/Migration to
( ) ( ) ( ) ( ) ( ) ( )

2021 Wisdom of Crowds® EPM Market Study
http://www.dresneradvisory.com Copyright 2021 – Dresner Advisory Services, LLC
95
New Versions
Online Training, Forums
and Documentation
( ) ( ) ( ) ( ) ( ) ( )
How would you characterize the vendor's technical support?
Excellent
Very
Good Adequate Poor
Very
Poor
Don't
Know
Professionalism ( ) ( ) ( ) ( ) ( ) ( )
Product
Knowledge
( ) ( ) ( ) ( ) ( ) ( )
Responsiveness ( ) ( ) ( ) ( ) ( ) ( )
Continuity of
Personnel
( ) ( ) ( ) ( ) ( ) ( )
Time to
Resolve
Problems
( ) ( ) ( ) ( ) ( ) ( )
How would you characterize the vendor's consulting services?
Excellent
Very
Good Adequate Poor
Very
Poor
Don't
Know
Professionalism ( ) ( ) ( ) ( ) ( ) ( )
Product
Knowledge
( ) ( ) ( ) ( ) ( ) ( )
Experience ( ) ( ) ( ) ( ) ( ) ( )
Continuity ( ) ( ) ( ) ( ) ( ) ( )

2021 Wisdom of Crowds® EPM Market Study
http://www.dresneradvisory.com Copyright 2021 – Dresner Advisory Services, LLC
96
Value ( ) ( ) ( ) ( ) ( ) ( )
How would you rate the integrity (i.e., truthfulness, honesty) of this vendor?
( ) Excellent
( ) Very Good
( ) Adequate
( ) Poor
( ) Very Poor
( ) Don't Know
Did your experience with this vendor improve, remain the same or decline from last
year?
( ) Improved
( ) Stayed the Same
( ) Declined
Would you recommend this vendor/product?
( ) I would recommend this vendor/product
( ) I would NOT recommend this vendor/product
Please enter any additional comments regarding this vendor and/or its products
____________________________________________