wisdom or madness? comparing crowds with expert evaluation ......
TRANSCRIPT
Copyright © 2014, 2015 by Ethan Mollick and Ramana Nanda
Working papers are in draft form. This working paper is distributed for purposes of comment and discussion only. It may not be reproduced without permission of the copyright holder. Copies of working papers are available from the author.
Wisdom or Madness? Comparing Crowds with Expert Evaluation in Funding the Arts Ethan Mollick Ramana Nanda
Working Paper
14-116 August 26, 2015
1
Wisdom or Madness? Comparing Crowds with
Expert Evaluation in Funding the Arts*
Ethan Mollick
The Wharton School University of Pennsylvania
Ramana Nanda
Harvard Business School
March 5, 2015
Abstract: In fields as diverse as technology entrepreneurship and the arts, crowds of interested stakeholders are increasingly responsible for deciding which innovations to fund, a privilege that was previously reserved for a few experts, such as venture capitalists and grant‐making bodies. Little is known about the degree to which the crowd differs from experts in judging which ideas to fund, and, indeed, whether the crowd is even rational in making funding decisions. Drawing on a panel of national experts and comprehensive data from the largest crowdfunding site, we examine funding decisions for proposed theater projects, a category where expert and crowd preferences might be expected to differ greatly. We instead find significant agreement between the funding decisions of crowds and experts. Where crowds and experts disagree, it is far more likely to be a case where the crowd is willing to fund projects that experts may not. Examining the outcomes of these projects, we find no quantitative or qualitative differences between projects funded by the crowd alone, and those that were selected by both the crowd and experts. Our findings suggest that crowdfunding can play an important role in complementing expert decisions, particularly in sectors where the crowds are end users, by allowing projects the option to receive multiple evaluations and thereby lowering the incidence of "false negatives."
*[email protected] and [email protected] Authorship is alphabetical; both authors contributed equally
in developing this paper. We are grateful to Xiang Ao, Ajay Agrawal, Teresa Amabile, Ronnie Chatterji, Jing Chen,
Chuck Eesley, Avi Goldfarb, Brent Goldfarb, Mukti Khaire, Josh Lerner, Matt Marx, Matthew Rhodes-Kropf,
Antoinette Schoar and Tavneet Suri for helpful conversations and feedback, and to the participants of the Economics
of Entrepreneurship and Innovation Conference at Queens School of Business. We thank John Galvin and Andrew
Marder at HBS for their help in implementing the survey. We would also like to thank the editors and our three
anonymous reviewers for their very helpful comments. Support was provided by the Kauffman Foundation’s Junior
Faculty Fellowship and Harvard Business School’s Division of Research and Faculty Development for financial
support.
2
1. Introduction
One of the central insights of Schumpeter (1942) was to highlight the distinct roles played by
entrepreneurs and investors in bringing new ideas to fruition, since it allowed for the possibility that
good ideas might be precluded from the market because they were unable to attract financing from
investors. Other scholars have shown that the opinions of funding authorities similarly affect the
direction of innovation in other critical fields, including scientific research (Bourdieu, 1975; Goldfarb,
2008; Nelson, 1959) and creative industries (Caves, 2000, 2003). In each setting, scholars have noted
that constrained financing environments and the control exerted by a small group of experts means that
projects that are ultimately funded are not necessarily “objectively best” but are subject to the specific
information, agency, and organizational constraints faced by the small number of experts making
funding decisions. (e.g. Caves, 2000; Ferrary & Granovetter, 2009; Goldfarb, 2008; Kerr, Nanda, &
Rhodes-Kropf, 2013; Kortum & Lerner, 2000).
Rapid technological advances over the past few years have made it significantly easier for
innovators to circumvent experts, and instead communicate directly with a large number of interested
stakeholders, leading to the growing reliance on “crowds” to make decisions that once rested solely in
the hands of a small number experts. For example, the crowdfunding platform Kickstarter has raised
more than $1 billion for over 60,000 projects from over six million backers since its founding in 2009,
projects that may otherwise have needed to seek funding from venture investors or grant-making
bodies. In fact, since 2012, this platform alone raises more money for the arts annually than the total
funding provided through the US government-run National Endowment for the Arts. The importance of
crowd-based decisions are growing in a wide range of fields, including the funding of technology-based
startups (Agrawal, Catalini, & Goldfarb, 2013; Mollick, 2014), the development of new products (Afuah
& Tucci, 2012; Poetz & Schreier, 2012; Von Hippel, 1986) and scientific research (Franzoni & Sauermann,
2014).
Despite the growing role of crowds in making decisions once left to experts, little is known about
how crowds and experts may differ in their ability to judge projects. Indeed, for crowds, at least, there is
even considerable debate over whether their decisions are actually based on rational criteria at all. Two
popular books separated by 150 years offer starkly different views of the nature of crowd decision-
making, with Charles Mackay (1852) warning about the “madness of crowds” while James Surowiecki
(2004) more recently extolled the “wisdom of crowds.” Studies to date attempting to understand the
differences between crowds and experts have focused on prediction tasks or markets, where
3
aggregated decisions can be more accurate than individual actions (Budescu & Chen, 2014; Larrick,
Mannes, & Soll, 2012; Ray, 2006; Tetlock, 2005), or else on cases where organizations can get positive
results by reaching out to crowds under carefully controlled circumstances (Bogers, Afuah, & Bastian,
2010; Terwiesch & Ulrich, 2009). Crowdfunding, on the other hand, does not have any such controls,
and differs from these previous phenomena in many ways: there is no market reward mechanism for
correct answers; no clear criteria determining what is being “predicted”; no expert oversight of the
crowd decision-making process; and no direct coordination between crowd members. In this case, the
crowd can be subject to many group decision-making fallacies, as Isenberg (2012) argued about
crowdfunding: “group irrationality is well-documented — crowds are ‘wise’ only in a very limited set of
circumstances. As often as not, crowds bring us tulip crazes, subprime meltdowns, the Kitty Genovese
scandal, Salem witch trials, and other tragedies.” There is no clear evidence on whether crowds are
rational at all, and, if they are, what differences might exist between the judgment of crowds and that of
experts.
Thus, we are interested in shedding light on two questions about the judgment of crowds
compared to experts. First, we aim to provide the first robust analysis of the degree to which experts
would agree with crowdfunding decisions that rely on taste and judgment, rather than prediction, using
rich data from the crowdfunding platform Kickstarter. The second related question we seek to
understand is whether crowd-based decision making is “mad” (irrational and inconsistent in decision
making relative to experts) or “wise” (generally consistent in selecting potentially successful projects).
Several features of our research design aim to address the specific challenges associated with
making such a comparison. First, we have complete data on crowdfunding campaigns (that is, the
“applications”) for all projects, including those that were unsuccessful, so that we are not sampling on
success. Second, we focus our study to theater projects, which have a number of appealing features:
evaluating them entails both a subjective artistic component and an understanding of the commercial
bottom line which provides useful variation for our study. Further, it is possible to develop a somewhat
objective sense of the long-run success of the projects using data on ticket sales and critical reviews in
the press so that we can also compare the funding decisions with real outcomes. Additionally, theater
funding is a one-time event, not subject to the challenges associated with multi-stage financing that
might lead crowds to choose different investments from deep-pocked professional investors even if they
rated projects the same (Nanda & Rhodes-Kropf, 2012). Finally, we recruit expert evaluators who have
deep expertise judging theater applications for institutions such as the National Endowment for the
4
Arts. The projects were rendered in the same format as the Kickstarter campaigns, had similar financial
requirements to traditional grant applicants, and were stripped of any references to the outcome of the
campaign. We randomly assign “sets” of projects to these experts to evaluate, where each set consists
of three failed and three successful projects. This approach allows us to also include expert fixed effects
to examine the robustness of our results.
We have three main findings. First, on average, we find a statistically significant congruence
between the realized funding decisions by crowds and the evaluation of those same projects by experts.
Projects that were funded by the crowds received consistently higher scores from experts, were more
likely to be rated as being the best of the six in the set, and were much more likely to have received
funding from the experts. This pattern was equally true for projects that were “overfunded” on
Kickstarter – that is, projects that raised more money that was asked for. Given the strong positive
correlations we observe in crowd and expert evaluations, even in a category with a subjective nature
such as theater, this suggests both broad similarities between how experts and crowds judge projects
and that crowds are generally consistent in their choices of which projects to back, allowing us to reject
the “madness of crowds” in our setting.
Our second finding is that despite the broad congruence in evaluation, we see a systematic
pattern in terms of the disagreement. Of the projects where there is no agreement, the crowd is much
more likely to have funded a project that the judge did not like than the reverse. Around 75% of the
projects where there is a disagreement are ones where the crowd funded a project but the expert would
not have funded it. We also see a clear pattern in terms of the characteristics of projects that are liked
by the crowds: they offer multiple tiers of rewards and provide more updates. In fact, projects that
were ranked highly by the experts but not funded by crowds had systematically fewer reward levels,
fewer pictures and fewer videos. That is, we seem to find that there is an “art” to raising money from
crowds, one that may be systematically different from that of raising money from experts. The crowds
seem to place emphasis on, or extract information content from different attributes of the process than
experts.
Our third finding relates to the longer-term outcomes of these projects. An attractive feature of
the fact that most of the disagreements are related to projects funded by the crowd, we are able to
compare the long term outcomes of projects that were liked by both crowds and experts and those liked
only by the crowds. Despite the fact that these were not rated as highly by the experts, we find no
qualitative or quantitative differences in the long-term outcomes of these projects. They are equally
5
likely to have delivered on budget, result in organizations that continue to operate, and, although the
metrics for success are subjective, we find strong qualitative evidence that many of these shows had
both commercial success and received positive critical acclaim in national outlets such as the New York
Times.
We should note that these third set of results are more tentative due to the smaller sample size.
However, these patterns suggest that the entry that is facilitated by crowdfunding has the potential to
lower the incidence of “false negatives,” (that is, viable projects that are turned down by funders) by
allowing projects the option to receive multiple evaluations and reach out to receptive communities
that may not otherwise be represented by experts. Indeed, crowdfunding allows project creators to
directly contact potential customers, providing a rich source of data on the potential interest in an
artistic endeavor, in addition to any funds raised.
Our results are relevant to the growing interest to management scholars in the role of crowds in
addressing traditional organizational functions (Afuah & Tucci, 2012; Boudreau, Lacetera, & Lakhani,
2011; Franzoni & Sauermann, 2014; Greenstein & Zhu, 2014; Terwiesch & Ulrich, 2009). Our findings are
also related to the role that crowds may play in reducing financing constraints of new ventures. The
falling cost of starting new ventures has allowed the possibility of individuals with small amounts of
capital to participate in financing such ventures, and our results shed light on the extent to which
backers on these platforms may be able to reduce information asymmetries as opposed to becoming
victims to information cascades. We address the generalizability of our findings in Section 6.
The rest of the paper is organized as follows. In Section 2 we outline the theoretical predictions
associated with studying differences between crowds and experts. Section 3 outlines our methods and
provides details on the implementation of the survey. Section 4 describes the data, Section 5 outlines
our main findings. Section 6 provides a discussion of the results and Section 7 concludes.
2. Theory
Scholars have long noted the great importance of experts, who have historically held a
privileged position in many industries, acting as arbiters of taste, quality, and appropriateness (e.g.
Caves, 2000; Ginsburgh, 2003; Zuckerman, 1999). Expert judgments are influential in a number of ways,
including acting as predictors of commercial success and influencers of popular opinion (Eliashberg &
Shugan, 1997), as well gatekeepers of vital resources (Ginsburgh, 2003; Reinstein & Snyder, 2005b). As
an example of these three forms of influence, consider experts who select which entrepreneurial
6
ventures should receive funding: venture capitalists. VCs select firms to fund based on their predictions
of future market demand (Baum & Silverman, 2004; Gompers & Lerner, 2004; Shane & Venkataraman,
2003). Further, venture capital investment serves as an influential signal to other players in the market,
suggesting a startup is to be taken seriously (Baum & Silverman, 2004; Hellmann & Puri, 2002). Finally,
venture capitalists serve as gatekeepers to vital resources. As Ferrary and Granovetter (2009) write: “By
selecting start-ups, the VC firms implicitly prevent the other agents in the complex network of
innovation from collaborating with start-ups that do not get VC funding. It could be argued that
potential valuable innovations have never reached customers because they did not get VC funding.”
In the arts, where profitability is not always the standard goal of creators, experts play an even
more critical role as influencers and gatekeepers. Especially in high culture, expert critics are
“sometimes more important than creators,” since they determine the governing aesthetics of high
culture, as well as which creators receive resources (Gans, 2008). Studies in the film industry, for
example, have shown that expert critics are particularly influential to the success of smaller artistic
movies (Reinstein & Snyder, 2005a). Further, experts are often gatekeepers of funding for the arts,
playing critical roles in allocating funding from the government, corporate, and foundation sources that
make up 24.6% of all revenues for not-for-profit performing arts groups and museums in the United
States (Woronkowicz, Nicols, & Iyengar, 2012). Crowdfunding, however, offers an alternative to the
traditional expert control over artistic funding and culture.
Crowdfunding provides a method of funding projects that differs in several aspects from expert-
run processes like grant-making or venture capital. First, rather than being in the hands of a small group
of individuals, it is democratic – over six million people have funded projects on Kickstarter alone.
Second, as opposed to the tightly-knit expert community (Wenger & Snyder, 2000), crowdfunding
backers are loosely organized, if at all. Third, compared to the closed networks of Silicon Valley or the
world of theater, in crowdfunding almost all communication between those seeking funding and
potential backers occurs in open, online communities. Fourth, crowdfunding in its current form involves
no equity or monitoring rights1; backers have little to no further influence over organizations they
backed, and gain no return other than the potential of enjoying the outcome of a project.
1 The data collected is from a period where crowdfunding where no equity investment is permitted, though the US
Congress has authorized equity crowdfunding (JOBS Act, 112th Congress), it has yet to be implemented as of the
time of this writing.
7
The use of crowd judgment in crowdfunding also differs greatly from prior approaches to
generating information from large groups. Other attempts to harness the innovative power of large
groups – such as crowdsourcing (Poetz & Schreier, 2012), innovation tournaments (Boudreau, Lacetera,
& Lakhani, 2010; Terwiesch & Ulrich, 2009), and collective and group innovation (Jeppesen &
Frederiksen, 2006; O’Mahony, 2003) – ultimately have an expert authority overseeing the actions of the
crowd. And, unlike prediction markets (M. Chen, 2008; Ray, 2006; Wolfers & Zitzewitz, 2004), crowd-
based approaches do not operate like markets, in that there are not buyers and sellers trading contracts
in an efficient manner. Instead, crowd judgment depends on the aggregate actions of many individuals
making small contributions to a larger goal, in the place of experts making large-scale resource
allocation choices themselves. While the success or failure of a particular project may be influenced by
the degree of pledges already made (Kuppuswamy & Bayus, 2013), backing decisions are individual, not
collective. There is no centralized price-setting mechanism, tournament, or selection process that
aggregates crowd preferences. Thus, the crowd in crowdfunding consists of a group of mostly
uncoordinated amateurs.
Theory provides ambiguous predictions about whether and how crowd evaluations should differ
from that of experts. One the one hand, the crowd allows for a wider range of expertise and
preferences to be leveraged in group decision-making, suggesting that ‘collective wisdom’ might make
evaluation more accurate, reducing information frictions and providing greater efficiency in financing
decisions. For example, studies on forecasting have supported the idea that experts are no more
accurate than informed amateurs (Tetlock, 2005), while examination of Wikipedia has shown that it
compares favorably on many dimensions to expert-created content (Clauson, Polen, Boulos, &
Dzenowagis, 2008; Giles, 2005; Rajagopalan et al., 2011). Further, recent research on Wikipedia has
shown that while there may be political biases in certain articles (Greenstein & Zhu, 2012), as these
articles are more heavily edited by the crowd, they ultimately become less biased than similar work
produced by the experts at Encyclopedia Britannica (Greenstein & Zhu, 2014).
The research on crowds that seeks to explain these findings focuses on the value of combining
many opinions, as opposed to relying on the views of individual experts (Larrick & Soll, 2012). When
crowds have diverse sources of information and expertise with a problem area, they can provide more
accurate collective forecasting than can even well-informed individuals (Larrick et al., 2012). Indeed, a
substantial amount of research has gone into examining the best method of combining the predictions
of many individuals as accurately as possible (Budescu & Chen, 2014; Larrick & Soll, 2012; Makridakis &
8
Winkler, 1983). While these studies have shed considerable light on how to employ the wisdom of the
crowd, the emphasis on assessing crowds based on accuracy assumes that there is an objectively
defined “correct answer” that both the crowd and experts are attempting to reach. When selecting
startup companies to fund, artistic works to develop, or innovations to pursue, the nature of a correct
answer is less clear. In these cases, the key issue is less about selecting a combined prediction and much
more about understanding whether there are systematic differences between crowds and experts in the
types of projects they seem to prefer, or, indeed, if crowds are at all consistent in how they assess
projects.
We may expect several factors to drive some systematic differences in the types of projects that
are funded by crowds compared to experts. First, it is not clear that the crowd, as a whole, has the
expertise to evaluate projects in the same way as experts (Simmons, Nelson, Galak, & Frederick, 2011).
There are no admissions criteria for entering the crowd, making it unclear how the crowd would develop
criteria to identify potentially high quality projects in areas where they do not have expertise. Since
crowds are pledging smaller amounts of money per project, they also have less of an incentive to gather
information on the project and hence are more likely to be subject to herding driven by information
cascades. Such herding can be rational, as outlined by several economics models (Banerjee, 1992;
Bikhchandani, Hirshleifer, & Welch, 1992; Devenow & Welch, 1996; Scharfstein & Stein, 1990), where
project backers observe the actions of other project backers, and thus view the presence of other
backers as a sign of quality. Herding can also be mimetic, as backers simply mimic others, without an
underlying rationale (Cipriani & Guarino, 2005). Crowds may also suffer from a wide variety of factors
identified by social psychologists and cognitive scientists that degrade the quality of crowd decision-
making (e.g. Bahrami et al., 2012; Latane, Williams, Harkins, & Latané, 1979; Raafat, Chater, & Frith,
2009). For example, groups can be subject to emotional contagion (Barsade, 2002) and even to
hysterical reaction (Balaratnasingam & Janca, 2006), that may cause crowd members to act in non-
rational ways. Crowds could also be fall into patterns of group thinking which bias information
processing (Janis, 1982), may overly rely on the work of others (Earley, 1989; Latane et al., 1979), or may
deemphasize information that is not shared among group members (Schulz-Hardt, Brodbeck, Mojzisch,
Kerschreiter, & Frey, 2006).
We do not seek to specify which biases may operate under which conditions in crowdfunding,
but rather argue that there are many potential reasons why crowds would operate in ways that might
be less than wise, especially as crowdfunding does not resemble more controlled opinion-aggregation
9
approaches to harnessing crowd wisdom (Budescu & Chen, 2014; Simmons et al., 2011). Indeed, early
studies have found herding in peer-to-peer lending, a form of crowdfunding, with conflicting evidence
over the degree to which herding represents positive information cascades or mere imitation (D. Chen &
Lin, 2014; Kuppuswamy & Bayus, 2013; Zhang & Liu, 2012). Thus, both prior theory and early empirical
results suggest that the crowd could be irrational, subject to many potential biases that would result in
inconsistent judgments without clear patterns or decision criteria.
Even in the absence of group biases that subvert rational decision-making, the crowd and
experts may differ based on taste or other preferences. The difference in cultural tastes have long been
a subject of interest to scholars (Bourdieu, 1984; DiMaggio, 1991; Gans, 2008; Peterson & Kern, 1996),
and the funding decision of experts and crowds would reasonably be expected to reflect differences in
high culture and popular culture (Gans, 2008). Even as cultural tastes change among the elite (Peterson
& Kern, 1996), there is still a strong belief that many forms of high culture, serious theater prominent
among them (Shrum, 1991), would not be supported by popular culture. Further, the tastes of the
critics serves a role beyond selecting artwork, and is part of the process by which elite social classes
sustain and replicate themselves (DiMaggio, 1991). Additionally, the difference in tastes between the
crowd and experts may not even be based on the underlying quality of the work. Given that some
significant proportion of crowdfunding is based on the support of friends and family (Agrawal, Catalini,
& Goldfarb, 2010), it could simply be that the crowd is primarily focused on supporting popular
individuals, rather than quality products. These differences in tastes are important, as selection contexts
that apply different preferences in funding projects can result in the support of very different forms of
art (Wijnberg & Gemser, 2000) and alter the sorts of ideas that are ultimately funded and pursued
throughout the economy. Therefore, even in the absence of group cognitive biases that make decision-
making inconsistent, crowds may still have a completely different set of tastes then experts, suggesting
that moving from expert to crowd-based judgments could radically alter the type and nature of art being
funded.
Ultimately, we are left with two potential views of the crowd. In one case, we have a crowd that
is fundamentally wise. It may differ on some selection criteria from experts due to taste or the structure
in which screening takes place, but would have a consistent set of decisions that have a rational
underlying framework. If the crowd is wise, the key question becomes the taste of the crowd compared
to experts, and its consequences. A second option is that the crowd is instead more subject to the many
potential fallacies of group cognition; is driven by factors unrelated to quality; has radically different
10
tastes than experts; and/or is inconsistent in its judgment. Our study aims to shed light on which of
these two polar extremes best typifies the nature of crowdfunding we see today, and to explore the
differences between expert and crowd judgment.
3. Research Design
We chose to work with data from Kickstarter, which is the largest and most prominent
crowdfunding platform in the world, having successfully helped raise over $1 billion in funding across all
applicants in the last five years. Due to the strong network effects that tend to be present in such
platforms, working with the largest, most prominent, and successful platform ensures that we are likely
to observe a representative set of projects -- including the very best -- that are seeking funding from
crowds. A second attractive feature of our setting is that we have access to all the campaigns run by
Kickstarter, including those that did not succeed in meeting their funding goals, which allows us to look
at the differences in evaluation, without sampling on success.
Since a key goal of our paper is to examine the extent to which experts would agree with the
funding decisions of crowds, we focused our analysis on a field where there is an established set of
externally-validated experts that could be used to examine the judgment of crowds. We also wanted to
focus on an area where projects have both a subjective artistic component and a measure of a
commercial bottom line, since the former is a setting where tastes may be expected to differ and the
latter is a feature that is particularly relevant for new ventures outside of the arts. Given these two
criteria, we decided to focus on theater, where the existing literature suggests a long-standing tension
between experts and mass audiences in artistic endeavors (Gans, 2008; Kim & Jensen, 2011; Wijnberg &
Gemser, 2000) while at the same time embodying many features of projects that have a commercial
bottom line. Theater is especially relevant in crowdfunding, because, as mentioned, as of 2012,
Kickstarter campaigns became a larger funder of the arts than the expert-run National Endowment of
the Arts.
Figure 1 provides an annotated example of a Kickstarter theater project from our sample. As
can be seen in the Figure, project creators generate a pitch to convince backers to support their project,
using a combination of video, text, and images to communicate their vision for the completed project.
As is common in reward-based crowdfunding, backers may receive some sort of reward for a project,
such as a ticket or a mention in a program, but do not gain any financial stake in the project or profit
from the project in any way. Pitches, project goals, and aspirations of project creators can vary widely
11
between projects, and the projects in our sample included revivals of Broadway plays, adaptations of
books to the stage, original musicals, works aimed at children, and new dramatic productions.
[Figure 1 about here]
Theater also has the attractive property that it is possible to measure “real outcomes” in a
manner that is independent of the funding decision, by learning about the commercial performance or
critical reviews of projects following the Kickstarter campaign. Although some of these data are noisy,
they help shed some light on whether the real outcomes also correlate with funding decisions. They are
also especially useful in addressing whether projects attempt to deliver their promised outcomes.
We restrict our attention to Kickstarter projects that were aiming to raise at least $10,000 in
funding. The funding goal of at least $10,000 focuses on the subset of applicants whose ambitions and
goals are more closely aligned with those applying for funding from traditional sources such as the
National Endowment for the Arts, as well as several other grant making organizations for theater. To
put this in perspective, the NEA made 1,083 grants in the first round of funding for FY 2014, with an
average grants size of around $24,000. The average funding goal for projects in our sample is $20,500,
with the largest goal for successful projects being $75,000.
For experts, we draw on the experience of 30 judges who have deep and extensive knowledge
of theater, as evidenced by their background in evaluating theater applications for national grant
making bodies such as the National Endowment for the Arts2 ). We asked each of these judges to
evaluate 6 projects, 3 of which were successes and 3 of which were failures. We were able to strip out
any data on the outcome of the project, but still render the projects, including videos, for the judges in a
manner that was equivalent to the display on Kickstarter (including fonts, graphics, typographic errors,
etc.) This not only allows us to have a representative set of applications for funding (rather than just
evaluating the successful cases), but also allows us to display the applications similar to the way that the
crowds viewed them, and hence evaluated them.
Evaluations were conducted using an online survey instrument derived from extensive
interviews and testing with individuals who had been involved in judging for the NEA. We identified five
2 Judges have served on a mean of 5 panels each for national theater prizes and awards. All judges were also
involved in theater, either as critics, artistic directors, dramaturges, theater managers, or in some other role. In
addition to the NEA, judges had been part of panels for the Mellon Foundation, the Doris Duke Charitable Trust,
and other major theater prizes and grant-making bodies.
12
key criteria, and asked three questions about each, using a Likert scale from 1 to 5, with 5 being
“Strongly Agree.” The five criteria we evaluated were: novelty (example: “This project is original”),
feasibility (example: “This project can be implemented with the resources in the proposal”), quality
(example: “The proposal for the project is of high quality “), reach (examples: “This project would reach
a diverse audience” and “This project would be commercially viable/profitable”), and social relevance
(example: “Assuming it was completed as planned, this project would advance a cultural, political, or
artistic dialogue”). The Appendix contains the full list of questions as well as details on the survey
instrument. Additionally, we showed judges the goal of the Kickstarter project in question, and asked
“How much do you think this project should be funded for, in dollars? Answer 0 if you do not think it
should be funded. Assume you have enough budget to fully fund all of the projects in the survey.” We
also asked judges to list the best and worst projects of those that they had seen.
We generated a stratified random sample of theater projects that attempted to raise at least
$10,000 on the Kickstarter platform between May, 2009 and June 2012. We focused our attention on
projects that were raising money for a specific performance, as opposed to efforts such as fundraising
for building a new theater. Again, this was to match the types of proposals typically seen in national
grant competitions.
There were 257 projects that met our criteria, from which we randomly selected 120.
Specifically, we created 20 “sets” of 6 projects each, where each set was comprised of 3 projects that
failed to reach their funding goal, 2 projects that achieved their goal and 1 project that exceeded its
funding goal3. Hence, our stratified random sample consisted of 60 failed projects (from a total of 141
failed projects), 40 projects that just met their goal (from a total of 85 such projects) and 20 projects
that exceeded their goal (from a total of 31 such projects). Each set of 6 projects was then randomly
assigned to a judge, who evaluated the six projects on a range of criteria described above.
It is worth pointing out that since projects were randomly assigned to sets, and judges were
randomly assigned, our objective was to ensure that once a judge agreed to evaluate the projects, they
did a diligent job in their evaluation (rather than to ensure a high ‘response rate’ in terms of judges
agreeing to evaluate our projects as might be a standard concern in other surveys). We incentivized
judges with a $50 gift certificate for completing the survey, helping us gain the participation of the high
3 We defined exceeding the funding goal as raising over 10% more than the ideal goal.

13
quality experts we required for our test. The quality of the responses is measurable in a number of ways.
First, we note that there were virtually no missing values in the responses from the judges, so that there
is no response bias in our results.4 Second, half the sets (that is 60 projects) were randomly assigned to a
second judge for evaluation. Using a squared weighting scheme appropriate for subjective scoring
(Cohen, 1968), the kappa statistic which measures the inter-rater agreement for these judges was 0.44.
The Z statistic was 7.14, strongly rejecting the hypothesis that the scores were generated at random.
While the kappa statistic of 0.44 suggests moderate agreement among the judges, it is worth noting that
theater projects have an inherent element of subjectivity to them. Given this, we are reassured that
there is a strong and consistent signal that seems to emerge from the judges’ evaluations of the
projects. Also, as will be discussed, we use a variety of methods of measuring the judge’s responses to
proposed projects, and find the decisions to be robust across these approaches.
Overall, our research design aims to combine the expertise of real judges for traditional grant
making bodies with a sample of applications from a crowd funding platform that reduces, if not
eliminates, many of the concerns about selection that were outlined above. On a qualitative dimension,
feedback from our survey participants suggested that there was reasonable overlap in the types of
projects applying for funding through Kickstarter and the types that they had judged for in the past. In
addition, many judging bodies, including the National Endowment for the Arts, are moving towards a
system where judges have electronic access to applications, in part to be able to view videos that
provide much richer information on the application in a short amount of time. This reduces concern
that the mode of information dissemination is foreign to the judges although we cannot rule out that
specific projects were presented in a mode that was alien to judges. We address this specific issue in
Sections 5 and 6, below.
We also conducted a second survey in which we contacted the creators of the 60 successful
projects in our sample to determine the longer-term outcomes of their project. We used a modified
version of a previously applied questionnaire [self-identifying citation omitted], and asked for a variety
of qualitative and quantitative outcomes, including information about the audience of play as well as
critical reviews. We supplemented this information with additional online searches, using Factiva and
Google, to find other reviews of the productions funded through Kickstarter. Together, this material
provides rich data on project outcomes along a variety of dimensions.
4 One judge omitted some fields on one of the 6 projects that s/he evaluated.
14
4. Data
Since 10 sets of projects were evaluated by two judges each and the other 10 evaluated by one
judge, we have a total of 180 evaluations for the 120 projects. For each response, we have basic
information on the background of judges, such as their main affiliation with the theater community
(academic, actor, critic, director, writer or other) and the number of national grant making institutions
they have judged for in the past. For each project in the set that the judge evaluates, we have
information on the judge’s familiarity with the project, their rating of the project’s novelty, relevance to
the community, quality, feasibility and commercial viability. We also provide the judges with the funding
goal of the project and ask them how much they would be willing to allocate to the given project,
assuming they were not constrained in terms of the total funding they needed to allocate.
These 180 responses form the core of the data we use for this paper. However, we have two
other sets of data that we match to the 120 projects. First, we have data on the attributes of the
projects and their fundraising process on Kickstarter. For example, we know the location of the
individual raising the funds, the number of individuals who pledged funding, and the total amount that
was pledged (even when the goal was not successful), as well as the number of distinct reward levels
that were developed to induce participation by the crowd. We also coded the number of videos and
photographs the project displayed. Second, we have aimed to collect long-term outcome information
on the projects, both through the survey of project founders and through web searches. The objective
here is to try and codify the degree to which the individuals themselves, as well as external observers,
deemed these projects to be commercial and artistic successes. These data are much more likely to be
present for projects that were successful, so our main comparison is between projects that were funded
by the crowd and were rated highly by experts and those that the crowd funded but were rated poorly
by the experts. Our follow up survey of the Kickstarter projects that were successful yielded a 53%
response rate (32 of the 60 projects), of which 28 completed all of the needed data, a high rate for web-
based surveys (Kriauciunas, Parmigiani, & Rivera-Santos, 2011). Further, we find no observable
differences in the attributes of the projects for which there was a response and for which there was
none. We use these survey responses to compare the longer term outcome of these funded projects. In
addition to the survey results, we have attempted to code the degree of artistic success for these
projects, using critical reviews in the press.
15
5. Results
We start by outlining descriptive statistics on the projects in Table 1. Table 1 compares the
evaluations of projects that achieved their funding goal on Kickstarter with those that did not succeed.
The judges seem to consistently rate the successful projects higher than those that did not achieve their
funding goal. Since there are 6 projects in each set, the probability that one of them will be ranked
either the best or the worst is 1/6. However, Table 1 shows that projects that were funded by the
crowds were twice as likely to be ranked as the best project, while those that were unsuccessful were
more than two times as likely to be ranked as the worst project by judges. Finally, even though judges
were told that should provide a hypothetical funding as if they were unconstrained in allocating funds to
projects, they greatly favored projects supported by the crowd, allocating an average of 1.5 times more
funds to successful projects than those that were unsuccessful.
[Table 1 about here]
[Figure 2 about here]
There are two patterns that emerge from Table 1, which can be seen most clearly in Figure 2,
which graphs the distribution of the judges combined scores for both successful and unsuccessful
projects. First, there seems to be a strong and systematic positive correlation between the judgment of
crowds and of experts: projects funded on Kickstarter are systematically evaluated as being better by
experts. Second, this strong correlation does not tell the full story – the scores and the funding amounts
proposed by the experts are not as stark as the decision about whether or not to fund projects,
suggesting that there are projects that are funded on Kickstarter that do not seem to be highly rated by
experts, and others that raised funding but were not as highly rated by experts. We probe these two
patterns further in the following Tables.
[Table 2 about here]
In Table 2, we investigate the robustness of the positive correlations between expert
evaluations and crowd funding, using the results from the first judge who responded for each project.
Columns 1-3 report the coefficients on OLS regressions, where the dependent variable is the average
score assigned to a project by the judges. The main variable of interest is an indicator variable that
takes a value of 1 for projects that either met or exceeded their funding goal. Column 1 of Table 2
16
reports the average scores of the two types of successful projects relative to the unsuccessful ones.
Column 2 adds covariates related to the background of the judges, their experience with judging for
grant-making foundations, and their prior familiarity with the specific projects in the survey they were
asked to evaluate. Column 3 adds judge fixed effects to control for other fixed differences across
judges, such as their average leniency or harshness, a bias in favor of or against theater projects raising
money from the crowds, or a specific objective function they have for theater projects.
Moving across Columns 1-3 of Table 2 provides a very consistent picture of the strong
correlation between the evaluation of judges and crowds. The inclusion of covariates and judge fixed
effects increases the R-squared of the regressions considerably, implying these control variables add
significant explanatory power to the regressions. Yet the coefficient on the indicator variables for
success remain remarkably stable.5 The magnitudes on the coefficients are intuitive and relate to the
magnitudes reported in Table 1. Unsuccessful projects score approximately 2.6 out of 5 on average,
while those that reach or exceed their funding goals score about 3.2.6 Columns 4-6 repeat the same
regressions, but where the dependent variable is now the funding share proposed by the experts for
projects. They validate the results shown in Columns 1-3.
Table 2 therefore shows that, on average, the evaluation of equivalent projects by crowds and
experts has a strong positive correlation. Moreover, it also documents that projects that exceed their
goals are not the result of “the madness of crowds.” Rather, if we use the expert evaluations as a
benchmark of quality, it points to the fact that, on average, crowds do a good job of evaluating projects
and screening the good from the bad.
The number of observations in the regressions in Table 2 is 120 rather than 180 because,
although we have 2 sets of evaluations per project for half the projects, we have only included the first
evaluation from each judge in order to provide consistency in terms of the weight given to each project
5 This is also reassuring because it shows us that the patterns we see are not driven by some judges “picking at
random” and others who might be ‘peeking’ at the outcomes and thereby providing results that were
systematically correlated with project outcomes. We should note also that we explicitly asked judges whether
they were familiar with projects and in only 2 of 180 did they respond that they were very familiar with a particular
project. 6 In unreported regressions, we find that although the point estimates for the projects that exceed their goal is
always higher, a Wald test for the difference in the coefficient between the two types of successful projects cannot
reject the hypothesis that they are the same.
17
in the regression. This leads to the question as to whether our results are sensitive to the choice of
judge.
In order to address the question of the sensitivity of results to our choice of judge, we start by
noting that since we have 10 sets of projects with two judges each, 10 projects only had one judge each,
we have 210 (or 1,024) possible combinations of judges for the 10 sets.7 To understand the role of the
choice of judges, we look at all 1,024 combinations rather than just at the result of regressions from any
one of these 1,024 combinations. This provides us with more confidence that we are not arbitrarily
choosing a combination that happens to be statistically significant. We find the magnitude of the
average score for successful projects ranges from 0.35 more than the unsuccessful to 0.7 more (with a
mean of 0.52 larger). In all but two of the 1,024 combinations, the p-value is below 0.05. The largest p-
value is 0.06, providing us with greater confidence that the results documented in Table 2 are
statistically significant and robust to any of the other 1,023 combination of judges we might have picked
in reporting our results. Similarly, the funding share results range from 0.18 more to 0.26 more for the
projects that are successful on Kickstarter, and are always significant at the 5% significance level. Our
results therefore document that there is a strong positive correlation between the evaluation by crowds
and experts on projects.
Despite these positive results about the wisdom of crowds on average, it does not necessarily
mean that they can perfectly substitute for experts in every instance – it is this heterogeneity between
crowds and experts that we turn to next.
Heterogeneity in Expert and Crowd Evaluations
In order to examine heterogeneity in crowd and expert evaluations, we segment each of our 120
projects into one of four mutually exclusive categories – (1) those that are funded by both experts and
crowds, (2) those that are funded by neither, (3) those funded only by experts and (4) those funded only
by crowds. While we have outcome data on whether the crowd funded a project or not, we do not have
actual funding decisions from experts. Rather, we have survey responses to a question asking them how
much of the goal they would fund, assuming their grant-making budget was not constrained.
7 As a simpler example, suppose we only had 4 sets, and had 2 sets that were sent to two judges (set 1 to judges A
and B, set 2 to judges C and D) and 2 sets that we sent only to one judge (set 3 to judge E and set 4 to judge F). In
this case we would have 22 or 4 unique combinations of judge evaluations across 24 projects: ACEF, ADEF, BCEF
and BDEF.
18
Our categorization of whether a judge hypothetically funded a project is thus based on our
mapping of their responses to a hypothetical funding decision, one that is dependent on two factors.
The first factor is the harshness of the screen we use – that is, whether we deem a project to be funded
by a judge only if the judge funds the project a 100% or if we are willing to deem the project to be
funded by experts when they only want to fund, say, 50% or 75% of the goal. Although it may seem like
we only want to use 100% as the funding threshold (just like with the funding criterion on Kickstarter),
our discussions with experts suggest that they routinely give projects that seem viable less money than
requested and hence we do not necessarily want to use the most harsh screen when deemed projects
as hypothetically funded by experts. Second, as above, since half the projects are evaluated by 2 judges,
the question of whether the project was funded by experts potentially depends on which expert’s
funding choice we use.
[Table 3 about here]
While in theory these different empirical strategies can make large differences, in practice we
find that the distribution of projects across buckets, and the overall patterns we show in the subsequent
tables are quite insensitive to the specific categorization we choose. To help put this in perspective, in
Table 3 we document how the distribution of the 120 projects across these four categories changes for
the 1,024 different permutations outlined above across three different screens. The first two columns
correspond to a categorization scheme where we assumed that a project would only be viable if the
judge allocated 100% of the funding goal to the project. The next two correspond to a screen where the
funding threshold is 75% and finally, the last two columns correspond to a screen where the funding
threshold is 50%.
Within each funding screen, we first report the degree of agreement between experts and
crowds – that is the percentage of cases where they either both fund a project or both don’t fund a
project. The first row reports the average agreement for a given screen across all 1,024 combinations of
judges. As can be seen from Columns 1, 3, and 5, there is a strong degree of agreement between
experts and the crowds, around 59% on average, and ranging from 56.7% to 65%.
We demonstrate the strength of this correlation in two, related ways. First, we compare the
extent of agreement in Table 3A to a hypothetical case where a judge funds projects at random (with a
50% probability). The simulations show that the percentage of agreement needs to be approximately
55.5% or more before we can conclude that agreement is not due to a random process at the 90%
19
confidence interval and need to be 57.5% or more before we can conclude that agreement is not due to
random process at the 95% confidence level. As can be seen from Table 3A, the minimum level of
agreement using each screen is always greater than 55.5% and almost always greater than 57.5%.
The second way we demonstrate the strength of the positive correlation is to run a regression
where the dependent variable takes a value of 1 if there is agreement between the experts and crowds,
and the key explanatory variable is where the project was successful on Kickstarter. The coefficient on
the key variable of interest can be stated as ρ= E[Yi | Ci=1] – E[Yi | Ci=0], where Yi is an indicator that
takes the value of 1 if the judge funds the project i, Ci =1 if the crowd funded the project and Ci =0 if the
crowd did not fund the project. If the judge funds a project each time the crowd does and does not fund
the project each time the crowd does not, then E[Yi | Ci=1]=1 and E[Yi | Ci=0]=0 , leading the difference
to be +1 (which, as one would like it to be, is perfect positive correlation). On the other hand, if the
expert rejects a project each time the crowd funds it and funds the project each time the crowd does
not, then E[Yi | Ci=1]=0 and E[Yi | Ci=0]=1 , leading the difference to be -1 (which, as one would like it to
be, is perfect negative correlation). Further, note that if the judge funds projects at random, then E[Yi |
Ci=1] = E[Yi | Ci=0] and hence the correlation between the crowd and expert evaluation is zero. The
requirement for the conditional expectations to be equal is that the projects be funded at random,
rather than the specific probability of say 50%. For example, a judge who used a stacked coin that
funded every third project would still be as likely to fund a project that was funded by the crowd (1/3) as
a project that was not funded by the crowd (still 1/3). This is because with a random coin flip that is
unrelated to whether the crowd did or did not fund the project, the E[Yi]is independent of Ci , leading
E[Yi | Ci=1] = E[Yi | Ci=0]. Therefore, under the null of random funding by the judges (at any approval
rate), we should expect the coefficient in our regression to be zero.
We report the result from these regressions in Table 3B, where, as with Table 2, we pick the first
judge who responded to each set in our survey. The results from Table 3B show that there is in fact a
strong, positive correlation between judge and crowd evaluations, rejecting the null hypothesis that this
could be due to random at the 5% confidence interval. Of course, as with Table 2, we can check that our
specific combination of judges is representative of the findings reported in Table 3B. We find that in
every case our coefficients are significant at the 10% confidence interval, and in nearly 90% of the cases,
they are also significant at the 5% confidence interval.
Despite these differences in categorization of projects, it can be seen that therefore that there is
strong agreement between judges and crowds. Regardless of the screen used, we can almost always
20
reject the hypothesis that the agreement was purely due to chance at the 95% confidence interval, and
always reject it at the 10% confidence interval. This confirms the broad patterns we documented in
Tables 1 and 2. However, Table 3A also documents that the “off diagonals” – the projects where the
crowds and judges disagreed about the funding decision – represent about 40% of the projects and that
these disagreements are most often comprised of projects that were rejected by experts but funded by
the crowd. That is, among the projects where there is a disagreement, an overwhelming share – about
three-quarters of the projects on average– are ones where the crowd chose to fund them but the
experts did not.
In subsequent tables, we focus on two questions related to this heterogeneity. First, are there
systematic differences in the attributes of the projects that are funded by only the crowd and only the
experts? The second question arises from the fact that the majority of disagreements are constituted by
projects funded by the crowd but rejected by experts. Given that many projects were funded by the
crowd, but not by experts, are the results of these projects systematically different than those where
experts and the crowd agreed? Since these projects were successfully funded on Kickstarter, we are
able to examine real outcomes to study this issue. These questions get to the heart of the how the
difference in the organization of crowds from that of experts may lead to different types of projects
being funded.
[Table 4 about here]
In Table 4, we first examine whether there are systematic differences in the characteristics of
projects that were funded only by the crowds compared to those funded only by experts.8 To do so, we
run OLS regressions, where the dependent variable is the specific characteristic we are examining, and
the main right hand side variables are indicators for whether the project fell in one of the four mutually
exclusive categories outlined above. The projects that were funded by neither the crowd nor the
experts are treated as the omitted, reference category, so all coefficients can be interpreted as
deviations from this baseline. The specific screen we use for these regressions is one where the funding
threshold is 75%. All regressions include judge fixed effects and the set of control variables used in
Table 2. We report robust standard errors that are clustered by judge.
8 From this point on, we now focus on the combination of judges that were used in the regressions in Table 2 and
3B that have been shown to be quite typical of the 1,024 possible combinations of judges we might have used.
21
Table 4 shows some interesting patterns. First, projects that were not liked by either the crowds
or judges had larger funding goals than any of the other three categories. Projects that were funded
had systematically lower funding goals, although a large funding goal does not account for why the
crowd did not fund the subset of projects that the experts liked that were unsuccessful on Kickstarter.
Columns 2-6 provide an explanation for why this may be the case. Column 2 documents that projects
that were ultimately funded (rows (a) and (c)) have significantly larger average funding amounts than
those that were funded only by the experts (row (b)). A Wald test for the difference in coefficients
shows that these differences are also statistically significant. That is, it seems that while the funding
goals were not different, projects that the crowds liked had significantly larger average funding amounts
compared to those that were not funded. Note that average funding size is a relevant metric since
Kickstarter collects and keeps data on all those who commit funding to projects even when the project is
unsuccessful in meeting its goal. This is because commitments are made in a continuous manner, but
are only “drawn upon” when the project has met its goal. Thus, we still have instances where some
individuals have committed funding to unsuccessful projects. In these instances, we find that the
average funding amounts are significantly lower. This is most easily seen by looking at Figure 2.
The pattern seen in Figure 2 could be for two reasons. First, those who were successful could be
connected to a wealthier network, so that they are able to get larger commitments from their backers
and hence more easily reach their goal. This might be particularly true because studies of crowdfunding
suggest that friends and family are often a critical base for campaigns (Agrawal et al., 2010)9. The
second explanation is that there are systematic differences in the ways in which the two groups
approach fundraising on Kickstarter, and that the differences in commitments are an indication of the
skill associated with raising money from crowds.10 Of course, these are not mutually exclusive
explanations and both could be true. The evidence presented in Table 4 is certainly consistent with
theory that there are differences in fundraising approaches, and provides some suggestive evidence that
networks may also be important. Columns 3 and 4 of Table 4 show that projects that successfully raise
9 In our follow-up survey of successful projects, project creators suggested that friend and family support was
important, but probably not the provider of the majority of funding. In a five point Likert scale ranging from
“strongly disagree” to “strongly agree,” the mean answer to the question “My backers were mostly friends and
family” was 3.7, s.d.=1.1, 10 Note that there is also the possibility that projects that offered a higher consumption utility (say because people
wanted to watch the play) raised higher amounts through ticket sales. As we note later, this was not the case, so
we do not focus on this possible mechanism.
22
money from crowds provide a greater number of reward levels for the crowds and also more commonly
post “updates” about their project within the first three days after launch. This is equally true for rows
(a) and (c), but we can see that row (b) is significantly different. Moreover, Columns 5 and 6 document
that the projects that were rated highly by experts but did not raise money from crowds also did not
provide as many pictures or videos as those that were successful. In addition, Column 7 suggests that
the language in the projects that were funded only by experts tended to be more formal11 than those
funded by only the crowd, suggesting that crowds may have a disposition towards less formal language.
Together, columns 3-7 paint a consistent picture: raising money from the crowd seems to involve a skill
that may be independent of the quality of the project (in much the same way as raising money from
experts requires skill). Those who do not pitch to the crowd in an appropriate way may not be
successful in raising money, even if the quality of the underlying project is high12.
Columns 8 and 9 examine the hypothesis that those who are successful in raising money from
crowds may have better or wealthier networks. Column 8 shows that those who were successful had
the same network size, as proxied by the number of Facebook friends. A difference in funding
commitment for a similar size of network could be consistent with wealthier friends and family,
although it could also proxy for the skill in approaching the crowd. In Column 9, we show that those
projects that only the crowd liked were somewhat more likely to be based in New York or California –
this could proxy for the wealth of the local network or again, could proxy for savviness with social media
and running crowdfunding campaigns. Alternatively it could also be due only to the degree of diffusion
of the Kickstarter platform in these two states. On balance, we find the strongest evidence for
systematic differences in raising crowd funding as stemming from skill in running such campaigns,
although we cannot rule out that this was also due to differences in networks. Further evidence of the
role of skill in crowdfunding stems from the fact that the attributes of projects funded by both the
11 Our measure of formality in this context is the share of words in the proposal that were longer than 6 letters, as
studies have shown that longer world length in a body of text is correlated with the level of formality in that text
(Brooke, Wang, & Hirst, 2010; Karlgren & Cutting, 1994). We also have some qualitative evidence that proposals
that used swear words were less likely to be funded by experts, suggesting that informality may be punished. 12 These factors of the pitch tend to be established prior to the launch of a crowdfunding campaign. For updates,
we follow Mollick (2014) and only measure whether projects were updated in the first three days after launch,
reducing the risk that updates are a reaction to success. At the same time, we cannot rule out that these factors
could be changed in reaction to the crowd and are careful, therefore, not to push a causal explanation for these
differences.
23
crowd and experts (row (a)) are more similar to those funded by only the crowd (row (c)) than each of
these is to those funded only by experts (row (b)).
Next, we consider how judges rate projects that are supported by the crowd alone compare to
those that are not. Table 5 provides the differences in scores attributed to these projects by our experts.
The specifications run in Table 5 are identical to those in Table 4, with the exception that the dependent
variables are dimensions along which the experts were asked to evaluate the projects. The high scores
associated with rows (a) and (b) are mechanical, in that these are projects that the experts would have
funded. Nevertheless, it is worth noting that the projects that the crowd and experts funded rank higher
than those funded only by experts, again reinforcing the notion that the projects where both crowds
and experts agree to fund are likely to be extremely high quality.
Looking at row (c) is also instructive since it shows that the point estimates are consistently higher
than the omitted category, although they are often imprecisely estimated so that the differences are not
statistically significant. That is, there is a subset of projects that the crowd funded that the experts found
no better than the omitted category (those that neither the crowd nor experts liked). Indeed, our
survey of the successful Kickstarter projects suggests that this was also true to experts in general: the
subset that only the crowd funded raised an average of $1,900 from institutional sources prior to the
campaign compared to $4,850 for those that the experts and crowds funded. That is, our finding that
experts did not rate these projects as highly seems to be broadly representative of how other experts
may have also viewed these projects. Nevertheless, it is interesting that the one column where there is
a statistically significant difference between row (c) and the omitted category is around the quality of
the project. That is, among projects that the experts chose not to fund, those that were funded by the
crowd were deemed to be higher quality projects by the experts than those that the crowd did not fund
(although, of course they were also ranked as lower quality than rows (a) and (b)). Again, this supports
the notion that even when there is disagreement between crowds and experts on the funding decision,
there still seems to be some level of congruence in terms of the broad sense of which projects are
higher quality.
In Tables 6 and 7, we turn to qualitative evidence about the longer-term outcomes of projects. We
relied on survey data for information on both audience size and the degree to which projects succeeded
or failed at meeting their audience goals. We also asked respondents to provide links or excerpts from
reviews. In all cases, we also attempted to locate reviews ourselves by searching for the project on
Factiva and on Google. To be conservative, we classified projects in one of four ways: We considered
24
projects to be failures if they received only bad reviews and did not run for their full length.13 Successes
made up the vast majority of projects. These were projects that ran for their intended length but did not
earn rave reviews from national publications, though they may have received good local press. This
category contains a wide range of projects, some much more successful than others, as indicated by the
qualitative data in the tables. Finally, we categorized projects as commercial hits if they had
substantially extended runs in front of large crowds, and as critical hits if they received either rave
reviews from national publications, or else won prestigious theater awards.
In Table 6, we look at the long-term outcome of the projects that both crowds and experts funded.
We have survey responses that include self-reported outcome data on 11 of the 22 such projects. Using
our conservative coding regime, none of these projects failed, and one turned into a commercial hit.
Examining the more detailed qualitative data, it is apparent that there were a wide variety of critical and
commercial outcomes, but a relative dearth of either clear failures or runaway successes. Though these
results are tentative, most projects selected by both the crowd and experts appeared to deliver on their
promise, with some variation in the critical and commercial acclaim achieved.
In Table 7, we re-create this for projects that the crowd funded, but which the experts did not.
Here we have self-reported outcome data on 17 out of the 38 productions. Remarkably, we find quite a
similar pattern, with the vast majority of projects achieving the same level of success as the projects
endorsed by the experts. To the extent that there are differences, there is one failure among the crowd-
selected projects, and four projects that we could consider hits. Two of these hits are critical, rather
than commercial, successes – an ironic outcome, given that these performances were rejected by the
expert critics, but embraced by the crowd, in the funding stage. We find that the broad picture is one
where 94% of the funded projects supported by the crowd alone had at least moderate success, and
24% were extremely successful, some artistically, and some commercially. This compares to a 100%
success rate from the projects backed by both crowds and experts, of which 9% were extremely
successful14.
13 One concern about crowdfunding has been that some projects may fail to deliver entirely, either because of
malicious intent or else failure on the part of the project creators. We found only one example of this sort of
project, in this case due to the death of a project creator, adding to research suggesting fraud on Kickstarter is
uncommon (Mollick, 2014) 14 While we did not have survey results for the remaining 32 projects, we did seek to establish whether or not
critical reviews of the projects indicated any substantial deviation from that observed in the projects for which we
had survey results. We did not locate any indication of a systematic difference. Of the 11 projects that did not
25
We also endeavored to examine the outcomes of the 11 projects selected by experts but not
funded by the crowd. We were able to determine that seven of these projects were ultimately staged.
All seven would be considered minor successes, but none achieved high levels of critical notice, or
substantial commercial success.
Although we hesitate to draw broad conclusions from the limited data, we find it interesting that
within the bucket of projects unfunded by experts, the experts do seem to give higher ratings to projects
that were ultimately more successful. This suggests that the screen used by the crowd is somewhat
lower, but not entirely without merit (although the crowd also funded the only project to fail
dramatically). These results are suggestive of a case where the crowd selects some projects with greater
variability in potential outcome than experts, resulting in more failures, but more breakout hits, than the
experts, similar to findings about how the structure or the number of participants in screening can
generate more high quality and low quality ideas (Sah & Stiglitz, 1986; Terwiesch & Ulrich, 2009;
Terwiesch & Xu, 2008).
A possible alternative explanation of the ability of the crowd to pick successful projects is that the
crowd might serve as the factor that makes these products succeed. By pre-purchasing tickets through
Kickstarter (one of many potential rewards offered by artists), they may be assuring the success of these
shows. Using our survey data, we examined the 14 projects that provided us with estimates of total
ticket sales. Together, these projects sold 25,779 tickets overall, of which 961 were pre-sold through
Kickstarter, or less than 4%. Pre-sales on Kickstarter did not seem to account for the success of these
shows, based on this measure. Further, pre-sales would not be predictive of critical acclaim, which also
seemed to accrue disproportionately to projects backed by the crowd alone.
6. Discussion
Given the rise of crowds as a vital part of decision-making in areas ranging from product design to
entrepreneurship, the question of how the judgment of crowds compares to that of experts is of great
answer the survey but which were supported by the crowd and the experts, 10 appeared to be successes, with 1
project failing due to the death of a key member of the theater troupe. Of the 21 projects that were funded only
by the crowd, at least 1 was a critical success, winning a prestigious theater award, while 2 others appeared to win
less prestigious theater honors. Additionally, 2 were partial failures, having delivered some of the performances
promised in their campaign, but not all, although both projects promised to finish delivery in 2014 or 2015, and
still appeared to enjoy backer support. These results align with those from the survey group, suggesting that there
does not appear to be large hidden biases in Tables 6 and 7, but that if anything, the crowd seems to be associated
with slightly more variance in outcomes.
26
importance. While there have been some signs that crowds could act wisely, most examples of crowd
wisdom either include experts that ultimately exercise final judgment, as in crowdsourcing (Afuah &
Tucci, 2012; Poetz & Schreier, 2012) or compare aggregated predictions to those of individuals (Budescu
& Chen, 2014; Larrick & Soll, 2012; Wolfers & Zitzewitz, 2004). Crowdfunding, like other emerging areas
where crowds act without intermediaries or secondary markets, operates differently, heightening the
risk that the crowd could be “mad” – subject to irrational exuberance, follies of group decision-making,
or other collective pitfalls. Further, even if crowds are not directly irrational, they could still only express
idiosyncratic or popular tastes, ignoring proposals that would normally be supported by experts.
The first contribution of our work is to document strong congruence in the judgment of crowds and
experts in a highly subjective environment such as theater, even outside of prediction markets or
forecasting competitions. These results were robust to many kinds of measurement. Further, we see no
signs that, for those decisions where crowds and experts diverge, that the decisions supported by the
crowd alone perform systematically worse than those of the experts. The projects selected by the
crowd succeeded 93% of the time, while those selected by crowds and experts succeeded 100% of the
time. However, among the successes, the crowds also seemed associated with bigger hits, suggesting
more variability in the outcomes rather than a lower mean.
Our results also shed light on the differences between crowd and expert judgment. The biggest
differences we found between projects that the crowd alone supported versus those supported by
experts seemed to be in the style of presentation, rather than the quality of the actual project itself. The
more “crowdfunding friendly” a quality proposal was – taking advantage of the internet by using videos
and pictures, including many rewards for backers, and so on – the more it seemed to appeal to the
crowd. Similarly, experts also seem to have signals that they look for – for example the degree of
formality of a proposal, or the presence of swear words. Our results suggest that these differences in
tastes can have meaningful real outcomes, in that the crowd seems willing to fund projects that experts
are not, even when experts are given unlimited funds and similarly, the crowd seems to systematically
miss projects that experts like because they are not pitched in a “crowdfunding friendly” format.
In this sense, our paper provides evidence of the important role crowdfunding can have in
democratizing entry among projects that experts might have rejected. For example, crowdfunding
provides the possibility of funding to individuals who would not otherwise have access to funds because
of the potential challenges of applying for NEA grants: they may not have experience or knowledge of
grant writing, may have the wrong skillset to apply, or may be proposing programs that are not within

27
NEA guidelines. 15 Based on this evidence, the change from a hierarchical expert-led system to a mixed
expert and crowd-based one may have large positive effects on the types of innovations that the system
produces (Sah & Stiglitz, 1986), as allowing more ideas to come to fruition has been shown to lead to
increased innovation quality (Kornish & Ulrich, 2011; Terwiesch & Ulrich, 2009). Similarly, a more diverse
pool of individual innovators can further increase innovation (Østergaard, Timmermans, & Kristinsson,
2011).
It is important to note that, while we find encouraging evidence for the value of crowd decision-
making, this does not devalue the role of experts. For example, some discussions with experts showed
more willingness to fund more artistically challenging work that may not appeal to the crowd. Experts
may also be less swayed by the salesmanship of the pitch, as evidenced by the lower importance they
appeared to place on the multimedia in the pitch itself. Our results are consistent with, and indeed
support, the notion that in a crowd-based decision regime there is still a critical place for expert judges.
In fact, we aim to stress that our setting and research design does not allow us to speak definitively to
the important and pertinent policy question of what would happen to theater projects if we shifted
from a purely expert-funded model to a purely crowd-funded one. This is because we are focused on
projects that applied to a crowd funding site rather than the universe of artistic projects that might be
available16. For example, some have argued that the growing importance of Kickstarter in the funding of
the arts reduces the need for the government to provide funding to such endeavors through the NEA,
which has an annual operating budget of about $150 million. Although our results suggest that
crowdfunding can play an important role to complement such organizations, we are less well-positioned
to speak to questions related to how a decrease in theater grants from the NEA would impact the nature
15 As noted above, there are some suggestions in the data that the crowd may be more willing to take a chance on
projects with higher variance outcomes than experts might be comfortable with. Though it is not statistically
testable, we find that the crowd funded a higher percentage of hits (27%) than the experts (7%), and also the only
project that failed due to a quality issue. Increasing the number of high variance projects may lead to more
breakthrough ideas. 16 Consider the following example: Say of 10 projects p1- p10, the crowd would fund p1-p3, neither crowds nor
experts would fund p4 and experts would fund p5-p10. If a study sample contained only projects p1- p6, say
because p7-p10 were not conducive to being listed on a crowdfunding site, then showing that a majority p1-p6
were funded by the crowd does not tell us anything about whether the crowd-only or expert-only system is better.
In this example, if one were to choose between a crowd-funded or expert-funded system, the expert-based one
would fund six projects compared to only three under a purely crowd-funded system even though the sample in
question had a lower share of projects funded by experts. This is why one would need the universe of projects,
together with project fixed effects to effectively address this policy question. We thank a referee for clarifying this
issue.
28
and style of theater productions in the United States, especially theater produced by underrepresented
groups, or works that are artistically challenging.
Although our analysis was conducted for theater projects, we feel that our key result, that
experts demonstrate a strong congruence with projects funded by the crowd, is likely to generalize to
other settings where the crowd is an end user for the product being financed and hence might be well
positioned to judge the project. While this is likely to be true for many aspects of the arts, such as film,
music and dance, we believe that there are also aspects of technological innovation where crowds can
play a key role in complementing experts as sources of capital. Kickstarter has proven to be an
influential source for innovations in areas as gaming and consumer-facing internet technologies, as well
as more specialized areas such as wearable computing and 3D printing. Indeed, a number of startups
that have raised funding on Kickstarter have gone on to raise institutional venture capital suggesting the
growing role that the crowd can play in providing validation of “traction” for experts.17
Our research has some limitations and strengths. One limitation is our study stems from the
research design: we chose to restrict our analysis to a set of projects where, ex ante, we believed there
to be overlap in the types of projects that were funded by the crowd and the types of projects our
experts would evaluate in other settings, such as when reviewing for the NEA or foundations. We thus
restricted our study to theater projects seeking at least $10,000. While we believe that theater offers a
conservative test of crowd wisdom, given its subjective nature and the divide between critics and
customers, we cannot necessarily generalize these findings to all other forms of crowd judgment.
Furthermore, our results speak to crowd funding behavior conditional on the funding size we studied. If
projects seeking much smaller funding, even within theater, are more frivolous or associated with
different crowdfunding motivations, our findings will not apply to them. Second, while our outcome
data is strongly suggestive of similar outcomes between the crowd only and the expert and crowd
backed projects, it is circumstantial in nature, and hard to measure directly. Third, we focus only on
projects that applied for crowdfunding, rather than the universe of all theater projects, which implies
that we are limited in our ability to speak to which screening regime (crowds vs. experts) is better suited
17 For example, Kerr, Nanda, and Rhodes-Kropf (2014) document the difficulty that even professional investors
have in predicting which investments are likely to be successful. Indeed, there seems to be a growing move among
early stage investors to demonstrate ‘traction’ with customers, as is demonstrated by platforms such as AngelList
profiling these metrics for potential investors.
29
to the projects applying for funding or to address the question of how a shift from one funding regime
to another might impact which projects are commercialized.
Despite these limitations, however, our approach also has strengths. A key strength is that by using
panels of expert judges to evaluate existing projects, we were able to avoid many of the endogenity
concerns that might otherwise arise in such studies. Further, the opinions of judges on projects are
robust to judge fixed effects, suggesting that our results are not purely the result of idiosyncratic views
of some judges. Additionally, we were able to use field data representing actual crowd decisions from
the largest crowdfunding platform, observing both successful and failed projects.
7. Conclusion
Our study offers the first detailed comparison of crowd and expert judgment, an issue of increasing
relevance in a world where crowdfunding, crowdsourcing, crowdscience, and related concepts are
increasing in popularity, and where billions of dollars are being deployed through crowdfunding
platforms. In particular, we can effectively address the extent to which experts agree or disagree with
the funding decisions of the crowd, and thereby use this as a benchmark for the wisdom of crowds. We
find that the crowd is more wise than mad, generally agreeing with the experts, and that, on average,
the projects selected by the crowd alone seem to do as well as those selected by experts. For academics,
our work highlights the need to better understand the ways in which crowd decisions are made and the
circumstances under which the crowd, experts, or a combination should be deployed to address
particular needs. Practically, this paper suggests that crowdfunding may be a viable source of
entrepreneurial financing, for both cultural projects and traditional startups. The crowd has the
potential to increase innovation, lower barriers to entry, and democratize the entrepreneurial process
by allowing more ideas to compete in the marketplace, particularly as a complement to expert
judgment.
30
References
Afuah, A., & Tucci, C. L. (2012). Crowdsourcing as a solution to distant search. Academy of Management Review, 37(3), 355–375.
Agrawal, A., Catalini, C., & Goldfarb, A. (2010). The Geography of Crowdfunding. SSRN Electronic Journal. doi:10.2139/ssrn.1692661
Agrawal, A., Catalini, C., & Goldfarb, A. (2013). The Simple Economics of Crowdfunding. Policy and the Economy, 14, 1–46.
Bahrami, B., Olsen, K., Bang, D., Roepstorff, A., Rees, G., & Frith, C. (2012). What failure in collective decision-making tells us about metacognition. Philosophical Transactions of the Royal Society B: Biological Sciences, 367(1594), 1350–1365.
Balaratnasingam, S., & Janca, A. (2006). Mass hysteria revisited. Current Opinion in Psychiatry, 19(2), 171–174.
Banerjee, A. V. (1992). A simple model of herd behavior. The Quarterly Journal of Economics, 107(3), 797–817.
Barsade, S. G. (2002). The ripple effect: Emotional contagion and its influence on group behavior. Administrative Science Quarterly, 47(4), 644–675.
Baum, J., & Silverman, B. (2004). Picking winners or building them? Alliance, intellectual, and human capital as selection criteria in venture financing and performance of biotechnology startups. Journal of Business Venturing, 19(3), 411–436.
Bikhchandani, S., Hirshleifer, D., & Welch, I. (1992). A theory of fads, fashion, custom, and cultural change as informational cascades. Journal of Political Economy, 992–1026.
Bogers, M., Afuah, A., & Bastian, B. (2010). Users as innovators: a review, critique, and future research directions. Journal of Management, 36, 857–875.
Boudreau, K., Lacetera, N., & Lakhani, K. (2010). The Effects of Increasing Competition and Uncertainty on Incentives and Extreme-Value Outcomes in Innovation Contests. Harvard Business School.
Boudreau, K., Lacetera, N., & Lakhani, K. (2011). Incentives and Problem Uncertainty in Innovation Contests: An Empirical Analysis. Management Science, 57(5), 843–863.
Bourdieu, P. (1975). The specificity of the scientific field and the social conditions of the progress of reason. Social Science Information, 14(6), 19–47. doi:10.1177/053901847501400602
Bourdieu, P. (1984). Distinction: A social critique of the judgement of taste. Harvard University Press.
31
Brooke, J., Wang, T., & Hirst, G. (2010). Automatic acquisition of lexical formality. In Proceedings of the 23rd International Conference on Computational Linguistics: Posters (pp. 90–98). Association for Computational Linguistics.
Budescu, D. V, & Chen, E. (2014). Identifying Expertise to Extract the Wisdom of Crowds. Management Science, Forthcoming.
Caves, R. E. (2000). Creative industries: Contracts between art and commerce. Harvard University Press.
Caves, R. E. (2003). Contracts between art and commerce. Journal of Economic Perspectives, 73–84.
Chen, D., & Lin, Z. (2014). Rational or Irrational Herding in Online Microloan Markets: Evidence from China. Available at SSRN 2425047.
Chen, M. (2008). Modeling a presidential prediction market. Management Science, 54(8), 1381–1394.
Cipriani, M., & Guarino, A. (2005). Herd behavior in a laboratory financial market. American Economic Review, 1427–1443.
Clauson, K. A., Polen, H. H., Boulos, M. N. K., & Dzenowagis, J. H. (2008). Scope, completeness, and accuracy of drug information in Wikipedia. The Annals of Pharmacotherapy, 42(12), 1814–21. doi:10.1345/aph.1L474
Cohen, J. (1968). Weighted kappa: Nominal scale agreement provision for scaled disagreement or partial credit. Psychological Bulletin, 70(4), 213.
Congress, 112th. Jumpstart Our Business Startups Act (2012). US.
Devenow, A., & Welch, I. (1996). Rational herding in financial economics. European Economic Review, 40(3), 603–615.
DiMaggio, P. (1991). Cultural entrepreneurship in nineteenth-century Boston. Rethinking Popular Culture: Contemporary Perspectives in Cultural Studies, 374.
Earley, P. C. (1989). Social loafing and collectivism: A comparison of the United States and the People’s Republic of China. Administrative Science Quarterly, 565–581.
Eliashberg, J., & Shugan, S. M. (1997). Film critics: Influencers or predictors? The Journal of Marketing, 68–78.
Ferrary, M., & Granovetter, M. (2009). The role of venture capital firms in Silicon Valley’s complex innovation network. Economy and Society, 38(2), 326–359.
Franzoni, C., & Sauermann, H. (2014). Crowd science: The organization of scientific research in open collaborative projects. Research Policy, 43(1), 1–20. doi:10.1016/j.respol.2013.07.005
32
Gans, H. (2008). Popular Culture and High Culture: An Analysis and Evaluation Of Taste (Revised And Updated). Basic Books.
Giles, J. (2005). Internet encyclopaedias go head to head. Nature, 438(7070), 900–901.
Ginsburgh, V. (2003). Awards, success and aesthetic quality in the arts. The Journal of Economic Perspectives, 17(2), 99–111.
Goldfarb, B. (2008). The effect of government contracting on academic research: Does the source of funding affect scientific output? Research Policy, 37(1), 41–58.
Gompers, P., & Lerner, J. (2004). The venture capital cycle. MIT Press.
Greenstein, S., & Zhu, F. (2012). Is Wikipedia Biased? The American Economic Review, 102(3), 343–348.
Greenstein, S., & Zhu, F. (2014). Do Experts or Collective Intelligence Write with More Bias: Evience from Encyclopedia Britannica and Wikipedia (No. 15-023).
Hellmann, T., & Puri, M. (2002). Venture Capital and the Professionalization of Start‐up Firms: Empirical Evidence. The Journal of Finance, 57(1), 169–197.
Isenberg, D. (2012). The Road to Crowdfunding Hell, Harvard Business Review Online, retrieved from https://hbr.org/2012/04/the-road-to-crowdfunding-hell/.
Janis, I. L. (1982). Groupthink: Psychological Studies of Policy Decisions and Fiasces. Houghton Mifflin.
Jeppesen, L., & Frederiksen, L. (2006). Why do users contribute to firm-hosted user communities? The case of computer-controlled music instruments. Organization Science, 17(1), 45.
Karlgren, J., & Cutting, D. (1994). Recognizing text genres with simple metrics using discriminant analysis. In Proceedings of the 15th conference on Computational linguistics-Volume 2 (pp. 1071–1075). Association for Computational Linguistics.
Kerr, W. R., Nanda, R., & Rhodes-Kropf, M. (2013). Entrepreneurship as Experimentation.
Kim, B. K., & Jensen, M. (2011). How product order affects market identity repertoire ordering in the US opera market. Administrative Science Quarterly, 56(2), 238–256.
Kornish, L. J., & Ulrich, K. T. (2011). Opportunity spaces in innovation: Empirical analysis of large samples of ideas. Management Science, 57(1), 107–128.
Kortum, S., & Lerner, J. (2000). Assessing the contribution of venture capital to innovation. RAND Journal of Economics, 31(4), 674.
Kriauciunas, A., Parmigiani, A., & Rivera-Santos, M. (2011). Crowdfunding creative ideas: the dynamics of projects backers in Kickstarter. Strategic Management Journal, 32(9), 994–1010.
33
Kuppuswamy, V., & Bayus, B. L. (2013). Crowdfunding Creative Ideas: The Dynamics of Project Backers in Kickstarter. SSRN Electronic Journal.
Larrick, R., Mannes, A., & Soll, J. (2012). The social psychology of the wisdom of crowds. Frontiers in Social Psychology: Social Judgment and Decision Making, 227–242.
Larrick, R., & Soll, J. (2012). Intuitions about combining opinions: Misappreciation of the averaging principle. Management Science, 52(1), 111–127.
Latane, B., Williams, K., Harkins, S., & Latané, B. (1979). Many hands make light the work: The causes and consequences of social loafing. Journal of Personality and Social Psychology, 37(6), 822.
Mackay, C. (1852). Extraordinary Popular Delusions and the Madness of Crowds. Extraordinary popular delusions and the madness of crowds (Second Edi., p. ix,214p.). London: Richard Bentley.
Makridakis, S., & Winkler, R. L. (1983). Averages of forecasts: Some empirical results. Management Science, 29(9), 987–996.
Mollick, E. (2014). The Dynamics of Crowdfunding: Determinants of Success and Failure. Journal of Business Venturing, 29(1), 1–16.
Mollick, E., & Kuppuswamy, V. (Forthcoming). Crowdfunding: Evidence on the Democratization of Startup Funding. In K. Lakhani & D. Harhoff (Eds.), Revolutionizing Innovation: Users, Communities and Openness. MIT Press.
Nanda, R., & Rhodes-Kropf, M. (2012). Financing risk and innovation. Harvard Business School Entrepreneurial Management Working Paper, (11-013).
Nelson, R. R. (1959). The Simple Economics of Basic Scientific Research. Journal of Political Economy, 67.
O’Mahony, S. (2003). Guarding the commons: how community managed software projects protect their work. Research Policy, 32(7), 1179–1198.
Østergaard, C. R., Timmermans, B., & Kristinsson, K. (2011). Does a different view create something new? The effect of employee diversity on innovation. Research Policy, 40(3), 500–509.
Peterson, R. A., & Kern, R. M. (1996). Changing highbrow taste: from snob to omnivore. American Sociological Review, 900–907.
Poetz, M., & Schreier, M. (2012). The value of crowdsourcing: can users really compete with professionals in generating new product ideas? Journal of Product Innovation Managment, 29(2).
Raafat, R. M., Chater, N., & Frith, C. (2009). Herding in humans. Trends in Cognitive Sciences, 13(10), 420–428.
Rajagopalan, M. S., Khanna, V. K., Leiter, Y., Stott, M., Showalter, T. N., Dicker, A. P., & Lawrence, Y. R. (2011). Patient-oriented cancer information on the internet: a comparison of wikipedia and a
34
professionally maintained database. Journal of Oncology Practice / American Society of Clinical Oncology, 7(5), 319–23.
Ray, R. (2006). Prediction Markets and the Financial“ Wisdom of Crowds.” The Journal of Behavioral Finance, 7(1), 2–4.
Reinstein, D. A., & Snyder, C. M. (2005a). The influence of expert reviews on consumer demand for experience goods: A case study of movie critics. Journal of Industrial Economics, 53(1), 27–51.
Reinstein, D. A., & Snyder, C. M. (2005b). The influence of expert reviews on consumer demand for experience goods: A case study of movie critics. The Journal of Industrial Economics, 53(1), 27–51.
Sah, R. K., & Stiglitz, J. E. (1986). The Architecture of Economic Systems: Hierarchies and Polyarchies. The American Economic Review, 76(4), 716–727.
Scharfstein, D. S., & Stein, J. C. (1990). Herd behavior and investment. The American Economic Review, 465–479.
Schulz-Hardt, S., Brodbeck, F. C., Mojzisch, A., Kerschreiter, R., & Frey, D. (2006). Group decision making in hidden profile situations: dissent as a facilitator for decision quality. Journal of Personality and Social Psychology, 91(6), 1080.
Schumpeter, J. (1942). Capitalism, Socialism and Democracy. Economica (Vol. 11, p. 40). Harper.
Shane, S., & Venkataraman, S. (2003). Guest editors’ introduction to the special issue on technology entrepreneurship. Research Policy, 32(2), 181–184.
Shrum, W. (1991). Critics and publics: Cultural mediation in highbrow and popular performing arts. American Journal of Sociology, 97(2), 347–375.
Simmons, J. P., Nelson, L. D., Galak, J., & Frederick, S. (2011). Intuitive biases in choice versus estimation: Implications for the wisdom of crowds. Journal of Consumer Research, 38(1), 1–15.
Surowiecki, J. (2004). The wisdom of crowds: Why the many are smarter and how collective wisdom shapes business, economies, societies, and nations (p. 336). New York: Random House.
Terwiesch, C., & Ulrich, K. (2009). Innovation tournaments: Creating and selecting exceptional opportunities (p. 256). Harvard Univ Pr.
Terwiesch, C., & Xu, Y. (2008). Innovation contests, open innovation, and multiagent problem solving. Management Science, 54(9), 1529–1543.
Tetlock, P. (2005). Expert political judgment: How good is it? How can we know?. Princeton University Press.
Von Hippel, E. (1986). Lead users: A source of novel product concepts. Management Science, 32(7), 791–805.
35
Wenger, E. C., & Snyder, W. M. (2000). Communities of practice: The organizational frontier. Harvard Business Review, 78(1), 139–146.
Wijnberg, N. M., & Gemser, G. (2000). Adding value to innovation: Impressionism and the transformation of the selection system in visual arts. Organization Science, 11(3), 323–329.
Wolfers, J., & Zitzewitz, E. (2004). Prediction Markets. Journal of Economic Perspectives, 18(2), 107–126.
Woronkowicz, J., Nicols, B., & Iyengar, S. (2012). How the United States funds the arts. National Endowment for the Arts.
Zhang, J., & Liu, P. (2012). Rational herding in microloan markets. Management Science, 58(5), 892–912.
Zuckerman, E. (1999). The categorical imperative: securities analysts and the illegitimacy discount. American Journal of Sociology, 104(5), 1398–1438.
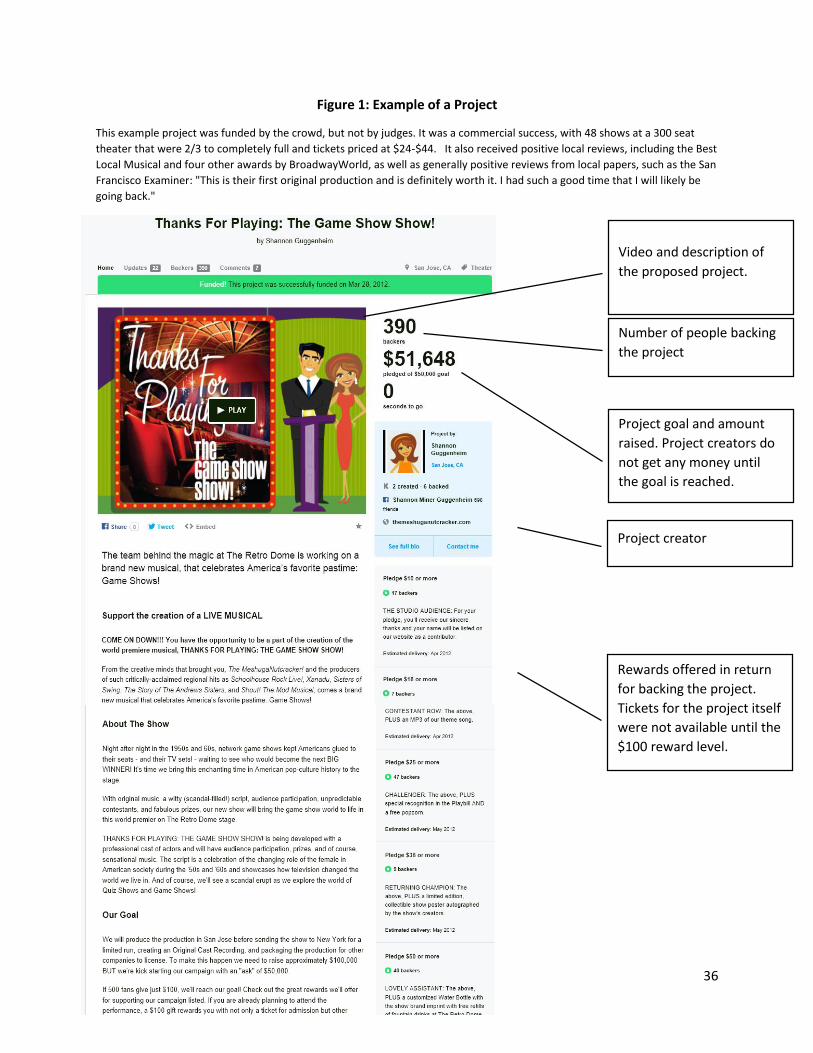
36
Figure 1: Example of a Project
This example project was funded by the crowd, but not by judges. It was a commercial success, with 48 shows at a 300 seat
theater that were 2/3 to completely full and tickets priced at $24-$44. It also received positive local reviews, including the Best
Local Musical and four other awards by BroadwayWorld, as well as generally positive reviews from local papers, such as the San
Francisco Examiner: "This is their first original production and is definitely worth it. I had such a good time that I will likely be
going back."
Project goal and amount
raised. Project creators do
not get any money until
the goal is reached.
Video and description of
the proposed project.
Number of people backing
the project
Rewards offered in return
for backing the project.
Tickets for the project itself
were not available until the
$100 reward level.
Project creator
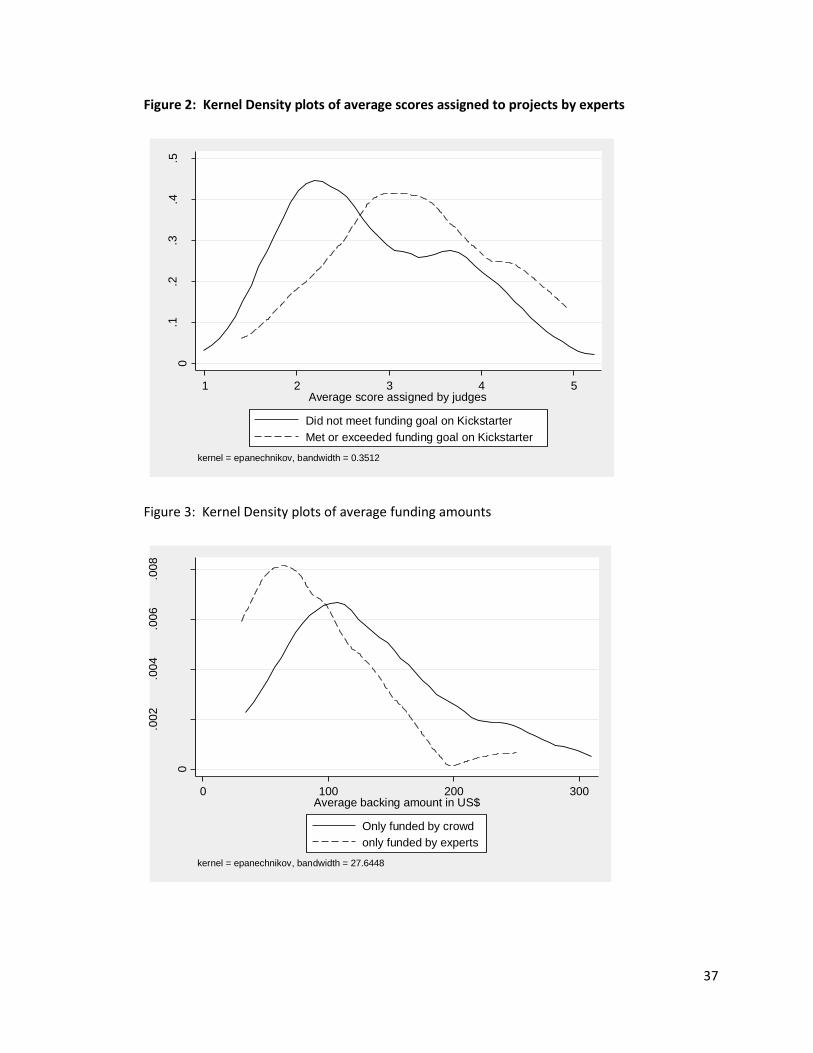
37
Figure 2: Kernel Density plots of average scores assigned to projects by experts
Figure 3: Kernel Density plots of average funding amounts
0.1
.2.3
.4.5
De
nsity
1 2 3 4 5Average score assigned by judges
Did not meet funding goal on Kickstarter
Met or exceeded funding goal on Kickstarter
kernel = epanechnikov, bandwidth = 0.3512
0
.002
.004
.006
.008
Density
0 100 200 300Average backing amount in US$
Only funded by crowd
only funded by experts
kernel = epanechnikov, bandwidth = 27.6448
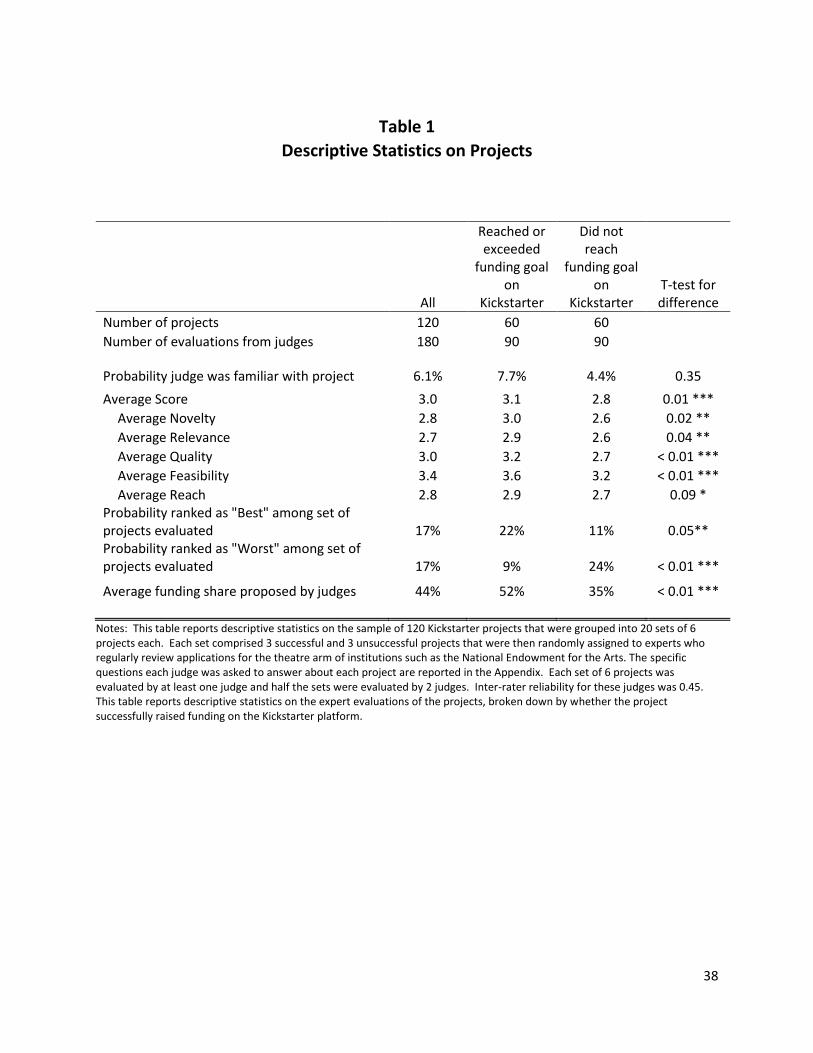
38
Table 1
Descriptive Statistics on Projects
All
Reached or exceeded
funding goal on
Kickstarter
Did not reach
funding goal on
Kickstarter T-test for difference
Number of projects 120 60 60
Number of evaluations from judges 180 90 90
Probability judge was familiar with project 6.1% 7.7% 4.4% 0.35
Average Score 3.0 3.1 2.8 0.01 ***
Average Novelty 2.8 3.0 2.6 0.02 **
Average Relevance 2.7 2.9 2.6 0.04 **
Average Quality 3.0 3.2 2.7 < 0.01 ***
Average Feasibility 3.4 3.6 3.2 < 0.01 ***
Average Reach 2.8 2.9 2.7 0.09 * Probability ranked as "Best" among set of projects evaluated 17% 22% 11% 0.05** Probability ranked as "Worst" among set of projects evaluated 17% 9% 24% < 0.01 ***
Average funding share proposed by judges 44% 52% 35% < 0.01 ***
Notes: This table reports descriptive statistics on the sample of 120 Kickstarter projects that were grouped into 20 sets of 6 projects each. Each set comprised 3 successful and 3 unsuccessful projects that were then randomly assigned to experts who regularly review applications for the theatre arm of institutions such as the National Endowment for the Arts. The specific questions each judge was asked to answer about each project are reported in the Appendix. Each set of 6 projects was evaluated by at least one judge and half the sets were evaluated by 2 judges. Inter-rater reliability for these judges was 0.45. This table reports descriptive statistics on the expert evaluations of the projects, broken down by whether the project successfully raised funding on the Kickstarter platform.
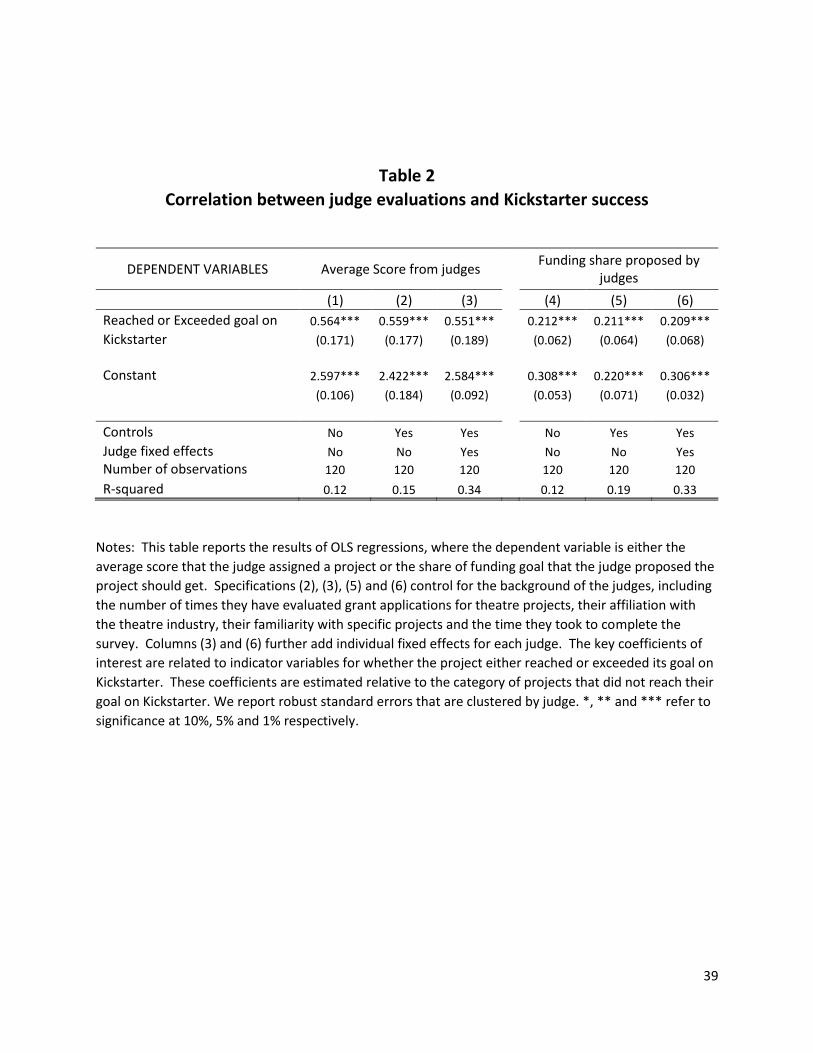
39
Table 2
Correlation between judge evaluations and Kickstarter success
DEPENDENT VARIABLES Average Score from judges Funding share proposed by
judges
(1) (2) (3) (4) (5) (6)
Reached or Exceeded goal on 0.564*** 0.559*** 0.551*** 0.212*** 0.211*** 0.209***
Kickstarter (0.171) (0.177) (0.189) (0.062) (0.064) (0.068)
Constant 2.597*** 2.422*** 2.584*** 0.308*** 0.220*** 0.306***
(0.106) (0.184) (0.092) (0.053) (0.071) (0.032)
Controls No Yes Yes No Yes Yes
Judge fixed effects No No Yes No No Yes
Number of observations 120 120 120 120 120 120
R-squared 0.12 0.15 0.34 0.12 0.19 0.33
Notes: This table reports the results of OLS regressions, where the dependent variable is either the
average score that the judge assigned a project or the share of funding goal that the judge proposed the
project should get. Specifications (2), (3), (5) and (6) control for the background of the judges, including
the number of times they have evaluated grant applications for theatre projects, their affiliation with
the theatre industry, their familiarity with specific projects and the time they took to complete the
survey. Columns (3) and (6) further add individual fixed effects for each judge. The key coefficients of
interest are related to indicator variables for whether the project either reached or exceeded its goal on
Kickstarter. These coefficients are estimated relative to the category of projects that did not reach their
goal on Kickstarter. We report robust standard errors that are clustered by judge. *, ** and *** refer to
significance at 10%, 5% and 1% respectively.
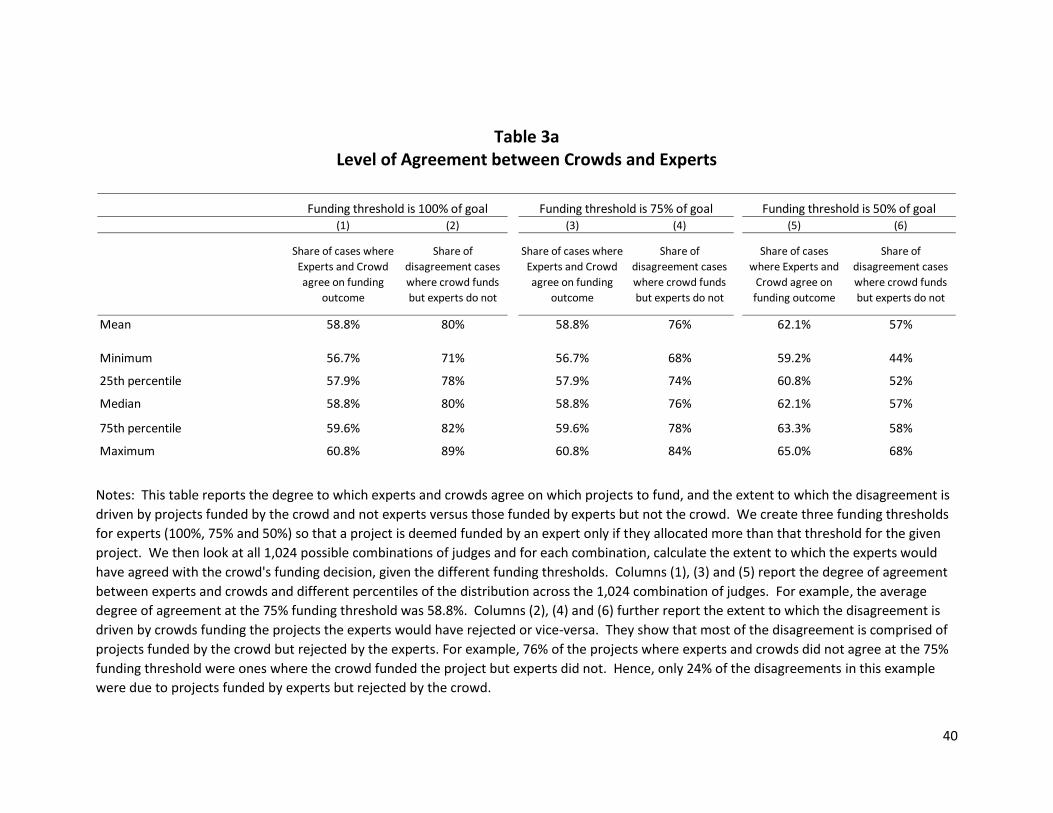
40
Table 3a Level of Agreement between Crowds and Experts
Notes: This table reports the degree to which experts and crowds agree on which projects to fund, and the extent to which the disagreement is
driven by projects funded by the crowd and not experts versus those funded by experts but not the crowd. We create three funding thresholds
for experts (100%, 75% and 50%) so that a project is deemed funded by an expert only if they allocated more than that threshold for the given
project. We then look at all 1,024 possible combinations of judges and for each combination, calculate the extent to which the experts would
have agreed with the crowd's funding decision, given the different funding thresholds. Columns (1), (3) and (5) report the degree of agreement
between experts and crowds and different percentiles of the distribution across the 1,024 combination of judges. For example, the average
degree of agreement at the 75% funding threshold was 58.8%. Columns (2), (4) and (6) further report the extent to which the disagreement is
driven by crowds funding the projects the experts would have rejected or vice-versa. They show that most of the disagreement is comprised of
projects funded by the crowd but rejected by the experts. For example, 76% of the projects where experts and crowds did not agree at the 75%
funding threshold were ones where the crowd funded the project but experts did not. Hence, only 24% of the disagreements in this example
were due to projects funded by experts but rejected by the crowd.
(1) (2) (3) (4) (5) (6)
Share of cases where
Experts and Crowd
agree on funding
outcome
Share of
disagreement cases
where crowd funds
but experts do not
Share of cases where
Experts and Crowd
agree on funding
outcome
Share of
disagreement cases
where crowd funds
but experts do not
Share of cases
where Experts and
Crowd agree on
funding outcome
Share of
disagreement cases
where crowd funds
but experts do not
Mean 58.8% 80% 58.8% 76% 62.1% 57%
Minimum 56.7% 71% 56.7% 68% 59.2% 44%
25th percentile 57.9% 78% 57.9% 74% 60.8% 52%
Median 58.8% 80% 58.8% 76% 62.1% 57%
75th percentile 59.6% 82% 59.6% 78% 63.3% 58%
Maximum 60.8% 89% 60.8% 84% 65.0% 68%
Funding threshold is 100% of goal Funding threshold is 75% of goal Funding threshold is 50% of goal
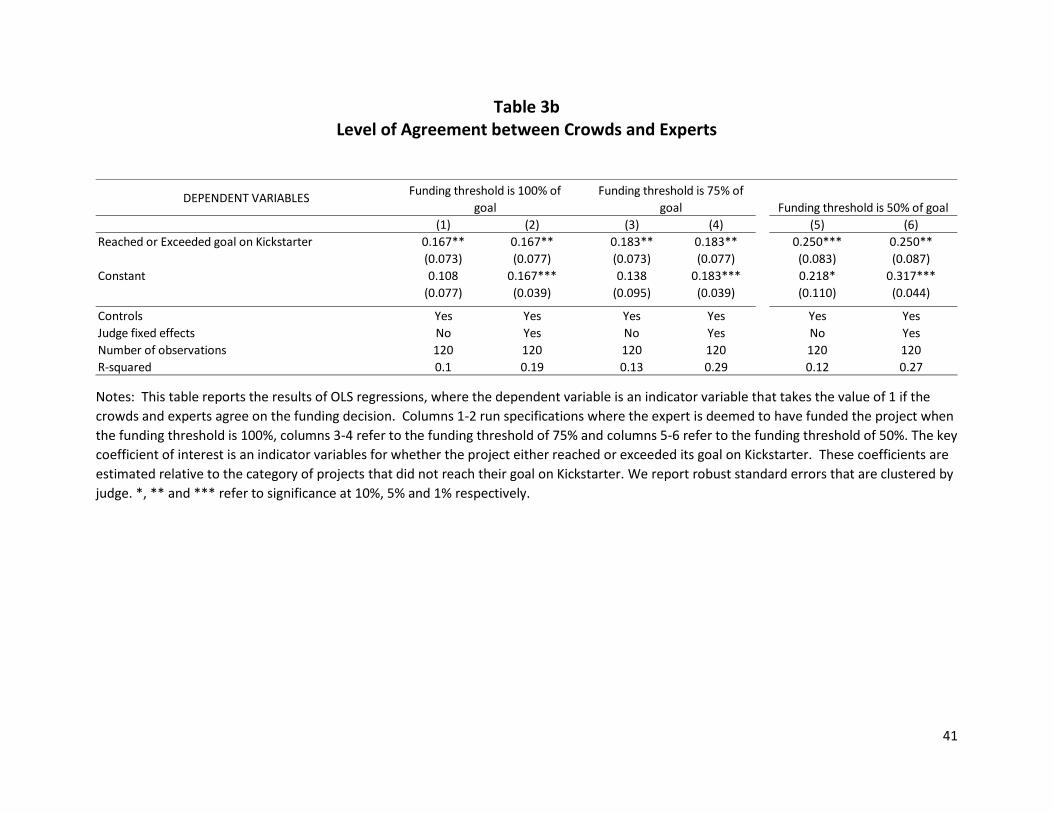
41
Table 3b Level of Agreement between Crowds and Experts
Notes: This table reports the results of OLS regressions, where the dependent variable is an indicator variable that takes the value of 1 if the
crowds and experts agree on the funding decision. Columns 1-2 run specifications where the expert is deemed to have funded the project when
the funding threshold is 100%, columns 3-4 refer to the funding threshold of 75% and columns 5-6 refer to the funding threshold of 50%. The key
coefficient of interest is an indicator variables for whether the project either reached or exceeded its goal on Kickstarter. These coefficients are
estimated relative to the category of projects that did not reach their goal on Kickstarter. We report robust standard errors that are clustered by
judge. *, ** and *** refer to significance at 10%, 5% and 1% respectively.
DEPENDENT VARIABLES
(1) (2) (3) (4) (5) (6)
Reached or Exceeded goal on Kickstarter 0.167** 0.167** 0.183** 0.183** 0.250*** 0.250**
(0.073) (0.077) (0.073) (0.077) (0.083) (0.087)
Constant 0.108 0.167*** 0.138 0.183*** 0.218* 0.317***
(0.077) (0.039) (0.095) (0.039) (0.110) (0.044)
Controls Yes Yes Yes Yes Yes Yes
Judge fixed effects No Yes No Yes No Yes
Number of observations 120 120 120 120 120 120
R-squared 0.1 0.19 0.13 0.29 0.12 0.27
Funding threshold is 50% of goal
Funding threshold is 75% of
goal
Funding threshold is 100% of
goal
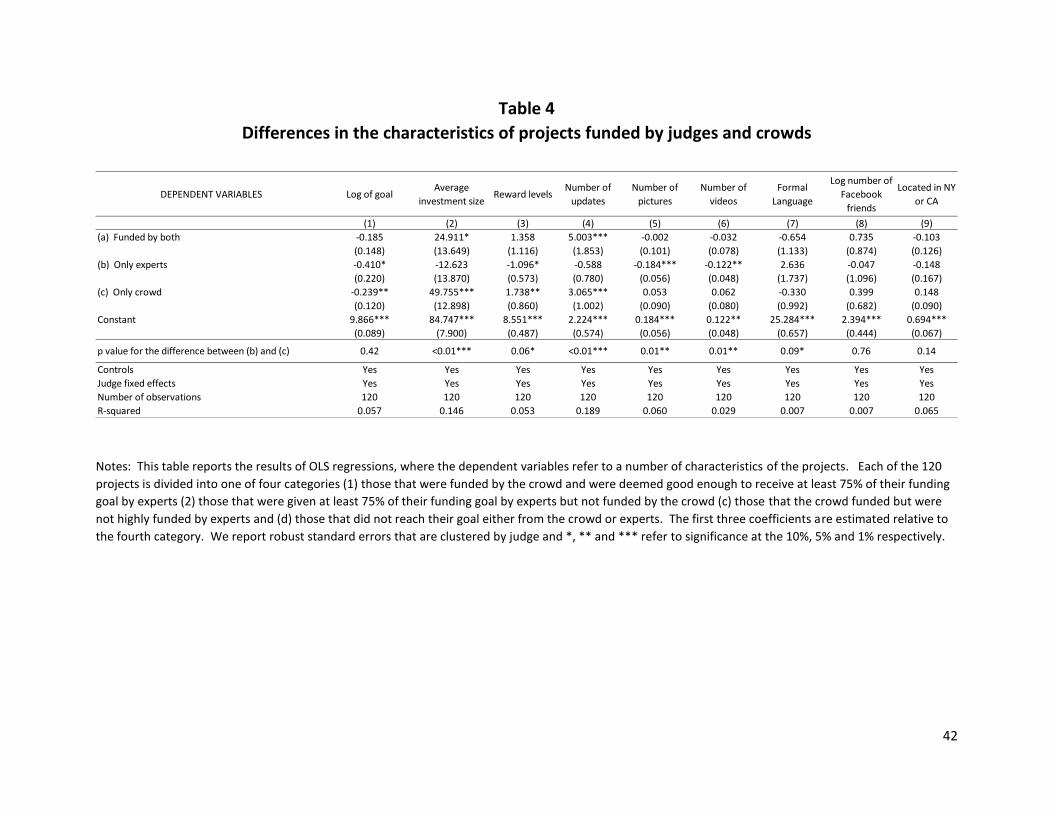
42
Table 4
Differences in the characteristics of projects funded by judges and crowds
Notes: This table reports the results of OLS regressions, where the dependent variables refer to a number of characteristics of the projects. Each of the 120
projects is divided into one of four categories (1) those that were funded by the crowd and were deemed good enough to receive at least 75% of their funding
goal by experts (2) those that were given at least 75% of their funding goal by experts but not funded by the crowd (c) those that the crowd funded but were
not highly funded by experts and (d) those that did not reach their goal either from the crowd or experts. The first three coefficients are estimated relative to
the fourth category. We report robust standard errors that are clustered by judge and *, ** and *** refer to significance at the 10%, 5% and 1% respectively.
DEPENDENT VARIABLES Log of goalAverage
investment sizeReward levels
Number of
updates
Number of
pictures
Number of
videos
Formal
Language
Log number of
friends
Located in NY
or CA
(1) (2) (3) (4) (5) (6) (7) (8) (9)
(a) Funded by both -0.185 24.911* 1.358 5.003*** -0.002 -0.032 -0.654 0.735 -0.103
(0.148) (13.649) (1.116) (1.853) (0.101) (0.078) (1.133) (0.874) (0.126)
(b) Only experts -0.410* -12.623 -1.096* -0.588 -0.184*** -0.122** 2.636 -0.047 -0.148
(0.220) (13.870) (0.573) (0.780) (0.056) (0.048) (1.737) (1.096) (0.167)
(c) Only crowd -0.239** 49.755*** 1.738** 3.065*** 0.053 0.062 -0.330 0.399 0.148
(0.120) (12.898) (0.860) (1.002) (0.090) (0.080) (0.992) (0.682) (0.090)
Constant 9.866*** 84.747*** 8.551*** 2.224*** 0.184*** 0.122** 25.284*** 2.394*** 0.694***
(0.089) (7.900) (0.487) (0.574) (0.056) (0.048) (0.657) (0.444) (0.067)
p value for the difference between (b) and (c) 0.42 <0.01*** 0.06* <0.01*** 0.01** 0.01** 0.09* 0.76 0.14
Controls Yes Yes Yes Yes Yes Yes Yes Yes Yes
Judge fixed effects Yes Yes Yes Yes Yes Yes Yes Yes Yes
Number of observations 120 120 120 120 120 120 120 120 120
R-squared 0.057 0.146 0.053 0.189 0.060 0.029 0.007 0.007 0.065
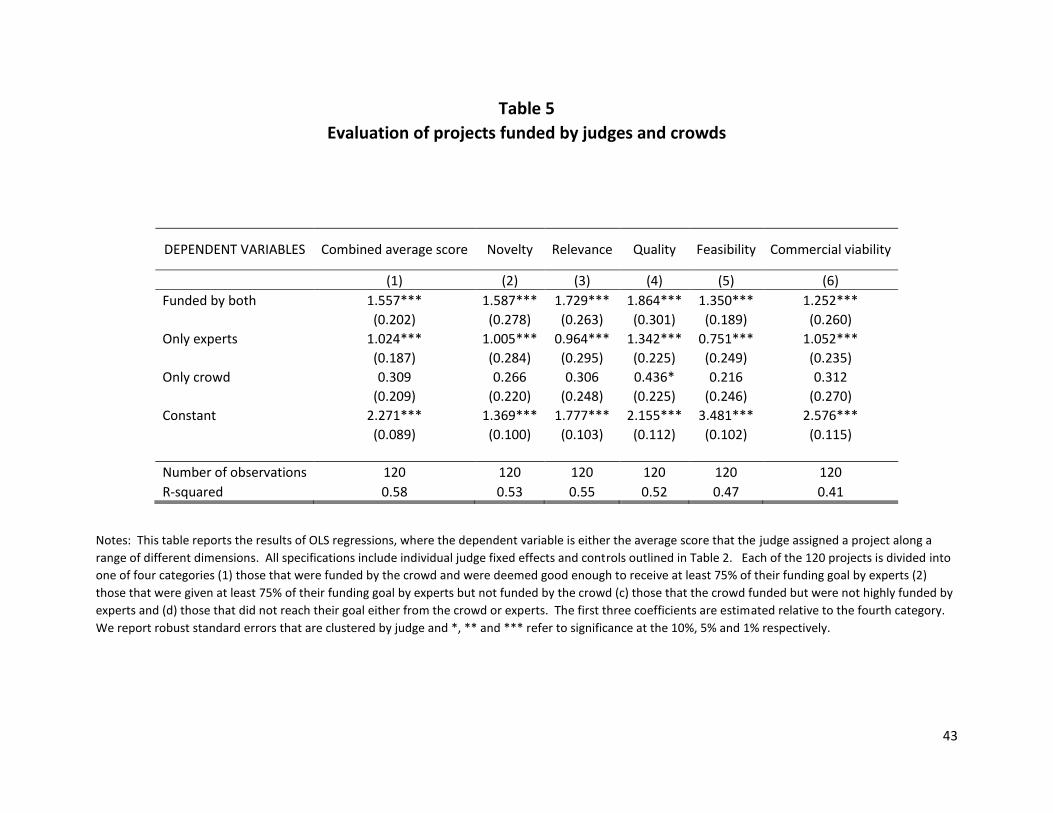
43
Table 5
Evaluation of projects funded by judges and crowds
DEPENDENT VARIABLES Combined average score Novelty Relevance Quality Feasibility Commercial viability
(1) (2) (3) (4) (5) (6)
Funded by both 1.557*** 1.587*** 1.729*** 1.864*** 1.350*** 1.252***
(0.202) (0.278) (0.263) (0.301) (0.189) (0.260)
Only experts 1.024*** 1.005*** 0.964*** 1.342*** 0.751*** 1.052***
(0.187) (0.284) (0.295) (0.225) (0.249) (0.235)
Only crowd 0.309 0.266 0.306 0.436* 0.216 0.312
(0.209) (0.220) (0.248) (0.225) (0.246) (0.270)
Constant 2.271*** 1.369*** 1.777*** 2.155*** 3.481*** 2.576***
(0.089) (0.100) (0.103) (0.112) (0.102) (0.115)
Number of observations 120 120 120 120 120 120
R-squared 0.58 0.53 0.55 0.52 0.47 0.41
Notes: This table reports the results of OLS regressions, where the dependent variable is either the average score that the judge assigned a project along a
range of different dimensions. All specifications include individual judge fixed effects and controls outlined in Table 2. Each of the 120 projects is divided into
one of four categories (1) those that were funded by the crowd and were deemed good enough to receive at least 75% of their funding goal by experts (2)
those that were given at least 75% of their funding goal by experts but not funded by the crowd (c) those that the crowd funded but were not highly funded by
experts and (d) those that did not reach their goal either from the crowd or experts. The first three coefficients are estimated relative to the fourth category.
We report robust standard errors that are clustered by judge and *, ** and *** refer to significance at the 10%, 5% and 1% respectively.
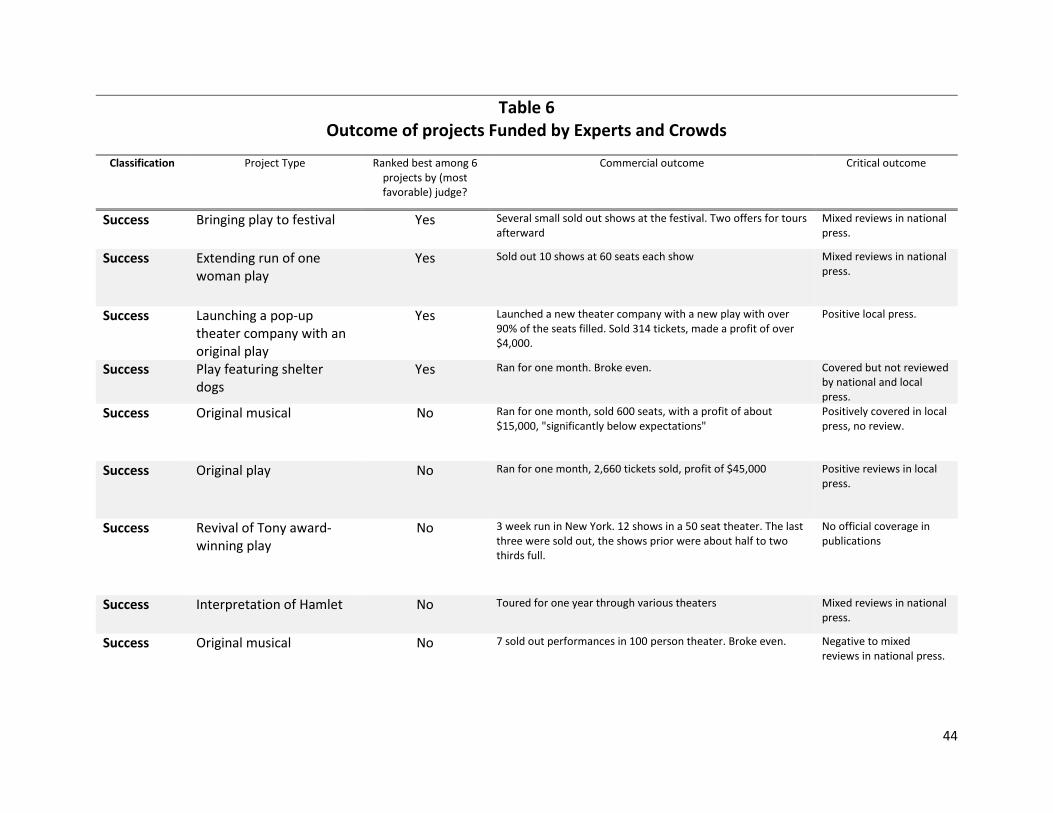
44
Table 6 Outcome of projects Funded by Experts and Crowds
Classification Project Type Ranked best among 6 projects by (most favorable) judge?
Commercial outcome Critical outcome
Success Bringing play to festival Yes Several small sold out shows at the festival. Two offers for tours afterward
Mixed reviews in national press.
Success Extending run of one woman play
Yes Sold out 10 shows at 60 seats each show Mixed reviews in national press.
Success Launching a pop-up theater company with an original play
Yes Launched a new theater company with a new play with over 90% of the seats filled. Sold 314 tickets, made a profit of over $4,000.
Positive local press.
Success Play featuring shelter dogs
Yes Ran for one month. Broke even. Covered but not reviewed by national and local press.
Success Original musical No Ran for one month, sold 600 seats, with a profit of about $15,000, "significantly below expectations"
Positively covered in local press, no review.
Success Original play No Ran for one month, 2,660 tickets sold, profit of $45,000 Positive reviews in local press.
Success Revival of Tony award-winning play
No 3 week run in New York. 12 shows in a 50 seat theater. The last three were sold out, the shows prior were about half to two thirds full.
No official coverage in publications
Success Interpretation of Hamlet No Toured for one year through various theaters Mixed reviews in national press.
Success Original musical No 7 sold out performances in 100 person theater. Broke even. Negative to mixed reviews in national press.
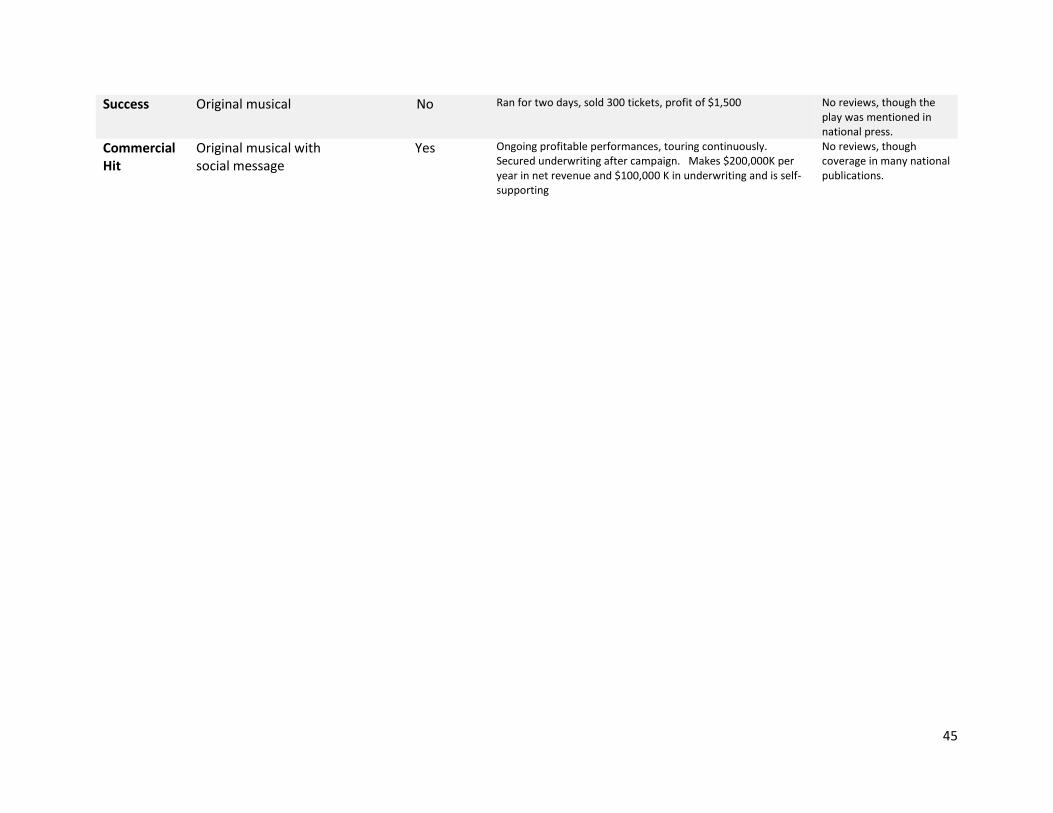
45
Success Original musical No Ran for two days, sold 300 tickets, profit of $1,500 No reviews, though the play was mentioned in national press.
Commercial Hit
Original musical with social message
Yes Ongoing profitable performances, touring continuously. Secured underwriting after campaign. Makes $200,000K per year in net revenue and $100,000 K in underwriting and is self-supporting
No reviews, though coverage in many national publications.
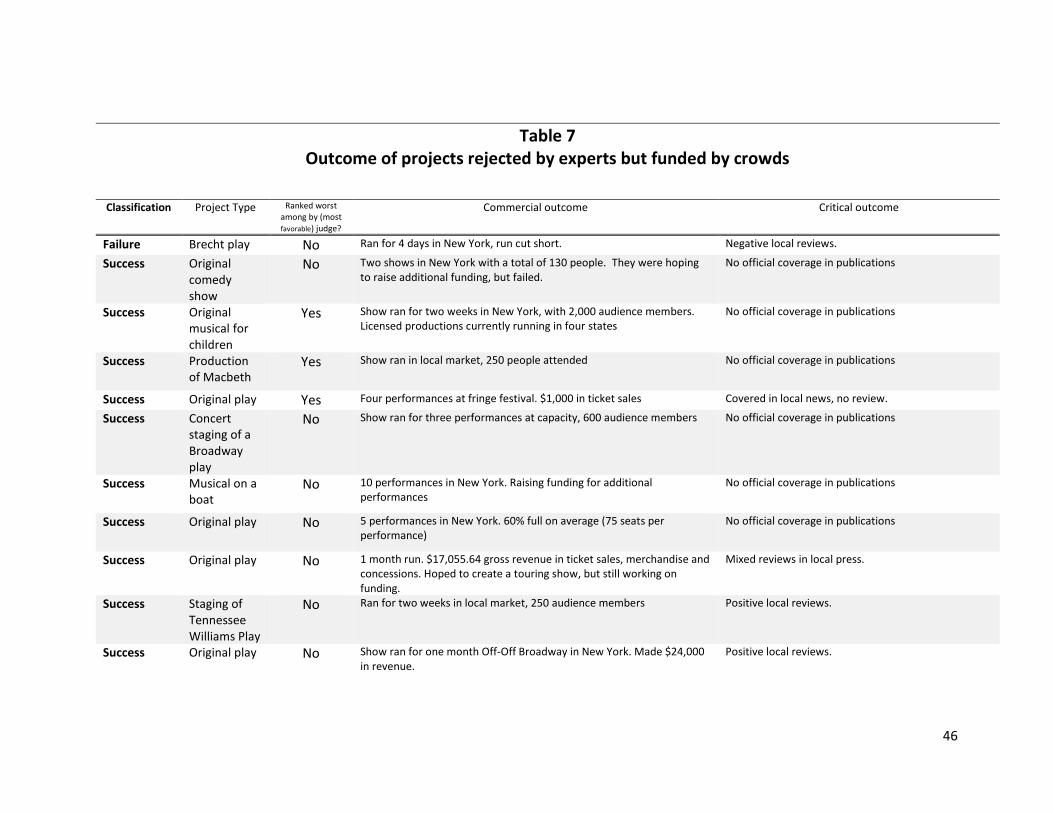
46
Table 7 Outcome of projects rejected by experts but funded by crowds
Classification Project Type Ranked worst among by (most favorable) judge?
Commercial outcome Critical outcome
Failure Brecht play No Ran for 4 days in New York, run cut short. Negative local reviews.
Success Original comedy show
No Two shows in New York with a total of 130 people. They were hoping to raise additional funding, but failed.
No official coverage in publications
Success Original musical for children
Yes Show ran for two weeks in New York, with 2,000 audience members. Licensed productions currently running in four states
No official coverage in publications
Success Production of Macbeth
Yes Show ran in local market, 250 people attended No official coverage in publications
Success Original play Yes Four performances at fringe festival. $1,000 in ticket sales Covered in local news, no review.
Success Concert staging of a Broadway play
No Show ran for three performances at capacity, 600 audience members No official coverage in publications
Success Musical on a boat
No 10 performances in New York. Raising funding for additional performances
No official coverage in publications
Success Original play No 5 performances in New York. 60% full on average (75 seats per performance)
No official coverage in publications
Success Original play No 1 month run. $17,055.64 gross revenue in ticket sales, merchandise and concessions. Hoped to create a touring show, but still working on funding.
Mixed reviews in local press.
Success Staging of Tennessee Williams Play
No Ran for two weeks in local market, 250 audience members Positive local reviews.
Success Original play No Show ran for one month Off-Off Broadway in New York. Made $24,000 in revenue.
Positive local reviews.
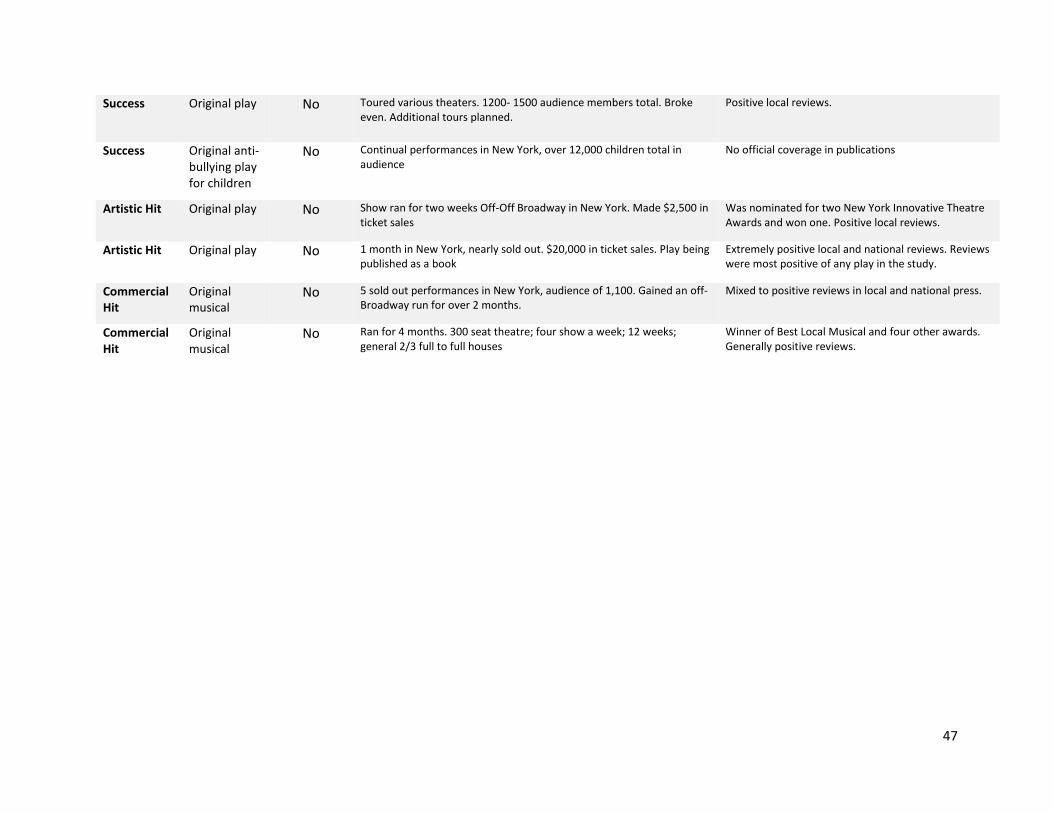
47
Success Original play No Toured various theaters. 1200- 1500 audience members total. Broke even. Additional tours planned.
Positive local reviews.
Success Original anti-bullying play for children
No Continual performances in New York, over 12,000 children total in audience
No official coverage in publications
Artistic Hit Original play No Show ran for two weeks Off-Off Broadway in New York. Made $2,500 in ticket sales
Was nominated for two New York Innovative Theatre Awards and won one. Positive local reviews.
Artistic Hit Original play No 1 month in New York, nearly sold out. $20,000 in ticket sales. Play being published as a book
Extremely positive local and national reviews. Reviews were most positive of any play in the study.
Commercial Hit
Original musical
No 5 sold out performances in New York, audience of 1,100. Gained an off-Broadway run for over 2 months.
Mixed to positive reviews in local and national press.
Commercial Hit
Original musical
No Ran for 4 months. 300 seat theatre; four show a week; 12 weeks; general 2/3 full to full houses
Winner of Best Local Musical and four other awards. Generally positive reviews.
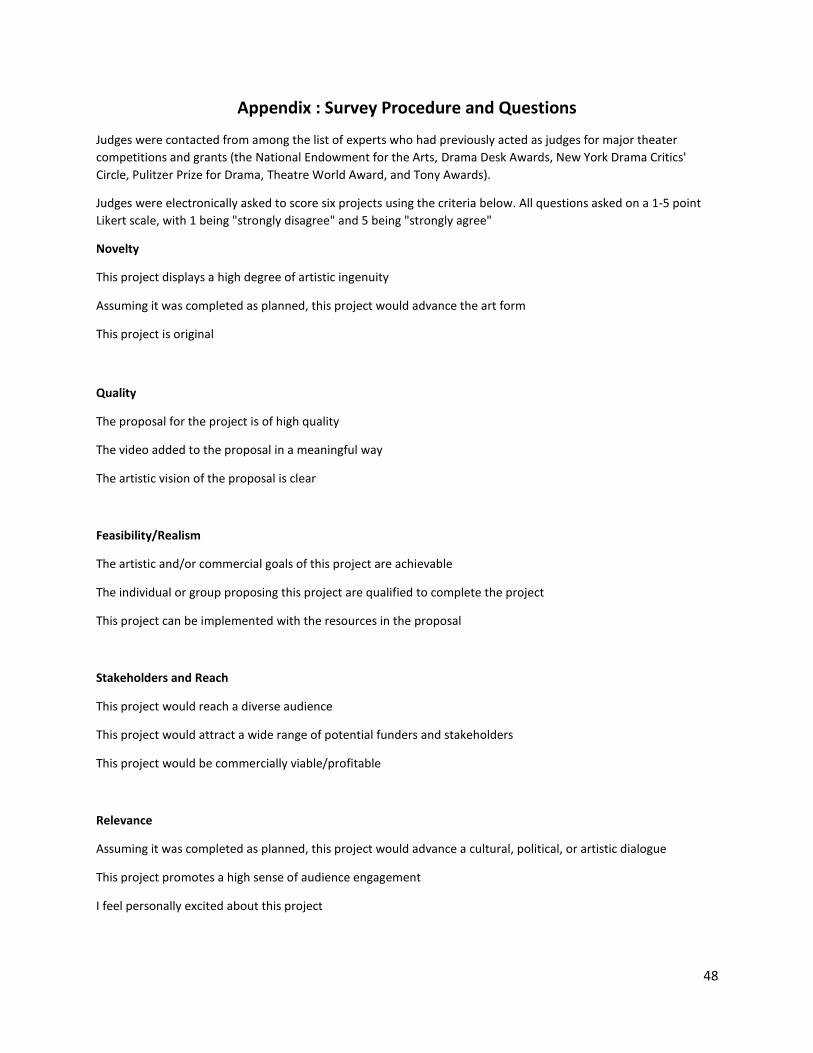
48
Appendix : Survey Procedure and Questions
Judges were contacted from among the list of experts who had previously acted as judges for major theater
competitions and grants (the National Endowment for the Arts, Drama Desk Awards, New York Drama Critics'
Circle, Pulitzer Prize for Drama, Theatre World Award, and Tony Awards).
Judges were electronically asked to score six projects using the criteria below. All questions asked on a 1-5 point
Likert scale, with 1 being "strongly disagree" and 5 being "strongly agree"
Novelty
This project displays a high degree of artistic ingenuity
Assuming it was completed as planned, this project would advance the art form
This project is original
Quality
The proposal for the project is of high quality
The video added to the proposal in a meaningful way
The artistic vision of the proposal is clear
Feasibility/Realism
The artistic and/or commercial goals of this project are achievable
The individual or group proposing this project are qualified to complete the project
This project can be implemented with the resources in the proposal
Stakeholders and Reach
This project would reach a diverse audience
This project would attract a wide range of potential funders and stakeholders
This project would be commercially viable/profitable
Relevance
Assuming it was completed as planned, this project would advance a cultural, political, or artistic dialogue
This project promotes a high sense of audience engagement
I feel personally excited about this project