wisdom of crowds business intelligence market study...
TRANSCRIPT

May 31, 2017
Dresner Advisory Services, LLC
Wisdom of Crowds® Business Intelligence Market Study
2017 Edition
Licensed to Klipfolio

2017 Wisdom of Crowds® Business Intelligence Market Study
http://www.dresneradvisory.com Copyright 2017 – Dresner Advisory Services, LLC
2
Disclaimer
This report should be used for informational purposes only. Vendor and product selections should be made
based on multiple information sources, face-to-face meetings, customer reference checking, product
demonstrations, and proof-of-concept applications.
The information contained in all Wisdom of Crowds® Market Study Reports reflects the opinions expressed in
the online responses of individuals who chose to respond to our online questionnaire and does not represent
a scientific sampling of any kind. Dresner Advisory Services, LLC shall not be liable for the content of
reports, study results, or for any damages incurred or alleged to be incurred by any of the companies
included in the reports as a result of the content.
Reproduction and distribution of this publication in any form without prior written permission is forbidden.

2017 Wisdom of Crowds® Business Intelligence Market Study
http://www.dresneradvisory.com Copyright 2017 – Dresner Advisory Services, LLC
3
Business Intelligence: A Definition Business intelligence (BI) is “knowledge gained through the access and analysis of
business information.
Business intelligence tools and technologies include query and reporting, OLAP (online
analytical processing), data mining and advanced analytics, end-user tools for ad hoc
query and analysis, and dashboards for performance monitoring.”
Howard Dresner, The Performance Management Revolution: Business Results Through
Insight and Action (John Wiley & Sons, 2007).

2017 Wisdom of Crowds® Business Intelligence Market Study
http://www.dresneradvisory.com Copyright 2017 – Dresner Advisory Services, LLC
4
Introduction This year we celebrate the tenth anniversary of Dresner Advisory Services and our first-
ever conference, Real Business Intelligence, July 11th and 12th on the campus of MIT in
Cambridge, Massachusetts!
Our thanks to all of you for your continued support and ongoing encouragement!
Since our founding in 2007, we have worked hard to set the “bar” high—challenging
ourselves to innovate and lead the market—offering ever greater value with each
successive year.
Our first market report in 2010 set the stage for where we are today. Since that time, we
have expanded our agenda and have added new research topics every year. For 2017,
we plan to release 15 major reports, including, this, our original BI flagship report—in its
eighth year of publication!
In previous years, we added new topics to our agenda and 2017 is no exception. Earlier
this year, we published our inaugural Analytical Data Infrastructure report and added
data catalog to the existing lineup during Q2.
This latest installment of our flagship Business Intelligence Market Study continues to
evolve. This year, we expanded our section on the Chief Analytics and Chief Data
Officer roles, added a budget section and added information about the ways in which
organizations measure success and failure of BI. And we began tracking additional
technologies and initiatives including natural language analytics, video analytics, and
data catalog—bringing the total to 33.
We hope you enjoy this report!
Best,
Howard Dresner Chief Research Officer Dresner Advisory Services

2017 Wisdom of Crowds® Business Intelligence Market Study
http://www.dresneradvisory.com Copyright 2017 – Dresner Advisory Services, LLC
5
Contents Business Intelligence: A Definition .................................................................................. 3
Introduction ..................................................................................................................... 4
Benefits of the Study ..................................................................................................... 10
Consumer Guide ........................................................................................................ 10
Supplier Tool .............................................................................................................. 10
External Awareness ................................................................................................ 10
Internal Planning ..................................................................................................... 10
About Howard Dresner and Dresner Advisory Services ................................................ 11
About Jim Ericson ......................................................................................................... 12
Survey Method and Data Collection .............................................................................. 13
Data Quality ............................................................................................................... 13
New for 2017 ................................................................................................................. 13
Executive Summary ...................................................................................................... 15
Study Demographics ..................................................................................................... 17
Geography ................................................................................................................. 17
Functions ................................................................................................................... 18
Vertical Industries ...................................................................................................... 19
Organization Size ....................................................................................................... 20
Analysis and Trends ...................................................................................................... 22
Departments/Functions Driving Business Intelligence ............................................... 22
Functions Driving Business Intelligence by Major Geography ................................ 25
Functions Driving Business Intelligence by Vertical Industry .................................. 26
Functions Driving Business Intelligence by Organization Size ............................... 27
User Roles Targeted for Business Intelligence .......................................................... 28
Targeted Users for Business Intelligence by Geography ........................................ 30
User Targets for Business Intelligence by Organization Size ................................. 31
User Targets for Business Intelligence by Vertical Industries ................................. 32
Objectives for Business Intelligence .......................................................................... 33
Business Intelligence Objectives by Geography ..................................................... 34

2017 Wisdom of Crowds® Business Intelligence Market Study
http://www.dresneradvisory.com Copyright 2017 – Dresner Advisory Services, LLC
6
Business Intelligence Objectives by Function ......................................................... 35
Business Intelligence Objectives by Vertical Industry ............................................. 36
Business Intelligence Objectives by Organization Size .......................................... 37
Penetration of Business Intelligence Solutions .......................................................... 38
Expansion Plans for Business Intelligence Through 2018 ...................................... 39
Current Business Intelligence Penetration by Geography ...................................... 40
Planned Business Intelligence Penetration by Geography ..................................... 41
Business Intelligence Penetration by Function ....................................................... 42
Current Business Intelligence Penetration by Vertical Industry .............................. 44
Planned Business Intelligence Penetration by Vertical Industry ............................. 45
Current Business Intelligence Penetration by Organization Size ............................ 46
Planned Business Intelligence Penetration by Organization Size ........................... 47
Chief Data and Chief Analytics Officers ..................................................................... 48
Enterprises with Chief Data or Chief Analytics Officers .......................................... 48
Perceived Impact of Chief Data or Chief Analytics Officers .................................... 49
Enterprises with Chief Data or Chief Analytics Officers by Geography ................... 50
Enterprises with Chief Data or Chief Analytics Officers by Industry ........................ 51
Enterprises with Chief Data or Chief Analytics Officers by Organization Size ........ 52
Enterprises with Chief Data and Chief Analytics Officers Reporting Structure ....... 53
Chief Data Officer and Success with BI by Reporting Structure ............................. 54
Chief Analytics Officer and Success with BI by Reporting Structure....................... 55
Number of Business Intelligence Tools in Use ........................................................... 56
Number of Business Intelligence Tools in Use 2013 to 2017 .................................. 56
Number of Business Intelligence Tools by Geography ........................................... 57
Number of Business Intelligence Tools by Function ............................................... 58
Number of Business Intelligence Tools by Vertical Industry ................................... 59
Number of Business Intelligence Tools by Organization Size ................................. 60
Technologies and Initiatives Strategic to Business Intelligence ................................. 61
Technology Priority Changes from 2013 ................................................................. 62
Technologies and Initiatives Strategic to Business Intelligence by Geography ...... 64

2017 Wisdom of Crowds® Business Intelligence Market Study
http://www.dresneradvisory.com Copyright 2017 – Dresner Advisory Services, LLC
7
Technologies and Initiatives Strategic to Business Intelligence by Function .......... 65
Technologies and Initiatives Strategic to Business Intelligence by Vertical Industry
................................................................................................................................ 66
Technologies and Initiatives Strategic to Business Intelligence by Organization Size
................................................................................................................................ 67
Business Intelligence and the State of Data .............................................................. 68
Business Intelligence and the State of Data by Geography .................................... 70
Business Intelligence and the State of Data by Function ........................................ 71
Business Intelligence and the State of Data by Vertical Industry ............................ 72
Business Intelligence and the State of Data by Organization Size ......................... 73
Business Intelligence and Action on Insight ............................................................... 74
Business Intelligence and Action on Insight by Geography .................................... 76
Business Intelligence and Action on Insight by Function ........................................ 77
Business Intelligence and Action on Insight by Vertical Industry ............................ 78
Business Intelligence and Action on Insight by Organization Size .......................... 79
Success with Business Intelligence ........................................................................... 80
Reasons Why Business Intelligence Succeeds ...................................................... 81
Reasons Why Business Intelligence Fails .............................................................. 82
How Successful Organizations Measure Success with Business Intelligence ........ 83
How Unsuccessful Organizations Measure Failure with Business Intelligence ...... 84
Success with Business Intelligence by Organization Size ...................................... 85
Success with Business Intelligence by BI Objectives ............................................. 86
Success with Business Intelligence by Targeted Users .......................................... 87
Success with Business Intelligence and Technology Priorities ............................... 88
Success with Business Intelligence and Technology Priorities ............................... 89
Success with Business Intelligence and Number of BI Tools ................................. 90
Success with Business Intelligence and the State of Data ..................................... 91
Success with Business Intelligence and Action on Insight ...................................... 92
Success with Business Intelligence and Penetration of Users ................................ 93
Budget Plans for Business Intelligence ...................................................................... 94
Budget Plans for Business Intelligence by Geography ........................................... 95

2017 Wisdom of Crowds® Business Intelligence Market Study
http://www.dresneradvisory.com Copyright 2017 – Dresner Advisory Services, LLC
8
Budget Plans for Business Intelligence by Function ............................................... 96
Budget Plans for Business Intelligence by Vertical Industry ................................... 97
Budget Plans for Business Intelligence by Organization Size ................................. 98
Budget Plans for Business Intelligence by Success with BI .................................... 99
Industry and Vendor Analysis ...................................................................................... 101
Scoring Criteria ........................................................................................................ 101
Industry Performance ............................................................................................... 102
Sales/Acquisition Experience................................................................................ 102
Value .................................................................................................................... 103
Quality and Usefulness of Product ........................................................................ 104
Technical Support ................................................................................................. 105
Consulting ............................................................................................................. 106
Integrity ................................................................................................................. 107
Recommended ..................................................................................................... 108
Performance Improvements ................................................................................. 109
Vendor Ratings ........................................................................................................... 111
Business Intelligence Market Models .......................................................................... 112
Customer Experience Model .................................................................................... 112
Vendor Credibility Model .......................................................................................... 114
Detailed Vendor Ratings ............................................................................................. 116
Dimensional Insight Detailed Score ...................................................................... 117
Domo Detailed Score ............................................................................................ 118
GoodData Detailed Score ..................................................................................... 119
Google Detailed Score .......................................................................................... 120
IBM Detailed Score ............................................................................................... 121
Infor Detailed Score .............................................................................................. 122
Information Builders Detailed Score ..................................................................... 123
Jedox Detailed Score ............................................................................................ 124
Klipfolio Detailed Score ......................................................................................... 125
Logi Analytics Detailed Score ............................................................................... 126

2017 Wisdom of Crowds® Business Intelligence Market Study
http://www.dresneradvisory.com Copyright 2017 – Dresner Advisory Services, LLC
9
Looker Detailed Score .......................................................................................... 127
Microsoft Detailed Score ....................................................................................... 128
MicroStrategy Detailed Score ............................................................................... 129
OpenText Detailed Score ..................................................................................... 130
Oracle Detailed Score ........................................................................................... 131
Pyramid Analytics Detailed Score ......................................................................... 132
Qlik Detailed Score ............................................................................................... 133
Quest Statistica Detailed Score ............................................................................ 134
RapidMiner Detailed Score ................................................................................... 135
Salesforce Detailed Score .................................................................................... 136
SAP Detailed Score .............................................................................................. 137
SiSense Detailed Score ........................................................................................ 138
Tableau Software Detailed Score ......................................................................... 139
TIBCO Software Detailed Score ........................................................................... 140
Yellowfin Detailed Score ....................................................................................... 141
Zoomdata Detailed Score ..................................................................................... 142
Other Dresner Advisory Services Research Reports .................................................. 143
Dresner Advisory Services - 2017 Wisdom of Crowds Survey Instrument .................. 144

2017 Wisdom of Crowds® Business Intelligence Market Study
http://www.dresneradvisory.com Copyright 2017 – Dresner Advisory Services, LLC
10
Benefits of the Study The Wisdom of Crowds® Business Intelligence Market Study provides a wealth of
information and analysis—offering value to both consumers and producers of business
intelligence technology and services.
Consumer Guide
As an objective source of industry research, consumers use the Wisdom of Crowds®
Business Intelligence Market Study to understand how their peers leverage and invest
in business intelligence and related technologies.
Using our trademark 33-criteria vendor performance measurement system, users glean
key insights into BI software supplier performance, enabling:
• Comparisons of current vendor performance to industry norms
• Identification and selection of new vendors
Supplier Tool
Vendor Licensees use the Wisdom of Crowds® Business Intelligence Market Study in
several important ways such as:
External Awareness
- Build awareness for the business intelligence market and supplier brand, citing
Wisdom of Crowds® Business Intelligence Market Study trends and vendor
performance
- Create lead and demand generation for supplier offerings through association with
Wisdom of Crowds® Business Intelligence Market Study brand, findings, webinars,
etc.
Internal Planning
- Refine internal product plans and align with market priorities and realities as
identified in Wisdom of Crowds® Business Intelligence Market Study
- Better understand customer priorities, concerns, and issues
- Identify competitive pressures and opportunities

2017 Wisdom of Crowds® Business Intelligence Market Study
http://www.dresneradvisory.com Copyright 2017 – Dresner Advisory Services, LLC
11
About Howard Dresner and Dresner Advisory Services The Wisdom of Crowds® Business Intelligence Market Study was conceived, designed,
and executed by Dresner Advisory Services, LLC—an independent advisory firm—and
Howard Dresner, its President, Founder and Chief Research Officer.
Howard Dresner is one of the foremost thought leaders in business intelligence and
performance management, having coined the term “Business Intelligence” in 1989. He
has published two books on the subject, The Performance
Management Revolution – Business Results through Insight
and Action (John Wiley & Sons, Nov. 2007) and Profiles in
Performance – Business Intelligence Journeys and the
Roadmap for Change (John Wiley & Sons, Nov. 2009). He
lectures at forums around the world and is often cited by the
business and trade press.
Prior to Dresner Advisory Services, Howard served as chief
strategy officer at Hyperion Solutions and was a research fellow at Gartner, where he
led its business intelligence research practice for 13 years.
Howard has conducted and directed numerous in-depth primary research studies over
the past two decades and is an expert in analyzing these markets.
Through the Wisdom of Crowds® Business Intelligence Market Study reports, we
engage with a global community to redefine how research is created and shared. Other
research reports include:
- Advanced and Predictive Analytics
- Big Data Analytics
- Business Intelligence Competency Center
- Cloud Computing and Business Intelligence
- Collective Insights®
- Embedded Business Intelligence
- End User Data Preparation
- IoT IntelligenceTM
- Location Intelligence
Howard (www.twitter.com/howarddresner) conducts a weekly Twitter “tweetchat” on
Fridays at 1:00 p.m. ET. The hashtag is #BIWisdom. During these live events, the
#BIWisdom community discusses a wide range of business intelligence topics.
You can find more information about Dresner Advisory Services at
www.dresneradvisory.com.

2017 Wisdom of Crowds® Business Intelligence Market Study
http://www.dresneradvisory.com Copyright 2017 – Dresner Advisory Services, LLC
12
About Jim Ericson Jim Ericson is a research director with Dresner Advisory Services.
Jim has served as a consultant and journalist who studies end-user management
practices and industry trending in the data and information management fields.
From 2004 to 2013, he was the editorial director at Information Management magazine
(formerly DM Review), where he created architectures for user and
industry coverage for hundreds of contributors across the breadth of
the data and information management industry.
As lead writer he interviewed and profiled more than 100 CIOs,
CTOs, and program directors in a 2010-2012 program called “25
Top Information Managers.” His related feature articles earned
ASBPE national bronze and multiple Mid-Atlantic region gold and
silver awards for Technical Article and for Case History feature
writing.
A panelist, interviewer, blogger, community liaison, conference co-chair, and speaker in
the data-management community, he also sponsored and co-hosted a weekly podcast
in continuous production for more than five years.
Jim’s earlier background as senior morning news producer at NBC/Mutual Radio
Networks and as managing editor of MSNBC’s first Washington, D.C. online news
bureau cemented his understanding of fact-finding, topical reporting, and serving broad
audiences.

2017 Wisdom of Crowds® Business Intelligence Market Study
http://www.dresneradvisory.com Copyright 2017 – Dresner Advisory Services, LLC
13
Survey Method and Data Collection As in our original Wisdom of Crowds® Business Intelligence Market Study, we
constructed a survey instrument to collect data and used social media and crowd-
sourcing techniques to recruit participants.
We also include our own research community of over 4,500 organizations (versus 3,500
in 2016) as well as vendors’ customer communities.
Data Quality
We carefully scrutinized and verified all respondent entries to ensure that the study
includes only qualified participants.
New for 2017 For 2017, we again expanded our research objectives substantially. As with 2016, this
is particularly evident in the area of user trending. This year’s study adds:
• Three additional technologies and initiatives strategic to business intelligence
(data catalog, video analytics, and natural language analytics) to extend our
study to a total of 33 areas
• Additional questions surrounding the impact of chief data officers (CDOs) and
chief analytics officers (CAOs)
• Budget questions addressing allocation of funds and whether budgets are
increasing, decreasing, or static year over year.
• Questions surrounding how organizations measure success or failure with
business intelligence.

2017 Wisdom of Crowds® Business Intelligence Market Study
http://www.dresneradvisory.com Copyright 2017 – Dresner Advisory Services, LLC
14
Executive
Summary

2017 Wisdom of Crowds® Business Intelligence Market Study
http://www.dresneradvisory.com Copyright 2017 – Dresner Advisory Services, LLC
15
Executive Summary User Analysis:
- Operations supplanted executive management as the leading driver of BI in
organizations. HR increasingly drives BI (pp. 23-28).
- Over time, BI targeting of executives and middle managers declined, while other
roles (contributors, customers, suppliers) remained flat (pp. 29-33).
- "Better decision making" remains the top objective for business intelligence, well
ahead of revenue and competitive objectives (pp. 34-38).
- Respondents expect greater BI expansion and penetration in coming time frames
at a faster rate than during the previous year (pp. 39-48).
- The uptake and maturity of chief data and chief analytics officers remains modest
at less than 16 percent. Most organizations experience a high or low impact due
to CAO/CDO appointment. Most CAOs/CDOs report to the CEO, but this does
not ensure success (pp. 49-56).
- The use of four or more BI tools increased slightly over time, reversing a
consolidation trend; it is possibly due to lighter BI architectures (pp. 57-61).
- Fundamental technologies—reporting, dashboards, etc.) continue to top
technologies and initiatives strategic to BI. Big data is gaining momentum, while
data discovery declined (pp. 62-68).
- Respondents are highly confident in their "state of data," though results are
mostly flat over time (pp. 69-74).
- Organizations are highly confident of their ability to take "action on insight,"
though results are mostly flat or slightly improved over time (pp. 75-80).
- In 2017, our core measure of "success with business intelligence" declined
slightly. Successful organizations focus upon user satisfaction; unsuccessful
organizations focus more upon system usage and adoption (pp. 81-90).
- Organizations with a CDO or CAO report much greater BI success.
Organizations that employ fewer tools tend to be more successful. BI success
correlates strongly with positive "state of data" and "action on insight" (pp. 91-94).
- Half of respondent organizations plan to increase BI investment while just 5
percent will decrease BI budgets from 2016 levels. The BICC function indicates
the greatest BI budget growth (pp. 95-100).

2017 Wisdom of Crowds® Business Intelligence Market Study
http://www.dresneradvisory.com Copyright 2017 – Dresner Advisory Services, LLC
16
Industry Analysis:
Based on user scores, industry performance in 2017 improved across nearly every
parameter we measured (pp. 103-110).
- Quality and usefulness improved across all measures, notably "reliability of
technology," "scalability," and integration of components within product" (p. 105).
- The vendor industry reached all-time high performance scores in all areas of
technical performance, notably in "professionalism" and "continuity of personnel"
(p. 105).
- BI vendor consulting carried a six-year positive trend into 2017, with rebounds in
"value" and "continuity" (p. 107).
- Vendor integrity grew slowly but surely over the last four years with the best year-
over-year gains occurring in 2017 (p. 108).
- Industry performance, by the measure of customers willing to recommend,
continued a four-year positive trend (p. 109).
- Perpetual on-premises licensing is offered by 66 percent of vendors in 2017, a
gain over the previous year (p. 111).
- Fewer than 20 percent of vendors offer concurrent on-premises licensing in
2017. Public cloud concurrent licensing is even less common in 2017 (p. 112).
- The numbers of vendors offering a subscription licensing model continues to
grow (p. 113).
- Among vendors that still offer perpetual licenses, maintenance is most often
based upon list price versus discounted price (p. 114).

2017 Wisdom of Crowds® Business Intelligence Market Study
http://www.dresneradvisory.com Copyright 2017 – Dresner Advisory Services, LLC
17
Study Demographics Our 2017 survey base provides a cross-section of data across geographies, functions,
organization sizes, and vertical industries. We believe that, unlike other industry
research, this supports a more representative sample and better indicator of true market
dynamics. We have constructed cross-tab analyses using these demographics to
identify and illustrate important industry trends.
Geography
Fifty-six percent of respondents work at North America-based organizations (including
the United States, Canada, and Puerto Rico). EMEA accounts for about 32 percent of
respondents; the remainder are distributed across Asia Pacific and Latin America (fig.
1).
Figure 1 – Geographies represented
55.74%
31.94%
8.21%
4.11%
0.0%
10.0%
20.0%
30.0%
40.0%
50.0%
60.0%
North America Europe, Middle East andAfrica
Asia Pacific Latin America
Geographies Represented

2017 Wisdom of Crowds® Business Intelligence Market Study
http://www.dresneradvisory.com Copyright 2017 – Dresner Advisory Services, LLC
18
Functions
In 2017, our sample base includes a mix of functions (fig. 2). IT accounts for the largest
group (26 percent), followed by Executive Management (20 percent) and Finance (14
percent). The BICC, Operations, and Marketing are the next most represented
functions.
Tabulating results across functions helps us develop analyses that reflect the
differences and influence of different departments within organizations.
Figure 2 – Functions represented
26%
20%
14%
7%
5% 5%4% 4%
3% 3%
10%
0%
5%
10%
15%
20%
25%
30%
Functions Represented

2017 Wisdom of Crowds® Business Intelligence Market Study
http://www.dresneradvisory.com Copyright 2017 – Dresner Advisory Services, LLC
19
Vertical Industries
In 2017, vertical industry distribution is similar to prior studies, led by Technology, Consulting, Financial Services and Healthcare (fig. 3). Higher Education, Manufacturing, and Retail/Wholesale are the next most represented industries. Tabulating results across industries helps us develop analyses that reflect the maturity and direction of different business sectors.
Figure 3 – Vertical industries represented
15%
8% 8% 8%7% 7%
5%
3% 3%2% 2% 2% 2% 2% 2% 2% 2% 2% 2%
18%
0%
2%
4%
6%
8%
10%
12%
14%
16%
18%
20%
Vertical Industries Represented

2017 Wisdom of Crowds® Business Intelligence Market Study
http://www.dresneradvisory.com Copyright 2017 – Dresner Advisory Services, LLC
20
Organization Size
Participation by organizations of different sizes (global employee head count) is well
balanced in 2017. Small organizations (1-100 employees) represent 28 percent of
respondents, mid-size organizations (101-1,000 employees) represent 30 percent, and
large organizations (>1,000 employees) account for the remaining 42 percent (fig. 4).
Tabulating results by organization size reveals important differences in practices, planning, and maturity.
Figure 4 – Organization sizes represented
28%
30%
9%
11%
6%
16%
0%
5%
10%
15%
20%
25%
30%
35%
1-100 101-1,000 1,001-2,000 2,001-5,000 5,001-10,000 More than 10,000
Organization Sizes Represented

2017 Wisdom of Crowds® Business Intelligence Market Study
http://www.dresneradvisory.com Copyright 2017 – Dresner Advisory Services, LLC
21
Analysis and
Trends

2017 Wisdom of Crowds® Business Intelligence Market Study
http://www.dresneradvisory.com Copyright 2017 – Dresner Advisory Services, LLC
22
Analysis and Trends
Departments/Functions Driving Business Intelligence
We asked respondents which functional roles drive business intelligence “always,”
“often,” “sometimes,” “rarely,” or “never” (fig. 5). Our results show a breadth of influence,
and for a second year in a row, survey respondents say Operations is the leading BI
driver. (We note that departmental functions, e.g., Marketing, Sales, and Supply Chain,
have operational activities within.) By this measure, we might conclude that business
operations are becoming more engaged with BI, or that BI is more of a “baked in” or
day-to-day tactical activity within Operations. Executive Management, which had
formerly and traditionally been the leading driver, is the second most-cited functional
driver in 2017. Finance and IT are the next strongest drivers. Sales (like the top three
drivers) “always” or “often” drives BI in more than half of organizations responding.
Figure 5 – Functions driving business intelligence
0% 10% 20% 30% 40% 50% 60% 70% 80% 90% 100%
Manufacturing
Human Resources
Supply chain
Competency Center/Center of Excellence
Research and Development (R&D)
Marketing
Strategic Planning Function
Sales
Information Technology (IT)
Finance
Executive Management
Operations
Functions Driving Business Intelligence
Always Often Sometimes Rarely Never

2017 Wisdom of Crowds® Business Intelligence Market Study
http://www.dresneradvisory.com Copyright 2017 – Dresner Advisory Services, LLC
23
As noted in fig. 5, Operations supplanted Executive Management as the leading driver
of business intelligence, though the two functions hold nearly identical influence in 2017
(fig. 6). Saturation of BI among executives might account for this shift, and it appears
that mean importance reflects more downstream "democratization" of business
intelligence solutions. We note that Finance is the third most influential, ahead of Sales
and other front-office functions. Overall, functional influence in 2017 is somewhat on the
decline, though in 2017 we see minor upticks in Strategic Planning and Supply Chain.
Figure 6 – Functions driving business intelligence 2013-2016
0
0.5
1
1.5
2
2.5
3
3.5
4
4.5
Functions Driving Business Intelligence 2013-2017
2013 2014 2015 2016 2017

2017 Wisdom of Crowds® Business Intelligence Market Study
http://www.dresneradvisory.com Copyright 2017 – Dresner Advisory Services, LLC
24
Fig. 7 depicts another instructive view of year-over-year office and departmental
influence. Most notable is a nearly 7 percent increase in influence from human
resources, which could portend future HR BI enablement (as was once predicted for
Marketing and Sales). Rising Manufacturing and Supply Chain influence underpin the
operational nature of current BI influence. Somewhat surprising are year-over-year
decreases in Sales and Executive Management influence, although this may simply
represent mature enablement.
Figure 7 – Change in functions driving BI 2016-2017
-6.8%
-5.4%
-4.4%
-4.2%
-4.0%
-3.0%
-0.5%
0.6%
1.0%
3.7%
3.8%
6.8%
-8.0% -6.0% -4.0% -2.0% 0.0% 2.0% 4.0% 6.0% 8.0%
Sales
Executive Management
Marketing
Operations
Information Technology (IT)
Finance
Strategic Planning Function
Research and Development (R&D)
Business Intelligence Competency Center
Supply Chain
Manufacturing
Human Resources
Change in Functions Driving BI 2016-2017

2017 Wisdom of Crowds® Business Intelligence Market Study
http://www.dresneradvisory.com Copyright 2017 – Dresner Advisory Services, LLC
25
Functions Driving Business Intelligence by Major Geography
Operations is generally the strongest functional driver of business intelligence by
geography, though Executive Management influence remains slightly higher in North
America (fig. 8). Elsewhere, we see the highest overall Sales and Strategic Planning
influence in Latin America. EMEA respondents are narrowly most influenced by
respondents in Finance. Though we already noted year-over-year gains, Manufacturing,
Supply Chain, and HR are still the least influential departments in all regions.
Figure 8 – Functions driving business intelligence by geography
0
0.5
1
1.5
2
2.5
3
3.5
4
4.5
North America Asia Pacific Europe, Middle East andAfrica
Latin America
Functions Driving Business Intelligence by Geography
Operations Executive Management
Finance Sales
Information Technology (IT) Strategic Planning Function
Marketing Research and Development (R&D)
Competency Center/Center of Excellence Human Resources
Supply chain Manufacturing

2017 Wisdom of Crowds® Business Intelligence Market Study
http://www.dresneradvisory.com Copyright 2017 – Dresner Advisory Services, LLC
26
Functions Driving Business Intelligence by Vertical Industry
The importance of various functional drivers of BI is somewhat predictable across
industries (fig. 9). In 2017, Retail/Wholesale shows the highest marks for not only
operations, but also Sales, Executive Management, and Marketing. The influence of
Executive Management is most distributed: highest in Retail/wholesale as mentioned
and lowest in healthcare. IT is the most likely driver in Energy organizations. While
Finance is a below-average influencer in several industries, the influence of Finance is
greatest in Higher Education. The Competency Center / Center of Excellence is far and
away the strongest driver in Manufacturing.
Figure 9 – Functions driving business intelligence by industry
0
0.5
1
1.5
2
2.5
3
3.5
4Operations
Information Technology (IT)
Sales
Executive Management
Finance
Marketing
Strategic Planning Function
Research and Development(R&D)
Human Resources
Supply chain
Manufacturing
Competency Center/Center ofExcellence
Functions Driving Business Intelligence by Industry
Technology Financial Services Healthcare Manufacturing
Education (Higher Ed) Retail and Wholesale Energy

2017 Wisdom of Crowds® Business Intelligence Market Study
http://www.dresneradvisory.com Copyright 2017 – Dresner Advisory Services, LLC
27
Functions Driving Business Intelligence by Organization Size
Operations and executive management are the most likely drivers of business
intelligence in small (1-100 employees) and very large (> 10,000 employees)
organizations (fig. 10). In mid-sized organizations (101-1,000 employees) and large
organizations with up to 10,000 employees, Finance is most influential by a narrow
margin. Sales and Marketing are most influential in small organizations, and Sales
influence carries over to mid-sized organizations. As in other measures, Manufacturing,
Supply Chain and HR are the least influential, though we noted (fig. 7, p. 25) these
areas have growing year-over-year influence.
Figure 10 – Functions driving business intelligence by organization size
0
0.5
1
1.5
2
2.5
3
3.5
4
4.5
1-100 101-1,000 1,001-10,000 More than 10,000
Functions Driving Business Intelligence by Organization Size
Operations Executive Management
Finance Sales
Information Technology (IT) Strategic Planning Function
Marketing Research and Development (R&D)
Competency Center/Center of Excellence Human Resources
Supply chain Manufacturing

2017 Wisdom of Crowds® Business Intelligence Market Study
http://www.dresneradvisory.com Copyright 2017 – Dresner Advisory Services, LLC
28
User Roles Targeted for Business Intelligence
In 2017 (as in 2016), executives and middle managers are about 93 percent likely to be
targeted as primary or secondary users of business intelligence (fig. 11). Middle
managers are less often seen as primary users but are as likely as executives to be
targeted overall. Individuals and contributors/professionals and line managers are
targeted as primary or secondary users at more than three-quarters of respondent
organizations. Fewer than half of respondent organizations (25 percent primary, 23
percent secondary) currently target customers and suppliers.
Figure 11 – Targeted users for business intelligence
0% 10% 20% 30% 40% 50% 60% 70% 80% 90% 100%
Suppliers
Customers
Line Managers
Individual Contributors and Professionals
Middle Managers
Executives
Targeted Users for Business Intelligence
Primary Secondary Not targeted

2017 Wisdom of Crowds® Business Intelligence Market Study
http://www.dresneradvisory.com Copyright 2017 – Dresner Advisory Services, LLC
29
Across five years of data, executive and middle manager BI targeting declined while
other roles are mostly flat or improved somewhat (fig. 12). Perhaps in line with trends of
specialization and outsourcing, individual contributors and professionals have been the
greatest beneficiaries over time and today are roughly on par with line managers.
Customer and supplier BI enablement are still back-burner issues for organizations.
Figure 12 – Targeted users for business intelligence 2014-2016
0%
10%
20%
30%
40%
50%
60%
70%
80%
Executives MiddleManagers
Line Managers IndividualContributors and
Professionals
Customers Suppliers
Targeted Users for Business Intelligence 2013-2017
2013 2014 2015 2016 2017

2017 Wisdom of Crowds® Business Intelligence Market Study
http://www.dresneradvisory.com Copyright 2017 – Dresner Advisory Services, LLC
30
Targeted Users for Business Intelligence by Geography
Executives are the most likely targets for business intelligence across all geographies
except EMEA, where middle managers surpassed them (fig. 13). The aforementioned
importance of targeting individual contributors and professionals is most important in
North America (71 percent), followed by Asia Pacific (66 percent) and EMEA (65
percent). Customer and supplier targeting is comparatively low across all geographies,
though customer targeting is highest in Asia Pacific (51 percent).
Figure 13 – Targeted users for business intelligence by geography
0%
10%
20%
30%
40%
50%
60%
70%
80%
90%
100%
North America Asia Pacific Latin America Europe, Middle East andAfrica
Targeted Users for Business Intelligence by Geography
Executives Middle Managers
Customers Line Managers
Individual Contributors and Professionals Suppliers

2017 Wisdom of Crowds® Business Intelligence Market Study
http://www.dresneradvisory.com Copyright 2017 – Dresner Advisory Services, LLC
31
User Targets for Business Intelligence by Organization Size
Small organizations (1-100 employees), which tend to be flatter organizationally, favor
executives as targets compared to other roles (fig. 14). Targeting customers is greatest
at small organizations and tends to decrease as headcount increases. Targeting trends
are more consistent at mid-sized and large organizations; all are 90 percent or more
likely to target executives and middle managers. Very large organizations (> 10,000
employees) are most likely to target individual contributors and professionals. Targeting
line managers and individuals increases with organization size.
Figure 14 – Targeted business intelligence users by organization size
0%
10%
20%
30%
40%
50%
60%
70%
80%
90%
100%
1-100 101-1,000 1,001-10,000 More than 10,000
Targeted Users for Business Intelligence by Organization Size
Executives Middle Managers
Customers Line Managers
Individual Contributors and Professionals Suppliers

2017 Wisdom of Crowds® Business Intelligence Market Study
http://www.dresneradvisory.com Copyright 2017 – Dresner Advisory Services, LLC
32
User Targets for Business Intelligence by Vertical Industries
Our 2017 sample shows some differences in user targeting by industry (fig. 15).
Executive targeting is high across all industries, led by Financial Services,
Retail/Wholesale, and Energy (all at 93 percent). Likewise, targeting middle managers
is high across industries, led by Manufacturing (98 percent). Targeting individual
contributors and professionals is highest in healthcare (77 percent) and targeting
customers is highest in Technology (58 percent). As we might expect, supplier targeting
is highest in Manufacturing and Retail/Wholesale.
Figure 15 – Targeted business intelligence users by industry
0%
20%
40%
60%
80%
100%
120%
Technology FinancialServices
Healthcare Manufacturing Education(Higher Ed)
Retail andWholesale
Energy
Targeted Users for Business Intelligence by Industry
Executives Middle Managers
Customers Line Managers
Individual Contributors and Professionals Suppliers

2017 Wisdom of Crowds® Business Intelligence Market Study
http://www.dresneradvisory.com Copyright 2017 – Dresner Advisory Services, LLC
33
Objectives for Business Intelligence
In 2017, the anecdotal and arguably philosophical goal of “making better decisions”
remains atop our list of business intelligence objectives (fig. 16). We traditionally
associated this goal with organizations seeking general improvements wherever
available through the use of business intelligence. In perhaps another reflection of
recent operational emphasis, improved operational efficiency was the second choice
(70 percent "critical" or "very important"), followed by revenue growth, increased
competitive advantage, and enhanced customer service. The priority of these rankings
is virtually unchanged over time. Just 7 percent or fewer respondents consider any of
the offered BI objectives "unimportant."
Figure 16 – Business intelligence objectives
0% 10% 20% 30% 40% 50% 60% 70% 80% 90% 100%
Enhanced customer service
Increased competitive advantage
Growth in revenues
Improved operational efficiencies
Better decision making
Business Intelligence Objectives
Critical Very important Important Somewhat important Unimportant

2017 Wisdom of Crowds® Business Intelligence Market Study
http://www.dresneradvisory.com Copyright 2017 – Dresner Advisory Services, LLC
34
Business Intelligence Objectives by Geography
“Better decision making” is the most important BI objective across all geographical
regions in 2017, and to a slightly greater extent in North America and Latin America (fig.
17). Asia-Pacific and North American respondents also have the highest goals for
improved operational efficiency (the second most important objective in all regions
except Latin America) and increased competitive advantage. Asia-Pacific respondents
put the most emphasis on enhanced customer service as a BI objective.
Figure 17 – Business intelligence objectives by geography
1
1.5
2
2.5
3
3.5
4
4.5
5
North America Asia Pacific Latin America Europe, Middle East andAfrica
Business Intelligence Objectives by Geography
Better decision making Improved operational efficiencies Enhanced customer service
Increased competitive advantage Growth in revenues

2017 Wisdom of Crowds® Business Intelligence Market Study
http://www.dresneradvisory.com Copyright 2017 – Dresner Advisory Services, LLC
35
Business Intelligence Objectives by Function
In 2017, interest in business intelligence objectives varies somewhat by function, though
"better decision making" is the top choice for all roles (fig. 18). Operations has the
highest overall marks for operational efficiency and increased competitive advantage.
Not surprising, Executive Management puts above-average emphasis on revenue
growth and increased competitive advantage. The objective of revenue growth is
highest overall in Sales and Marketing; sales also gives "better decision making" its
highest scores.
Figure 18 - Business intelligence objectives by function
1
1.5
2
2.5
3
3.5
4
4.5
5
Better decision making Improved operationalefficiencies
Enhanced customerservice
Increased competitiveadvantage
Growth in revenues
Business Intelligence Objectives by Function
Business Intelligence Competency Center Executive ManagementFinance Information Technology (IT)Marketing OperationsResearch and Development (R&D) SalesStrategic Planning Function
Better decision making
2017 Wisdom of Crowds® Business Intelligence Market Study
http://www.dresneradvisory.com Copyright 2017 – Dresner Advisory Services, LLC
36
Business Intelligence Objectives by Vertical Industry
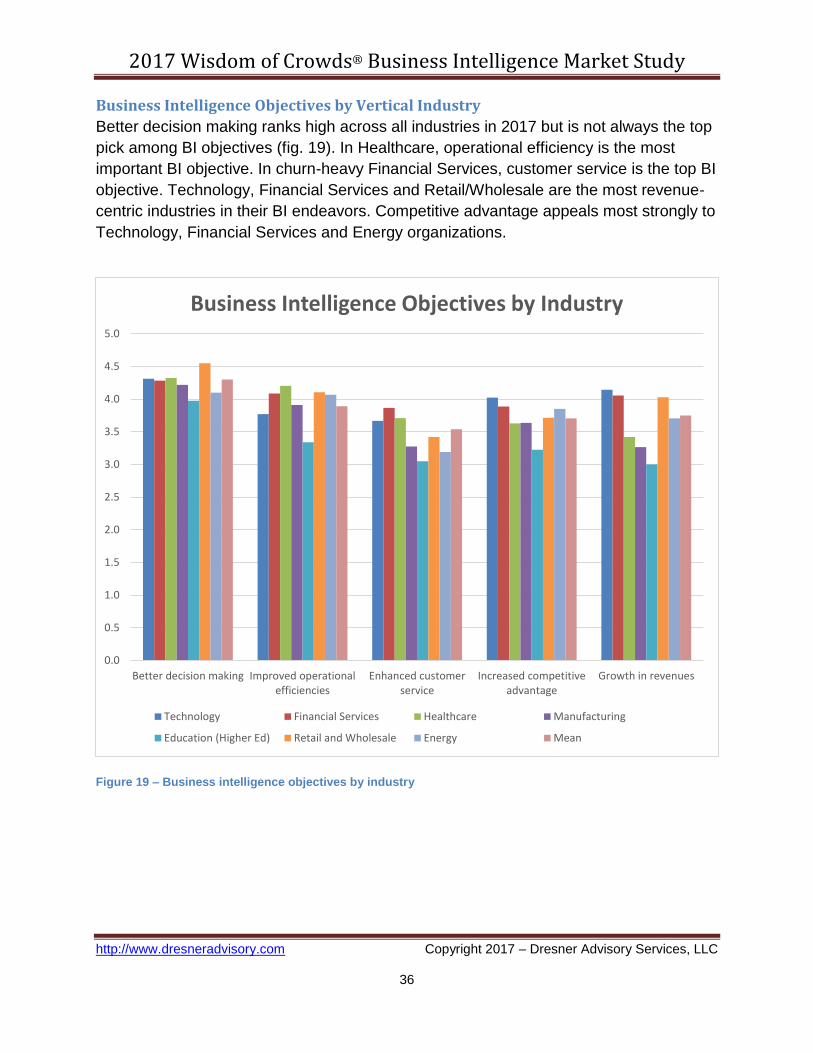
Better decision making ranks high across all industries in 2017 but is not always the top
pick among BI objectives (fig. 19). In Healthcare, operational efficiency is the most
important BI objective. In churn-heavy Financial Services, customer service is the top BI
objective. Technology, Financial Services and Retail/Wholesale are the most revenue-
centric industries in their BI endeavors. Competitive advantage appeals most strongly to
Technology, Financial Services and Energy organizations.
Figure 19 – Business intelligence objectives by industry
0.0
0.5
1.0
1.5
2.0
2.5
3.0
3.5
4.0
4.5
5.0
Better decision making Improved operationalefficiencies
Enhanced customerservice
Increased competitiveadvantage
Growth in revenues
Business Intelligence Objectives by Industry
Technology Financial Services Healthcare Manufacturing
Education (Higher Ed) Retail and Wholesale Energy Mean

2017 Wisdom of Crowds® Business Intelligence Market Study
http://www.dresneradvisory.com Copyright 2017 – Dresner Advisory Services, LLC
37
Business Intelligence Objectives by Organization Size
Organizations of different sizes place the highest emphasis on better decision making
with similar high mean importance above "very important" (fig. 20). Improved
operational efficiency is the next most important objective to all organizations and
increases noticeably as organization headcount increases. Small organizations (1-100
employees) have the highest mean interest in all objectives. Small and very large
organizations share the highest interest in enhanced customer services.
Figure 20 – Business intelligence objectives by organization size
1
1.5
2
2.5
3
3.5
4
4.5
5
1-100 101-1,000 1,001-10,000 More than 10,000
Business Intelligence Objectives by Organization Size
Better decision making Improved operational efficiencies Enhanced customer service
Increased competitive advantage Growth in revenues

2017 Wisdom of Crowds® Business Intelligence Market Study
http://www.dresneradvisory.com Copyright 2017 – Dresner Advisory Services, LLC
38
Penetration of Business Intelligence Solutions
In an ongoing positive development, penetration of business intelligence (as a
percentage of total employees) grew noticeably between 2015 and 2017 (fig. 21).
Percentages of lower penetration (< 10 percent, 11-20 percent, 21-40, 41-60) all
declined while the highest levels (61-80 percent, > 81 percent) improved
correspondingly. The linear trending of this finding gives us some confidence that the BI
enablement and democratization we saw last year continues to show improvement.
Figure 21 – Business intelligence penetration 2015-2017
0%
5%
10%
15%
20%
25%
30%
35%
40%
Under 10% 11 - 20% 21 - 40% 41 - 60% 61 - 80% 81% or more
Penetration of Business Intelligence Solutions 2015-2017
2015 2017

2017 Wisdom of Crowds® Business Intelligence Market Study
http://www.dresneradvisory.com Copyright 2017 – Dresner Advisory Services, LLC
39
Expansion Plans for Business Intelligence Through 2018
Respondents describe bullish plans for expanding BI in future time frames, and we
consider the 12-month period the most likely to be supportable and budgeted (fig. 22).
In this context, 39 percent of respondents (compared to 31 percent current) expect
greater than 41 percent penetration within the coming year, and 28 percent (versus 21
percent current) expect 61 percent or greater penetration. Longer time frames predict
still more ambitious rates of growth in BI penetration: 36 months from now, 26 percent
of organizations expect 81 percent or greater BI penetration, versus 15 percent today.
Figure 22 – Expansion plans for business intelligence through 2020
0% 10% 20% 30% 40% 50% 60% 70% 80% 90% 100%
In 36 months
In 24 months
In 12 months
Today
Expansion Plans for Business Intelligence through 2020
Under 10% 11 - 20% 21 - 40% 41 - 60% 61 - 80% 81% or more

2017 Wisdom of Crowds® Business Intelligence Market Study
http://www.dresneradvisory.com Copyright 2017 – Dresner Advisory Services, LLC
40
Current Business Intelligence Penetration by Geography
Globally, the highest levels of current BI penetration are in North America and EMEA,
where solutions have historically been more available and widespread (fig. 23). In total,
North America ranks significantly ahead of all other geographic regions, particularly at
BI penetration rates greater than 61 percent. Asia Pacific reports 81 percent BI
penetration levels that only slightly trail respondents in North America.
Figure 23 – Business intelligence user penetration today by geography
0%
10%
20%
30%
40%
50%
60%
70%
80%
90%
100%
North America Europe, Middle Eastand Africa
Asia Pacific Latin America
Penetration of Business Intelligence Solutions Today by Geography
81% or more
61 - 80%
41 - 60%
21 - 40%
11 - 20%
Under 10%

2017 Wisdom of Crowds® Business Intelligence Market Study
http://www.dresneradvisory.com Copyright 2017 – Dresner Advisory Services, LLC
41
Planned Business Intelligence Penetration by Geography
A view of future BI plans by geography reveals distinctions, but supports the overall
theme of growing expectations in 12, 24 and 36-month time frames (fig. 24). North
America clearly leads expansion in the highest rate of penetration, followed by EMEA
and Asia Pacific. In contrast, the highest level of BI penetration will be essentially flat in
Latin America in future time frames (though low-level penetration will improve).
Figure 24 – Planned business intelligence user penetration through 2020 by geography
0%
10%
20%
30%
40%
50%
60%
70%
80%
90%
100%
In 1
2 m
on
ths
In 2
4 m
on
ths
In 3
6 m
on
ths
In 1
2 m
on
ths
In 2
4 m
on
ths
In 3
6 m
on
ths
In 1
2 m
on
ths
In 2
4 m
on
ths
In 3
6 m
on
ths
In 1
2 m
on
ths
In 2
4 m
on
ths
In 3
6 m
on
ths
North America Europe, Middle Eastand Africa
Asia Pacific Latin America
Expansion Plans for Business Intelligence through 2020 by Geography
81% or more
61 - 80%
41 - 60%
21 - 40%
11 - 20%
Under 10%

2017 Wisdom of Crowds® Business Intelligence Market Study
http://www.dresneradvisory.com Copyright 2017 – Dresner Advisory Services, LLC
42
Business Intelligence Penetration by Function
Perceived penetration of BI solutions by function may be telling a tale of "specialist"
information worker usage as well as average rates of adoption (fig. 25). Clearly,
Marketing/Sales and Executive Management show the highest rates of perceived
penetration (41 percent and greater). Meanwhile, the BICC reports the lowest rates of
under-penetration (< 20 percent) but less penetration at the highest levels.
Figure 25 – Business intelligence penetration today by function
0%
10%
20%
30%
40%
50%
60%
70%
80%
90%
100%
InformationTechnology (IT)
ExecutiveManagement
Finance Marketing &Sales
BusinessIntelligenceCompetency
Center
Other
Penetration of Business Intelligence Solutions Today by Function
81% or more
61 - 80%
41 - 60%
21 - 40%
11 - 20%
Under 10%

2017 Wisdom of Crowds® Business Intelligence Market Study
http://www.dresneradvisory.com Copyright 2017 – Dresner Advisory Services, LLC
43
All functions expect to see increased BI penetration over time (fig. 26). At high levels of
penetration, BICC and Executive Management respondents have the most aggressive
plans for coming time frames, where half expect 61 percent or greater penetration within
36 months. Marketing/Sales is the next most aggressive function, while Finance, IT, and
"other" have modest plans to expand BI penetration.
Figure 26 – Expansion plans for business intelligence through 2020 by function
0%
10%
20%
30%
40%
50%
60%
70%
80%
90%
100%
In 1
2 m
on
ths
In 2
4 m
on
ths
In 3
6 m
on
ths
In 1
2 m
on
ths
In 2
4 m
on
ths
In 3
6 m
on
ths
In 1
2 m
on
ths
In 2
4 m
on
ths
In 3
6 m
on
ths
In 1
2 m
on
ths
In 2
4 m
on
ths
In 3
6 m
on
ths
In 1
2 m
on
ths
In 2
4 m
on
ths
In 3
6 m
on
ths
In 1
2 m
on
ths
In 2
4 m
on
ths
In 3
6 m
on
ths
InformationTechnology
(IT)
ExecutiveManagement
Finance Marketing &Sales
BusinessIntelligenceCompetency
Center
Other
Expansion Plans for Business Intelligence through 2020 by Function
81% or more
61 - 80%
41 - 60%
21 - 40%
11 - 20%
Under 10%

2017 Wisdom of Crowds® Business Intelligence Market Study
http://www.dresneradvisory.com Copyright 2017 – Dresner Advisory Services, LLC
44
Current Business Intelligence Penetration by Vertical Industry
Higher levels of BI penetration vary inconsistently across different vertical industries (fig.
27). In our 2017 sample, technology organizations report the fewest instances of low-
level penetration (< 20 percent) and the highest adjusted mean scores for BI penetration
overall. Higher Education and Manufacturing report the most low-level penetration.
Energy respondents report the highest levels of 81 percent penetration but much lower
levels of overall business intelligence uptake.
Figure 27 – Penetration of business intelligence solutions today by industry
0%
10%
20%
30%
40%
50%
60%
70%
80%
90%
100%
Penetration of Business Intelligence Solutions Today by Industry
81% or more
61 - 80%
41 - 60%
21 - 40%
11 - 20%
Under 10%

2017 Wisdom of Crowds® Business Intelligence Market Study
http://www.dresneradvisory.com Copyright 2017 – Dresner Advisory Services, LLC
45
Planned Business Intelligence Penetration by Vertical Industry
In our 2017 sample, expansion plans for business intelligence vary unevenly by industry
(fig. 28). While 12-month plans are generally modest, Retail/Wholesale, Financial
Services, and Technology organizations have the most aggressive long-term expansion
plans. Higher Education respondents expect the weakest growth in BI penetration in
coming time frames.
Figure 28 – Expansion plans for business intelligence through 2020 by industry
0%
10%
20%
30%
40%
50%
60%
70%
80%
90%
100%
In 1
2 m
on
ths
In 2
4 m
on
ths
In 3
6 m
on
ths
In 1
2 m
on
ths
In 2
4 m
on
ths
In 3
6 m
on
ths
In 1
2 m
on
ths
In 2
4 m
on
ths
In 3
6 m
on
ths
In 1
2 m
on
ths
In 2
4 m
on
ths
In 3
6 m
on
ths
In 1
2 m
on
ths
In 2
4 m
on
ths
In 3
6 m
on
ths
Technology Financial services Healthcare Education (HigherEd)
Retail andwholesale
Expansion Plans for Business Intelligence through 2020 by Industry
81% or more
61 - 80%
41 - 60%
21 - 40%
11 - 20%
Under 10%

2017 Wisdom of Crowds® Business Intelligence Market Study
http://www.dresneradvisory.com Copyright 2017 – Dresner Advisory Services, LLC
46
Current Business Intelligence Penetration by Organization Size
As we have reported in every year of our study, small organizations of one to 100
employees have higher BI penetration than larger peers (fig. 29). While overall
headcount influences this score, we also expect small organizations, likely to be newer
and comprised of more information workers, would find fewer barriers of cost or
deployment and more immediate benefits than larger and older companies. As we saw
in earlier studies, very high penetration rates tend to decrease with organization size.
Figure 29 – Penetration of business intelligence solutions today by organization size
0%
10%
20%
30%
40%
50%
60%
70%
80%
90%
100%
1-100 101-1,000 1,001-10,000 More than 10,000
Penetration of Business Intelligence Solutions Today by Organization Size
81% or more
61 - 80%
41 - 60%
21 - 40%
11 - 20%
Under 10%

2017 Wisdom of Crowds® Business Intelligence Market Study
http://www.dresneradvisory.com Copyright 2017 – Dresner Advisory Services, LLC
47
Planned Business Intelligence Penetration by Organization Size
Along with being the most penetrated BI users today, small organizations (1-100
employees) have the steepest expectations for high future BI penetration in coming time
frames (fig. 30). Though less aggressive, mid-sized organizations (101-1,000
employees) expect the next highest number of highly penetrated (> 60 percent) user
audiences. Large and very large organizations (> 10,000 employees) have somewhat
lower expectations (which may be colored by overall rank-and-file headcount not
considered audiences for business intelligence).
Figure 30 – Expansion plans for business intelligence through 2020 by organization size
0%
10%
20%
30%
40%
50%
60%
70%
80%
90%
100%
In 1
2 m
on
ths
In 2
4 m
on
ths
In 3
6 m
on
ths
In 1
2 m
on
ths
In 2
4 m
on
ths
In 3
6 m
on
ths
In 1
2 m
on
ths
In 2
4 m
on
ths
In 3
6 m
on
ths
In 1
2 m
on
ths
In 2
4 m
on
ths
In 3
6 m
on
ths
1-100 101-1,000 1,001-10,000 More than 10,000
Expansion Plans for Business Intelligence through 2020 by Organization Size
81% or more
61 - 80%
41 - 60%
21 - 40%
11 - 20%
Under 10%

2017 Wisdom of Crowds® Business Intelligence Market Study
http://www.dresneradvisory.com Copyright 2017 – Dresner Advisory Services, LLC
48
Chief Data and Chief Analytics Officers
Beginning in 2016, we asked our audience whether their organization had appointed a
chief data officer (CDO) or chief analytics officer (CAO). We understand that these
appointments can cause significant changes in the technology and business
architecture of organizations and also that these roles and titles are relatively new, fluid
by definition, and evolving.
Enterprises with Chief Data or Chief Analytics Officers
The ongoing uptake and maturity of chief data and chief analytics officers is modest to
date, with fewer than 16 percent of respondent organizations having adopted the title(s)
(figs. 31). Over our two years of study, momentum is somewhat in favor of chief data
officers versus chief analytics officers. In 2017, CDO longevity increases, while CAO
momentum is decidedly flat or decreased slightly.
Figures 31 – Enterprises with chief data or chief analytics officers 2016-2017
86%84%
87%88%
4%
3%
3%3%
4%
5%
4% 4%
2%
2%
3% 2%
4%6%
4% 4%
75%
80%
85%
90%
95%
100%
2016 2017 2016 2017
Enterprises with a Chief Data Officer Enterprises with a Chief Analytics Officer
Enterprises with Chief Data or Chief Analytics Officers 2016-2017
Don't have one For less than 1 year 1 -3 years 3 - 5 years More than 5 years

2017 Wisdom of Crowds® Business Intelligence Market Study
http://www.dresneradvisory.com Copyright 2017 – Dresner Advisory Services, LLC
49
Perceived Impact of Chief Data or Chief Analytics Officers
in 2017, we asked respondents to describe the perceived impact of a chief data officer
or chief analytics officer in their organization (fig. 32). This question does not account for
good or bad impact, tenure, or other variables. To almost identical degrees, 29 percent
say the presence of the CDO or CAO brought "high impact," 57 to 59 percent reported
"moderate impact," and 13 to 14 percent reported "low impact." While abstract, an initial
observation of this finding is that the presence of a CDO or CAO definitely creates
broad workforce awareness in some discernible way. In our view, the presence of a
CDO or CAO might well represent an elevation of the competency center or a high-
reporting approach to data and analytics that brings more organizational focus. (Also
see reporting structure, fig. 36, p. 54.)
Figure 32 – Impact of Chief Data and Chief Analytics officers
14% 13%
57% 59%
29% 29%
0%
10%
20%
30%
40%
50%
60%
70%
80%
90%
100%
Chief Data Officer Chief Analytics Officer
Impact of Chief Data and Chief Analytics Officers
Low impact Moderate impact High impact

2017 Wisdom of Crowds® Business Intelligence Market Study
http://www.dresneradvisory.com Copyright 2017 – Dresner Advisory Services, LLC
50
Enterprises with Chief Data or Chief Analytics Officers by Geography
The title of chief data officer has the greatest overall penetration and the most activity in
Asia Pacific, followed by EMEA (fig. 33). This finding is the reverse of what we reported
in 2016. CDO longevity (> 5 years) is greatest in EMEA (7 percent) and North America
(6 percent). The title of chief analytics officer likewise has the greatest overall
penetration in Asia Pacific followed by EMEA. CAOs have less overall penetration than
CDOs outside of Asia Pacific and lower percentages of lengthy tenure. Interestingly,
Latin American respondents report slightly higher CDO/CAO penetration than North
American organizations.
Figure 33 – Enterprises with chief data or chief analytics officers by geography
0%
5%
10%
15%
20%
25%
NorthAmerica
Asia Pacific Latin America Europe,Middle Eastand Africa
NorthAmerica
Asia Pacific Latin America Europe,Middle Eastand Africa
Chief Data Officer Chief Analytics Officer
Enterprises with Chief Data or Chief Analytics Officers by Geography
For less than 1 year 1 -3 years 3 - 5 years More than 5 years

2017 Wisdom of Crowds® Business Intelligence Market Study
http://www.dresneradvisory.com Copyright 2017 – Dresner Advisory Services, LLC
51
Enterprises with Chief Data or Chief Analytics Officers by Industry
In 2017, Business Services leads appointment rates for chief analytics officers, with the
bulk of these jobs newly created in the last year (fig. 34). Excluding Business Services,
CAO penetration is highest (and most mature) in Higher Education, followed by
Healthcare, Financial Services, Technology, and a comparatively small group in
Retail/Wholesale. Higher Education respondents also lead our sample in CDO
appointments and report the most longevity. Financial Services and Healthcare
respondents are the next most likely to have appointed CDOs.
Figure 34 – Enterprises with chief data or chief analytics officers by industry
0%
5%
10%
15%
20%
25%
30%
Tech
no
logy
Fin
anci
al S
ervi
ces
Hea
lth
care
Edu
cati
on
(H
igh
er E
d)
Ret
ail a
nd
Wh
ole
sale
Bu
sin
ess
Ser
vice
s
Oth
er
Tech
no
logy
Fin
anci
al S
ervi
ces
Hea
lth
care
Edu
cati
on
(H
igh
er E
d)
Man
ufa
ctu
rin
g
Ret
ail a
nd
Wh
ole
sale
Bu
sin
ess
Ser
vice
s
Oth
er
Chief Analytics Officer Chief Data Officer
Enterprises with Chief Data or Chief Analytics Officers by Industry
For less than 1 year 1 -3 years 3 - 5 years More than 5 years

2017 Wisdom of Crowds® Business Intelligence Market Study
http://www.dresneradvisory.com Copyright 2017 – Dresner Advisory Services, LLC
52
Enterprises with Chief Data or Chief Analytics Officers by Organization Size
Appointments of chief data officers and chief analytics officers are, for the most part, a
large-organization phenomenon (fig. 35). Small organizations of one to 100 employees
are the next most likely to appoint a CAO, though we expect this role might be inclusive
of other duties and not a dedicated position (depending on definition). Chief data
officers are by far most numerous at very large organizations followed by large
organizations with 1,001 to 10,000 employees. Large organizations report the greatest
maturity by far for both titles, though new activity is more comparable at small as well as
large organizations.
Figure 35 – Enterprises with chief data or chief analytics officers by organization size
0%
5%
10%
15%
20%
25%
30%
35%
1-100 101-1,000 1,001-10,000 More than10,000
1-100 101-1,000 1,001-10,000 More than10,000
Chief Analytics Officer Chief Data Officer
Enterprises with Chief Data or Chief Analytics Officers by Organization Size
For less than 1 year 1 -3 years 3 - 5 years More than 5 years

2017 Wisdom of Crowds® Business Intelligence Market Study
http://www.dresneradvisory.com Copyright 2017 – Dresner Advisory Services, LLC
53
Enterprises with Chief Data and Chief Analytics Officers Reporting Structure
Among organizations with a CAO or CDO, both titles are by far most likely to report in to
the CEO (fig. 36). Chief data officers are more likely to report in to the CIO than are
CAOs, perhaps in reflection of the true or perceived business strategy implications of
analytical expertise versus traditional wrangling of data. In smaller numbers, CAOs are
also more likely to report to the senior marketing function. That said, both roles are
about equally likely to report to Finance.
Figure 36 – Chief data and chief analytics officer reporting structure
0%
5%
10%
15%
20%
25%
30%
35%
40%
Chief Analytics Officer Chief Data Officer
Chief Data and Chief Analytics Officers Reporting Structure
CEO CFO CIO CMO Other

2017 Wisdom of Crowds® Business Intelligence Market Study
http://www.dresneradvisory.com Copyright 2017 – Dresner Advisory Services, LLC
54
Chief Data Officer and Success with BI by Reporting Structure
Organizations with a chief data officer that are also successful with business intelligence
are most likely by far to report to the CEO (fig. 37). However, unsuccessful BI
organizations with CDOs are even more likely to report to the CEO. CDOs in
unsuccessful BI organizations are also more likely to report to the CIO. By this measure,
we might first observe that there is no obvious correlation between CDO reporting and
BI success. But we also observe that in successful BI organizations, CDOs are often
connected to high-level business resources (senior executives, successful IT
departments, and Finance).
Figure 37 – Chief data officer and success with BI by reporting structure
0%
5%
10%
15%
20%
25%
30%
35%
40%
45%
50%
Successful with BI Unsuccessful with BI
Chief Data Officer and Success with BI by Reporting Structure
CEO CFO CIO CMO Other

2017 Wisdom of Crowds® Business Intelligence Market Study
http://www.dresneradvisory.com Copyright 2017 – Dresner Advisory Services, LLC
55
Chief Analytics Officer and Success with BI by Reporting Structure
Like CDOs, chief analytics officers from successful and unsuccessful BI organizations
most often report to the CEO, in part merely because CEOs are by far the most
common reporting hierarchy (fig. 38). Also, both successful and unsuccessful BI
organizations are about equally likely to report to Finance or IT leadership. Though a
small minority, there is some evidence of BI success among CAOs reporting in to the
chief marketing officer.
Figure 38 – Chief analytics officer and success with BI by reporting structure
0%
10%
20%
30%
40%
50%
60%
Successful with BI Unsuccessful with BI
Chief Analytics Officer and Success with BI by Reporting Structure
CEO CFO CIO CMO Other

2017 Wisdom of Crowds® Business Intelligence Market Study
http://www.dresneradvisory.com Copyright 2017 – Dresner Advisory Services, LLC
56
Number of Business Intelligence Tools in Use
Number of Business Intelligence Tools in Use 2013 to 2017
Over time, we see some shifting in the number of business intelligence tools in use by
organizations accompanied by somewhat improved awareness (fewer "don't know")
(fig. 39). Most obviously in 2017, the number of organizations using three to four or
more BI tools has increased over time (though we also acknowledge the increase in the
number of role-specific, lightweight and service-based BI tools that might allow
operational/discretionary spending and departmental use of BI).
Figure 39 – Number of business intelligence tools in use 2013-2017
0%
5%
10%
15%
20%
25%
30%
One Two Three Four or more Don't know
Numbers of Business Intelligence Tools in Use 2013-2017
2013 2014 2015 2016 2017

2017 Wisdom of Crowds® Business Intelligence Market Study
http://www.dresneradvisory.com Copyright 2017 – Dresner Advisory Services, LLC
57
Number of Business Intelligence Tools by Geography
North American and Asia-Pacific organizations are most likely to use four or more
business intelligence tools (purple band, fig. 40). While geographical differences remain,
(e.g., higher multiple tool use in North America and lack of awareness in Latin America),
they are less distinctive than in earlier studies.
Figure 40 – Numbers of business intelligence tools in use by geography
0% 10% 20% 30% 40% 50% 60% 70% 80% 90% 100%
North America
Europe, Middle East and Africa
Asia Pacific
Latin America
Number of Business Intelligence Tools in Use by Geography
One Two Three Four or more Don't know

2017 Wisdom of Crowds® Business Intelligence Market Study
http://www.dresneradvisory.com Copyright 2017 – Dresner Advisory Services, LLC
58
Number of Business Intelligence Tools by Function
Executive management respondents are most likely to report one or two BI tools in use
and the most BI tool awareness (fig. 41). Executive management is most likely to know
the actual number of tools in use compared to all functions except the BICC. The BICC,
with the most organizational sympathy toward BI projects, tends to report higher
numbers of tools in use than do other functions. Finance departments are the least
likely to know the number of tools in use, perhaps another reflection of increasing
discretionary spending and departmental use of BI.
Figure 41 – Numbers of business intelligence tools in use by function
0% 10% 20% 30% 40% 50% 60% 70% 80% 90% 100%
Business Intelligence Competency Center
Information Technology (IT)
Finance
Marketing & Sales
Executive Management
Number of Business Intelligence Tools in Use by Function
One Two Three Four or more Don't know

2017 Wisdom of Crowds® Business Intelligence Market Study
http://www.dresneradvisory.com Copyright 2017 – Dresner Advisory Services, LLC
59
Number of Business Intelligence Tools by Vertical Industry
By industry, Healthcare respondents have the highest awareness of the number of BI
tools in use, while Higher Education respondents have the lowest (fig. 42).
Manufacturing reports the most (consolidated) one or two tools in use, while majorities
of Financial Services and Healthcare respondents report three or four BI tools in use.
Figure 42 – Numbers of business intelligence tools in use by industry
0% 10% 20% 30% 40% 50% 60% 70% 80% 90% 100%
Education (Higher Ed)
Retail and Wholesale
Technology
Manufacturing
Other
Business Services
Financial Services
Healthcare
Number of Business Intelligence Tools in Use by Industry
One Two Three Four or more Don't know

2017 Wisdom of Crowds® Business Intelligence Market Study
http://www.dresneradvisory.com Copyright 2017 – Dresner Advisory Services, LLC
60
Number of Business Intelligence Tools by Organization Size
High organizational headcount historically correlates to greater numbers of business
intelligence tools in use, and the same is true in 2017 (fig. 43). Organizations of 100 or
fewer employees are more than 60 percent likely to report one or tools in use. Mid-sized
organizations are 55 percent likely to report one or two tools in use, a figure that drops
to just over 30 percent in large organizations of 1,001 to 10,000 employees. Meanwhile,
very large organizations (>10,000 employees) are 49 percent likely to report four or
more BI tools in use, compared to just 12 percent in small organizations.
Figure 43 – Number of business intelligence tools in use by organization size
0% 10% 20% 30% 40% 50% 60% 70% 80% 90% 100%
More than 10,000
1,001-10,000
101-1,000
1-100
Number of Business Intelligence Tools in Use by Organization Size
One Two Three Four or more Don't know

2017 Wisdom of Crowds® Business Intelligence Market Study
http://www.dresneradvisory.com Copyright 2017 – Dresner Advisory Services, LLC
61
Technologies and Initiatives Strategic to Business Intelligence
Fundamental business intelligence technologies—reporting, dashboards, end-user self-
service, advanced visualization, and data warehousing—top our 2017 list of
technologies and initiatives among 33 topics we currently study (fig. 44). Second-tier
initiatives include data discovery, data mining/advanced algorithms, and data
storytelling. Midrange priorities include governance, end user data prep and data
catalog. Compared to longstanding BI assets, some “hot button” topics including
Internet of Things, cognitive BI, and social media analytics remain fringe priorities
among respondents. (In 2017, we added data catalog, natural language analytics, and
video analytics to the topics we study).
Figure 44 – Technologies and initiatives strategic to business intelligence
0% 20% 40% 60% 80% 100%
Video analytics
Edge computing
Internet of Things (IoT)
Complex event processing (CEP)
Open source software
Social media analysis (Social BI)
Natural language analytics (natural language…
Text analytics
Cognitive BI (e.g., Artificial Intelligence-…
Prepackaged vertical / functional analytical…
Streaming data analysis
Ability to write to transactional applications
Location intelligence / analytics
Big Data (e.g., Hadoop)
In-memory analysis
Cloud computing
Search-based interface
Data catalog
Collaborative support for group-based…
End-user data preparation and blending
Governance
Embedded BI (contained within an…
Enterprise planning / budgeting
Mobile device support
Integration with operational processes
Data storytelling
Data mining, advanced algorithms, predictive
Data discovery
Data warehousing
End-user "self-service"
Advanced visualization
Dashboards
Reporting
Technologies and Initiatives Strategic to Business Intelligence
Critical Very important Important Somewhat important Not important

2017 Wisdom of Crowds® Business Intelligence Market Study
http://www.dresneradvisory.com Copyright 2017 – Dresner Advisory Services, LLC
62
Technology Priority Changes from 2013
Technology priority rankings (particularly the highest scored), remain fairly consistent
since 2013 (fig. 45). Reporting and dashboards retain and improve their top standing.
We see that overall appetites for data discovery, integration with operational processes,
and data storytelling, among others, decline across three years of data, though year-
over-year trends are somewhat different (next chart, following page). If the past is
precedent, some post-hype declines, especially among newer technologies, may come
to rebound in future studies as more use cases and maturity arrive.
Figure 45 – Technology priorities 2015-2017
0
0.5
1
1.5
2
2.5
3
3.5
4
4.5
Technology Priorities 2015-2017
2015 2016 2017

2017 Wisdom of Crowds® Business Intelligence Market Study
http://www.dresneradvisory.com Copyright 2017 – Dresner Advisory Services, LLC
63
In Fig. 46 we show another instructive view of year-over-year changes in business
intelligence priorities. In this view, big data (e.g., Hadoop), complex event processing,
and cognitive BI grew most by percentage. (We first noted a significant post-hype
rebound in big data in our eponymous 2016 report after years of stagnation.) Durable
topics including mobile device support, governance, and reporting also saw gains in
2017. Among decliners, data discovery reversed 2016 gains, and open source software
and data storytelling fell next most in prominence. Momentum measurements add color
to our overall rankings, but short-term swings in sentiment may or may not confirm
trends.
Figure 46 – Technology priority changes 2016-2017
-11% -6% -1% 4% 9%
Data discoveryOpen source software
Data storytellingAbility to write to transactional applications
Integration with operational processesText analytics
Data warehousingEnterprise planning
Data mining, advanced algorithms, predictivePre-packaged analytical applications
Embedded BIIn-memory analysis
End-user "self-service"Collaborative support for group-based analysis
Social media analysis (Social BI)Cloud computing
Advanced visualizationLocation intelligence/analytics
Search-based interfaceInternet of Things
DashboardsEnd-user data preparation and blending
ReportingGovernance
Streaming data analysisMobile device support
Edge computingCognitive BI
Complex event processing (CEP)Big data (e.g., Hadoop)
Technology Priority Changes 2016-2017

2017 Wisdom of Crowds® Business Intelligence Market Study
http://www.dresneradvisory.com Copyright 2017 – Dresner Advisory Services, LLC
64
Technologies and Initiatives Strategic to Business Intelligence by Geography
By region, Asia Pacific leads interest in most technologies and initiatives strategic to BI
(fig. 47). Asia Pacific interest stands out most in cloud computing and search-based
interface. North America generally ranks second in most measures but has the highest
score for the top initiative, reporting. EMEA and Latin America trail interest in most
technologies and initiatives, though Latin America reports the highest interest in ability
to write to transactional apps, cognitive BI, and edge computing. EMEA does not lead in
any category of interest.
Figure 47 – Technologies and initiatives strategic to business intelligence objectives by geography
0
0.5
1
1.5
2
2.5
3
3.5
4
4.5Reporting
DashboardsAdvanced visualization
End-user "self-service"
Data warehousing
Data discovery
Data mining, advanced algorithms,…
Data storytelling
Integration with operational…
Mobile device support
Enterprise planning / budgeting
Embedded BI (contained within an…
Governance
End-user data preparation and…
Collaborative support for group-…Data catalog
Search-based interfaceCloud computingIn-memory analysis
Big Data (e.g., Hadoop)
Location intelligence / analytics
Ability to write to transactional…
Streaming data analysis
Prepackaged vertical / functional…
Cognitive BI (e.g., Artificial…
Text analytics
Natural language analytics (natural…
Social media analysis (Social BI)
Open source software
Complex event processing (CEP)
Internet of Things (IoT)
Edge computingVideo analytics
Technologies and Initiatives Strategic to Business Intelligence Objectives by Geography
Europe, Middle East and Africa Latin America North America Asia Pacific

2017 Wisdom of Crowds® Business Intelligence Market Study
http://www.dresneradvisory.com Copyright 2017 – Dresner Advisory Services, LLC
65
Technologies and Initiatives Strategic to Business Intelligence by Function
Functional attitudes toward BI technologies and initiatives generally relate to specific
daily roles and responsibilities (fig. 48). Executives report the highest interest in
reporting, enterprise planning, and ability to write to transactional apps. The BICC,
responsible for support services across BI objectives, leads prioritization of many or
most categories including end-user self-service, embedded BI, and end-user data
preparation. Dashboards, cloud computing, and natural language analytics appeal
strongly to Marketing and Sales. It is interesting to note that IT is not the primary driver
of any specific initiative or technology.
Figure 48 – Technologies and initiatives strategic to business intelligence by function
0
0.5
1
1.5
2
2.5
3
3.5
4
4.5Reporting
DashboardsAdvanced visualization
End-user "self-service"
Data warehousing
Data discovery
Data mining, advancedalgorithms, predictive
Data storytelling
Integration with operationalprocesses
Mobile device support
Enterprise planning / budgeting
Embedded BI (contained withinan application, portal, etc.)
Governance
End-user data preparation andblending
Collaborative support for group-based analysis
Data catalogSearch-based interfaceCloud computing
In-memory analysisBig Data (e.g., Hadoop)
Location intelligence / analytics
Ability to write to transactionalapplications
Streaming data analysis
Prepackaged vertical / functionalanalytical applications
Cognitive BI (e.g., ArtificialIntelligence-based BI)
Text analytics
Natural language analytics(natural language query/…
Social media analysis (Social BI)
Open source software
Complex event processing (CEP)
Internet of Things (IoT)
Edge computingVideo analytics
Technologies and Initiatives Strategic to Business Intelligence by Function
Business Intelligence Competency Center Executive ManagementMarketing & Sales Information Technology (IT)Finance

2017 Wisdom of Crowds® Business Intelligence Market Study
http://www.dresneradvisory.com Copyright 2017 – Dresner Advisory Services, LLC
66
Technologies and Initiatives Strategic to Business Intelligence by Vertical Industry
Vertical industries describe a range of interest in different 2017 business intelligence
initiatives and priorities (fig. 49). Manufacturing reports high scores for end-user self-
service, data warehousing, integration with operational processes, and end-user data
preparation. Healthcare leads interest in several mid-tier initiatives including enterprise
planning, embedded BI, governance, collaborative support for group-based analysis,
and search-based interface, among others. Financial Services respondents are strong
advocates for cloud computing, big data, cognitive BI, and social media analysis and
also have strong affinity for governance. In 2017, Education respondents trail interest in
many technologies and initiatives we study.
Figure 49 – Technologies and initiatives strategic to business intelligence by vertical industry
0
0.5
1
1.5
2
2.5
3
3.5
4
4.5Reporting
DashboardsAdvanced visualization
End-user "self-service"
Data warehousing
Data discovery
Data mining, advancedalgorithms, predictive
Data storytelling
Integration with operationalprocesses
Mobile device support
Enterprise planning / budgeting
Embedded BI (contained withinan application, portal, etc.)
Governance
End-user data preparation andblending
Collaborative support forgroup-based analysis
Data catalogSearch-based interfaceCloud computing
In-memory analysisBig Data (e.g., Hadoop)
Location intelligence / analytics
Ability to write to transactionalapplications
Streaming data analysis
Prepackaged vertical /functional analytical…
Cognitive BI (e.g., ArtificialIntelligence-based BI)
Text analytics
Natural language analytics(natural language query/…
Social media analysis (Social BI)
Open source software
Complex event processing (CEP)
Internet of Things (IoT)
Edge computingVideo analytics
Technologies and Initiatives Strategic to Business Intelligence by Vertical Industry
Education (Higher Ed) Financial services Healthcare Manufacturing

2017 Wisdom of Crowds® Business Intelligence Market Study
http://www.dresneradvisory.com Copyright 2017 – Dresner Advisory Services, LLC
67
Technologies and Initiatives Strategic to Business Intelligence by Organization Size
Business intelligence priorities vary by organization size though, generally, very large
organizations lead interest in most technologies and initiatives in 2017 (fig. 50). That
said, mid-sized organizations of 101 to 1,000 employees actually lead demand for
dashboards, and small organizations (1-100 employees) expectedly lead interest in
cloud computing as well as social media analysis. We note that the top two initiatives,
reporting, and dashboards are tightly grouped with high importance compared to all
others.
Figure 50 – Technologies and initiatives strategic to business intelligence by organization size
0
0.5
1
1.5
2
2.5
3
3.5
4
4.5Reporting
DashboardsAdvanced visualization
End-user "self-service"
Data warehousing
Data discovery
Data mining, advancedalgorithms, predictive
Data storytelling
Integration withoperational processes
Mobile device support
Enterprise planning /budgeting
Embedded BI (containedwithin an application,…
Governance
End-user data preparationand blending
Collaborative support forgroup-based analysis
Data catalogSearch-based interfaceCloud computing
In-memory analysisBig Data (e.g., Hadoop)
Location intelligence /analytics
Ability to write totransactional applications
Streaming data analysis
Prepackaged vertical /functional analytical…
Cognitive BI (e.g., ArtificialIntelligence-based BI)
Text analytics
Natural language analytics(natural language query/…
Social media analysis(Social BI)
Open source software
Complex event processing(CEP)
Internet of Things (IoT)
Edge computingVideo analytics
Technologies and Initiatives Strategic to Business Intelligence by Organization Size
1-100 101-1,000 1,001-10,000 More than 10,000

2017 Wisdom of Crowds® Business Intelligence Market Study
http://www.dresneradvisory.com Copyright 2017 – Dresner Advisory Services, LLC
68
Business Intelligence and the State of Data
For a fourth year, we polled respondents for attitudes and behaviors reflective of the
“state of data” in their organizations (fig. 51). As their choices describe, a good majority
(65 percent) of organizations say they either see data as “truth” or maintain a common
enterprise view of data limited by parochial views and semantics. This finding is slightly
higher than in 2016. Twenty-three percent report consistent "department-level data,"
and 12 percent report the worst state of data, "multiple inconsistent data sources with
conflicting semantics and data."
Figure 51 – Business intelligence and the state of data
12%
23%
37%
28%
0% 5% 10% 15% 20% 25% 30% 35% 40%
We have multiple, inconsistent data sources withconflicting semantics and data. Information is generally
unreliable and distrusted
Consistent data is available at a departmental level.Conflicting, functional views of data causes confusion and
disagreement
A common view of enterprise data is available. However,parochial views and semantics are used to support specific
positions
Data as "truth" - A common view of enterprise data isavailable with common application of data, filters, rules,
and semantics
Business Intelligence and the State of Data

2017 Wisdom of Crowds® Business Intelligence Market Study
http://www.dresneradvisory.com Copyright 2017 – Dresner Advisory Services, LLC
69
Across three years of data, respondents’ overall opinions of their “state of data” are
largely flat with some nuanced distinctions (fig. 52). Twenty-eight percent see the
highest level of data as “truth” and may constitute a base of high-performing
organizations that stand out from the majority. The next most desirable state, "a
common view of enterprise data is available..." has declined somewhat in the last three
years but is closer to flat year over year. Lower states of "consistent department..." data
and "multiple inconsistent data sources" are effectively flat over time.
Figure 52 – Business intelligence and the state of data 2015-2017
0%
5%
10%
15%
20%
25%
30%
35%
40%
45%
Data as "truth" - Acommon view ofenterprise data is
available with commonapplication of data,
filters, rules, andsemantics.
A common view ofenterprise data is
available. However,parochial views and
semantics are used tosupport specific positions
Consistent data isavailable at a
departmental level.Conflicting, functionalviews of data causes
confusion anddisagreement
We have multiple,inconsistent data sourceswith conflicting semanticsand data. Information isgenerally unreliable and
distrusted
Business Intelligence and The State of Data 2015-2017
2015
2016
2017

2017 Wisdom of Crowds® Business Intelligence Market Study
http://www.dresneradvisory.com Copyright 2017 – Dresner Advisory Services, LLC
70
Business Intelligence and the State of Data by Geography
Estimations of organizational data maturity are remarkably similar across regional
geographies (fig. 53). Asia-Pacific respondents report the highest scores for "data as
truth" (31 percent) while all other regions trail this measure rather closely (28-29
percent). Asia-Pacific respondents are also slightly the most likely to report "consistent
data by department" or "multiple, inconsistent data sources" (red, blue bands). EMEA
respondents report slightly higher "common view of enterprise data" available (green
band).
Figure 53 – Business intelligence and the state of data by geography
0%
10%
20%
30%
40%
50%
60%
70%
80%
90%
100%
North America Europe, MiddleEast and Africa
Latin America Asia Pacific
Business Intelligence and the State of Data by Geography
Data as "truth" - A common view ofenterprise data is available withcommon application of data, filters,rules, and semantics
A common view of enterprise data isavailable. However, parochial viewsand semantics are used to supportspecific positions
Consistent data is available at adepartmental level. Conflicting,functional views of data causesconfusion and disagreement
We have multiple, inconsistent datasources with conflicting semantics anddata. Information is generallyunreliable and distrusted

2017 Wisdom of Crowds® Business Intelligence Market Study
http://www.dresneradvisory.com Copyright 2017 – Dresner Advisory Services, LLC
71
Business Intelligence and the State of Data by Function
Estimations of organizational data maturity are less consistent by function than by
geography (fig. 54). Executive Management and BICC respondents are the most likely
to report the highest common view of data as “truth.” Interestingly, Finance respondents
are less certain, though they have a better overall estimation than Marketing, Sales, or
IT. Unidentified or non-traditional functions (other) are least confident in their
organizational state of data.
Figure 54 – Business intelligence and the state of data by function
0%
10%
20%
30%
40%
50%
60%
70%
80%
90%
100%
InformationTechnology
(IT)
ExecutiveManagement
Finance Marketing &Sales
BusinessIntelligenceCompetency
Center
Business Intelligence and the State of Data by Function
Data as "truth" - A common view ofenterprise data is available withcommon application of data, filters,rules, and semantics
A common view of enterprise data isavailable. However, parochial viewsand semantics are used to supportspecific positions
Consistent data is available at adepartmental level. Conflicting,functional views of data causesconfusion and disagreement
We have multiple, inconsistent datasources with conflicting semantics anddata. Information is generallyunreliable and distrusted

2017 Wisdom of Crowds® Business Intelligence Market Study
http://www.dresneradvisory.com Copyright 2017 – Dresner Advisory Services, LLC
72
Business Intelligence and the State of Data by Vertical Industry
By industry, 80 percent of Manufacturing respondents report their data conforms to the
two highest states of data (fig. 55). Retail/Wholesale and Technology respondents are
most likely to report a state of "data as truth." Higher Education, Financial Services, and
Healthcare respondents are the least confident in their organizations' state of data.
Figure 55 - Business intelligence and the state of data by industry
0%
10%
20%
30%
40%
50%
60%
70%
80%
90%
100%
Business Intelligence and the State of Data by Industry
Data as "truth" - A common view ofenterprise data is available withcommon application of data, filters,rules, and semantics
A common view of enterprise data isavailable. However, parochial viewsand semantics are used to supportspecific positions
Consistent data is available at adepartmental level. Conflicting,functional views of data causesconfusion and disagreement
We have multiple, inconsistent datasources with conflicting semantics anddata. Information is generallyunreliable and distrusted

2017 Wisdom of Crowds® Business Intelligence Market Study
http://www.dresneradvisory.com Copyright 2017 – Dresner Advisory Services, LLC
73
Business Intelligence and the State of Data by Organization Size
Smaller organizations (which, on average, manage a smaller scope of data than larger
peers) are most likely to “have their act together” with a more mature state of data than
larger peers (fig. 56). Moving left to right, we see the state of data tends to become less
coordinated and more fragmented as organization headcount increases until it improves
slightly at the largest organizations with more than 10,000 employees. Less than 14
percent of organizations of any size report the lowest state on multiple, inconsistent
data sources, a 3 percent improvement over 2016.
Figure 56 – Business intelligence and the state of data by organization size
0%
10%
20%
30%
40%
50%
60%
70%
80%
90%
100%
1-100 101-1,000 1,001-10,000 More than10,000
Business Intelligence and the State of Data by Organization Size
Data as "truth" - A common view ofenterprise data is available withcommon application of data, filters,rules, and semantics
A common view of enterprise data isavailable. However, parochial viewsand semantics are used to supportspecific positions
Consistent data is available at adepartmental level. Conflicting,functional views of data causesconfusion and disagreement
We have multiple, inconsistent datasources with conflicting semantics anddata. Information is generallyunreliable and distrusted

2017 Wisdom of Crowds® Business Intelligence Market Study
http://www.dresneradvisory.com Copyright 2017 – Dresner Advisory Services, LLC
74
Business Intelligence and Action on Insight
In 2014, we introduced “action on insight,” a high-level self-assessment of best (and
worst) practices in organizational use of data. In 2017, respondents paint a very positive
picture of insight leverage (fig. 57). Eighty-six percent of respondents say they have
either "closed loop" or "ad hoc (informal)" action on insights, meaning that they actively
share BI-derived insights with colleagues. Just 9 percent report "uncoordinated or
parochial action," and only 5 percent say "insights are rarely leveraged."
Figure 57 – Business intelligence and action on insight
28%
58%
9%
5%
0%
10%
20%
30%
40%
50%
60%
70%
"Closed loop" - Informationis shared, teams work to
process and act in a timelyfashion. No formal
boundaries
Ad hoc (informal) action oninsights across functions
Uncoordinated/ parochialaction (sometimes at the
expense of others)
Insights are rarely leveraged
Business Intelligence and Action on Insight

2017 Wisdom of Crowds® Business Intelligence Market Study
http://www.dresneradvisory.com Copyright 2017 – Dresner Advisory Services, LLC
75
Across four years of data, we have seen a mostly flat or slightly improving trend in
estimations of organizational ability to take action on insight (fig. 58). We note small
incremental gains in "closed loop" success, again perhaps indicating the constitution of
a core set of high performers. The number reporting "ad hoc (informal)" action on insight
is below all-time highs but rebounded somewhat from 2016. Less than 10 percent of
respondents say they take "uncoordinated/parochial action," and only 5 percent "rarely
leverage insights."
Figure 58 – Business intelligence and action on insight 2014-2017
0%
10%
20%
30%
40%
50%
60%
70%
“Closed-loop processes for action” -Information is shared,
teams work to process and act in a timely fashion. No formal boundaries
Ad hoc (informal)action on insightsacross functions
Uncoordinated/parochial action
(sometimes at theexpense of others)
Insights are rarelyleveraged
Action on Insight 2014-2017
2014
2015
2016
2017

2017 Wisdom of Crowds® Business Intelligence Market Study
http://www.dresneradvisory.com Copyright 2017 – Dresner Advisory Services, LLC
76
Business Intelligence and Action on Insight by Geography
Organizational estimations of the ability to take action on insight run strongest in Asia
Pacific, followed by Latin America, where sentiment grew noticeably from 2016 (fig. 59).
Confidence is somewhat lower in North America and EMEA. We acknowledge these
scores are sentiment and do not represent hard measurements. Rather, they are
regional sentiments of perceived capabilities to act on insight.
Figure 59 – Business intelligence and action on insight by geography
0%
10%
20%
30%
40%
50%
60%
70%
80%
90%
100%
North America Europe, MiddleEast and Africa
Asia Pacific Latin America
Business Intelligence and Action on Insight by Geography
"Closed loop" - Information is shared,teams work to process and act in atimely fashion. No formal boundaries
Ad hoc (informal) action on insightsacross functions
Uncoordinated/ parochial action(sometimes at the expense of others)
Insights are rarely leveraged

2017 Wisdom of Crowds® Business Intelligence Market Study
http://www.dresneradvisory.com Copyright 2017 – Dresner Advisory Services, LLC
77
Business Intelligence and Action on Insight by Function
BICC respondents, most aware of BI and collaborative capabilities, have traditionally
been the most confident in their organization's ability to take action on insight, and this
is again the case in 2017 (fig. 60). "On-the-go" users in Marketing/Sales and Executive
Management are the next most likely to say they are adept at taking action on data
insights. Of the functions studied, IT and Finance are least likely to coordinate action on
insight in 2017.
Figure 60 – Business intelligence and action on insight by function
0%
10%
20%
30%
40%
50%
60%
70%
80%
90%
100%
InformationTechnology
(IT)
ExecutiveManagement
Finance Marketing &Sales
BusinessIntelligenceCompetency
Center
Business Intelligence and Action on Insight by Function
"Closed loop" - Information is shared,teams work to process and act in atimely fashion. No formal boundaries
Ad hoc (informal) action on insightsacross functions
Uncoordinated/ parochial action(sometimes at the expense of others)
Insights are rarely leveraged

2017 Wisdom of Crowds® Business Intelligence Market Study
http://www.dresneradvisory.com Copyright 2017 – Dresner Advisory Services, LLC
78
Business Intelligence and Action on Insight by Vertical Industry
Industries generally exhibit high confidence in their ability to take action on insight (fig.
61). In our 2017 sample, respondents in Technology, Retail/Wholesale, and
Manufacturing are the most confident in their ability to act on data. Heathcare
respondents are the most likely to report "closed-loop" processes. Education and
Financial Services trail all industries in their ability to act on insight.
Figure 61 – Business Intelligence and action on insight by industry
0%
10%
20%
30%
40%
50%
60%
70%
80%
90%
100%
Business Intelligence and Action on Insight by Industry
"Closed loop" - Information is shared,teams work to process and act in atimely fashion. No formal boundaries
Ad hoc (informal) action on insightsacross functions
Uncoordinated/ parochial action(sometimes at the expense of others)
Insights are rarely leveraged

2017 Wisdom of Crowds® Business Intelligence Market Study
http://www.dresneradvisory.com Copyright 2017 – Dresner Advisory Services, LLC
79
Business Intelligence and Action on Insight by Organization Size
Small organizations (1-100 employees) fare best in their ability to act on insight, and
confidence decreases thereafter as organization size grows (fig. 62). More than 80
percent of all organizations claim "closed loop" or ad hoc abilities; however, very large
organizations are more than twice as likely as small peers to report
"uncoordinated/parochial action" or "insights are rarely leveraged."
Figure 62 – Business intelligence and action on insight by organization size
0%
10%
20%
30%
40%
50%
60%
70%
80%
90%
100%
1-100 101-1,000 1,001-10,000 More than10,000
Business Intelligence and Action on Insight by Organization Size
"Closed loop" - Information is shared,teams work to process and act in atimely fashion. No formal boundaries
Ad hoc (informal) action on insightsacross functions
Uncoordinated/ parochial action(sometimes at the expense of others)
Insights are rarely leveraged

2017 Wisdom of Crowds® Business Intelligence Market Study
http://www.dresneradvisory.com Copyright 2017 – Dresner Advisory Services, LLC
80
Success with Business Intelligence
In 2017, our core measure of "success with business intelligence" appears to have
declined slightly overall (fig. 63). The number of respondents that say their
organizations are “successful” with Bl fell from 37 percent to 33 percent. "Somewhat
successful" organizations fell by 2 percent while "somewhat successful" organizations
grew noticeably from 8 percent to 14 percent. We cannot be certain what mix of
emergent BI challenges and/or higher expectations these scores represent, but it goes
against the grain of incremental improvements we have seen over time.
Figure 63 – Success with business intelligence 2015-2017
0%
10%
20%
30%
40%
50%
60%
Successful Somewhat successful Somewhat unsuccessful Unsuccessful
Success with Business Intelligence 2015-2017
2015 2016 2017

2017 Wisdom of Crowds® Business Intelligence Market Study
http://www.dresneradvisory.com Copyright 2017 – Dresner Advisory Services, LLC
81
Reasons Why Business Intelligence Succeeds
Tag cloud analysis of BI success flows through classic expectations of information
improvements in "data," “business,” "users," and “use” (fig. 64). Interestingly, "reporting"
ranks as strongly as more hyped terms like "analytics." Also interesting, 2017
respondents commenting on success are more interested in applied use of BI rather
than process-oriented terms such as "integration" or "quality" as measures of success.
Figure 64 – Reasons for success with business intelligence

2017 Wisdom of Crowds® Business Intelligence Market Study
http://www.dresneradvisory.com Copyright 2017 – Dresner Advisory Services, LLC
82
Reasons Why Business Intelligence Fails
Asked for reasons why business intelligence fails, respondents point to "data" as a
moving target of quality, integration, security, etc., and their "lack" of ability to access,
manipulate, and use data (fig. 65). To a lesser extent, they see shortfalls in business
"resources," "systems," and "analytics" and seem unconvinced that management has
grasped process issues of teamwork, establishing needs, and data quality issues.
Figure 65 – Reasons why business intelligence fails

2017 Wisdom of Crowds® Business Intelligence Market Study
http://www.dresneradvisory.com Copyright 2017 – Dresner Advisory Services, LLC
83
How Successful Organizations Measure Success with Business Intelligence
New in 2017, we asked respondents to quantify in more detail how they measure the
success of business intelligence initiatives (fig. 66). The top result is "user
feedback/satisfaction" (70 percent), followed by "customer feedback/satisfaction" (39
percent), "ROI" (33 percent), "system/app activity" (33 percent), and "numbers of users"
(23 percent). The top takeaway from this view is rather obviously to "engage with users"
rather than focus on systems or investment, though it also reflects that positive user
experiences led these organizations to conclude they were successful.
Figure 66 – Measures of success with business intelligence
0%
10%
20%
30%
40%
50%
60%
70%
80%
Userfeedback/satisfaction
Customerfeedback/satisfaction
Return on investment(ROI) model
System/applicationactivity
Numbers of deployedusers
Measures of Success with Business Intelligence

2017 Wisdom of Crowds® Business Intelligence Market Study
http://www.dresneradvisory.com Copyright 2017 – Dresner Advisory Services, LLC
84
How Unsuccessful Organizations Measure Failure with Business Intelligence
In 2017, we also asked respondents to better quantify how they measure the failure of
business intelligence initiatives (fig. 67). The top result was "lack of usage" (69 percent),
followed by "limited adoption" (59 percent), "user feedback" (41 percent), "cost/ROI" (33
percent), and "numbers of users" (27 percent). From this view, we might conclude that
less successful organizations are less likely to judge their failure on user feedback than
successful ones. Unsuccessful companies instead are more likely to judge their failure
on less transparent, high-level (often IT) metrics of system activity and user headcount.
We believe the findings in figs. 66 and 67 also demonstrate the value and more frequent
success of organizations with a business intelligence competency center.
Figure 67 – Measures of failure with business intelligence
0%
10%
20%
30%
40%
50%
60%
70%
80%
Lack of usage Limited adoption User feedback Cost/Return on investment
Measures of Failure with Business Intelligence

2017 Wisdom of Crowds® Business Intelligence Market Study
http://www.dresneradvisory.com Copyright 2017 – Dresner Advisory Services, LLC
85
Success with Business Intelligence by Organization Size
The smallest organizations are most likely (41 percent) to consider themselves
“completely successful,” and 86 percent say they are at least “somewhat successful”
with business intelligence (fig. 68). One-third of mid-sized organizations say they
"completely agree" that they are successful, a figure that declines to about 22 percent in
large organizations. As we see elsewhere in our survey data, reports of success tend to
decline with organizational size until they flatten or rebound slightly with the very largest.
Figure 68 – Success with business intelligence by organization size
1
1.5
2
2.5
3
3.5
4
4.5
5
0%
10%
20%
30%
40%
50%
60%
70%
80%
90%
100%
1-100 101-1,000 1,001-10,000 More than 10,000
Success with Business Intelligence by Organization Size
Completely agree
Agree somewhat
Disagree somewhat
Disagree
Mean

2017 Wisdom of Crowds® Business Intelligence Market Study
http://www.dresneradvisory.com Copyright 2017 – Dresner Advisory Services, LLC
86
Success with Business Intelligence by BI Objectives
Organizations that are successful with business intelligence are most likely to focus on
the full range of objectives we sampled in 2017 (fig. 69). The most popular objective of
successful BI organizations is “better decision making” followed by "improved
operational efficiency," "improved revenue growth," and "increased competitive
advantage." Organizations that consider themselves unsuccessful are less emphatic in
all areas but are the most likely to focus on revenue growth over "soft benefits" of
generally improved performance.
Figure 69 – Success with business intelligence by BI objectives
0
0.5
1
1.5
2
2.5
3
3.5
4
4.5
5
Better decisionmaking
Improvedoperationalefficiencies
Growth in revenues Increasedcompetitiveadvantage
Enhanced customerservice
Success with Business Intelligence by BI Objectives
Successful Somewhat successful Somewhat unsuccessful Unsuccessful

2017 Wisdom of Crowds® Business Intelligence Market Study
http://www.dresneradvisory.com Copyright 2017 – Dresner Advisory Services, LLC
87
Success with Business Intelligence by Targeted Users
Organizations at all levels of BI success are highly likely to target executive as users
(fig. 70). We also notice that less successful BI organization take executive focus to the
extreme, and become less successful as executive focus increases. We also see that
successful BI organizations are more likely than all other groups to focus on customers
(though historically, a small minority of organizations has targeted customers for BI).
Organizations that focus on middle managers are most likely to be "somewhat
successful" though this is not a linear trend across differing levels of success.
Figure 70 – Success with business intelligence by targeted users
75%
80%
85%
90%
95%
100%
Successful Somewhat successful Somewhat unsuccessful Unsuccessful
Success With Business Intelligence by Targeted Users
Executives Middle Managers
Line Managers Individual Contributors and Professionals
Customers Suppliers

2017 Wisdom of Crowds® Business Intelligence Market Study
http://www.dresneradvisory.com Copyright 2017 – Dresner Advisory Services, LLC
88
Success with Business Intelligence and Technology Priorities
Organizations with a chief data officer or chief analytics officer with "high" or "moderate"
impact are highly likely to report success with business intelligence (fig. 71). This finding
alone would appear to be an endorsement of the CDO/CAO function, though we
reiterate that the criteria for what constitutes "impact" and sentiments of success are
abstract and in the eye of the beholder.
Figure 71 – Impact of chief data and analytics officers by success with BI
0
10
20
30
40
50
60
70
0%
10%
20%
30%
40%
50%
60%
70%
80%
90%
100%
Chief Data Officer Chief Analytics Officer Chief Data Officer Chief Analytics Officer
Successful with BI Unsuccessful with BI
Impact of Chief Data and Analytics Officers by Success with BI
Low impact Moderate impact High impact Mean

2017 Wisdom of Crowds® Business Intelligence Market Study
http://www.dresneradvisory.com Copyright 2017 – Dresner Advisory Services, LLC
89
Success with Business Intelligence and Technology Priorities
Organizations that are successful with business intelligence broadly pay more attention
to multiple BI-related technology priorities than all other groups (fig. 72). This diversity of
attention extends from the most basic (reporting, dashboards) to the more obscure
(edge computing, video analytics) priorities. Without fail, unsuccessful organizations
care much less about any and all BI initiatives and technologies. The most significant
gaps between high- and low-performing BI organizations also run from the foundational
(dashboards, end-user self-service) to the emerging and experimental (CEP, IoT).
Overall, attention to technologies and initiatives diminishes in an orderly way as success
with BI diminishes.
Figure 72 – Technologies and initiatives strategic to business intelligence by BI success
0
0.5
1
1.5
2
2.5
3
3.5
4
4.5
ReportingDashboards
Advanced visualization
End-user "self-service"
Data warehousing
Data discovery
Data mining, advanced…
Data storytelling
Mobile device support
Governance
Integration with…
Enterprise planning /…
Collaborative support for…
End-user data…
Embedded BI (contained…Data catalog
Search-based interfaceCloud computingBig Data (e.g., Hadoop)
Location intelligence /…
In-memory analysis
Ability to write to…
Streaming data analysis
Cognitive BI (e.g.,…
Prepackaged vertical /…
Text analytics
Social media analysis…
Open source software
Natural language…
Complex event…
Internet of Things (IoT)
Edge computingVideo analytics
Technologies and Initiatives Strategic to Business Intelligence by BI Success
Successful Somewhat successful Somewhat unsuccessful Unsuccessful

2017 Wisdom of Crowds® Business Intelligence Market Study
http://www.dresneradvisory.com Copyright 2017 – Dresner Advisory Services, LLC
90
Success with Business Intelligence and Number of BI Tools
In 2017 (and historically), we find that organizations that are successful with business
intelligence generally have fewer tools in use, an outcome we associate with strategic
intent and engaged leadership. Awareness of the number of tools in use also increases
with the degree of BI success (fig. 73). As we noted elsewhere in this report (figs. 39-43,
pp. 57-61) the emergence of specialized / lightweight / service-based BI tools could
change the historically virtuous pursuit of BI tool consolidation.
Figure 73 – Number of business intelligence tools in use by BI success
0%
10%
20%
30%
40%
50%
60%
70%
80%
90%
100%
Successful Somewhat successful Somewhat unsuccessful Unsuccessful
Number of Business Intelligence Tools in Use by BI Success
One Two Three Four or more Don't know

2017 Wisdom of Crowds® Business Intelligence Market Study
http://www.dresneradvisory.com Copyright 2017 – Dresner Advisory Services, LLC
91
Success with Business Intelligence and the State of Data
Success with business intelligence correlates directly and powerfully to an
organization’s state of data (fig. 74). Organizations that view data as “truth” are more
than 80 percent likely to be "successful," compared to 40 percent for "somewhat
unsuccessful" and just 12 percent of "unsuccessful" organizations. "Unsuccessful" BI
organizations are 60 percent likely to have "multiple, inconsistent data sources."
Figure 74 – Business intelligence and the state of data by BI success
0%
10%
20%
30%
40%
50%
60%
70%
80%
90%
100%
Successful Somewhatsuccessful
Somewhatunsuccessful
Unsuccessful
Business Intelligence and the State of Data by BI Success
Data as "truth" - A common view ofenterprise data is available withcommon application of data, filters,rules, and semantics
A common view of enterprise data isavailable. However, parochial viewsand semantics are used to supportspecific positions
Consistent data is available at adepartmental level. Conflicting,functional views of data causesconfusion and Unsuccessfulment
We have multiple, inconsistent datasources with conflicting semantics anddata. Information is generallyunreliable and distrusted

2017 Wisdom of Crowds® Business Intelligence Market Study
http://www.dresneradvisory.com Copyright 2017 – Dresner Advisory Services, LLC
92
Success with Business Intelligence and Action on Insight
Success with business intelligence correlates (even more strongly than state of data)
with an organization’s ability to take action on insights (fig. 75). At the high end of
performance, organizations with closed-loop processes are completely successful 47
percent of the time and at least somewhat successful 95 percent of the time.
Organizations with ad hoc or informal action on insights are four times or more less
likely to report complete success. Organizations with the lowest level of coordination are
much more likely to fail than to succeed.
Figure 75 – Business intelligence and action on insight by BI success
0%
10%
20%
30%
40%
50%
60%
70%
80%
90%
100%
Successful Somewhatsuccessful
Somewhatunsuccessful
Unsuccessful
Business Intelligence and Action on Insight by BI Success
"Closed loop" - Information is shared,teams work to process and act in atimely fashion. No formal boundaries
Ad hoc (informal) action on insightsacross functions
Uncoordinated/ parochial action(sometimes at the expense of others)
Insights are rarely leveraged

2017 Wisdom of Crowds® Business Intelligence Market Study
http://www.dresneradvisory.com Copyright 2017 – Dresner Advisory Services, LLC
93
Success with Business Intelligence and Penetration of Users
Organizations that are more successful with business intelligence have a higher number
of users as a percentage of the workforce (fig. 76). Nearly half of "successful"
organizations have BI penetration levels of 41 percent or more. As BI success
decreases, so does penetration: among unsuccessful organizations, less than 20
percent have the same (41 percent or greater) level of BI penetration. More than half of
unsuccessful organizations have less than 10 percent BI penetration.
Figure 76 – Penetration of business intelligence solutions today by BI success
0%
10%
20%
30%
40%
50%
60%
70%
80%
90%
100%
Successful Somewhat successful Somewhat unsuccessful Unsuccessful
Penetration of Business Intelligence Solutions Today by BI Success
81% or more
61 - 80%
41 - 60%
21 - 40%
11 - 20%
Under 10%

2017 Wisdom of Crowds® Business Intelligence Market Study
http://www.dresneradvisory.com Copyright 2017 – Dresner Advisory Services, LLC
94
Budget Plans for Business Intelligence
In 2017, we asked organizations whether they will increase, decrease, or maintain
existing business intelligence budgets (fig. 77). Overall, we can affirm that spending will
increase: half of respondent organizations plan to increase BI investment while just 5
percent will decrease BI budgets from 2016 levels. The remaining 45 percent will
maintain current budgeting, though we do not know the extent to which BI expansion
might be affected by departmental spending or the adoption or service/subscription BI
services.
Figure 77 – Budget plans for business intelligence
5%
45%
50%
0%
10%
20%
30%
40%
50%
60%
Decreasing over last year Staying the same as last year Increasing over last year
Budget Plans for Business Intelligence

2017 Wisdom of Crowds® Business Intelligence Market Study
http://www.dresneradvisory.com Copyright 2017 – Dresner Advisory Services, LLC
95
Budget Plans for Business Intelligence by Geography
In 2017, 59 percent of Asia-Pacific organizations say they will increase BI spending,
compared to 52 percent in North America and fewer than half in other regions (fig. 78).
EMEA organizations are the least likely to increase BI spending, though fewer than 10
percent plan to decrease spending. Ninety-six percent of North American organizations
will increase or maintain business intelligence budgets compared to current levels.
Figure 78 – Budget plans for business intelligence by geography
0%
10%
20%
30%
40%
50%
60%
70%
80%
90%
100%
North America Europe, Middle East andAfrica
Asia Pacific Latin America
Budget Plans for Business Intelligenceby Geography
Decreasing over last year Staying the same as last year Increasing over last year

2017 Wisdom of Crowds® Business Intelligence Market Study
http://www.dresneradvisory.com Copyright 2017 – Dresner Advisory Services, LLC
96
Budget Plans for Business Intelligence by Function
In 2017, 70 percent of BICC respondents (the most ardent BI advocates) say they will
increase BI spending over last year (fig. 79). Perhaps pursuant to earlier investment,
BICCs are also the most likely (10 percent) to decrease BI spending. Executive
management respondents are the next most likely to increase BI spending; IT and
Finance respondents are the least likely to increase business intelligence spending.
Figure 79 – Budget plans for business intelligence by function
0%
10%
20%
30%
40%
50%
60%
70%
80%
90%
100%
BusinessIntelligenceCompetency
Center
ExecutiveManagement
InformationTechnology (IT)
Marketing & Sales Other Finance
Budget Plans for Business Intelligenceby Function
Decreasing over last year Staying the same as last year Increasing over last year

2017 Wisdom of Crowds® Business Intelligence Market Study
http://www.dresneradvisory.com Copyright 2017 – Dresner Advisory Services, LLC
97
Budget Plans for Business Intelligence by Vertical Industry
In 2017, Technology industry respondents are most likely (60 percent) to increase BI
budgets and least likely (< 1 percent) to decrease spending (fig. 80). At the other end of
the spectrum, Manufacturing and Higher Education are the least likely (40 percent) to
increase spending and 4 to 7 percent likely to decrease spending. Retail/Wholesale,
Financial Services, and Healthcare are slightly above average in increased or
maintained BI spending.
Figure 80 – Budget plans for business intelligence by industry
0%
10%
20%
30%
40%
50%
60%
70%
80%
90%
100%
Technology Retail andWholesale
FinancialServices
Healthcare Other Education(Higher Ed)
Manufacturing
Budget Plans for Business Intelligenceby Industry
Decreasing over last year Staying the same as last year Increasing over last year

2017 Wisdom of Crowds® Business Intelligence Market Study
http://www.dresneradvisory.com Copyright 2017 – Dresner Advisory Services, LLC
98
Budget Plans for Business Intelligence by Organization Size
As we have traditionally observed, in 2017, small organizations (1-100 employees) and
very large organizations (>10,000 employees) are slightly more aggressive in their
business intelligence plans compared to mid-sized (101-1,000 employees) and large
(1,001-10,000 employees) organizations (fig. 81). While very large organizations are
most likely overall (54 percent) to increase spending, they are also most likely (11
percent) to decrease BI spending.
Figure 81 – Budget plans for business intelligence by organization size
0%
10%
20%
30%
40%
50%
60%
70%
80%
90%
100%
1-100 101-1,000 1,001-10,000 More than 10,000
Budget Plans for Business Intelligenceby Organization Size
Decreasing over last year Staying the same as last year Increasing over last year

2017 Wisdom of Crowds® Business Intelligence Market Study
http://www.dresneradvisory.com Copyright 2017 – Dresner Advisory Services, LLC
99
Budget Plans for Business Intelligence by Success with BI
Organizations that are successful with business intelligence are more likely to increase
BI spending (51 percent versus 43 percent) in 2017 (fig. 82) Successful BI organizations
are also less likely (4 percent) to decrease BI spending in the current year compared to
unsuccessful BI organizations (11 percent). We note again that this finding refers to
budgeted BI spending and does not necessarily reflect departmental/ discretionary
spending.
Figure 82 – Budget plans for business intelligence by success with BI
0%
10%
20%
30%
40%
50%
60%
70%
80%
90%
100%
Successful with BI Unsuccessful with BI
Budget Plans for Business Intelligenceby Success with BI
Decreasing over last year Staying the same as last year Increasing over last year

2017 Wisdom of Crowds® Business Intelligence Market Study
http://www.dresneradvisory.com Copyright 2017 – Dresner Advisory Services, LLC
100
Industry and
Vendor
Analysis

2017 Wisdom of Crowds® Business Intelligence Market Study
http://www.dresneradvisory.com Copyright 2017 – Dresner Advisory Services, LLC
101
Industry and Vendor Analysis In this section, we review business intelligence vendor and market performance, using
our trademark 33-criteria evaluation model.
Scoring Criteria
The criteria for the various industry and vendor rankings are grouped into seven
categories including sales/acquisition experience, value for price paid, quality and
usefulness of product, quality of technical support, quality and value of consulting,
integrity, and whether the vendor is recommended.

2017 Wisdom of Crowds® Business Intelligence Market Study
http://www.dresneradvisory.com Copyright 2017 – Dresner Advisory Services, LLC
102
Industry Performance
Sales/Acquisition Experience
Across four years of data, "industry professionalism" and "product knowledge" retain
the highest and most consistent scores in our evaluation (fig. 83). In 2017, we see
incremental, across-the-board improvements. Most notably, "responsiveness" has a
strong increase over the previous three years of mostly flat performance. We also see
notable gains in "contractual terms," "business practices," "follow up after sale," and
"flexibility/accommodation." "Understanding our business needs" also improved.
Figure 83 – Industry performance — sales and acquisition experience: 2014-2017
3.60
3.70
3.80
3.90
4.00
4.10
4.20
4.30
4.40
2014 2015 2016 2017
Industry Performance – Sales and Acquisition Experience: 2014-2017
Professionalism Product knowledge
Understanding our business/needs Responsiveness
Flexibility/accommodation Business practices
Contractual terms and conditions Follow up after the sale

2017 Wisdom of Crowds® Business Intelligence Market Study
http://www.dresneradvisory.com Copyright 2017 – Dresner Advisory Services, LLC
103
Value
End users generally believe they get high and improving value from industry vendors
over time (fig. 84). While performance fell modestly in 2017 compared to the prior year,
upward impetus is clear across the last four years of our study, and the ongoing trend
line above 4.0 remains very positive. Since 2012, perceived value for price paid has
remained above "very good."
Figure 84 – Industry performance — value 2014-2017
3.98
4.00
4.02
4.04
4.06
4.08
4.10
4.12
4.14
2014 2015 2016 2017
Industry Performance - Value 2014-2017

2017 Wisdom of Crowds® Business Intelligence Market Study
http://www.dresneradvisory.com Copyright 2017 – Dresner Advisory Services, LLC
104
Quality and Usefulness of Product
Industry product quality and usefulness has improved over time across almost all
dimensions (fig. 85). Some of the most notable year-over-year improvements are in
areas associated with product maturity and include "reliability of technology,"
"scalability," and integration of components within product." The only measure that
declines in 2017 is "ease of upgrade/migration to new versions."
Figure 85 – Industry performance — quality and usefulness of products 2014-2017
3.30
3.40
3.50
3.60
3.70
3.80
3.90
4.00
4.10
4.20
Robustness/sophistication oftechnology
Completeness of functionality
Reliability of technology
Scalability
Integration of componentswithin product
Integration with third-partytechnologies
Overall usability
Ease of installation
Ease of administration
Customization andextensibility
Ease of upgrade/migration tonew versions
Online training, forums anddocumentation
Industry Performance - Quality and Usefulness of Products 2014-2017
2014 2015 2016 2017

2017 Wisdom of Crowds® Business Intelligence Market Study
http://www.dresneradvisory.com Copyright 2017 – Dresner Advisory Services, LLC
105
Technical Support
In 2017, the vendor industry reached all-time high performance scores in all areas we
measure (fig. 86). The largest year-over-year gains are in "professionalism" and
"continuity of personnel." "Product knowledge," "responsiveness," and "time to resolve
problems" also improved. (We consider these latter three areas cornerstones of
immediacy in support of urgent customer needs). In total, these results indicate
encouraging signs of vendor success that should continue into the future.
Figure 86 – Industry performance — technical support 2014-2017
3.50
3.60
3.70
3.80
3.90
4.00
4.10
4.20
4.30
4.40
2014 2015 2016 2017
Industry Performance - Technical Support 2014-2017
Professionalism Product knowledge Responsiveness
Continuity of personnel Time to resolve problems

2017 Wisdom of Crowds® Business Intelligence Market Study
http://www.dresneradvisory.com Copyright 2017 – Dresner Advisory Services, LLC
106
Consulting
BI vendor consulting also carries a six-year positive trend into 2017 (fig. 87). Every
attribute we measured exceeds 2016 performance, and very nearly all attributes stand
at all-time highs. Year-over-year gains are mostly equal across all attributes.
Estimations of "value" rebounded since 2015, and "continuity" (which suffered from both
employee poaching and consultant over-hiring beginning in 2015), shows steady
improvement.
Figure 87 – Industry performance — BI vendor consulting 2014-2017
3.5
3.6
3.7
3.8
3.9
4
4.1
4.2
4.3
4.4
2011 2012 2013 2014 2015 2016 2017
Industry Performance - BI Vendor Consulting 2014-2017
Professionalism
Product knowledge
Experience
Continuity
Value

2017 Wisdom of Crowds® Business Intelligence Market Study
http://www.dresneradvisory.com Copyright 2017 – Dresner Advisory Services, LLC
107
Integrity
Vendor integrity—measured as honesty and truthfulness in all dealings—grew slowly
but surely over the last four years with the best year-over-year gains occurring in 2017
(fig. 88). With mean scores well above 4.0, indicating "very good" to "excellent," this
parameter of industry performance is secure and improving as a core competency of
the provider industry.
Figure 88 – Industry performance — integrity 2014-2017
4.24
4.26
4.28
4.30
4.32
4.34
4.36
4.38
4.40
2014 2015 2016 2017
Industry Performance - Integrity 2014-2017

2017 Wisdom of Crowds® Business Intelligence Market Study
http://www.dresneradvisory.com Copyright 2017 – Dresner Advisory Services, LLC
108
Recommended
Industry performance, by the measure of customers willing to recommend, continues a
four-year positive trend that had reversed after 2011 (fig. 89). Just as the scores for
recommend have rebounded for three straight years, they are also the highest mean
scores of any in our survey, well above "very likely" and approaching certainty.
Figure 89 – Industry performance — recommended 2014-2017
4.60
4.62
4.64
4.66
4.68
4.70
4.72
4.74
4.76
2014 2015 2016 2017
Industry Performance - Recommended 2014-2017

2017 Wisdom of Crowds® Business Intelligence Market Study
http://www.dresneradvisory.com Copyright 2017 – Dresner Advisory Services, LLC
109
Performance Improvements
Another view of overall vendor performance over time shows entrenched positive
scores that may signal maturity in features and diminishing urgency for vendor
upgrades (fig. 90). Compared to 2016 and the two previous years, perceived overall
industry performance is nearly flat, suggesting that vendors paid suitable attention to
their products in a positive sales climate. In conjunction with positive views of their own
performance, users do not perceive any notable decline in overall vendor performance.
Figure 90 – Overall industry performance improvement 2014-2017
39% 39%45% 45%
56% 57%50% 52%
4% 5% 5% 4%
0%
10%
20%
30%
40%
50%
60%
70%
80%
90%
100%
2014 2015 2016 2017
Overall Industry Performance Improvement 2014-2017
Improved Stayed the same Declined

2017 Wisdom of Crowds® Business Intelligence Market Study
http://www.dresneradvisory.com Copyright 2017 – Dresner Advisory Services, LLC
110
Vendor
Ratings
2017 Wisdom of Crowds® Business Intelligence Market Study
http://www.dresneradvisory.com Copyright 2017 – Dresner Advisory Services, LLC
111
Vendor Ratings In this section, we offer ratings of business intelligence software vendors. We rated
vendors using 33 different criteria, on a five-point scale for each. Criteria covered sales
/acquisition experience (8 criteria), value for price paid (1), quality and usefulness of
product (12), quality of technical support (5), quality and value of consulting services (5),
whether the vendor is recommended (1), and integrity (1).
As we explore vendor performance in more detail, it is important to understand the scale
we used in scoring the industry and vendors:
• 5.0 = Excellent
• 4.0 = Very good
• 3.0 = Adequate
• 2.0 = Poor
• 1.0 = Very poor
In 2016, we dispensed with market segmentation and now rely upon our Customer
Experience and Vendor Credibility models as a means of presenting relative vendor
ratings. As a result, we no longer include a peer average for individual vendor rating
charts. Instead, this is replaced (where possible) with a year-over-year comparison for
each vendor.
Based on our scoring methodology, all vendors performed at a level that is considered
more than “adequate” for all criteria categories.
Please note that “average score” is the mathematical mean of all items included in
vendor ratings. Each column in the chart represents a scale consisting of varying
numbers of items (for example, "sales" is a scale consisting of eight items, while "value
for price paid” is one item). As such, each column is weighted differently (based upon
the number of items represented and the number of respondents rating those items) in
calculating the overall average rating. The average score cannot be calculated by
simply averaging across the subscale scores.

2017 Wisdom of Crowds® Business Intelligence Market Study
http://www.dresneradvisory.com Copyright 2017 – Dresner Advisory Services, LLC
112
Business Intelligence Market Models
Starting in 2015, we developed two new models for examining and understanding the
business intelligence market. Using quadrants, we plotted aggregated user sentiment
into x and y axes.
Customer Experience Model
The customer experience model considers the real-world experience of customers
working with BI products on a daily basis (fig. 96). For the x axis, we combined all
vendor touch points—including the sales and acquisition process (8 measures),
technical support (5 measures), and consulting services (5 measures) —into a single
“sales and service” dimension. On the y axis, we plotted customer sentiment
surrounding product, derived from the 12 product and technology measures used to
rank vendors. On the resulting four quadrants, we plotted vendors based on these
measures.
The upper-right quadrant contains the highest-scoring vendors and is named “overall
experience leaders.” Technology leaders (upper-left quadrant) identifies vendors with
strong product offerings but relatively lower services scores. Contenders (lower-left
quadrant) would benefit from varying degrees of improvement to product, services, or
both.
User sentiment surrounding outliers (outside of the four quadrants) suggests that
significant improvements are required to product and services.

2017 Wisdom of Crowds® Business Intelligence Market Study
http://www.dresneradvisory.com Copyright 2017 – Dresner Advisory Services, LLC
113
Figure 91 —Customer experience model

2017 Wisdom of Crowds® Business Intelligence Market Study
http://www.dresneradvisory.com Copyright 2017 – Dresner Advisory Services, LLC
114
Vendor Credibility Model
The vendor credibility model considers how customers “feel” about their vendor (fig. 97).
The x axis plots perceived value for the price paid. The y axis combines the integrity
and recommend measures, creating a “confidence” dimension. The resulting four
quadrants position vendors based on these dimensions.
The upper-right quadrant contains the highest-scoring vendors and is named “credibility
leaders.” Trust leaders (upper-left quadrant) identifies vendors with solid perceived
confidence but relatively lower value scores. Contenders (lower-left quadrant) would
benefit by working to improve customer value, confidence, or both.
User sentiment surrounding outliers (outside of the four quadrants) suggests that
significant improvements are required to improve perceived value and confidence.

2017 Wisdom of Crowds® Business Intelligence Market Study
http://www.dresneradvisory.com Copyright 2017 – Dresner Advisory Services, LLC
115
Figure 92 —Vendor credibility model

2017 Wisdom of Crowds® Business Intelligence Market Study
http://www.dresneradvisory.com Copyright 2017 – Dresner Advisory Services, LLC
116
Detailed Vendor Ratings In this section, we offer detailed vendor scores. Using our 33-criteria evaluation model
(table 1), we compare each vendor’s performance to their previous year’s performance
and to the average for all vendors (all records in the study population).
The detailed criteria are below. We added “clock” position information to assist in
locating specific scores.
Table 1 - Detailed vendor rating criteria
- Sales/acquisition experience (12 - 2 o’clock)
o Professionalism o Product knowledge o Understanding our
business/needs o Responsiveness o Flexibility/accommodation o Business practices o Contractual terms and
conditions o Follow-up after the sale
- Value for price (3 o’clock)
- Quality and usefulness of product
(3 - 7 o’clock) o Robustness/sophistication of
technology o Completeness of functionality o Reliability of technology o Scalability o Integration of components
within product o Integration with third-party
technologies o Overall usability o Ease of installation o Ease of administration
- Quality and usefulness of product (continued)
o Customization and extensibility
o Ease of upgrade/migration to new versions
o Online forums and documentation
- - Quality of technical support
(8 - 9 o’clock) o Professionalism o Product knowledge o Responsiveness o Continuity of personnel o Time to resolve problems
- Quality and value of consulting
services (9 - 10 o’clock) o Professionalism o Product knowledge o Experience o Continuity o Value
- Integrity (11 o’clock)
- Whether vendor is
recommended (12 o’clock)

2017 Wisdom of Crowds® Business Intelligence Market Study
http://www.dresneradvisory.com Copyright 2017 – Dresner Advisory Services, LLC
117
Dimensional Insight Detailed Score
Figure 93 – Dimensional Insight detailed score
With scores well above the entire sample, Dimensional Insight is a consistent overall
leader in both the Customer Experience and Vendor Credibility models and is best in
class for sales product knowledge. It show key improvements in sales professionalism,
product knowledge, product scalability, customization and extensibility, technical
support, continuity of personnel, and recommend.
0.0
0.5
1.0
1.5
2.0
2.5
3.0
3.5
4.0
4.5
5.0Sales: professionalism
Product knowledgeUnderstanding our…
Responsiveness
Flexibility/accommodation
Business practices
Contractual terms and…
Follow up after the sale
Value
Product: robustness/…
Completeness of…
Reliability of technology
Scalability
Integration of…
Integration with third-…Overall usability
Ease of installationEase of administrationCustomization and…
Ease of…
Online training, forums…
Support: professionalism
Product knowledge
Responsiveness
Continuity of personnel
Time to resolve problems
Consult: professionalism
Product knowledge
Experience
Continuity
Value
IntegrityRecommend
Dimensional Insight
Dimensional Insight 2016 Dimensional Insight 2017 Overall Sample

2017 Wisdom of Crowds® Business Intelligence Market Study
http://www.dresneradvisory.com Copyright 2017 – Dresner Advisory Services, LLC
118
Domo Detailed Score
Figure 94 – Domo detailed score
In its second year of coverage, Domo’s scores improved across the board for 2017. It is
ranked as an overall leader in both the Customer Experience and Vendor Credibility
models. It is best in class for product robustness, reliability of technology, scalability,
integration of components within product, integration with third-party technologies,
overall usability, ease of upgrade/migration to new versions, and has a perfect
recommend score.
0.0
0.5
1.0
1.5
2.0
2.5
3.0
3.5
4.0
4.5
5.0Sales: professionalism
Product knowledgeUnderstanding our…
Responsiveness
Flexibility/accommodation
Business practices
Contractual terms and…
Follow up after the sale
Value
Product: robustness/…
Completeness of…
Reliability of technology
Scalability
Integration of…
Integration with third-…Overall usability
Ease of installationEase of administrationCustomization and…
Ease of…
Online training, forums…
Support: professionalism
Product knowledge
Responsiveness
Continuity of personnel
Time to resolve problems
Consult: professionalism
Product knowledge
Experience
Continuity
Value
IntegrityRecommend
Domo
Domo 2016 Domo 2017 Overall Sample

2017 Wisdom of Crowds® Business Intelligence Market Study
http://www.dresneradvisory.com Copyright 2017 – Dresner Advisory Services, LLC
119
GoodData Detailed Score
Figure 95 – GoodData detailed score
For 2017, GoodData is ranked as a Technology Leader in the Customer Experience
Model and a Value Leader in the Vendor Credibility Model. It is generally in line with or
above the overall sample for most measures and maintains a perfect recommend score.
0.0
0.5
1.0
1.5
2.0
2.5
3.0
3.5
4.0
4.5
5.0Sales: professionalism
Product knowledgeUnderstanding our…
Responsiveness
Flexibility/accommodation
Business practices
Contractual terms and…
Follow up after the sale
Value
Product: robustness/…
Completeness of…
Reliability of technology
Scalability
Integration of…
Integration with third-…Overall usability
Ease of installationEase of administrationCustomization and…
Ease of…
Online training, forums…
Support: professionalism
Product knowledge
Responsiveness
Continuity of personnel
Time to resolve problems
Consult: professionalism
Product knowledge
Experience
Continuity
Value
IntegrityRecommend
GoodData
GoodData 2016 GoodData 2017 Overall Sample

2017 Wisdom of Crowds® Business Intelligence Market Study
http://www.dresneradvisory.com Copyright 2017 – Dresner Advisory Services, LLC
120
Google Detailed Score
Figure 96 – Google detailed score
In its first year of inclusion, Google is generally in line with or slightly above the overall
sample for product measures and value but well below most other measures—
especially technical support and consulting services. It is considered an overall leader in
the Vendor Credibility Model and has a perfect recommend score.
0.0
0.5
1.0
1.5
2.0
2.5
3.0
3.5
4.0
4.5
5.0Sales: professionalism
Product knowledgeUnderstanding our…
Responsiveness
Flexibility/accommodation
Business practices
Contractual terms and…
Follow up after the sale
Value
Product: robustness/…
Completeness of…
Reliability of technology
Scalability
Integration of…
Integration with third-…Overall usability
Ease of installationEase of administrationCustomization and…
Ease of…
Online training, forums…
Support: professionalism
Product knowledge
Responsiveness
Continuity of personnel
Time to resolve problems
Consult: professionalism
Product knowledge
Experience
Continuity
Value
IntegrityRecommend
Google 2017 Overall Sample

2017 Wisdom of Crowds® Business Intelligence Market Study
http://www.dresneradvisory.com Copyright 2017 – Dresner Advisory Services, LLC
121
IBM Detailed Score
Figure 97 – IBM detailed score
Although below the overall sample, for 2017, IBM shows key improvements across
virtually all measurement categories including sales, value, product, and consulting. It is
considered a contender in the Customer Experience Model.
0.0
0.5
1.0
1.5
2.0
2.5
3.0
3.5
4.0
4.5
5.0Sales: professionalism
Product knowledgeUnderstanding our…
Responsiveness
Flexibility/accommodation
Business practices
Contractual terms and…
Follow up after the sale
Value
Product: robustness/…
Completeness of…
Reliability of technology
Scalability
Integration of…
Integration with third-…Overall usability
Ease of installationEase of administrationCustomization and…
Ease of…
Online training, forums…
Support: professionalism
Product knowledge
Responsiveness
Continuity of personnel
Time to resolve problems
Consult: professionalism
Product knowledge
Experience
Continuity
Value
IntegrityRecommend
IBM
IBM 2016 IBM 2017 Overall Sample

2017 Wisdom of Crowds® Business Intelligence Market Study
http://www.dresneradvisory.com Copyright 2017 – Dresner Advisory Services, LLC
122
Infor Detailed Score
Figure 98 – Infor detailed score
For 2017, with Infor’s acquisition of Birst, we combined both sets of scores under Infor.
In general, Infor/Birst’s scores are below the overall sample with key improvements
across all sales measures and technical support. Infor is considered a contender in the
Vendor Credibility Model.
0.0
0.5
1.0
1.5
2.0
2.5
3.0
3.5
4.0
4.5
5.0Sales: professionalism
Product knowledgeUnderstanding our…
Responsiveness
Flexibility/accommodation
Business practices
Contractual terms and…
Follow up after the sale
Value
Product: robustness/…
Completeness of…
Reliability of technology
Scalability
Integration of…
Integration with third-…Overall usability
Ease of installationEase of administrationCustomization and…
Ease of…
Online training, forums…
Support: professionalism
Product knowledge
Responsiveness
Continuity of personnel
Time to resolve problems
Consult: professionalism
Product knowledge
Experience
Continuity
Value
IntegrityRecommend
Infor/Birst
Infor 2016 Infor 2017 Overall Sample

2017 Wisdom of Crowds® Business Intelligence Market Study
http://www.dresneradvisory.com Copyright 2017 – Dresner Advisory Services, LLC
123
Information Builders Detailed Score
Figure 99 – Information Builders detailed score
With scores consistently above the entire sample, Information Builders is an overall
leader in both the Customer Experience and Vendor Credibility models. For 2017, it
shows key improvements in sales product knowledge, understanding business/needs,
contractual terms and conditions, product robustness/sophistication of technology,
completeness of functionality, reliability of technology, scalability, integration of
components within product , integration with third-party technologies, customization and
extensibility, online training, forums and documentation, technical support continuity of
personnel, and time to resolve problems. It maintains a perfect recommend score.
0.0
0.5
1.0
1.5
2.0
2.5
3.0
3.5
4.0
4.5
5.0Sales: professionalism
Product knowledgeUnderstanding our…
Responsiveness
Flexibility/accommodation
Business practices
Contractual terms and…
Follow up after the sale
Value
Product: robustness/…
Completeness of…
Reliability of technology
Scalability
Integration of…
Integration with third-…Overall usability
Ease of installationEase of administrationCustomization and…
Ease of…
Online training, forums…
Support: professionalism
Product knowledge
Responsiveness
Continuity of personnel
Time to resolve problems
Consult: professionalism
Product knowledge
Experience
Continuity
Value
IntegrityRecommend
Information Builders
Information Builders 2016 Information Builders 2017 Overall Sample

2017 Wisdom of Crowds® Business Intelligence Market Study
http://www.dresneradvisory.com Copyright 2017 – Dresner Advisory Services, LLC
124
Jedox Detailed Score
Figure 100 – Jedox detailed score
For 2017, Jedox remains an overall leader in both the Customer Experience and
Vendor Credibility models. It scores generally above the overall sample for most
measures and shows key improvements in sales product knowledge, product
integration, consulting professionalism, product knowledge, and experience. It maintains
a perfect recommend score.
0.0
0.5
1.0
1.5
2.0
2.5
3.0
3.5
4.0
4.5
5.0Sales: professionalism
Product knowledgeUnderstanding our…
Responsiveness
Flexibility/accommodation
Business practices
Contractual terms and…
Follow up after the sale
Value
Product: robustness/…
Completeness of…
Reliability of technology
Scalability
Integration of…
Integration with third-…Overall usability
Ease of installationEase of administrationCustomization and…
Ease of…
Online training, forums…
Support: professionalism
Product knowledge
Responsiveness
Continuity of personnel
Time to resolve problems
Consult: professionalism
Product knowledge
Experience
Continuity
Value
IntegrityRecommend
Jedox
Jedox 2016 Jedox 2017 Overall Sample

2017 Wisdom of Crowds® Business Intelligence Market Study
http://www.dresneradvisory.com Copyright 2017 – Dresner Advisory Services, LLC
125
Klipfolio Detailed Score
Figure 101 – Klipfolio detailed score
With scores consistently above the overall sample, Klipfolio is an overall leader in both
the Customer Experience and Vendor Credibility models. It shows year-over-year key
improvements in sales, technical support, consulting services, integrity, and recommend
measures.
0.0
0.5
1.0
1.5
2.0
2.5
3.0
3.5
4.0
4.5
5.0Sales: professionalism
Product knowledgeUnderstanding our…
Responsiveness
Flexibility/accommodation
Business practices
Contractual terms and…
Follow up after the sale
Value
Product: robustness/…
Completeness of…
Reliability of technology
Scalability
Integration of…
Integration with third-…Overall usability
Ease of installationEase of administrationCustomization and…
Ease of…
Online training, forums…
Support: professionalism
Product knowledge
Responsiveness
Continuity of personnel
Time to resolve problems
Consult: professionalism
Product knowledge
Experience
Continuity
Value
IntegrityRecommend
Klipfolio
Klipfolio 2016 Klipfolio 2017 Overall Sample

2017 Wisdom of Crowds® Business Intelligence Market Study
http://www.dresneradvisory.com Copyright 2017 – Dresner Advisory Services, LLC
126
Logi Analytics Detailed Score
Figure 102 – Logi Analytics detailed score
For 2017, Logi Analytics is an overall leader in both the Customer Experience and
Vendor Credibility models. It shows significant improvements across all categories of
measurement, including sales, value, product, technical support, consulting services,
and integrity. It is best in class for product customization and extensibility, and
consulting experience and value. It has a perfect recommend score.
0.0
0.5
1.0
1.5
2.0
2.5
3.0
3.5
4.0
4.5
5.0Sales: professionalism
Product knowledgeUnderstanding our…
Responsiveness
Flexibility/accommodation
Business practices
Contractual terms and…
Follow up after the sale
Value
Product: robustness/…
Completeness of…
Reliability of technology
Scalability
Integration of…
Integration with third-…Overall usability
Ease of installationEase of administrationCustomization and…
Ease of…
Online training, forums…
Support: professionalism
Product knowledge
Responsiveness
Continuity of personnel
Time to resolve problems
Consult: professionalism
Product knowledge
Experience
Continuity
Value
IntegrityRecommend
Logi Analytics
Logi Analytics 2016 Logi Analytics 2017 Overall Sample

2017 Wisdom of Crowds® Business Intelligence Market Study
http://www.dresneradvisory.com Copyright 2017 – Dresner Advisory Services, LLC
127
Looker Detailed Score
Figure 103 – Looker detailed score
For 2017, Looker is ranked as an overall leader in both the Customer Experience and
Vendor Credibility models. It again scores significantly above the overall sample for
virtually all measures and was best in class for sales professionalism, understanding
business/needs, business practices, contractual terms and conditions, product online
training, forums and documentation, and integrity. It maintains a perfect recommend
score.
0.0
0.5
1.0
1.5
2.0
2.5
3.0
3.5
4.0
4.5
5.0Sales: professionalism
Product knowledgeUnderstanding our…
Responsiveness
Flexibility/accommodation
Business practices
Contractual terms and…
Follow up after the sale
Value
Product: robustness/…
Completeness of…
Reliability of technology
Scalability
Integration of…
Integration with third-…Overall usability
Ease of installationEase of administrationCustomization and…
Ease of…
Online training, forums…
Support: professionalism
Product knowledge
Responsiveness
Continuity of personnel
Time to resolve problems
Consult: professionalism
Product knowledge
Experience
Continuity
Value
IntegrityRecommend
Looker
Looker 2016 Looker 2017 Overall Sample

2017 Wisdom of Crowds® Business Intelligence Market Study
http://www.dresneradvisory.com Copyright 2017 – Dresner Advisory Services, LLC
128
Microsoft Detailed Score
Figure 104 – Microsoft detailed score
With scores generally below the overall sample, Microsoft is a contender in both the
Customer Experience and Vendor Credibility models. It shows key improvements for
2017 in overall value and technical support.
0.0
0.5
1.0
1.5
2.0
2.5
3.0
3.5
4.0
4.5
5.0Sales: professionalism
Product knowledgeUnderstanding our…
Responsiveness
Flexibility/accommodation
Business practices
Contractual terms and…
Follow up after the sale
Value
Product: robustness/…
Completeness of…
Reliability of technology
Scalability
Integration of…
Integration with third-…Overall usability
Ease of installationEase of administrationCustomization and…
Ease of…
Online training, forums…
Support: professionalism
Product knowledge
Responsiveness
Continuity of personnel
Time to resolve problems
Consult: professionalism
Product knowledge
Experience
Continuity
Value
IntegrityRecommend
Microsoft
Microsoft 2016 Microsoft 2017 Overall Sample

2017 Wisdom of Crowds® Business Intelligence Market Study
http://www.dresneradvisory.com Copyright 2017 – Dresner Advisory Services, LLC
129
MicroStrategy Detailed Score
Figure 105 – MicroStrategy detailed score
MicroStrategy’s overall score improves in 2017, and it is now a contender in the
Customer Experience Model and a Value Leader in the Vendor Credibility Model. It
shows key improvements across most categories of measurement including sales,
value, product, technical support, consulting services, integrity, and recommend.
0.0
0.5
1.0
1.5
2.0
2.5
3.0
3.5
4.0
4.5
5.0Sales: professionalism
Product knowledgeUnderstanding our…
Responsiveness
Flexibility/accommodation
Business practices
Contractual terms and…
Follow up after the sale
Value
Product: robustness/…
Completeness of…
Reliability of technology
Scalability
Integration of…
Integration with third-…Overall usability
Ease of installationEase of administrationCustomization and…
Ease of…
Online training, forums…
Support: professionalism
Product knowledge
Responsiveness
Continuity of personnel
Time to resolve problems
Consult: professionalism
Product knowledge
Experience
Continuity
Value
IntegrityRecommend
MicroStrategy
MicroStrategy 2016 MicroStrategy 2017 Overall Sample

2017 Wisdom of Crowds® Business Intelligence Market Study
http://www.dresneradvisory.com Copyright 2017 – Dresner Advisory Services, LLC
130
OpenText Detailed Score
Figure 106 – OpenText detailed score
For 2017, OpenText has across-the-board improvements and is a contender in the
Customer Experience Model and a Value Leader in the Vendor Credibility Model. It
shows increased scores for all categories of measurement including sales, value,
product, technical support, consulting services, integrity, and recommend.
0.0
0.5
1.0
1.5
2.0
2.5
3.0
3.5
4.0
4.5
5.0Sales: professionalism
Product knowledgeUnderstanding our…
Responsiveness
Flexibility/accommodation
Business practices
Contractual terms and…
Follow up after the sale
Value
Product: robustness/…
Completeness of…
Reliability of technology
Scalability
Integration of…
Integration with third-…Overall usability
Ease of installationEase of administrationCustomization and…
Ease of…
Online training, forums…
Support: professionalism
Product knowledge
Responsiveness
Continuity of personnel
Time to resolve problems
Consult: professionalism
Product knowledge
Experience
Continuity
Value
IntegrityRecommend
OpenText
OpenText 2016 OpenText 2017 Overall Sample

2017 Wisdom of Crowds® Business Intelligence Market Study
http://www.dresneradvisory.com Copyright 2017 – Dresner Advisory Services, LLC
131
Oracle Detailed Score
Figure 107 – Oracle detailed score
Although generally below the overall sample, Oracle’s scores improved in 2017 with key
improvements in most categories of measurement including sales, product, technical
support, consulting services, integrity, and recommend.
0.0
0.5
1.0
1.5
2.0
2.5
3.0
3.5
4.0
4.5
5.0Sales: professionalism
Product knowledgeUnderstanding our…
Responsiveness
Flexibility/accommodation
Business practices
Contractual terms and…
Follow up after the sale
Value
Product: robustness/…
Completeness of…
Reliability of technology
Scalability
Integration of…
Integration with third-…Overall usability
Ease of installationEase of administrationCustomization and…
Ease of…
Online training, forums…
Support: professionalism
Product knowledge
Responsiveness
Continuity of personnel
Time to resolve problems
Consult: professionalism
Product knowledge
Experience
Continuity
Value
IntegrityRecommend
Oracle
Oracle 2016 Oracle 2017 Overall Sample

2017 Wisdom of Crowds® Business Intelligence Market Study
http://www.dresneradvisory.com Copyright 2017 – Dresner Advisory Services, LLC
132
Pyramid Analytics Detailed Score
Figure 108 – Pyramid Analytics detailed score
With scores consistently above the overall sample, Pyramid Analytics is an overall
leader in both Customer Experience and Vendor Credibility models. For 2017, it shows
key improvements compared to 2016 in virtually every category of measurement
including sales, value, product, technical support, consulting and integrity. It is best in
class for sales business practices, product completeness, technical support product
knowledge, responsiveness, continuity of personnel, time to resolve problems, and
integrity. It maintains a perfect recommend score.
0.0
0.5
1.0
1.5
2.0
2.5
3.0
3.5
4.0
4.5
5.0Sales: professionalism
Product knowledgeUnderstanding our…
Responsiveness
Flexibility/accommodation
Business practices
Contractual terms and…
Follow up after the sale
Value
Product: robustness/…
Completeness of…
Reliability of technology
Scalability
Integration of…
Integration with third-…Overall usability
Ease of installationEase of administrationCustomization and…
Ease of…
Online training, forums…
Support: professionalism
Product knowledge
Responsiveness
Continuity of personnel
Time to resolve problems
Consult: professionalism
Product knowledge
Experience
Continuity
Value
IntegrityRecommend
Pyramid Analytics
Pyramid Analytics 2016 Pyramid Analytics 2017 Overall Sample

2017 Wisdom of Crowds® Business Intelligence Market Study
http://www.dresneradvisory.com Copyright 2017 – Dresner Advisory Services, LLC
133
Qlik Detailed Score
Figure 109 – Qlik detailed score
Generally in line with or somewhat above the overall sample for virtually all measures,
Qlik is a Technology Leader in the Customer Experience Model and a Value Leader in
the Vendor Credibility Model. It shows improvements for 2017 across most categories of
measurement including sales, value, product, and consulting services.
0.0
0.5
1.0
1.5
2.0
2.5
3.0
3.5
4.0
4.5
5.0Sales: professionalism
Product knowledgeUnderstanding our…
Responsiveness
Flexibility/accommodation
Business practices
Contractual terms and…
Follow up after the sale
Value
Product: robustness/…
Completeness of…
Reliability of technology
Scalability
Integration of…
Integration with third-…Overall usability
Ease of installationEase of administrationCustomization and…
Ease of…
Online training, forums…
Support: professionalism
Product knowledge
Responsiveness
Continuity of personnel
Time to resolve problems
Consult: professionalism
Product knowledge
Experience
Continuity
Value
IntegrityRecommend
Qlik
Qlik 2016 Qlik 2017 Overall Sample

2017 Wisdom of Crowds® Business Intelligence Market Study
http://www.dresneradvisory.com Copyright 2017 – Dresner Advisory Services, LLC
134
Quest Statistica Detailed Score
Figure 110 – Quest Statistica detailed score
With scores generally above or in line with the overall sample, Quest Statistica is a
Technology Leader in the Customer Experience Model and an overall leader in the
Vendor Credibility Model.
0.0
0.5
1.0
1.5
2.0
2.5
3.0
3.5
4.0
4.5
5.0Sales: professionalism
Product knowledgeUnderstanding our…
Responsiveness
Flexibility/accommodation
Business practices
Contractual terms and…
Follow up after the sale
Value
Product: robustness/…
Completeness of…
Reliability of technology
Scalability
Integration of…
Integration with third-…Overall usability
Ease of installationEase of administrationCustomization and…
Ease of…
Online training, forums…
Support: professionalism
Product knowledge
Responsiveness
Continuity of personnel
Time to resolve problems
Consult: professionalism
Product knowledge
Experience
Continuity
Value
IntegrityRecommend
Quest Statistica
Quest 2017 Overall Sample

2017 Wisdom of Crowds® Business Intelligence Market Study
http://www.dresneradvisory.com Copyright 2017 – Dresner Advisory Services, LLC
135
RapidMiner Detailed Score
Figure 111 – RapidMiner detailed score
For 2017, RapidMiner shows key improvements versus 2016 and is a Technology
Leader in the Customer Experience Model and an overall leader in the Vendor
Credibility Model. Its scores increased across all categories of measurement including
sales, value, product, technical support, consulting services, integrity, and recommend.
0.0
0.5
1.0
1.5
2.0
2.5
3.0
3.5
4.0
4.5
5.0Sales: professionalism
Product knowledgeUnderstanding our…
Responsiveness
Flexibility/accommodation
Business practices
Contractual terms and…
Follow up after the sale
Value
Product: robustness/…
Completeness of…
Reliability of technology
Scalability
Integration of…
Integration with third-…Overall usability
Ease of installationEase of administrationCustomization and…
Ease of…
Online training, forums…
Support: professionalism
Product knowledge
Responsiveness
Continuity of personnel
Time to resolve problems
Consult: professionalism
Product knowledge
Experience
Continuity
Value
IntegrityRecommend
RapidMiner
RapidMiner 2016 RapidMiner 2017 Overall Sample

2017 Wisdom of Crowds® Business Intelligence Market Study
http://www.dresneradvisory.com Copyright 2017 – Dresner Advisory Services, LLC
136
Salesforce Detailed Score
Figure 112 – Salesforce detailed score
Since last year, Salesforce made great strides and is now an overall leader in the
Customer Experience Model and a Value Leader in the Vendor Credibility Model. It
shows key improvements all categories of measurement including sales, value, product,
technical support, consulting services, integrity, and recommend.
0.0
0.5
1.0
1.5
2.0
2.5
3.0
3.5
4.0
4.5
5.0Sales: professionalism
Product knowledgeUnderstanding our…
Responsiveness
Flexibility/accommodation
Business practices
Contractual terms and…
Follow up after the sale
Value
Product: robustness/…
Completeness of…
Reliability of technology
Scalability
Integration of…
Integration with third-…Overall usability
Ease of installationEase of administrationCustomization and…
Ease of…
Online training, forums…
Support: professionalism
Product knowledge
Responsiveness
Continuity of personnel
Time to resolve problems
Consult: professionalism
Product knowledge
Experience
Continuity
Value
IntegrityRecommend
Salesforce
Salesforce 2016 Salesforce 2017 Overall Sample

2017 Wisdom of Crowds® Business Intelligence Market Study
http://www.dresneradvisory.com Copyright 2017 – Dresner Advisory Services, LLC
137
SAP Detailed Score
Figure 113 – SAP detailed score
Although consistently below the overall sample, SAP shows ongoing and significant
improvements in most categories of measurement including sales, technical support,
consulting, and integrity.
0.0
0.5
1.0
1.5
2.0
2.5
3.0
3.5
4.0
4.5
5.0Sales: professionalism
Product knowledgeUnderstanding our…
Responsiveness
Flexibility/accommodation
Business practices
Contractual terms and…
Follow up after the sale
Value
Product: robustness/…
Completeness of…
Reliability of technology
Scalability
Integration of…
Integration with third-…Overall usability
Ease of installationEase of administrationCustomization and…
Ease of…
Online training, forums…
Support: professionalism
Product knowledge
Responsiveness
Continuity of personnel
Time to resolve problems
Consult: professionalism
Product knowledge
Experience
Continuity
Value
IntegrityRecommend
SAP
SAP 2016 SAP 2017 Overall Sample

2017 Wisdom of Crowds® Business Intelligence Market Study
http://www.dresneradvisory.com Copyright 2017 – Dresner Advisory Services, LLC
138
SiSense Detailed Score
Figure 114 – Sisense detailed score
With scores consistently above the overall sample, Sisense is an overall leader for both
Customer Experience and Vendor Credibility models. Its overall score rises again in
2017 with key improvements across virtually all categories of measurement including
sales, product, technical support, and consulting services. It is best in class for sales
responsiveness, follow up after the sale, product ease of installation, ease of
administration, technical support professionalism, consulting professionalism, product
knowledge, and continuity. It has a perfect recommend score.
0.0
0.5
1.0
1.5
2.0
2.5
3.0
3.5
4.0
4.5
5.0Sales: professionalism
Product knowledgeUnderstanding our…
Responsiveness
Flexibility/accommodation
Business practices
Contractual terms and…
Follow up after the sale
Value
Product: robustness/…
Completeness of…
Reliability of technology
Scalability
Integration of…
Integration with third-…Overall usability
Ease of installationEase of administrationCustomization and…
Ease of…
Online training, forums…
Support: professionalism
Product knowledge
Responsiveness
Continuity of personnel
Time to resolve problems
Consult: professionalism
Product knowledge
Experience
Continuity
Value
IntegrityRecommend
Sisense
Sisense 2016 Sisense 2017 Overall Sample

2017 Wisdom of Crowds® Business Intelligence Market Study
http://www.dresneradvisory.com Copyright 2017 – Dresner Advisory Services, LLC
139
Tableau Software Detailed Score
Figure 115 – Tableau Software detailed score
With scores generally above or in line with the overall sample, Tableau Software is a
Technology Leader in the Customer Experience Model and a Value Leader in the
Vendor Credibility Model. For 2017, it shows improvements in sales contractual terms
and conditions, integration of components within product, customization and
extensibility, ease of upgrade/migration to new versions, online training, forums and
documentation, consulting professionalism, and product knowledge.
0.0
0.5
1.0
1.5
2.0
2.5
3.0
3.5
4.0
4.5
5.0Sales: professionalism
Product knowledgeUnderstanding our…
Responsiveness
Flexibility/accommodation
Business practices
Contractual terms and…
Follow up after the sale
Value
Product: robustness/…
Completeness of…
Reliability of technology
Scalability
Integration of…
Integration with third-…Overall usability
Ease of installationEase of administrationCustomization and…
Ease of…
Online training, forums…
Support: professionalism
Product knowledge
Responsiveness
Continuity of personnel
Time to resolve problems
Consult: professionalism
Product knowledge
Experience
Continuity
Value
IntegrityRecommend
Tableau Software
Tableau 2016 Tableau 2017 Overall Sample

2017 Wisdom of Crowds® Business Intelligence Market Study
http://www.dresneradvisory.com Copyright 2017 – Dresner Advisory Services, LLC
140
TIBCO Software Detailed Score
Figure 116 – TIBCO Software detailed score
With scores consistently above the overall sample, TIBCO Software is an overall leader
in the Customer Experience Model and a Value Leader in the Vendor Credibility Model.
For 2017, TIBCO shows improvements in sales contractual terms and conditions,
technical support professionalism, product knowledge, continuity of personnel,
consulting product knowledge, experience, continuity, and value.
0.0
0.5
1.0
1.5
2.0
2.5
3.0
3.5
4.0
4.5
5.0Sales: professionalism
Product knowledgeUnderstanding our…
Responsiveness
Flexibility/accommodation
Business practices
Contractual terms and…
Follow up after the sale
Value
Product: robustness/…
Completeness of…
Reliability of technology
Scalability
Integration of…
Integration with third-…Overall usability
Ease of installationEase of administrationCustomization and…
Ease of…
Online training, forums…
Support: professionalism
Product knowledge
Responsiveness
Continuity of personnel
Time to resolve problems
Consult: professionalism
Product knowledge
Experience
Continuity
Value
IntegrityRecommend
TIBCO Software
TIBCO 2016 TIBCO 2017 Overall Sample

2017 Wisdom of Crowds® Business Intelligence Market Study
http://www.dresneradvisory.com Copyright 2017 – Dresner Advisory Services, LLC
141
Yellowfin Detailed Score
Figure 117 – Yellowfin detailed score
For 2017, Yellowfin is an overall leader in both the Customer Experience and Vendor
Credibility models. It shows key improvements across most categories of measurement
including sales, value, product, technical support, consulting services, integrity, and
recommend. It was best in class for value and has a perfect recommend score.
0.0
0.5
1.0
1.5
2.0
2.5
3.0
3.5
4.0
4.5
5.0Sales: professionalism
Product knowledgeUnderstanding our…
Responsiveness
Flexibility/accommodation
Business practices
Contractual terms and…
Follow up after the sale
Value
Product: robustness/…
Completeness of…
Reliability of technology
Scalability
Integration of…
Integration with third-…Overall usability
Ease of installationEase of administrationCustomization and…
Ease of…
Online training, forums…
Support: professionalism
Product knowledge
Responsiveness
Continuity of personnel
Time to resolve problems
Consult: professionalism
Product knowledge
Experience
Continuity
Value
IntegrityRecommend
Yellowfin
Yellowfin 2016 Yellowfin 2017 Overall Sample

2017 Wisdom of Crowds® Business Intelligence Market Study
http://www.dresneradvisory.com Copyright 2017 – Dresner Advisory Services, LLC
142
Zoomdata Detailed Score
Figure 118 - Zoomdata detailed score
In its first year appearing in this report, Zoomdata shows scores above the overall
sample for every measure in all categories. It is an overall leader in both the Customer
Experience and Vendor Credibility models and has a perfect recommend score.
0.0
0.5
1.0
1.5
2.0
2.5
3.0
3.5
4.0
4.5
5.0Sales: professionalism
Product knowledgeUnderstanding our…
Responsiveness
Flexibility/accommodation
Business practices
Contractual terms and…
Follow up after the sale
Value
Product: robustness/…
Completeness of…
Reliability of technology
Scalability
Integration of…
Integration with third-…Overall usability
Ease of installationEase of administrationCustomization and…
Ease of…
Online training, forums…
Support: professionalism
Product knowledge
Responsiveness
Continuity of personnel
Time to resolve problems
Consult: professionalism
Product knowledge
Experience
Continuity
Value
IntegrityRecommend
Zoomdata
Zoomdata 2017 Overall Sample

2017 Wisdom of Crowds® Business Intelligence Market Study
http://www.dresneradvisory.com Copyright 2017 – Dresner Advisory Services, LLC
143
Other Dresner Advisory Services Research Reports
- Advanced and Predictive Analytics
- Analytical Data Infrastructure
- Big Data Analytics
- Business Intelligence Competency Center
- Cloud Computing and Business Intelligence
- Collective Insights®
- End User Data Preparation
- Enterprise Planning
- IoT IntelligenceTM
- Location Intelligence
- Natural Language Analytics
- Small and Mid-Sized Enterprise Business Intelligence

2017 Wisdom of Crowds® Business Intelligence Market Study
http://www.dresneradvisory.com Copyright 2017 – Dresner Advisory Services, LLC
144
Dresner Advisory Services - 2017 Wisdom of Crowds Survey Instrument
Please enter your contact information below
First Name*: _________________________________________________
Last Name*: _________________________________________________
Title: _________________________________________________
Company Name*: _________________________________________________
Street Address: _________________________________________________
City: _________________________________________________
State: _________________________________________________
Zip: _________________________________________________
Country: _________________________________________________
Email Address*: _________________________________________________
Phone Number: _________________________________________________
URL: _________________________________________________
May we contact you to discuss your responses and for additional information?
( ) Yes
( ) No
3) What major geography do you reside in?*
( ) North America
( ) Europe, Middle East and Africa
( ) Latin America
( ) Asia Pacific
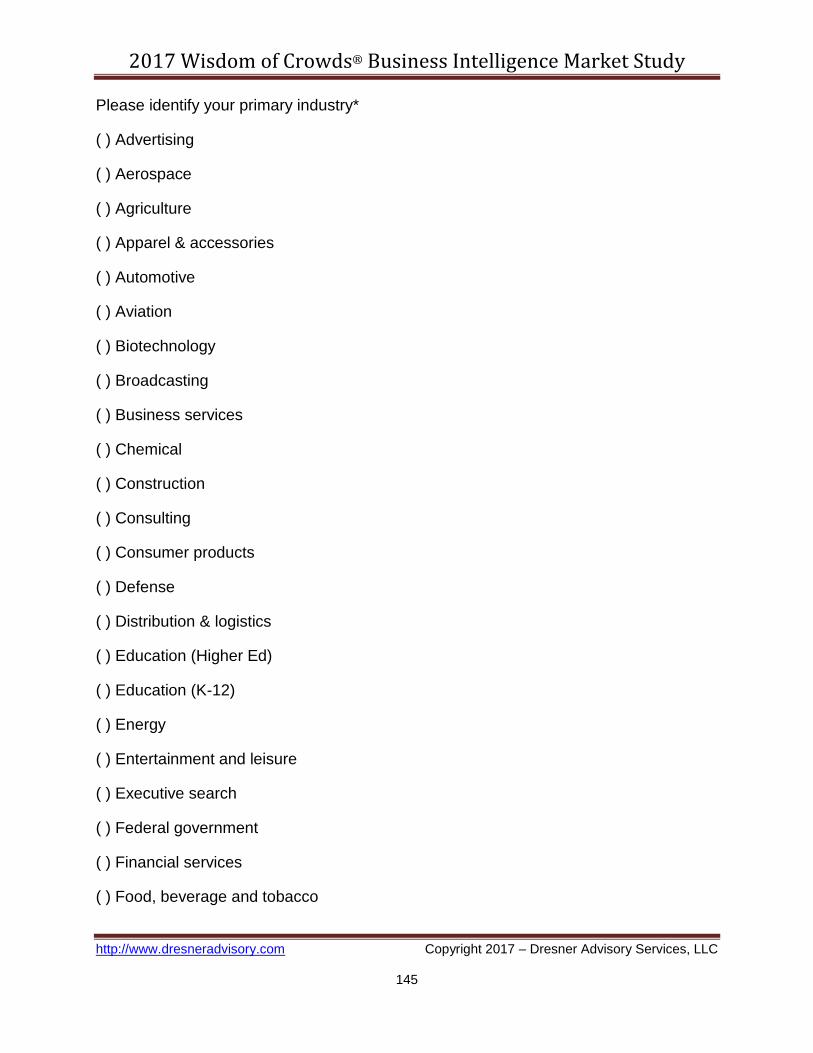
2017 Wisdom of Crowds® Business Intelligence Market Study
http://www.dresneradvisory.com Copyright 2017 – Dresner Advisory Services, LLC
145
Please identify your primary industry*
( ) Advertising
( ) Aerospace
( ) Agriculture
( ) Apparel & accessories
( ) Automotive
( ) Aviation
( ) Biotechnology
( ) Broadcasting
( ) Business services
( ) Chemical
( ) Construction
( ) Consulting
( ) Consumer products
( ) Defense
( ) Distribution & logistics
( ) Education (Higher Ed)
( ) Education (K-12)
( ) Energy
( ) Entertainment and leisure
( ) Executive search
( ) Federal government
( ) Financial services
( ) Food, beverage and tobacco

2017 Wisdom of Crowds® Business Intelligence Market Study
http://www.dresneradvisory.com Copyright 2017 – Dresner Advisory Services, LLC
146
( ) Healthcare
( ) Hospitality
( ) Insurance
( ) Legal
( ) Manufacturing
( ) Mining
( ) Motion picture and video
( ) Not for profit
( ) Pharmaceuticals
( ) Publishing
( ) Real estate
( ) Retail and wholesale
( ) Sports
( ) State and local government
( ) Technology
( ) Telecommunications
( ) Transportation
( ) Utilities
( ) Other - Please specify below
Please type in your industry
_________________________________________________
How many employees does your company employ worldwide?

2017 Wisdom of Crowds® Business Intelligence Market Study
http://www.dresneradvisory.com Copyright 2017 – Dresner Advisory Services, LLC
147
( ) 1-100
( ) 101-1,000
( ) 1,001-2,000
( ) 2,001-5,000
( ) 5,001-10,000
( ) More than 10,000
What function do you report into?*
( ) Business Intelligence Competency Center
( ) Executive management
( ) Faculty (Education)
( ) Finance
( ) Human resources
( ) Information Technology (IT)
( ) Manufacturing
( ) Marketing
( ) Medical staff (Healthcare)
( ) Operations
( ) Research and development (R&D)
( ) Sales
( ) Strategic planning function
( ) Supply chain
( ) Other - Write In

2017 Wisdom of Crowds® Business Intelligence Market Study
http://www.dresneradvisory.com Copyright 2017 – Dresner Advisory Services, LLC
148
Please specify the function that you report to:
_________________________________________________
Does your organization have a Chief Data Officer or Chief Analytics Officer in place?
For
less
than
1
year
1 -3
years
3 - 5
years
More
than
5
years
Don't
have
one
Chief
Data
Officer
( ) ( ) ( ) ( ) ( )
Chief
Analytics
Officer
( ) ( ) ( ) ( ) ( )
To what function do these CDO or CAO roles report?
CEO CFO CMO CIO Other
Not
Applicable
Chief
Data
Officer
( ) ( ) ( ) ( ) ( ) ( )
Chief
Analytics
Officer
( ) ( ) ( ) ( ) ( ) ( )

2017 Wisdom of Crowds® Business Intelligence Market Study
http://www.dresneradvisory.com Copyright 2017 – Dresner Advisory Services, LLC
149
How much impact has the Chief Data Officer had within your organization?
0 ________________________[__]_____________________________ 100
How much impact has the Chief Analytics Officer had within your organization?
0 ________________________[__]_____________________________ 100
Please respond to the following statement: "My organization considers our Business
Intelligence initiatives a success."
( ) Completely agree
( ) Agree somewhat
( ) Disagree somewhat
( ) Disagree
What has been the key to your success with Business Intelligence?
____________________________________________
____________________________________________
____________________________________________
____________________________________________

2017 Wisdom of Crowds® Business Intelligence Market Study
http://www.dresneradvisory.com Copyright 2017 – Dresner Advisory Services, LLC
150
How do you determine BI success?
[ ] Return on investment (ROI) model
[ ] User feedback/satisfaction
[ ] Customer feedback/satisfaction
[ ] Numbers of deployed users
[ ] System/application activity
[ ] Other - Write In: _________________________________________________
[ ] Other - Write In: _________________________________________________
What have been the obstacles to success with Business Intelligence?
____________________________________________
____________________________________________
____________________________________________
____________________________________________
How do you measure failure with BI?
[ ] User feedback
[ ] Cost/Return on investment
[ ] Limited adoption
[ ] Lack of usage
[ ] Other - Write In: _________________________________________________
[ ] Other - Write In: _________________________________________________

2017 Wisdom of Crowds® Business Intelligence Market Study
http://www.dresneradvisory.com Copyright 2017 – Dresner Advisory Services, LLC
151
This year our budget for Business Intelligence / analytics is:
( ) Increasing over last year
( ) Decreasing over last year
( ) Staying the same as last year
Percentage of BI/analytics budget spent on new software purchases
0 ________________________[__]_____________________________ 100
Percentage of BI/analytics budget spent on software maintenance
0 ________________________[__]_____________________________ 100
Percentage of BI/analytics budget spent on software subscription services
0 ________________________[__]_____________________________ 100
Percentage of BI/analytics budget spent on external consulting services
0 ________________________[__]_____________________________ 100

2017 Wisdom of Crowds® Business Intelligence Market Study
http://www.dresneradvisory.com Copyright 2017 – Dresner Advisory Services, LLC
152
Which function drives your Business Intelligence initiatives?
Always Often Sometimes Rarely Never
Operations ( ) ( ) ( ) ( ) ( )
Competency
Center/Center
of Excellence
( ) ( ) ( ) ( ) ( )
Sales ( ) ( ) ( ) ( ) ( )
Finance ( ) ( ) ( ) ( ) ( )
Research and
Development
(R&D)
( ) ( ) ( ) ( ) ( )
Information
Technology
(IT)
( ) ( ) ( ) ( ) ( )
Human
Resources
( ) ( ) ( ) ( ) ( )
Supply chain ( ) ( ) ( ) ( ) ( )
Executive
management
( ) ( ) ( ) ( ) ( )
Marketing ( ) ( ) ( ) ( ) ( )
Manufacturing ( ) ( ) ( ) ( ) ( )
Strategic
planning
function
( ) ( ) ( ) ( ) ( )

2017 Wisdom of Crowds® Business Intelligence Market Study
http://www.dresneradvisory.com Copyright 2017 – Dresner Advisory Services, LLC
153
What does your organization expect to achieve with Business Intelligence?
Critical
Very
important Important
Somewhat
important Unimportant
Better
decision-
making
( ) ( ) ( ) ( ) ( )
Growth in
revenues
( ) ( ) ( ) ( ) ( )
Improved
operational
efficiencies
( ) ( ) ( ) ( ) ( )
Enhanced
customer
service
( ) ( ) ( ) ( ) ( )
Increased
competitive
advantage
( ) ( ) ( ) ( ) ( )

2017 Wisdom of Crowds® Business Intelligence Market Study
http://www.dresneradvisory.com Copyright 2017 – Dresner Advisory Services, LLC
154
Who are the targeted consumers of Business Intelligence within your organization?
Primary Secondary
Not
targeted
Executives ( ) ( ) ( )
Middle
managers
( ) ( ) ( )
Line
managers
( ) ( ) ( )
Individual
contributors
and
professionals
( ) ( ) ( )
Customers ( ) ( ) ( )
Suppliers ( ) ( ) ( )
What percentage of all employees have access to Business Intelligence solutions?
Under
10%
11 -
20%
21 -
40%
41 -
60%
61 -
80%
81%
or
more
Today ( ) ( ) ( ) ( ) ( ) ( )
In 12
months
( ) ( ) ( ) ( ) ( ) ( )
In 24
months
( ) ( ) ( ) ( ) ( ) ( )
In 36
months
( ) ( ) ( ) ( ) ( ) ( )

2017 Wisdom of Crowds® Business Intelligence Market Study
http://www.dresneradvisory.com Copyright 2017 – Dresner Advisory Services, LLC
155
Please choose one of the following to describe the state of data governance in your
organization.
( ) Data as "truth" - A common view of enterprise data is available with common
application of data, filters, rules, and semantics
( ) A common view of enterprise data is available. However, parochial views and
semantics are used to support specific positions
( ) Consistent data is available at a departmental level. Conflicting, functional views of
data causes confusion and disagreement
( ) We have multiple, inconsistent data sources with conflicting semantics and data.
Information is generally unreliable and distrusted
How do people in your organization take advantage of insights learned from Business
Intelligence solutions?
( ) “Closed loop” - Information is shared, teams work to process it and act in a timely
fashion. No formal boundaries
( ) Ad hoc (informal) action on insights across functions
( ) Uncoordinated/ parochial action (sometimes at the expense of others)
( ) Insights are rarely leveraged

2017 Wisdom of Crowds® Business Intelligence Market Study
http://www.dresneradvisory.com Copyright 2017 – Dresner Advisory Services, LLC
156
Please indicate the importance of the following technologies to your Business
Intelligence strategy and plans.
Critical
Very
important Important
Somewhat
important
Not
important
Ability to
write to
transactional
applications
( ) ( ) ( ) ( ) ( )
Advanced
visualization
( ) ( ) ( ) ( ) ( )
Big Data
(e.g.,
Hadoop)
( ) ( ) ( ) ( ) ( )
Cognitive BI
(e.g.,
Artificial
Intelligence-
based BI)
( ) ( ) ( ) ( ) ( )
Collaborative
support for
group-based
analysis
( ) ( ) ( ) ( ) ( )
Complex
event
processing
(CEP)
( ) ( ) ( ) ( ) ( )
Dashboards ( ) ( ) ( ) ( ) ( )
Data catalog ( ) ( ) ( ) ( ) ( )
Data
discovery
( ) ( ) ( ) ( ) ( )
Data mining, ( ) ( ) ( ) ( ) ( )

2017 Wisdom of Crowds® Business Intelligence Market Study
http://www.dresneradvisory.com Copyright 2017 – Dresner Advisory Services, LLC
157
advanced
algorithms,
predictive
Data
storytelling
( ) ( ) ( ) ( ) ( )
Data
warehousing
( ) ( ) ( ) ( ) ( )
Edge
computing
( ) ( ) ( ) ( ) ( )
Embedded
BI
(contained
within an
application,
portal, etc.)
( ) ( ) ( ) ( ) ( )
End-user
"self-service"
( ) ( ) ( ) ( ) ( )
End-user
data
preparation
and blending
( ) ( ) ( ) ( ) ( )
Enterprise
planning /
budgeting
( ) ( ) ( ) ( ) ( )
Governance ( ) ( ) ( ) ( ) ( )
In-memory
analysis
( ) ( ) ( ) ( ) ( )
Integration
with
operational
processes
( ) ( ) ( ) ( ) ( )

2017 Wisdom of Crowds® Business Intelligence Market Study
http://www.dresneradvisory.com Copyright 2017 – Dresner Advisory Services, LLC
158
Internet of
Things (IoT)
( ) ( ) ( ) ( ) ( )
Location
intelligence /
analytics
( ) ( ) ( ) ( ) ( )
Mobile
device
support
( ) ( ) ( ) ( ) ( )
Natural
language
analytics
(natural
language
query/
natural
language
generation)
( ) ( ) ( ) ( ) ( )
Open source
software
( ) ( ) ( ) ( ) ( )
Prepackaged
vertical /
functional
analytical
applications
( ) ( ) ( ) ( ) ( )
Reporting ( ) ( ) ( ) ( ) ( )
Search-based
interface
( ) ( ) ( ) ( ) ( )
Social media
analysis
(Social BI)
( ) ( ) ( ) ( ) ( )
Software-as-
a-Service
and cloud
computing
( ) ( ) ( ) ( ) ( )
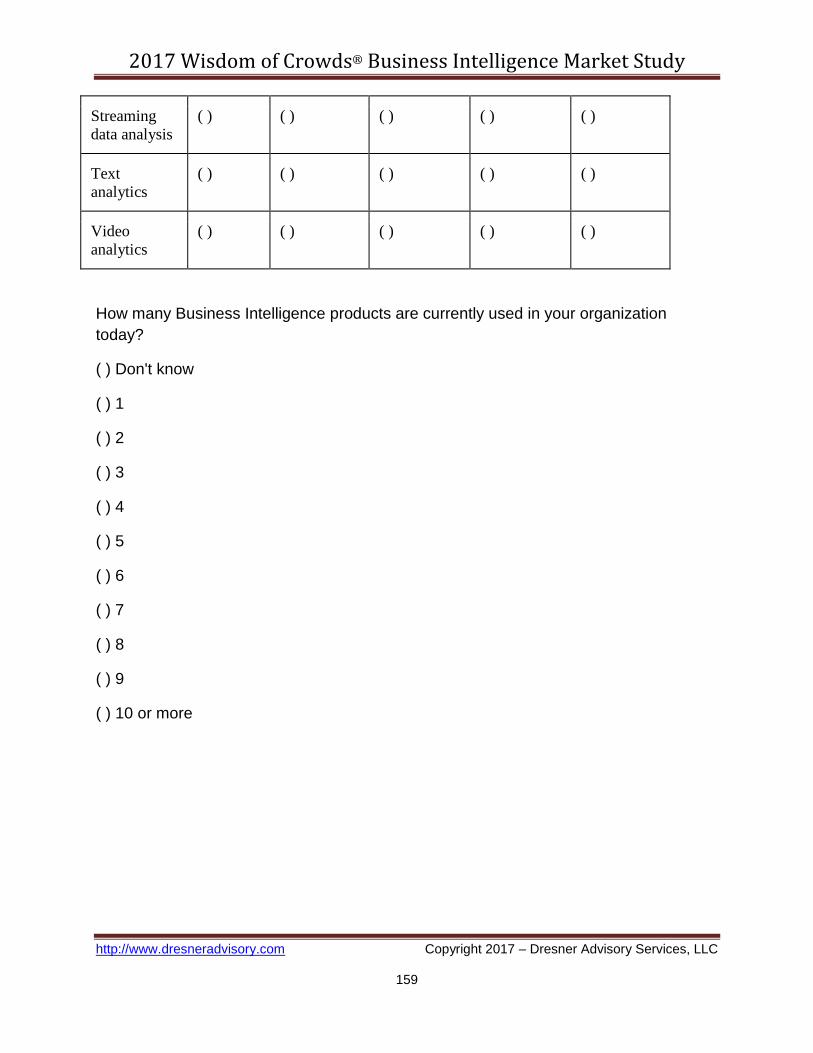
2017 Wisdom of Crowds® Business Intelligence Market Study
http://www.dresneradvisory.com Copyright 2017 – Dresner Advisory Services, LLC
159
Streaming
data analysis
( ) ( ) ( ) ( ) ( )
Text
analytics
( ) ( ) ( ) ( ) ( )
Video
analytics
( ) ( ) ( ) ( ) ( )
How many Business Intelligence products are currently used in your organization
today?
( ) Don't know
( ) 1
( ) 2
( ) 3
( ) 4
( ) 5
( ) 6
( ) 7
( ) 8
( ) 9
( ) 10 or more

2017 Wisdom of Crowds® Business Intelligence Market Study
http://www.dresneradvisory.com Copyright 2017 – Dresner Advisory Services, LLC
160
Please select one vendor to rate
( ) 1010data
( ) Adaptive Insights
( ) ADVIZOR Solutions
( ) Alpine Data Labs
( ) Alteryx
( ) Amazon (i.e., QuickSight)
( ) AnswerRocket
( ) arcplan (Longview)
( ) BIME (Zendesk)
( ) Birst
( ) Board
( ) ClearStory Data
( ) Cubeware
( ) Datameer
( ) DataRPM
( ) Datawatch (Panopticon)
( ) Dimensional Insight
( ) Domo
( ) Dundas
( ) FICO
( ) GoodData
( ) Google Analytics
( ) IBM

2017 Wisdom of Crowds® Business Intelligence Market Study
http://www.dresneradvisory.com Copyright 2017 – Dresner Advisory Services, LLC
161
( ) iDashboards
( ) InetSoft
( ) Infor (Lawson)
( ) Information Builders (IBI)
( ) Izenda
( ) Jedox
( ) Jinfonet/JReport
( ) Klipfolio
( ) KNIME
( ) Lavastorm
( ) Logi Analytics
( ) Looker
( ) Microsoft
( ) MicroStrategy
( ) Narrative Science
( ) OpenText (Actuate)
( ) Oracle
( ) Panorama
( ) Pentaho
( ) Phocas
( ) Predixion Software
( ) Pyramid Analytics
( ) Qlik
( ) RapidMiner

2017 Wisdom of Crowds® Business Intelligence Market Study
http://www.dresneradvisory.com Copyright 2017 – Dresner Advisory Services, LLC
162
( ) Salesforce.com
( ) SAP
( ) SAS Institute
( ) Sisense
( ) Solver
( ) Statistica
( ) Tableau
( ) TARGIT
( ) ThoughtSpot
( ) TIBCO
( ) Yellowfin
( ) Yseop
( ) Zoomdata
( ) Other - Write In: _________________________________________________
Please specify the product name and version for the selected vendor
_________________________________________________
How long has this product been in use in your organization?
( ) Less than 1 year
( ) 1 - 2 years
( ) 3 - 5 years
( ) 6 - 10 years
( ) More than 10 years

2017 Wisdom of Crowds® Business Intelligence Market Study
http://www.dresneradvisory.com Copyright 2017 – Dresner Advisory Services, LLC
163
How many users currently use this product?
( ) 1-10
( ) 11-50
( ) 51-100
( ) 101-200
( ) 201-500
( ) More than 500
How would you characterize the sales/acquisition experience with this vendor?
Excellent
Very
good Adequate Poor
Very
poor
Don't
know
Professionalism ( ) ( ) ( ) ( ) ( ) ( )
Product knowledge ( ) ( ) ( ) ( ) ( ) ( )
Understanding our
business needs
( ) ( ) ( ) ( ) ( ) ( )
Responsiveness ( ) ( ) ( ) ( ) ( ) ( )
Flexibility/accommodation ( ) ( ) ( ) ( ) ( ) ( )
Business practices ( ) ( ) ( ) ( ) ( ) ( )
Contractual terms and
conditions
( ) ( ) ( ) ( ) ( ) ( )
Follow up after the sale ( ) ( ) ( ) ( ) ( ) ( )

2017 Wisdom of Crowds® Business Intelligence Market Study
http://www.dresneradvisory.com Copyright 2017 – Dresner Advisory Services, LLC
164
How would you characterize the value for the price paid?
( ) Great value (well exceeded expectations)
( ) Good value (somewhat exceeded expectations)
( ) Average value (met expectations)
( ) Poor value (fell short of expectations)
( ) Very poor value (fell far short of expectations)

2017 Wisdom of Crowds® Business Intelligence Market Study
http://www.dresneradvisory.com Copyright 2017 – Dresner Advisory Services, LLC
165
How would you characterize the quality and usefulness of the product?
Excellent
Very
good Adequate Poor
Very
poor
Don't
know
Robustness/sophistication
of technology
( ) ( ) ( ) ( ) ( ) ( )
Completeness of
functionality
( ) ( ) ( ) ( ) ( ) ( )
Reliability of technology ( ) ( ) ( ) ( ) ( ) ( )
Scalability ( ) ( ) ( ) ( ) ( ) ( )
Integration of
components within
product
( ) ( ) ( ) ( ) ( ) ( )
Integration with third-
party technologies
( ) ( ) ( ) ( ) ( ) ( )
Overall usability ( ) ( ) ( ) ( ) ( ) ( )
Ease of installation ( ) ( ) ( ) ( ) ( ) ( )
Ease of administration ( ) ( ) ( ) ( ) ( ) ( )
Customization and
extensibility
( ) ( ) ( ) ( ) ( ) ( )
Ease of
upgrade/migration to new
versions
( ) ( ) ( ) ( ) ( ) ( )
Online training, forums
and documentation
( ) ( ) ( ) ( ) ( ) ( )

2017 Wisdom of Crowds® Business Intelligence Market Study
http://www.dresneradvisory.com Copyright 2017 – Dresner Advisory Services, LLC
166
How would you characterize the vendor's technical support?
Excellent
Very
good Adequate Poor
Very
poor
Don't
know
Professionalism ( ) ( ) ( ) ( ) ( ) ( )
Product
knowledge
( ) ( ) ( ) ( ) ( ) ( )
Responsiveness ( ) ( ) ( ) ( ) ( ) ( )
Continuity of
personnel
( ) ( ) ( ) ( ) ( ) ( )
Time to resolve
problems
( ) ( ) ( ) ( ) ( ) ( )
How would you characterize the vendor's consulting services?
Excellent
Very
good Adequate Poor
Very
poor
Don't
know
Professionalism ( ) ( ) ( ) ( ) ( ) ( )
Product
knowledge
( ) ( ) ( ) ( ) ( ) ( )
Responsiveness ( ) ( ) ( ) ( ) ( ) ( )
Continuity of
personnel
( ) ( ) ( ) ( ) ( ) ( )
Time to resolve
problems
( ) ( ) ( ) ( ) ( ) ( )

2017 Wisdom of Crowds® Business Intelligence Market Study
http://www.dresneradvisory.com Copyright 2017 – Dresner Advisory Services, LLC
167
How would you rate the "integrity" (i.e., truthfulness, honesty) of this BI vendor?
( ) Excellent
( ) Very good
( ) Adequate
( ) Poor
( ) Very poor
( ) Don't know
Did this vendor's overall performance improve, remains the same or decline from last
year?
( ) Improved
( ) Stayed the same
( ) Declined
Would you recommend this vendor/product?
( ) I would recommend this vendor/product
( ) I would NOT recommend this vendor/product
Please enter any additional comments regarding this vendor and/or its products
____________________________________________
____________________________________________
____________________________________________
____________________________________________