week ending june 17, 2017 epidemiology week 24 weekly
TRANSCRIPT

Released June 30, 2017 ISSN 0799-3927
NOTIFICATIONS-
All clinical
sites
INVESTIGATION
REPORTS- Detailed Follow
up for all Class One Events
HOSPITAL ACTIVE
SURVEILLANCE-30
sites*. Actively pursued
SENTINEL
REPORT- 79 sites*.
Automatic reporting
*Incidence/Prevalence cannot be calculated
1
Week ending June 17, 2017 Epidemiology Week 24
WEEKLY EPIDEMIOLOGY BULLETIN NATIONAL EPIDEMIOLOGY UNIT, MINISTRY OF HEALTH, JAMAICA
Weekly Spotlight
EPI WEEK 24
1. Countries have an obligation to develop appropriate, feasible, sustainable public health surveillance systems. Surveillance systems should have a clear purpose and a plan for data collection, analysis, use and dissemination 2. Countries have an obligation to develop appropriate, effective mechanisms to ensure ethical surveillance 3. Surveillance data should be collected only for a legitimate public health purpose. 4. Countries have an obligation to ensure that the data collected are of suffi cient quality, including being timely, reliable and valid, to achieve public health goals. 5. Planning for public health surveillance should be guided by transparent governmental priority-setting.
Downloaded from: http://apps.who.int/iris/bitstream/10665/255721/1/9789241512657-
eng.pdf?ua=1
SYNDROMES
PAGE 2
CLASS 1 DISEASES
PAGE 4
INFLUENZA
PAGE 5
DENGUE FEVER
PAGE 6
GASTROENTERITIS
PAGE 7
RESEARCH PAPER
PAGE 8

Released June 30, 2017 ISSN 0799-3927
NOTIFICATIONS-
All clinical
sites
INVESTIGATION
REPORTS- Detailed Follow
up for all Class One Events
HOSPITAL ACTIVE
SURVEILLANCE-30
sites*. Actively pursued
SENTINEL
REPORT- 79 sites*.
Automatic reporting
*Incidence/Prevalence cannot be calculated
2
REPORTS FOR SYNDROMIC SURVEILLANCE FEVER Temperature of >380C /100.40F (or recent history of fever) with or without an obvious diagnosis or focus of infection.
KEY RED CURRENT WEEK
FEVER AND NEUROLOGICAL Temperature of >380C /100.40F (or recent history of fever) in a previously healthy person with or without headache and vomiting. The person must also have meningeal irritation, convulsions, altered consciousness, altered sensory manifestations or paralysis (except AFP).
FEVER AND HAEMORRHAGIC Temperature of >380C /100.40F (or recent history of fever) in a previously healthy person presenting with at least one haemorrhagic (bleeding) manifestation with or without jaundice.
50
500
1 3 5 7 9 11 13 15 17 19 21 23 25 27 29 31 33 35 37 39 41 43 45 47 49 51
Nu
mb
er
of
Cas
es
Epidemiology Weeks
Fever in under 5y.o. and Total Population 2017 vs Epidemic Thresholds, Epidemiology Week 24
Total Fever (all ages) Cases under 5 y.o.<5y.o. Epi Threshold All Ages Epi Threshold
0
10
20
30
40
50
60
1 3 5 7 9 11 13 15 17 19 21 23 25 27 29 31 33 35 37 39 41 43 45 47 49 51
Nu
mb
er
of
Cas
es
Epidemilogy Weeks
Fever and Neurological Symptoms Weekly Threshold vs Cases 2017, Epidemiology Week 24
2017 Epi threshold
0
2
4
6
8
10
12
14
1 3 5 7 9 11 13 15 17 19 21 23 25 27 29 31 33 35 37 39 41 43 45 47 49 51
Nu
mb
er
of
Cas
es
Epidemiology Weeks
Fever and Haem Weekly Threshold vs Cases 2017, Epidemiology Week 24
Cases 2017 Epi threshold
Released June 30, 2017 ISSN 0799-3927
NOTIFICATIONS-
All clinical
sites
INVESTIGATION
REPORTS- Detailed Follow
up for all Class One Events
HOSPITAL ACTIVE
SURVEILLANCE-30
sites*. Actively pursued
SENTINEL
REPORT- 79 sites*.
Automatic reporting
*Incidence/Prevalence cannot be calculated
3
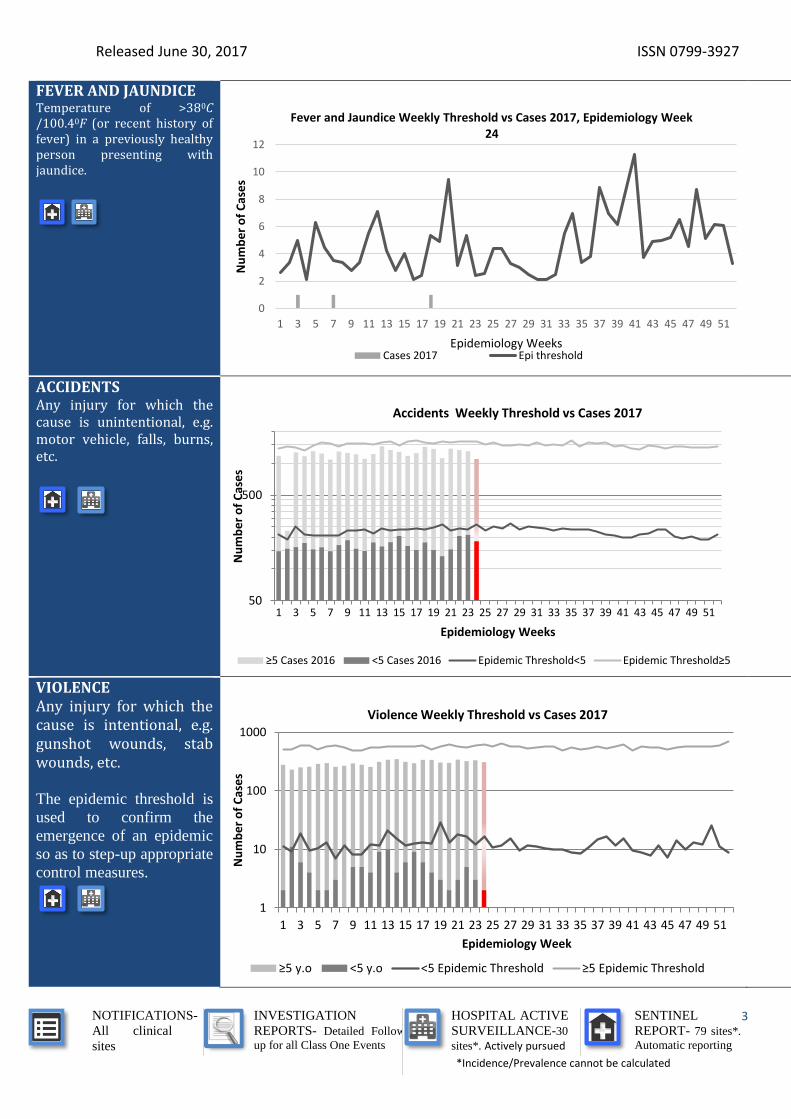
FEVER AND JAUNDICE Temperature of >380C /100.40F (or recent history of fever) in a previously healthy person presenting with jaundice.
ACCIDENTS Any injury for which the cause is unintentional, e.g. motor vehicle, falls, burns, etc.
VIOLENCE Any injury for which the cause is intentional, e.g. gunshot wounds, stab wounds, etc.
The epidemic threshold is
used to confirm the
emergence of an epidemic
so as to step-up appropriate
control measures.
0
2
4
6
8
10
12
1 3 5 7 9 11 13 15 17 19 21 23 25 27 29 31 33 35 37 39 41 43 45 47 49 51
Nu
mb
er
of
Cas
es
Epidemiology Weeks
Fever and Jaundice Weekly Threshold vs Cases 2017, Epidemiology Week 24
Cases 2017 Epi threshold
50
500
1 3 5 7 9 11 13 15 17 19 21 23 25 27 29 31 33 35 37 39 41 43 45 47 49 51
Nu
mb
er
of
Cas
es
Epidemiology Weeks
Accidents Weekly Threshold vs Cases 2017
≥5 Cases 2016 <5 Cases 2016 Epidemic Threshold<5 Epidemic Threshold≥5
1
10
100
1000
1 3 5 7 9 11 13 15 17 19 21 23 25 27 29 31 33 35 37 39 41 43 45 47 49 51
Nu
mb
er
of
Cas
es
Epidemiology Week
Violence Weekly Threshold vs Cases 2017
≥5 y.o <5 y.o <5 Epidemic Threshold ≥5 Epidemic Threshold
Released June 30, 2017 ISSN 0799-3927
NOTIFICATIONS-
All clinical
sites
INVESTIGATION
REPORTS- Detailed Follow
up for all Class One Events
HOSPITAL ACTIVE
SURVEILLANCE-30
sites*. Actively pursued
SENTINEL
REPORT- 79 sites*.
Automatic reporting
*Incidence/Prevalence cannot be calculated
4
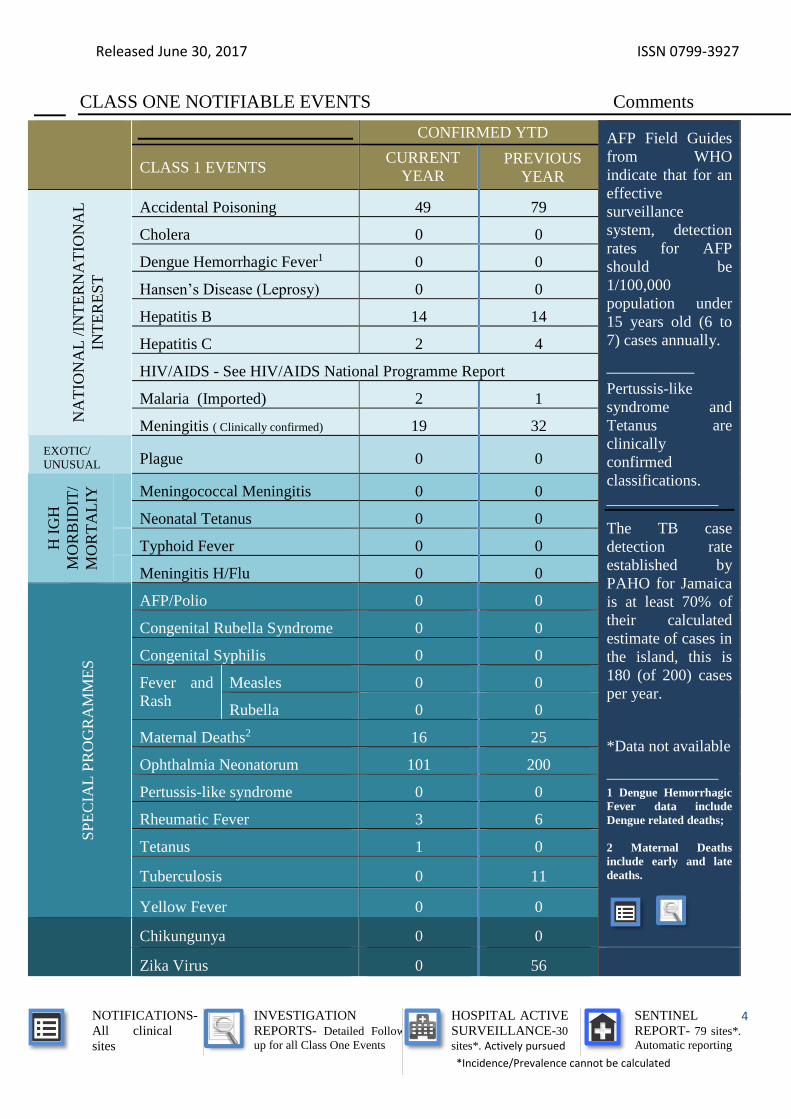
CLASS ONE NOTIFIABLE EVENTS Comments
CONFIRMED YTD AFP Field Guides
from WHO
indicate that for an
effective
surveillance
system, detection
rates for AFP
should be
1/100,000
population under
15 years old (6 to
7) cases annually.
___________
Pertussis-like
syndrome and
Tetanus are
clinically
confirmed
classifications.
______________
The TB case
detection rate
established by
PAHO for Jamaica
is at least 70% of
their calculated
estimate of cases in
the island, this is
180 (of 200) cases
per year.
*Data not available
______________
1 Dengue Hemorrhagic
Fever data include
Dengue related deaths;
2 Maternal Deaths
include early and late
deaths.
CLASS 1 EVENTS CURRENT
YEAR PREVIOUS
YEAR
NA
TIO
NA
L /
INT
ER
NA
TIO
NA
L
INT
ER
ES
T
Accidental Poisoning 49 79
Cholera 0 0
Dengue Hemorrhagic Fever1 0 0
Hansen’s Disease (Leprosy) 0 0
Hepatitis B 14 14
Hepatitis C 2 4
HIV/AIDS - See HIV/AIDS National Programme Report
Malaria (Imported) 2 1
Meningitis ( Clinically confirmed) 19 32
EXOTIC/
UNUSUAL Plague 0 0
H I
GH
MO
RB
IDIT
/
MO
RT
AL
IY
Meningococcal Meningitis 0 0
Neonatal Tetanus 0 0
Typhoid Fever 0 0
Meningitis H/Flu 0 0
SP
EC
IAL
PR
OG
RA
MM
ES
AFP/Polio 0 0
Congenital Rubella Syndrome 0 0
Congenital Syphilis 0 0
Fever and
Rash
Measles 0 0
Rubella 0 0
Maternal Deaths2 16 25
Ophthalmia Neonatorum 101 200
Pertussis-like syndrome 0 0
Rheumatic Fever 3 6
Tetanus 1 0
Tuberculosis 0 11
Yellow Fever 0 0
Chikungunya 0 0
Zika Virus 0 56
Released June 30, 2017 ISSN 0799-3927
NOTIFICATIONS-
All clinical
sites
INVESTIGATION
REPORTS- Detailed Follow
up for all Class One Events
HOSPITAL ACTIVE
SURVEILLANCE-30
sites*. Actively pursued
SENTINEL
REPORT- 79 sites*.
Automatic reporting
*Incidence/Prevalence cannot be calculated
5
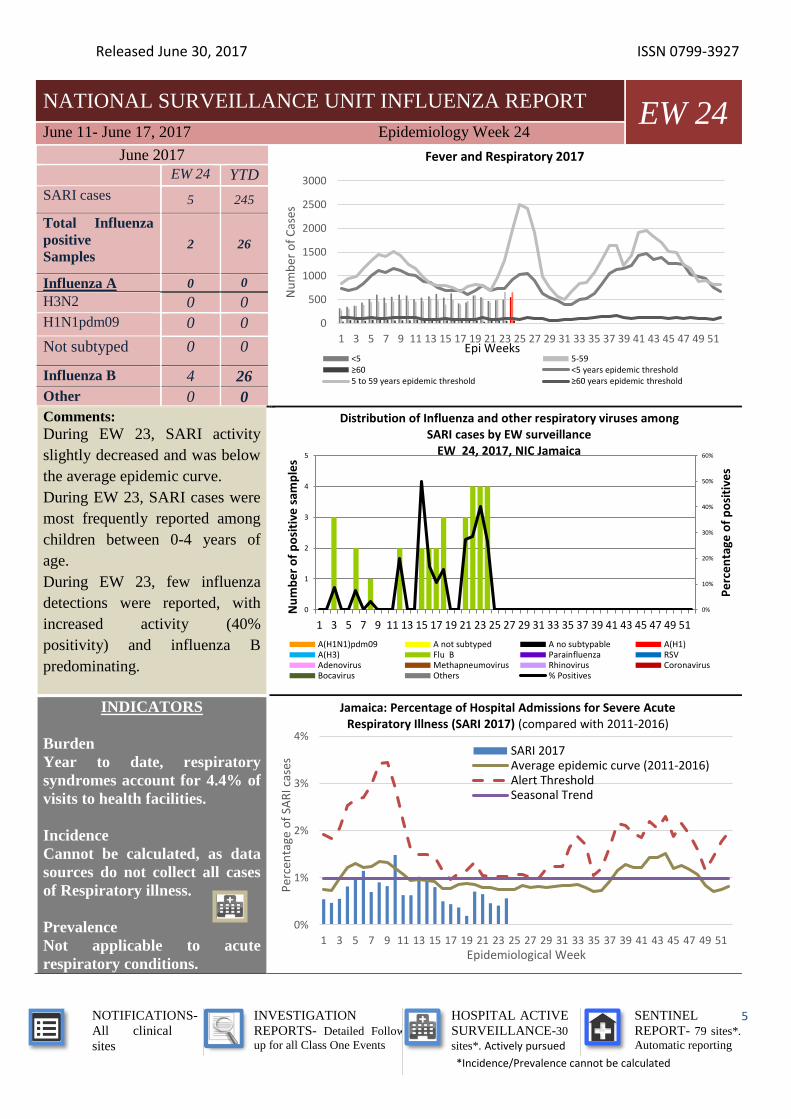
NATIONAL SURVEILLANCE UNIT INFLUENZA REPORT EW 24
June 11- June 17, 2017 Epidemiology Week 24
June 2017
EW 24 YTD
SARI cases 5 245
Total Influenza
positive Samples
2 26
Influenza A 0 0
H3N2 0 0
H1N1pdm09 0 0
Not subtyped 0 0
Influenza B 4 26
Other 0 0
Comments:
During EW 23, SARI activity
slightly decreased and was below
the average epidemic curve.
During EW 23, SARI cases were
most frequently reported among
children between 0-4 years of
age.
During EW 23, few influenza
detections were reported, with
increased activity (40%
positivity) and influenza B
predominating.
INDICATORS
Burden
Year to date, respiratory
syndromes account for 4.4% of
visits to health facilities.
Incidence
Cannot be calculated, as data
sources do not collect all cases
of Respiratory illness.
Prevalence
Not applicable to acute
respiratory conditions.
0
500
1000
1500
2000
2500
3000
1 3 5 7 9 11 13 15 17 19 21 23 25 27 29 31 33 35 37 39 41 43 45 47 49 51
Nu
mb
er o
f C
ases
Epi Weeks
Fever and Respiratory 2017
<5 5-59≥60 <5 years epidemic threshold5 to 59 years epidemic threshold ≥60 years epidemic threshold
0%
10%
20%
30%
40%
50%
60%
0
1
2
3
4
5
1 3 5 7 9 11 13 15 17 19 21 23 25 27 29 31 33 35 37 39 41 43 45 47 49 51
Pe
rce
nta
ge o
f p
osi
tive
s
Nu
mb
er
of
po
siti
ve s
amp
les
Distribution of Influenza and other respiratory viruses among SARI cases by EW surveillance
EW 24, 2017, NIC Jamaica
A(H1N1)pdm09 A not subtyped A no subtypable A(H1)A(H3) Flu B Parainfluenza RSVAdenovirus Methapneumovirus Rhinovirus CoronavirusBocavirus Others % Positives
0%
1%
2%
3%
4%
1 3 5 7 9 11 13 15 17 19 21 23 25 27 29 31 33 35 37 39 41 43 45 47 49 51
Per
cen
tage
of
SAR
I cas
es
Epidemiological Week
Jamaica: Percentage of Hospital Admissions for Severe Acute Respiratory Illness (SARI 2017) (compared with 2011-2016)
SARI 2017Average epidemic curve (2011-2016)Alert ThresholdSeasonal Trend

Released June 30, 2017 ISSN 0799-3927
NOTIFICATIONS-
All clinical
sites
INVESTIGATION
REPORTS- Detailed Follow
up for all Class One Events
HOSPITAL ACTIVE
SURVEILLANCE-30
sites*. Actively pursued
SENTINEL
REPORT- 79 sites*.
Automatic reporting
*Incidence/Prevalence cannot be calculated
6
Dengue Bulletin June 11- June 17, 2017 Epidemiology Week 24
DISTRIBUTION
Year-to-Date Suspected Dengue Fever
M F Un-
known Total %
<1 2 0 0 2 4
1-4 2 2 0 4 8
5-14 5 7 0 12 24
15-24 5 4 0 9 18
25-44 9 5 1 15 30
45-64 2 4 0 6 12
≥65 0 0 0 0 0 Unknown 1 1 0 2 4
TOTAL 26 23 1 50 100
Weekly Breakdown of suspected and
confirmed cases of DF,DHF,DSS,DRD
2017
2016 YTD EW
24 YTD
Total Suspected
Dengue Cases 0 48 1366
Lab Confirmed Dengue cases
0 2 104
CO
NFI
RM
ED
DHF/DSS 0 0 3
Dengue Related Deaths
0 0 0
0
50
100
150
200
1 3 5 7 9 11131517192123252729313335373941434547495153
No
. of
Cas
esEpidemeology Weeks
2013 2014 2015 2016 2017
0.0 0.0
0.5
0.0
1.0
0.0 0.1
0.50.9 0.9
0.30.0
2.2
0.0
0.5
1.0
1.5
2.0
2.5
Susp
ecte
d C
ases
(P
er
100,
000
Po
pu
lati
on
)
Suspected Dengue Fever Cases per 100,000 Parish Population
0
1000
2000
3000
4000
5000
6000
7000
Nu
mb
er
of
Cas
es
Years
Dengue Cases by Year: 2007-2017, Jamaica
Confirmed DF Total suspected

Released June 30, 2017 ISSN 0799-3927
NOTIFICATIONS-
All clinical
sites
INVESTIGATION
REPORTS- Detailed Follow
up for all Class One Events
HOSPITAL ACTIVE
SURVEILLANCE-30
sites*. Actively pursued
SENTINEL
REPORT- 79 sites*.
Automatic reporting
*Incidence/Prevalence cannot be calculated
7
Gastroenteritis Bulletin June 11- June 17, 2017 Epidemiology Week 24
Year EW 24 YTD
<5 ≥5 Total <5 ≥5 Total
2017 122 188 310 5,236 5,830 11,066
2016 160 321 481 3,538 5,554 9,092
Figure 1: Total Gastroenteritis Cases Reported 2016-2017
0
200
400
600
800
1000
1200
1 3 5 7 9 11 13 15 17 19 21 23 25 27 29 31 33 35 37 39 41 43 45 47 49 51
Nu
mb
er o
f C
ases
Epidemiology Weeks
Gastroenteritis Epidemic Threshold vs Cases 2017
<5 Cases ≥5 Cases Epi threshold <5 Epi threshold ≥5
0.0
50.0
100.0
150.0
200.0
250.0
300.0
350.0
KSA STT POR STM STA TRE STJ HAN WES STE MAN CLA STC
Suspected GE Cases < 5 yrs/ 100 000 pop 233.5 187.4 134.1 206.7 217.5 247.2 133.7 195.4 157.4 65.4 179.8 124.6 59.0
Suspected GE cases ≥5yrs/ 100 000 pop 140.8 204.8 227.2 307.5 316.3 332.1 188.9 239.0 227.2 125.9 231.1 198.4 70.2
Highest number of cases < 5 /100,000 pop 0
Highest number of cases ≥ 5/100,000 pop 0
Susp
ecte
d C
ases
(P
er 1
00
,00
0 P
op
ula
tio
n) Suspected Gastroenteritis Cases per 100,000 Parish Population
Trelawny reported thehighest number of GEcases per 100,000 intheir 5 years old andover population
Trelawny reported thehighest number of GEcases per 100,000 intheir under 5 yearsold population
EW
24 Weekly Breakdown of Gastroenteritis cases Gastroenteritis:
In Epidemiology Week 24, 2017, the
total number of reported GE cases
showed an 4% decrease compared to EW
24 of the previous year.
The year to date figure showed a 25%
increase in cases for the period.

Released June 30, 2017 ISSN 0799-3927
NOTIFICATIONS-
All clinical
sites
INVESTIGATION
REPORTS- Detailed Follow
up for all Class One Events
HOSPITAL ACTIVE
SURVEILLANCE-30
sites*. Actively pursued
SENTINEL
REPORT- 79 sites*.
Automatic reporting
*Incidence/Prevalence cannot be calculated
8
RESEARCH PAPER
Estimating Cost Effectiveness of HPV Vaccination or Pap Smear Expansion or VIA Screening
Introduction By Using the CERVIVAC Model J Barnett, K Lewis-Bell
Ministry of Health, Jamaica
Objective: To examine the potential costs, health benefits and value for money (e.g. cost per DALY saved
primarily) of introducing the HPV vaccination for a cohort of girls entering high school; or expanding pap smear
screening; or introduction of Visual Inspection with Acetic Acid (VIA) screening method.
Method: Analysis was conducted using a prospective cohort-based model (CERIVAC) which incorporated meta-
analysis to project the changes in the natural history of the disease based on the intervention’s scale and scope.
Information required related to demographics and system costs and structure for each intervention.
Results: The VIA programme produced the highest cost-effectiveness result i.e. lowest cost per DALY averted,
from the government and society perspective, US$75 and US$4,212 respectively. Societal, the least cost effective
was the expanded pap smear screening option US$6,773.00 (US$2,094.00 – government). Cost per DALY
averted for the vaccination intervention were US$5,360 and US$5,313 respectively and it produced the highest
number of DALYs averted. Notwithstanding, the results of an incremental cost effectiveness analysis between
VIA and vaccination supports the clear dominance of the former.
Conclusion: Using the WHO classification as our proxy income threshold, VIA (US$75 and US$4,212) is less
than the country’s GDP per capita (US$4,471), thus it is highly cost effective and a justifiable investment for the
country. Therefore on the basis of technical efficiency alone, Jamaica should select the VIA option.
The Ministry of Health
24-26 Grenada Crescent
Kingston 5, Jamaica
Tele: (876) 633-7924
Email: [email protected]