upper salem river watershed restoration & protection plan...
TRANSCRIPT

Upper Salem River Watershed Restoration & Protection Plan:
DATA REPORT
Developed by the Rutgers Cooperative Extension Water Resources Program
Funded by the New Jersey Department of Environmental Protection RP 07-024
July 23, 2012

Acknowledgements This document has been produced by the Rutgers Cooperative Extension Water
Resources Program (more information at www.water.rutgers.edu). Data collection was
carried out by staff from the Rutgers Cooperative Extension Water Resources Program
and project partners including the Rutgers Cooperative Extension of Salem and
Cumberland Counties and the Cumberland-Salem Conservation District.
Upper Salem River Watershed Restoration & Protection PlanDATA REPORT
2

Table of Contents
LIST OF FIGURES....................................................................................................................... 4
LIST OF TABLES......................................................................................................................... 4
WATERSHED OVERVIEW ....................................................................................................... 5
PROJECT BACKGROUND AND THE TMDL DEVELOPMENT PROCESS .................................... 9
BIOLOGICAL MONITORING DATA .......................................................................................... 11
STREAM VISUAL ASSESSMENT PROTOCOL (SVAP) DATA COLLECTED IN THE
UPPER SALEM RIVER WATERSHED.................................................................................. 19
INTRODUCTION TO SVAP ....................................................................................................... 19
SVAP IN THE UPPER SALEM RIVER WATERSHED ................................................................ 20
SVAP DATA.............................................................................................................................. 21
USING THE SVAP DATA .......................................................................................................... 24
WATER QUALITY SAMPLING OVERVIEW ...................................................................... 25
DATA RESULTS AND COMPARISON TO WATER QUALITY STANDARDS................................ 29
MICROBIAL SOURCE TRACKING ............................................................................................ 32
DATA SUMMARY ..................................................................................................................... 34
REFERENCES ............................................................................................................................ 36
APPENDIX A: UPPER SALEM RIVER PHASE I REPORT .............................................. 39
APPENDIX B: UPPER SALEM RIVER WATERSHED RESTORATION AND
PROTECTION PLAN, DATA SUMMARY – BIOLOGICAL ASSESSMENT (PREPARED
JANUARY 2011) ....................................................................................................................... 123
APPENDIX C: QUALITY ASSURANCE PROJECT PLAN FOR THE UPPER SALEM
RIVER WATERSHED SURFACE WATER QUALITY MONITORING PROGRAM
(JUNE 5, 2007)........................................................................................................................... 145
APPENDIX D: TABULATED WATER QUALITY MONITORING DATA.................... 187
APPENDIX E: PRESENTATION OF PH, TOTAL PHOSPHORUS, E. COLI AND FECAL
COLIFORM INSTREAM CONCENTRATIONS IN GRAPHS.......................................... 199
Upper Salem River Watershed Restoration & Protection PlanDATA REPORT
3

List of Figures Figure 1: NJDEP 2007 land use/land cover map. ....................................................................... 6
Figure 2: NJDEP 2007 land cover types and agriculture land uses in the Upper Salem River
Watershed. ..................................................................................................................................... 7
Figure 3: Municipalities and waterbodies located within the Upper Salem River
Watershed. ..................................................................................................................................... 8
Figure 4: Biological sampling sites in the Upper Salem River Watershed............................. 16
Figure 5: Stream visual assessment reaches with scores in the Upper Salem River
Watershed. ................................................................................................................................... 23
Figure 6: RCE water quality monitoring station locations in the Upper Salem River
Watershed. ................................................................................................................................... 28
Figure 7: Data Showing the Numbers of Bacteroides Detected by the Two Primer Sets at the
10 Sampling Stations in the Upper Salem Watershed...............................................................36
List of Tables Table 1: Summary of NJDEP Ambient Biological Monitoring Network results (NJDEP,
1996; NJDEP, 2003; NJDEP, 2009b). ........................................................................................ 17
Table 2: SVAP assessment elements and data. ......................................................................... 22
Table 3: Dates and associated types of various water quality monitoring events for the
Upper Salem River Watershed field study................................................................................ 26
Table 4: Water quality monitoring location IDs and descriptions.......................................... 29
Table 5: Water quality standards according to N.J.A.C. 7:9B................................................ 30
Table 6: Number of samples that exceed water quality standards. ........................................ 31
Upper Salem River Watershed Restoration & Protection PlanDATA REPORT
4

Watershed Overview
The Salem River Watershed above U.S. Geological Survey (USGS) streamflow
gauge #01482500 at Woodstown, NJ (henceforth, the Upper Salem River Watershed) is
14.6 square miles and is dominated by agricultural land uses (Figure 1). Based on a
review of aerial photographs, input from Rutgers Cooperative Extension (RCE) of
Cumberland County and the Cumberland-Salem Conservation District, and data
collection during site visits, the agricultural land uses were further identified as row crops
and pastureland. The New Jersey Department of Environmental Protection (NJDEP,
2010) 2007 land use data identifies agricultural land uses within the Upper Salem River
Watershed as cropland and pastureland, orchards and vineyards, confined animal feeding
operations, and other agriculture (Figure 2).
The Upper Salem River Watershed is comprised of sections of Woodstown
Borough, Pilesgrove Township, and Upper Pittsgrove Township in Salem County (Figure
3). Approximately 17.9 miles of river and streams occur within the watershed. The
largest surface waterbody in the drainage area is Memorial Lake, which is located near
the outlet of this watershed (Figure 3).
Upper Salem River Watershed Restoration & Protection PlanDATA REPORT
5

Figure 1: NJDEP 2007 land use/land cover map.
Upper Salem River Watershed Restoration & Protection PlanDATA REPORT
6

2007 Land Uses
65.3%
12.7%
9.8%
1.6%
10.1%
0.4%
AgricultureBarren LandForestUrbanWaterWetlands
Agricultural Land Uses
94.6%
1.3%
3.7% 0.4%
Confined Animal FeedingOperationsCropland and Pastureland
Orchards/Vineyards/Nurseries/Horticultural AreasOther Agriculture
Figure 2: NJDEP 2007 land cover types and agriculture land uses in the Upper
Salem River Watershed.
Upper Salem River Watershed Restoration & Protection PlanDATA REPORT
7

Figure 3: Municipalities and waterbodies located within the Upper Salem River Watershed.
Upper Salem River Watershed Restoration & Protection PlanDATA REPORT
8

Project Background and the TMDL Development Process
The development of the Upper Salem River Watershed Restoration and Protection
Plan was funded in 2005 by the NJDEP (RP 07-024). The overall goal of this project is
to develop a plan that when implemented will restore the water quality to the headwaters
of the Salem River and Memorial Lake in Woodstown, NJ by reducing phosphorus and
fecal coliform loads throughout the watershed. This work has been completed as Phase II
of a project originally begun in 2004. The Phase I Report is attached as Appendix A.
Phase I of this effort included a characterization of the watershed area through the use of
Geographic Information Systems (GIS), development of a Quality Assurance Project
Plan (QAPP), and an assessment of the watershed characterization. Additional funding
was received in 2006 as part of a United State Department of Agriculture (USDA)
National Research Initiative (NRI) grant which greatly expanded the scope of the field
sampling activities of this effort.
Total maximum daily loads (TMDLs) are developed by the NJDEP, and approval
is given by the U.S. Environmental Protection Agency (USEPA). In accordance with
Section 305(b) of the Clean Water Act, New Jersey addresses the overall water quality of
the State’s waters and identifies impaired waterbodies every two (2) years through the
development of a document referred to as the New Jersey Integrated Water Quality
Monitoring and Assessment Report, a.k.a. the “Integrated List” (NJDEP, 2006). Within
this document are sublists that indicate the presence and level of impairment for each
waterbody monitored. The lists are defined as follows:
• Sublist 1 suggests that the waterbody is meeting water quality standards.
Upper Salem River Watershed Restoration & Protection PlanDATA REPORT
9

• Sublist 2 states that a waterbody is attaining some of the designated uses, and no
use is threatened. Furthermore, Sublist 2 suggests that data are insufficient to
declare if other uses are being met.
• Sublist 3 maintains a list of waterbodies where no data or information are
available to support an attainment determination.
• Sublist 4 lists waterbodies where use attainment is threatened and/or a waterbody
is impaired; however, a TMDL will not be required to restore the waterbody to
meet its use designation.
Sublist 4a includes waterbodies that have a TMDL developed and
approved by the USEPA, that when implemented, will result in the
waterbody reaching its designated uses.
Sublist 4b establishes that the impaired reach will require pollutant
control measurements taken by local, state, or federal authorities that will
result in full attainment of designated uses.
Sublist 4c states that the impairment is not caused by a pollutant, but is
due to factors such as instream channel condition, flow alteration, or
habitat degradation. It is recommended by the USEPA that this list be a
guideline for water quality management actions that will address the cause
of impairment.
• Sublist 5 clearly states that the water quality standard is not being attained and
requires a TMDL.
The USGS gauging station #01482500, Salem River at Woodstown, was identified on
sublist 4b in 2002 for fecal coliform and phosphorus (NJDEP, 2002), in 2004 for
Upper Salem River Watershed Restoration & Protection PlanDATA REPORT
10

phosphorus (NJDEP, 2004a), in 2006 for phosphorus and pH (NJDEP, 2006), and in
2008 for pH, phosphorus and mercury (NJDEP, 2009a). A TMDL was proposed in 2003
and approved for fecal coliform (NJDEP, 2004b). The TMDL requires an 84% reduction
of fecal coliform loads in the watershed on 17.9 miles of stream. In 2002, Memorial
Lake was also identified on sublist 4b for phosphorus (NJDEP, 2002). A TMDL was
approved in 2004 that called for a 91% reduction of phosphorus to the water body
(NJDEP, 2004c). Memorial Lake was also listed in 2004 and 2006 as impaired for
mercury (NJDEP, 2004a, NJDEP, 2006). In 2008 Memorial Lake was not listed (NJDEP,
2008). Mercury impairments are outside the scope of this project and are therefore not
addressed for this study.
The purpose of this report is to provide a summary of available water quality data
for the Upper Salem River Watershed, as well as describe the protocols and results of
data collected by the RCE Water Resources Program and its partners. The water quality
investigation that was carried out during this phase of the project addressed task 4 in the
proposal, “Implement the QAPP, analyze the newly collected data, prepare a data report,
and submit the data report to NJDEP.” A complete analysis of this data to target pollution
sources and remediation measures will be presented in the Upper Salem River Watershed
Restoration and Protection Plan.
Biological Monitoring Data
Biological monitoring data is available for the watershed as part of the Ambient
Biological Monitoring Network (AMNET), which is administered by the NJDEP. The
NJDEP has been monitoring the biological communities of the State’s waterways since
Upper Salem River Watershed Restoration & Protection PlanDATA REPORT
11

the early 1970’s, specifically the benthic macroinvertebrate communities. Benthic
macroinvertebrates are primarily bottom-dwelling (benthic) organisms that are generally
ubiquitous in freshwater and are macroscopic. Due to their important role in the food
web, macroinvertebrate communities reflect current perturbations in the environment.
There are several advantages to using macroinvertebrates to gauge the health of a stream.
First, macroinvertebrates have limited mobility, and thus, are good indicators of site-
specific water conditions. Also, macroinvertebrates are sensitive to pollution, both point
and nonpoint sources; they can be impacted by short-term environmental impacts such as
intermittent discharges and contaminated spills. In addition to indicating chemical
impacts to stream quality, macroinvertebrates can gauge non-chemical issues of a stream
such as turbidity and siltation, eutrophication, and thermal stresses. Finally,
macroinvertebrate communities are a holistic overall indicator of water quality health,
which is consistent with the goals of the Clean Water Act (NJDEP, 2004d). These
organisms are normally abundant in New Jersey freshwaters and are relatively
inexpensive to sample.
The AMNET program began in 1992 and is currently comprised of more than 800
stream sites with approximately 200 monitoring locations in each of the five major
drainage basins of New Jersey (i.e., Upper and Lower Delaware, Northeast, Raritan, and
Atlantic). These sites are sampled once every five years using a modified version of the
USEPA Rapid Bioassessment Protocol (RBP) II. To evaluate the biological condition of
the sampling locations, several community measures are calculated by the NJDEP from
the data collected and include the following:
1. Taxa Richness: Taxa richness is a measure of the total number of benthic macroinvertebrate families identified. A reduction in taxa richness typically
Upper Salem River Watershed Restoration & Protection PlanDATA REPORT
12

indicates the presence of organic enrichment, toxics, sedimentation, or other factors.
2. EPT (Ephemeroptera, Plecoptera, Trichoptera) Index: The EPT Index is a
measure of the total number of Ephemeroptera, Plecoptera, and Trichoptera families (i.e., mayflies, stoneflies, and caddisflies) in a sample. These organisms typically require clear moving water habitats.
3. %EPT: Percent EPT measures the numeric abundance of the mayflies, stoneflies,
and caddisflies within a sample. A high percentage of EPT taxa is associated with good water quality.
4. %CDF (percent contribution of the dominant family): Percent CDF measures the
relative balance within the benthic macroinvertebrate community. A healthy community is characterized by a diverse number of taxa that have abundances somewhat proportional to each other.
5. Family Biotic Index: The Family Biotic Index measures the relative tolerances of
benthic macroinvertebrates to organic enrichment based on tolerance scores assigned to families ranging from 0 (intolerant) to 10 (tolerant).
This analysis integrates several community parameters into one easily
comprehended evaluation of biological integrity referred to as the New Jersey
Impairment Score (NJIS). The NJIS has been established for three categories of water
quality bioassessment for New Jersey streams: non-impaired, moderately impaired, and
severely impaired. A non-impaired site has a benthic community comparable to other
high quality “reference” streams within the region. The community is characterized by
maximum taxa richness, balanced taxa groups, and a good representation of intolerant
individuals. A moderately impaired site is characterized by reduced macroinvertebrate
taxa richness, in particular the EPT taxa. Changes in taxa composition result in reduced
community balance and intolerant taxa become absent. A severely impaired site is one in
which the benthic community is significantly different from that of the reference streams.
Upper Salem River Watershed Restoration & Protection PlanDATA REPORT
13

The macroinvertebrates are dominated by a few taxa which are often very abundant.
Tolerant taxa are typically the only taxa present.
The scoring criteria currently used by the NJDEP are as follows:
• Non-impaired sites have total scores ranging from 24 to 30,
• Moderately impaired sites have total scores ranging from 9 to 21, and
• Severely impaired sites have total scores ranging from 0 to 6.
It is important to note that the entire scoring system is based on comparisons with
reference streams and a historical database consisting of 200 benthic macroinvertebrate
samples collected from New Jersey streams. While a low score indicates “impairment,”
the score may actually be a consequence of habitat or other natural differences between
the subject stream and the reference stream.
Starting with the second round of sampling under the AMNET program held
between 2000 and 2001 for the Lower Delaware River region, habitat assessments were
conducted in conjunction with the biological assessments. The first round of sampling
under the AMNET program did not include habitat assessments. The habitat assessment,
which was designed to provide a measure of habitat quality, involves a visually based
technique for assessing stream habitat structure. The habitat assessment is designed to
provide an estimate of habitat quality based upon qualitative estimates of selected habitat
attributes. The assessment involves the numerical scoring of ten habitat parameters to
evaluate instream substrate, channel morphology, bank structural features, and riparian
vegetation. Each parameter is scored and summed to produce a total score which is
assigned a habitat quality category of optimal, sub-optimal, marginal, or poor. Sites with
optimal/excellent habitat conditions have total scores ranging from 160 to 200; sites with
Upper Salem River Watershed Restoration & Protection PlanDATA REPORT
14

sub-optimal/good habitat conditions have total scores ranging from 110 to 159; sites with
marginal/fair habitat conditions have total scores ranging from 60 to 109, and sites with
poor habitat conditions have total scores less than 60. The findings from the habitat
assessment are used to interpret survey results and identify obvious constraints on the
attainable biological potential within the study area.
The NJDEP Bureau of Biological & Freshwater Monitoring maintains two
AMNET stations within the Upper Salem River Watershed (Stations AN0690 and
AN0691) (Figure 4). Both stations were sampled in AMNET rounds in 1995, 2000, and
2006. In August 1995, August 2000, and October 2006, AN0690 was assessed under the
AMNET program as being moderately impaired. In August 1995 and October 2006,
AN0691 was assessed as being severely impaired, and in August 2000 the site was
assessed as being moderately impaired (Table 1).
Habitat assessments were also included starting with the October 2000 AMNET
sampling. Optimal habitat conditions were found at locations AN0690 in August 2000
and conditions were downgraded to sub-optimal in October 2006. At AN0691, sub-
optimal habitat conditions were noted in both August 2000 and October 2006 (Table 1).
Upper Salem River Watershed Restoration & Protection PlanDATA REPORT
15

Figure 4: Biological sampling sites in the Upper Salem River Watershed.
Upper Salem River Watershed Restoration & Protection PlanDATA REPORT
16

Table 1: Summary of NJDEP Ambient Biological Monitoring Network results (NJDEP, 1996; NJDEP, 2003; NJDEP, 2009b). 1996 Results 2000 Results 2006 Results
Station Location Date Sampled
Impairment Status (Score)
Date Sampled
Impairment Status (Score)
Habitat Analysis Result (Score)
Date Sampled
Impairment Status (Score)
Habitat Analysis Result
AN0690 Commissioners Road Pittsgrove
Township 8/24/95 Moderately
Impaired 8/2/00 Moderately Impaired Optimal 10/19/2006 Moderately
Impaired Suboptimal
AN0691 Mill Street
Woodstown Borough
8/22/95 Severely Impaired 8/2/00 Moderately
Impaired Suboptimal 10/19/2006 Severely Impaired Suboptimal
Upper Salem River Watershed Restoration & Protection PlanDATA REPORT
17

Given these aquatic life impairments, an additional biological assessment of the
Upper Salem River Watershed was proposed as part of the development of the Watershed
Restoration and Protection Plan for the Upper Salem River. The biological assessment
conducted by the RCE Water Resources Program in August 2007 is fully described in
Appendix B. The data collected by the RCE Water Resources Program indicate that the
Upper Salem River Watershed, within the study area, continues to support a moderately
impaired benthic macroinvertebrate community. The benthic macroinvertebrate
community occurring within the Upper Salem River Watershed is apparently under some
type of stress as evidenced by low taxa richness, the lack of representation of EPT taxa,
and relatively high family biotic index scores. The types of organisms found, or the lack
thereof, indicate that possible chemical perturbations are occurring within the system,
and/or the benthic community may be subject to physical or habitat constraints. The
habitat assessment revealed sub-optimal habitat conditions, which may also explain the
observed impaired benthic macroinvertebrate community.
Biological assessments have become an important tool for managing water quality
to meet the goal of the Clean Water Act (i.e., to maintain the chemical, physical, and
biological integrity of the nation’s water). Although biological assessments are a critical
tool for detecting impairment, they do not identify the cause or causes of the impairment.
The USEPA developed a process, known as the Stressor Identification (SI) process, to
accurately identify any type of stressor or combination of stressors that might cause
biological impairment (USEPA, 2000). The SI process involves the critical review of
available information, the formation of possible stressor scenarios that may explain the
observed impairment, the analysis of these possible scenarios, and the formation of
Upper Salem River Watershed Restoration & Protection PlanDATA REPORT
18

conclusions about which stressor or combination of stressors are causing the impairment.
The SI process is iterative, and in some cases additional data may be needed to identify
the stressor(s). In addition, the SI process provides a structure or a method for
assembling the scientific evidence needed to support any conclusions made about the
stressor(s). When the cause of a biological impairment is identified, stakeholders are
then in a better position to locate the source(s) of the stressor(s) and are better prepared to
implement the appropriate management actions to improve the biological condition of the
impaired waterway. The SI process is recommended as the next step toward improving
the biological condition of the Upper Salem Watershed.
Stream Visual Assessment Protocol (SVAP) Data Collected in the Upper Salem River Watershed
Introduction to SVAP
To characterize watershed health, the USDA Natural Resources Conservation
Service (NRCS) developed the Stream Visual Assessment Protocol (SVAP). The SVAP
was originally developed for use by landowners (USDA, 1998), but it has also proved to
be useful for those familiar with local river systems and flooding occurrences. The
protocol provides an outline on how to quantitatively score in-stream and riparian
qualities including water appearance, channel condition, and riparian health. There are
ten (10) primary SVAP elements:
• channel condition,
• hydrologic alternation,
• riparian zone,
• bank stability,
• water appearance,
• nutrient enrichment,
Upper Salem River Watershed Restoration & Protection PlanDATA REPORT
19

• barriers to fish movement,
• instream fish cover,
• presence of pools, and
• invertebrate habitat.
There are five (5) additional elements that should only be scored if applicable. These
are canopy cover, manure presence, salinity, riffle embeddedness, and observed
macroinvertebrates. Elements are scored from 1 to 10 (poor to excellent) with the
exception of observed macroinvertebrates, which uses a scale ranging from 1 to 15 (poor
to excellent). Once all the individual elements are scored, their average is calculated and
the range of mean scores is used to qualitatively describe overall watershed health as
follows:
• < 6.0 is Poor;
• 6.1-7.4 is Fair;
• 7.5-8.9 is Good;
• > 9.0 is Excellent.
The SVAP data sheet was modified by the RCE Water Resources Program to
include other reach features to aid in pollution source track down in the Upper Salem
River Watershed. These reach features include the identification of pipes and ditches,
details on erosion or impairment caused by identified pipes or ditches, and access to
stream reach for possible restoration. Additionally, all assessed reaches were photo-
documented, and a site sketch was made denoting important reach characteristics.
SVAP in the Upper Salem River Watershed
SVAP assessments were conducted in the Upper Salem River Watershed
beginning in June 2005. In May 2005, staff members from all project partners were
trained in SVAP procedures. The training workshop consisted of a full day of SVAP
Upper Salem River Watershed Restoration & Protection PlanDATA REPORT
20

introduction and use, and included presentations in a classroom setting and group and
paired exercises in the field. This training also included instructions on how to use the
RCE online database entry system for SVAP data. The project watershed was divided
into a gridded map, and individual maps of each grid were assigned to participating
project partners to facilitate completion of the Upper Salem River Watershed SVAP
assessments.
Access to the river system was the major obstacle in completing visual
assessments in the Upper Salem River Watershed. Due to the agricultural land use
dominating the watershed, it was necessary to alert all landowners of this upcoming
effort. Therefore, announcements were made in local newspapers, and letters were hand-
delivered to the largest landowners. This was advantageous to the project, as feedback
from these landowners improved the assessments and additional information about the
stream conditions were gained that might otherwise have been unavailable.
SVAP Data
Overall, seventy three river reaches were scored in the Upper Salem River. Across
the watershed, the majority of the elements described previously were scored (Figure 5;
Table 2). Overall, the Upper Salem River Watershed received a “fair” rating of a 7.24
(Table 2). This average score is not weighted by stream length. While the average score
of 7.24 represents a “fair” rating, it is apparent that certain areas in the watershed are
impacted (Figure 5). Four locations receiving overall scores of “poor” were seen and
investigated further during the water quality investigation in Phase II of this project. A
Upper Salem River Watershed Restoration & Protection PlanDATA REPORT
21

summary of the SVAP effort for this project is presented as Appendix B of the Phase I
Report which has been included as Appendix A in this report.
Table 2: SVAP assessment elements and data.
Element Count Minimum Maximum Mean Standard Deviation
Riparian Zone-left 73 1.00 10.00 7.42 1.78
Riparian Zone-right 73 1.00 9.00 7.49 1.96
Channel Modification 73 2.00 10.00 6.55 2.29
Bank Stability-left 73 1.00 9.00 4.78 2.28
Bank Stability-right 73 1.00 9.00 4.48 2.32
Water Appearance 73 5.00 9.00 6.59 1.00
Nutrient Enrichment 73 5.00 9.00 6.51 0.87
Fish Barrier 73 5.00 10.00 9.03 1.07
Instream Fish Cover 73 5.00 10.00 7.99 1.26
Pools 73 6.00 10.00 8.16 1.03
Invertebrate Cover 73 5.00 10.00 8.47 1.20
Canopy Cover 73 1.00 10.00 8.85 2.56
Left Average 73 5.36 8.55 7.26 0.73
Right Average 73 5.42 8.64 7.23 0.73
Site Average 73 5.45 8.59 7.24 0.72
Upper Salem River Watershed Restoration & Protection PlanDATA REPORT
22
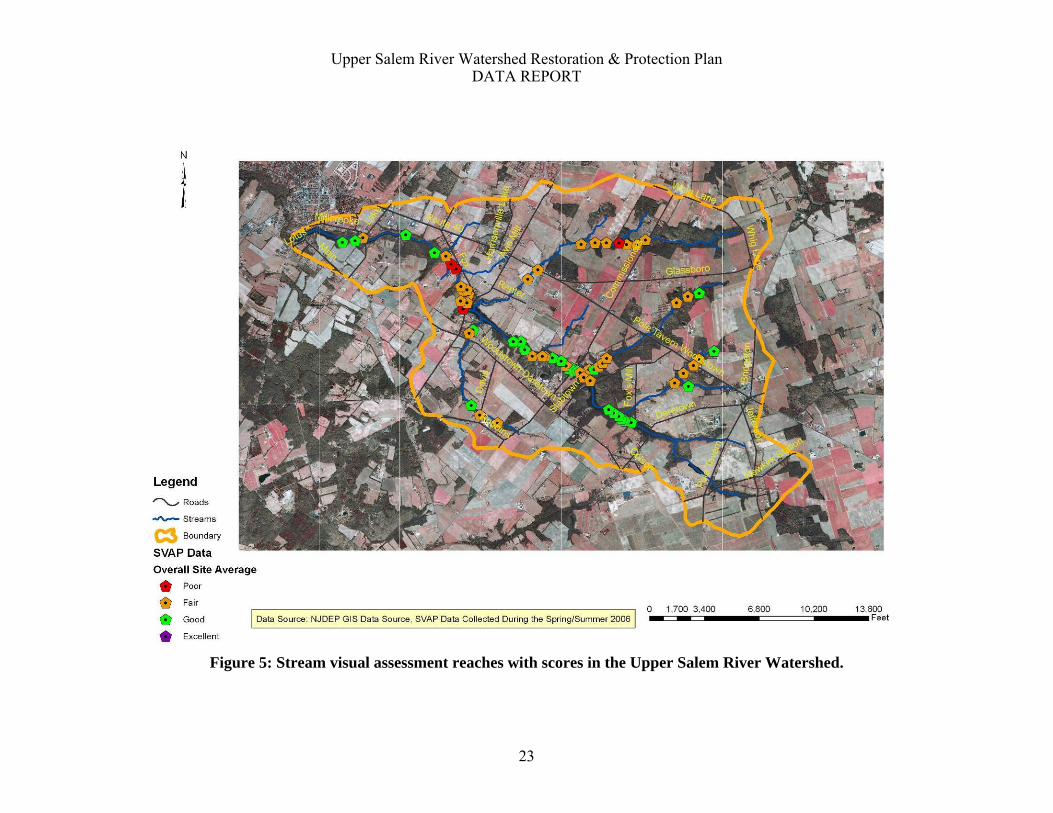
Figure 5: Stream visual assessment reaches with scores in the Upper Salem River Watershed.
Upper Salem River Watershed Restoration & Protection PlanDATA REPORT
23

Particular categories that were found to be deficient by this effort in the Upper
Salem River were bank stability, channel modification, water appearance and nutrient
enrichment. Each of these appears to be directly related to the presence of elevated
suspended sediment in the water column. The analysis indicated that there is a significant
amount of erosion occurring which destabilizes the stream bank and contributes to the
sediment load. Bank stability is a serious concern in many areas of the Upper Salem
River Watershed with a score well below the rating of “poor.” Another indication of the
significance of erosion to stream health is the high correlation coefficient that was found
between bank stability and nutrient enrichment (r = 0.96) indicating that particle-
adsorbed nutrients are delivered to the stream via erosion. High concentrations of
nutrients in the stream lead to enhanced primary production and nutrient-rich, green
waters which are evident from the low scores seen for water appearance. Channel
modification is often the source of bank destabilization. Proper erosion reduction
measures should be followed when stream crossings or access are installed; in addition,
allowing livestock direct access to a stream has the potential to adversely impact each of
these categories, as well as representing a direct source of fecal or nutrient contamination
to the stream.
Using the SVAP Data
SVAP scores will be evaluated as individual assessment elements and combined
with other data collected as part of this restoration planning effort. The SVAP results
will be compared to land use, soil characteristics, slope and stream gradient, and water
Upper Salem River Watershed Restoration & Protection PlanDATA REPORT
24

quality monitoring results to determine the quality of waters within the Upper Salem
River Watershed. The SVAP scores, information on pipes, ditches, photos, and
remediation notes will be used to identify sources of pollution and potential opportunities
for improved management.
Water Quality Sampling Overview To identify the cause(s) of impairment observed through both the SVAP results
and biological sampling, project partners, including NJDEP, the RCE of Salem and
Cumberland Counties, the RCE Water Resources Program, and the Cumberland-Salem
Conservation District, began water quality monitoring on June 8, 2007. As per the
NJDEP-approved Quality Assurance Project Plan (QAPP), in situ measurements of pH,
dissolved oxygen (DO), and temperature were collected (Appendix C). Stream velocity
and depth were measured across stream transects at each sampling station. Using this
information, flow was calculated for each event where access to the stream was deemed
safe. Water samples were collected and analyzed by QC Laboratories in Vineland, New
Jersey (NJDEP Certified Laboratory #PA166) for total phosphorus (TP), dissolved
orthophosphate phosphorus, ammonia-nitrogen, total Kjeldahl nitrogen (TKN), nitrate-
nitrogen, nitrite-nitrogen, total suspended solids (TSS), fecal coliform, and E. coli.
Three separate sampling protocols were followed for the field sampling events
including water quality monitoring sampling conducted during three stream flow
conditions, ambient monitoring, bacterial only, and storm events (Table 3). Ambient
monitoring, which included analysis for all parameters, occurred from June 8, 2007
through June 17, 2009 (Table 3). These events were monitored for all in situ parameters,
Upper Salem River Watershed Restoration & Protection PlanDATA REPORT
25

flow rate, and TP, dissolved orthophosphate phosphorus, ammonia-nitrogen, TKN,
nitrate-nitrogen, nitrite-nitrogen, TSS, fecal coliform and E. coli. Bacteria only
monitoring was conducted in the summer months of July through September 2007 (Table
3). This entailed collecting three additional samples in each of those months for fecal
coliform and E. coli analysis, as well as the in situ parameters and velocity and depth.
In addition, water samples from two storm events were collected in October 2007
(Table 3). Three samples were collected over the course of each storm event for all
parameters at all ten (10) monitoring locations.
Surface water samples were regularly collected from ten (10) water quality
monitoring stations over the two year field study (Figure 6). Six stations were located on
the mainstem Salem River, and four stations were located on tributaries (Figure 6).
Station locations are identified in Table 4. All water quality data are presented in
Appendices D and E.
Table 3: Dates and associated types of various water quality monitoring events for the Upper Salem River Watershed field study.
Date
Ambient Monitoring
for all Parameters
Bacteria Only
Monitoring
Storm Event
Monitoring
6/8/2007 X 6/15/2007 X 6/20/2007 X 6/27/2007 X 6/28/2007 X 7/2/2007 X 7/6/2007 X
7/11/2007 X 7/18/2007 X 7/25/2007 X 7/26/2007 X 8/1/2007 X
8/10/2007 X
Upper Salem River Watershed Restoration & Protection PlanDATA REPORT
26

8/16/2007 X 8/22/2007 X 8/29/2007 X 9/13/2007 X 9/26/2007 X 10/10/2007 X 10/11/2007 X 10/24/2007 X 11/7/2007 X 12/12/2007 X 12/20/2007 X 1/9/2008 X
1/25/2008 X 2/8/2008 X
2/27/2008 X 3/6/2008 X
3/13/2008 X 4/11/2008 X 4/24/2008 X 5/7/2008 X
5/28/2008 X 6/12/2008 X 6/27/2008 X 7/11/2008 X 7/30/2008 X 8/13/2008 X 8/28/2008 X 9/11/2008 X 9/26/2008 X 10/9/2008 X 10/31/2008 X 11/19/2008 X 11/25/2008 X 12/5/2008 X 12/17/2008 X 1/22/2009 X 1/30/2009 X 2/19/2009 X 2/26/2009 X 3/13/2009 X 3/24/2009 X 4/8/2009 X
4/23/2009 X 5/7/2009 X
5/20/2009 X 6/3/2009 X
6/16/2009 X 6/17/2009 X
Upper Salem River Watershed Restoration & Protection PlanDATA REPORT
27

Figure 6: RCE water quality monitoring station locations in the Upper Salem River Watershed.
Upper Salem River Watershed Restoration & Protection PlanDATA REPORT
28

Table 4: Water quality monitoring location IDs and descriptions.
Site ID Site Description S1 Salem River below the Salem River Reservoir S2 Salem River below Daretown Lake S3 Salem River and Tributary 1 confluence at Commissioner's Pike S4 Salem River Tributary 1 at Route 40 S5 Salem River Tributary 2 at Davis Road S6 Salem River Tributary 2 at County 615 S7 Salem River Tributary 3 at Route 40 S8 Salem River below Avis Mill Pond S9 Salem River below East Lake S10 Salem River at Woodstown Station, 01482500
Data Results and Comparison to Water Quality Standards
To evaluate the health of the Upper Salem River at all ten (10) stations, the
monitoring results were compared to the designated water quality standards. Water
quality standards are developed according to the waterbody’s designated uses (NJDEP,
2009c). The Salem River is classified as FW2-NT, or freshwater (FW) non-trout (NT).
“FW2” refers to waterbodies that are used for primary and secondary contact recreation;
industrial and agricultural water supply; maintenance, migration, and propagation of
natural and established biota; public potable water supply after conventional filtration
treatment and disinfection; and any other reasonable uses. “NT” means those freshwaters
that have not been designated as trout production or trout maintenance. NT waters are
not suitable for trout due to physical, chemical, or biological characteristics, but can
support other fish species (NJDEP, 2009c). The applicable water quality standards for
the parameters of concern for this project are detailed in Table 5. Due to drainage from
Memorial Lake (Figure 3), the FW2 lakes standard was applied to TP results from this
study.
Upper Salem River Watershed Restoration & Protection PlanDATA REPORT
29
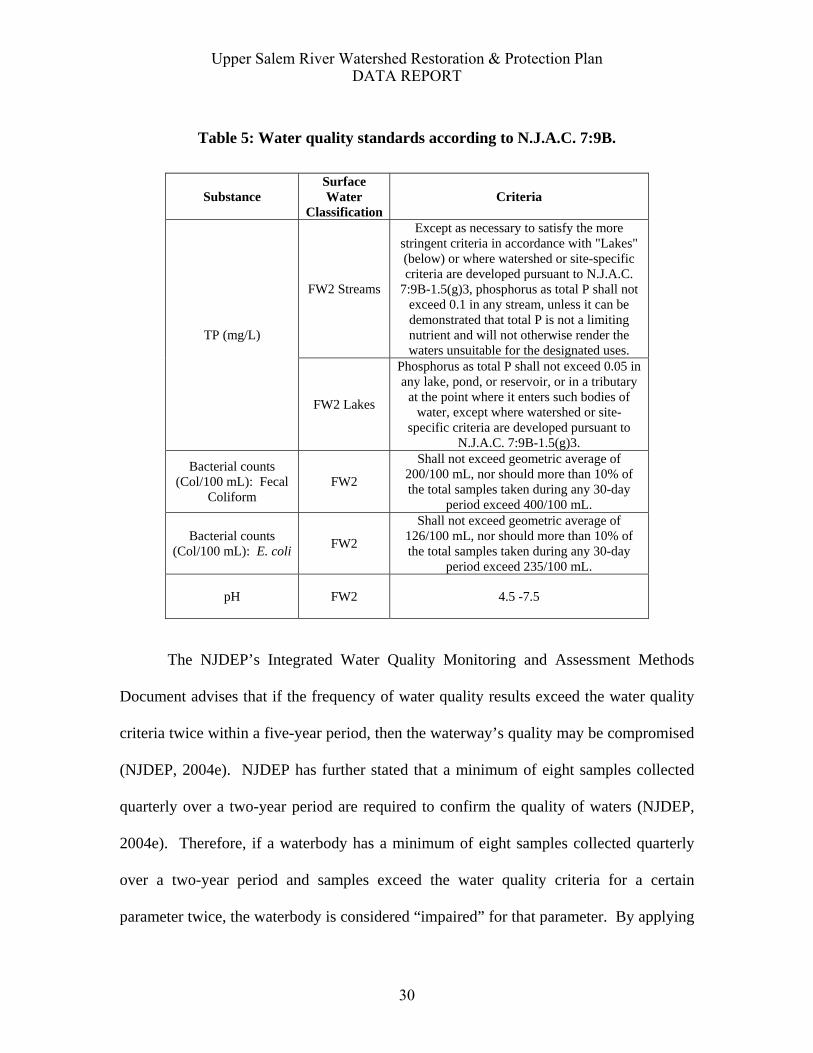
Table 5: Water quality standards according to N.J.A.C. 7:9B.
Substance Surface Water
Classification Criteria
FW2 Streams
Except as necessary to satisfy the more stringent criteria in accordance with "Lakes" (below) or where watershed or site-specific criteria are developed pursuant to N.J.A.C.
7:9B-1.5(g)3, phosphorus as total P shall not exceed 0.1 in any stream, unless it can be demonstrated that total P is not a limiting nutrient and will not otherwise render the waters unsuitable for the designated uses.
TP (mg/L)
FW2 Lakes
Phosphorus as total P shall not exceed 0.05 in any lake, pond, or reservoir, or in a tributary
at the point where it enters such bodies of water, except where watershed or site-
specific criteria are developed pursuant to N.J.A.C. 7:9B-1.5(g)3.
Bacterial counts (Col/100 mL): Fecal
Coliform FW2
Shall not exceed geometric average of 200/100 mL, nor should more than 10% of the total samples taken during any 30-day
period exceed 400/100 mL.
Bacterial counts (Col/100 mL): E. coli FW2
Shall not exceed geometric average of 126/100 mL, nor should more than 10% of the total samples taken during any 30-day
period exceed 235/100 mL.
pH FW2 4.5 -7.5
The NJDEP’s Integrated Water Quality Monitoring and Assessment Methods
Document advises that if the frequency of water quality results exceed the water quality
criteria twice within a five-year period, then the waterway’s quality may be compromised
(NJDEP, 2004e). NJDEP has further stated that a minimum of eight samples collected
quarterly over a two-year period are required to confirm the quality of waters (NJDEP,
2004e). Therefore, if a waterbody has a minimum of eight samples collected quarterly
over a two-year period and samples exceed the water quality criteria for a certain
parameter twice, the waterbody is considered “impaired” for that parameter. By applying
Upper Salem River Watershed Restoration & Protection PlanDATA REPORT
30

this rule to the Upper Salem River Watershed water quality data, it is possible to identify
which stations are impaired for each parameter that has been identified as a concern for
this project (i.e., pH, TP, E. coli and fecal coliform). The number of samples exceeding
these standards is given in Table 6.
Table 6: Number of samples that exceed water quality standards.
Selected Monitoring Parameters Station TP Fecal
coliform* E. coli** pH
S1 2 17 12 0 S2 13 15 12 22 S3 16 31 29 8 S4 5 29 22 2 S5 24 44 39 0 S6 8 42 34 1 S7 6 49 38 3 S8 38 45 33 4 S9 52 48 43 6 S10 51 27 23 19 *Number of samples higher than 400 col/100ml ** Number of samples higher than 235 col/100ml
At the time of this project’s initiation and during the time of data collection, fecal
coliform was the accepted measure indicating pathogen pollution for New Jersey
freshwaters. Since then, the fecal coliform standard has been replaced by the measure of
E. coli. For New Jersey freshwaters, E. coli shall not exceed a geometric mean of 126
colonies/100mL or a maximum count of 235 col/100mL in a single sample (NJDEP,
2009c). For this study, both fecal coliform and E. coli were measured to satisfy both the
TMDL and other current regulations.
Upper Salem River Watershed Restoration & Protection PlanDATA REPORT
31

Tabulated water quality monitoring results are provided in Appendix D. Water
quality monitoring data have also been graphed with water quality criteria, and these are
available in Appendix E.
Microbial Source Tracking
Microbial source tracking (MST) was employed to determine bacterial sources
within the Upper Salem River Watershed. MST is the concept of applying
microbiological, genotypic (molecular), phenotypic (biochemical), and chemical methods
to identify the origin of fecal pollution. MST techniques typically report fecal
contamination sources as a percentage of targeted bacteria. One of the most promising
targets for MST is Bacteroides, a genus of obligately anaerobic, gram-negative bacteria
that are found in all mammals and birds. Bacteroides comprise up to 40% of the amount
of bacteria in feces and 10% of the fecal mass. Due to large quantities of Bacteroides in
feces, they are an ideal target organism for identifying fecal contamination (Layton et al.,
2006). In addition, Bacteroides have been recognized as having broad geographic
stability and distribution in target host animals and are a promising microbial species for
differentiating fecal sources (USEPA, 2005; Dick et al., 2005; Layton et al., 2006).
Three sets of PCR primers (targets) were used to quantify Bacteroides from 1) all
sources of Bacteroides (“AllBac”), 2) human sources (“HuBac”), and 3) bovine sources
of Bacteroides (“BoBac”). This assay is based on published results from a study
sponsored by the Tennessee Department of Environmental Conservation (Layton et al.,
2006).
Upper Salem River Watershed Restoration & Protection PlanDATA REPORT
32
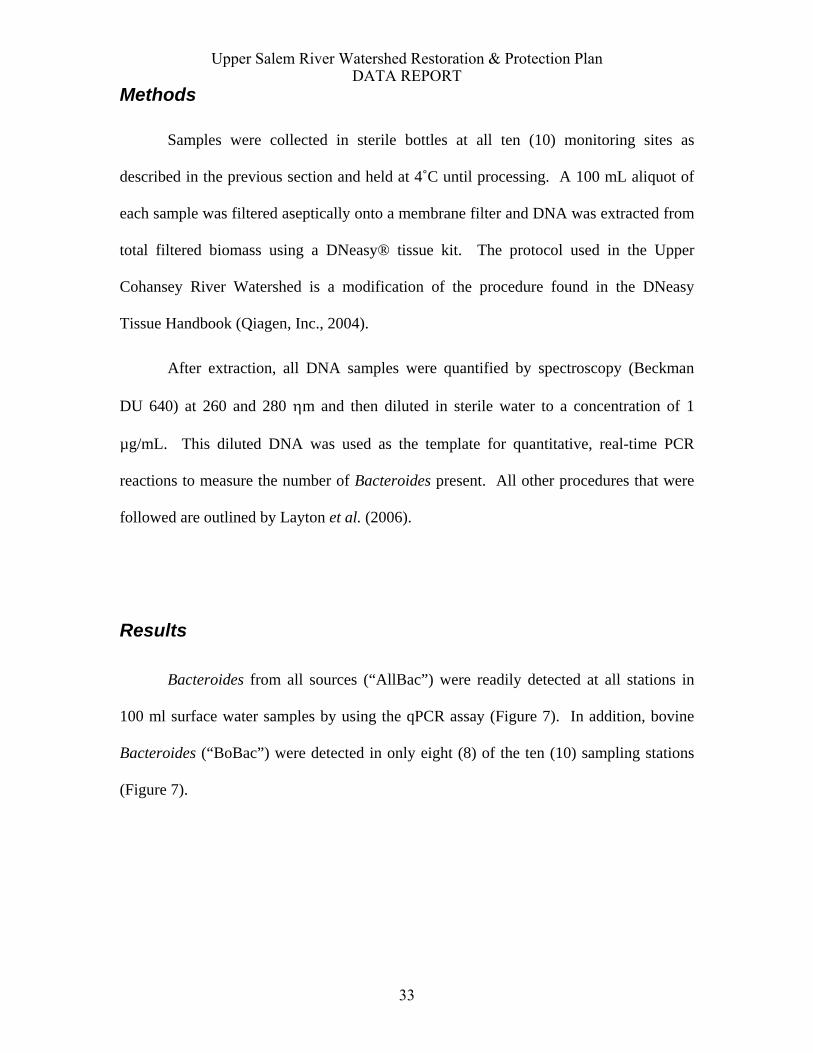
Methods
Samples were collected in sterile bottles at all ten (10) monitoring sites as
described in the previous section and held at 4˚C until processing. A 100 mL aliquot of
each sample was filtered aseptically onto a membrane filter and DNA was extracted from
total filtered biomass using a DNeasy® tissue kit. The protocol used in the Upper
Cohansey River Watershed is a modification of the procedure found in the DNeasy
Tissue Handbook (Qiagen, Inc., 2004).
After extraction, all DNA samples were quantified by spectroscopy (Beckman
DU 640) at 260 and 280 ηm and then diluted in sterile water to a concentration of 1
µg/mL. This diluted DNA was used as the template for quantitative, real-time PCR
reactions to measure the number of Bacteroides present. All other procedures that were
followed are outlined by Layton et al. (2006).
Results
Bacteroides from all sources (“AllBac”) were readily detected at all stations in
100 ml surface water samples by using the qPCR assay (Figure 7). In addition, bovine
Bacteroides (“BoBac”) were detected in only eight (8) of the ten (10) sampling stations
(Figure 7).
Upper Salem River Watershed Restoration & Protection PlanDATA REPORT
33

0.00E+00
5.00E+06
1.00E+07
1.50E+07
2.00E+07
2.50E+07
S1 S2 S3 S4 S5 S6 S7 S8 S9 S10
Site
PCR Prim
er (cop
ies/100 ml)
AllBac BoBac Figure 7: Data Showing the Numbers of Bacteroides Detected by the Two Primer
Sets at the 10 Sampling Stations in the Upper Salem Watershed.
Data Summary
The data show a variety of water quality concerns in the Upper Salem River
Watershed. The AMNET macroinvertebrate results show moderate to severe
impairments to the biological communities within the watershed (Table 1). This is also
seen in the RCE-collected macroinvertebrate data (Appendix B). The biological
community may be impacted by environmental stressors or degraded habitat. Habitat
conditions assessed by both NJDEP through AMNET and the RCE assessments show
suboptimal conditions in areas within the watershed (Table 2; Appendix B). Habitat
Upper Salem River Watershed Restoration & Protection PlanDATA REPORT
34

quality may be low due to physical alterations as observed during SVAP assessments
conducted throughout the watershed. The overall quality of the streams was assessed as
“good” but individual element scores ranged from “poor” to “good” (Figure 5; Table 2).
Further analysis of this data may help to explain what physical factors (i.e., erosion,
habitat structure, and water availability) may be responsible for the composition of the
macroinvertebrate communities seen in the watershed.
While the biological monitoring and SVAP assessments shed light on watershed
quality, water monitoring provides possible reasons for this quality. Results indicate that
TP, E. coli and fecal coliform concentrations are in violation of water quality criteria
established by the NJDEP (Appendix D). All ten (10) monitoring locations were in
violation of TP, fecal coliform and E. coli water quality standards during the sampling
campaign (Table 6). The frequency of violation is greatest at the most downstream
sampling points (S8, S9, and S10) and the tributary that contains points S5 and S6. The
exception to these trends is fecal coliform and E. coli violations in Memorial Lake (S10)
and TP violations at S6. Presumably fecal coliform and E. coli settle out of the water
column in Memorial Lake and result in lower concentrations. The reason for fewer
violations in S6 than S5 is currently under investigation. A full analysis of the data will
be conducted and presented in the Upper Salem River Watershed Restoration and
Protection Plan.
Upper Salem River Watershed Restoration & Protection PlanDATA REPORT
35

References
Dick, L.K., A.E. Bernhard, T.J. Brodeur, J.W. Santo-Domingo, J.M. Simpson, S.P. Walters and K.G. Field, 2005, Host Distributions of Uncultivated Fecal Bacteroidales Bacteria Reveal Genetic Markers for Fecal Source Identification. Appl. Environ. Microbiol. 71(6):3184-3191.
Layton, A., L. McKay, D. Williams, V. Garrett, R. Gentry and G. Sayler, 2006, Development of Bacteroides 16S rRNA Gene TaqMan-Based Real-Time PCR Assays for Estimation of Total, Human, and Bovine Fecal Pollution in Water. Appl. Environ. Microbiol. 72(6):4214-4224.
New Jersey Department of Environmental Protection (NJDEP), 1996, Ambient
Biomonitoring Network Lower Delaware Region Water Monitoring Report. Trenton, NJ.
New Jersey Department of Environmental Protection (NJDEP), 2002, New Jersey 2002
Integrated Water Quality Monitoring and Assessment Report [305(b) and 303(d)]. Trenton, NJ.
New Jersey Department of Environmental Protection (NJDEP), 2003, Ambient
Biomonitoring Network Lower Delaware Region Water Monitoring Report. Trenton, NJ.
New Jersey Department of Environmental Protection (NJDEP), 2004a, New Jersey 2004
Integrated Water Quality Monitoring and Assessment Report [305(b) and 303(d)]. Trenton, NJ.
New Jersey Department of Environmental Protection (NJDEP), 2004b, Total Maximum
Daily Loads for Fecal Coliform to Address 27 Streams in the Lower Delaware Water Region, Trenton, NJ. http://www.epa.gov/waters/tmdldocs/NJ-2003-Fecal%20Coliform-27%20Streams%20Lower%20Delaware%20Region.pdf.
New Jersey Department of Environmental Protection (NJDEP), 2004c, Total Maximum
Daily Loads for Phosphorus To Address 13 Eutrophic Lakes in the Lower Delaware Water Region Water Region, Trenton, NJ. http://www.epa.gov/waters/tmdldocs/NJ-2003-Phosphorus-13%20Lakes%20Lower%20Delaware%20Region.pdf .
New Jersey Department of Environmental Protection (NJDEP). 2004d. Ambient
Biomonitoring Network, Watershed Management Areas, Benthic Macroinvertebrate Data, Generalized Executive Summary. http://www.nj.gov/dep/wmm/bfbm/GenExecSum.html.
Upper Salem River Watershed Restoration & Protection PlanDATA REPORT
36

New Jersey Department of Environmental Protection (NJDEP), 2004e, Integrated Water Quality Monitoring and Assessment Methods Trenton, NJ. http://www.state.nj.us/dep/wms/bwqsa/docs/04%20Methods%20Doc.pdf.
New Jersey Department of Environmental Protection (NJDEP), 2006, New Jersey 2006
Integrated Water Quality Monitoring and Assessment Report [305(b) and 303(d)]. Trenton, NJ.
New Jersey Department of Environmental Protection (NJDEP), 2009a , New Jersey 2008
Integrated Water Quality Monitoring and Assessment Report [305(b) and 303(d)]. Trenton, NJ.
New Jersey Department of Environmental Protection (NJDEP), 2009b, Bureau of
Freshwater and Biological Monitoring AMNET Round 3 Data Tables http://www.state.nj.us/dep/wms/bfbm/download/AMNETrnd3Data.pdf.
New Jersey Department of Environmental Protection (NJDEP), 2009c, Surface Water
Quality Standards. Trenton, NJ. http://www.state.nj.us/dep/wms/bwqsa/December%202009%20SWQS.pdf.
New Jersey Department of Environmental Protection (NJDEP), 2010, NJDEP 2007 Land
Use/Land Cover Update, WMA-17. Trenton, NJ. Qiagen, Inc., 2004, DNeasy® Tissue Handbook. Valencia, CA. United States Department of Agriculture (USDA), Natural Resource Conservation
Service (NRCS), 1998, Stream Visual Assessment Protocol. National Weather and Climate Center Technical Note 99-1.
United States Environmental Protection Agency (USEPA), 2000, Stressor Identification
Guidance Document. EPA/822/B-00/025. Washington, D.C. United States Environmental Protection Agency (USEPA), 2005. Microbial Source
Tracking Guidance Document. EPA/600/R-05/064. Office of Research and Development National Risk Management Research Library. Washington, DC. 151 pp.
Upper Salem River Watershed Restoration & Protection PlanDATA REPORT
37

Upper Salem River Watershed Restoration & Protection PlanDATA REPORT
38