lake pocotopaug lake and watershed restoration …
TRANSCRIPT
Prepared For:TOWN OF EASTHAMPTON,CONNECTICUT
Prepared By:
LAKE POCOTOPAUGLAKE AND WATERSHED
RESTORATION EVALUATIONEAST HAMPTON, CONNECTICUT
May 2002
Document No. 08734-470
LAKE POCOTOPAUGLAKE AND WATERSHED
RESTORATION EVALUATION
Prepared for:
Town of East Hampton20 East High Street
East Hampton, Connecticut
Prepared by:
ENSR International2 Technology Park Drive
Westford, Massachusetts 01886
TABLE OF CONTENTS
LAYPERSON’S SYNOPSIS .......................................................................................................... i1.0 EXECUTIVE SUMMARY ........................................................................................................12.0 INTRODUCTION ....................................................................................................................33.0 BACKGROUND INFORMATION ............................................................................................5
3.1 Previous Studies and Major Event Chronology..................................................................53.2 Watershed Features.........................................................................................................113.3 Lake Features ..................................................................................................................15
4.0 METHODS AND APPROACH ..............................................................................................174.1 Quality Control and Quality Assurance ............................................................................174.2 Hydrology .........................................................................................................................194.3 Water Quality....................................................................................................................204.4 Nutrient Loading ...............................................................................................................254.5 Biological Characterization...............................................................................................25
5.0 HYDROLOGIC INPUTS.......................................................................................................275.1 Precipitation......................................................................................................................275.2 Groundwater.....................................................................................................................275.3 Surface Water ..................................................................................................................27
6.0 WATER QUALITY................................................................................................................296.1 In-Lake Water Quality.......................................................................................................296.2 Tributary and Storm Drain Water Quality .........................................................................396.3 In-Lake Biology.................................................................................................................49
6.3.1 Phytoplankton ............................................................................................................496.3.2 Chlorophyll a..............................................................................................................646.3.3 Zooplankton ...............................................................................................................65
7.0 RELATIONSHIPS AND TRENDS........................................................................................707.1 Precipitation......................................................................................................................707.2 Secchi Disk Transparency, Total Phosphorus and Chlorophyll a ....................................70
8.0 PHOSPHORUS LOADING ..................................................................................................838.1 Loading Sources ..............................................................................................................838.4 Tributary and Storm Drain Loading ..................................................................................858.5 Loading Summary ............................................................................................................87
9.0 DIAGNOSTIC SUMMARY ...................................................................................................8910.0 MANAGEMENT NEEDS AND OBJECTIVES ..................................................................9211.0 POTENTIAL MANAGEMENT OPTIONS ...........................................................................93
11.1 Reducing Non-Algal Turbidity.........................................................................................9311.2 Reducing Total Phosphorus and Sediment Loading from the Watershed .....................94
11.2.1 Source Controls ........................................................................................................9411.2.2 Transport Mitigation .................................................................................................97
11.3 Prevent algal blooms from occurring and maximize water clarity.................................108TABLE OF CONTENTS CONTINUED
12.0 ADDITIONAL DATA NEEDS ............................................................................................12412.1 In-Lake Monitoring........................................................................................................12412.2 Watershed Input Monitoring .........................................................................................12412.3 Additional Algal Monitoring...........................................................................................12412.4 Additional Investigative Sampling.................................................................................12512.5 Algal Assays.................................................................................................................12512.6 Fish Assays ..................................................................................................................125
13.0 RECOMMENDED MANAGEMENT PROGRAM..............................................................12613.1 Source Controls.............................................................................................................12613.2 Transport Mitigation.......................................................................................................12713.3 In-Lake Actions..............................................................................................................128
14.0 REFERENCES ................................................................................................................130
LIST OF TABLES
Table 1. Mean Lake Pocotopaug Water Quality in 1973, 1974, 1979, and 1980. ............... 5Table 2. Median Lake Pocotopaug Water Quality 1973, 1974, 1979, and 1980. ................ 6Table 3. Diagnostic and Management Assessment Hydrologic Budget.............................. 7Table 4. Summary of Volunteer Lake Study Group Data. ................................................. 11Table 5 Land Use from the CT DEP GIS and VLSG. ....................................................... 12Table 6. QA/QC on Water Quality Data............................................................................. 18Table 7. Laboratory Percent Error during the 2001 Lake Pocotopaug Investigation......... 18Table 8. Water Quality Variables Measured in Lake Pocotopaug. .................................... 22Table 9. ENSR and VLSG Tributary and Storm Drain Sampling Station Identifier,
Description and Drainage Areas. ........................................................................ 25Table 10. 2001 Lake Pocotopaug In-lake Data Summary................................................... 31Table 11. Lake Pocotopaug July and August Range of Annual Means and Water Quality
Standards for Mesotrophic Lakes in Connecticut. ............................................... 38Table 12. 2001 Dry and Wet Weather Tributary and Storm Drain Data. ............................. 40Table 13. 2001 Phytoplankton Density................................................................................ 51Table 14. 2001 Phytoplankton Biomass. ............................................................................. 59Table 15. 2001 Zooplankton Density................................................................................... 66Table 16. 2001 Zooplankton Biomass................................................................................. 68Table 17. Empirical Model Calculations using Lake Pocotopaug TP Range....................... 82Table 18. Total Phosphorus Loading Estimates.................................................................. 84Table 19. Wet Weather Loading Summary for 2001 Data................................................... 86Table 20. Relative Wet Weather Total Phosphorus Loading............................................... 87Table 21. Management Options for Control of Algae. ....................................................... 110
TABLE OF CONTENTS CONTINUED
LIST OF FIGURES
Figure 1. Lake Pocotopaug Watershed ................................................................................ 4Figure 2. Lake Pocotopaug Watershed Land Use.............................................................. 13Figure 3. Lake Pocotopaug Watershed Soils. ................................................................... 14Figure 4. Lake Pocotopaug Bathymetry (Frink and Norvell 1984)...................................... 16Figure 5. Illustration of a Passive Surface Water Sampler for sampling the “First Flush” of
Storm-related Flow. ............................................................................................. 20Figure 6. Lake Pocotopaug Watershed 2001 Sampling Locations..................................... 24Figure 7. 2001 Temperature and Dissolved Oxygen Profiles. ............................................ 30Figure 8. Annual Total Phosphorus from 1991-2001.......................................................... 35Figure 9. Annual June, July and August Total Phosphorus................................................ 36Figure 10. 2001 Phytoplankton Biomass for LP-1. ............................................................... 62Figure 11. 2001 Phytoplankton Biomass for LP-2. ............................................................... 63Figure 12. Average Surface July and August Chlorophyll a vs. 30 Days of Precipitation..... 71Figure 13. 1991-2001 Surface Water Phosphorus vs. Secchi Disk Transparency............... 72Figure 14. 2001 Surface Water Phosphorus vs. Secchi Disk Transparency. ....................... 73Figure 15. 2001 Surface and Mid-depth Phosphorus vs. Secchi Disk Transparency........... 74Figure 16. 1991-2001 Chlorophyll a vs. Secchi Disk Transparency. .................................... 76Figure 17. 1991-2001 July and August Chlorophyll a vs. Secchi Disk Transparency. ......... 77Figure 18. 2001 Chlorophyll a vs. Secchi Disk Transparency. ............................................. 78Figure 19. 1991-2001 Surface Total Phosphorus vs. Chlorophyll a. ....................................79Figure 20. 1991-2001 July and August Surface Total Phosphorus vs. Chlorophyll a..........80Figure 21. 2001 Surface Total Phosphorus vs. Chlorophyll a. ............................................. 81Figure 22. Buffer Strips for Pollutant Transport Mitigation.................................................... 98Figure 23. Catch Basin with Sump and Hood..................................................................... 100Figure 24. Oil and Grit Traps. ............................................................................................. 101Figure 25. Detention Systems. ........................................................................................... 103Figure 26. Infiltration Systems. ........................................................................................... 104Figure 27. Constructed Treatment Wetlands...................................................................... 106Figure 28. Water Quality Improvement Swales .................................................................. 107
APPENDICES
Appendix A: Analysis of Phosphorus InactivationAppendix B: Supplemental Tables and Figures.Appendix C: WMC 1995 Stormwater Renovation and Management PlanAppendix D: Educational Materials
Lake Pocotopaug Restoration Evaluation May 2002i
LAYPERSON’S SYNOPSIS
Lake Pocotopaug covers 512 acres in East Hampton, CT. Its watershed is less than five timesas large as the lake. As a consequence, limited water is delivered to the lake and the lake isflushed relatively infrequently. This means that pollutants entering the lake stay there a longtime and can have the maximum impact on lake condition. Although the watershed is mostlyforest, areas that have been developed as residential and recreational areas are mostly nearthe lake and have negative impacts on the lake by adding nutrients, bacteria and otherpollutants. Over the long term, these inputs have caused a build up of contaminants in the lakethat support algal blooms and low water clarity. The alum treatment of 2000-2001 inactivatedthese contaminants over the most critical part of the lake, but inputs associated with bigger rainevents and possibly recycling of contaminants in untreated parts of the lake can still supportalgal blooms and low water clarity. Additional watershed management is therefore needed.
An unusual aspect of the Lake Pocotopaug system is that it supports algal blooms at a relativelylow fertility level. This means that management that might be adequate at other area lakes maynot eliminate undesirable conditions in Lake Pocotopaug. Watershed management musttherefore be especially effective in reducing pollutant inputs to achieve the desired results. Avariety of options have been reviewed, including minimizing sources of contaminants andtrapping contaminants as they move toward the lake. Sources of major concern include lawncare products; education and possible local ordinances are recommended to reduce their use inthis watershed. Methods to trap contaminants include systems that detain storm water, withpassage into the ground wherever possible. Natural processes will reduce the amount ofpollutants reaching the lake through such systems.
Adding predatory fish (such as walleye) to the lake may also improve conditions, as these fisheat smaller fish that eat small invertebrates that eat algae. In other words, by increasing thebiomass of predatory fish, grazing pressure on algae can be increased and less algae will buildup in the lake. This strategy may not be sufficient by itself, but can supplement a strongwatershed management program that reduces overall fertility in the lake.
Some additional monitoring in the lake and watershed is needed to address some unansweredquestions and to track progress. This is a complicated system with no easy solution to existingproblems, but Town actions to date are moving the lake in the right direction, and carefulcontinued management is expected to continue and expand this improvement.
Lake Pocotopaug Restoration Evaluation May 20021
1.0 EXECUTIVE SUMMARY
Lake Pocotopaug has a surface area of approximately 512 acres and is a major resource forrecreation and aquatic life in East Hampton. The watershed is small relative to the size of thelake (<5:1 watershed:lake area ratio). The land use within the watershed is mostly forestedarea. However, near-shore land use is heavily developed. Soils within the watershed consistmainly of glacial till that is well drained.
Although the watershed area is small, the majority of lake water comes from surface runoff fromthe watershed. The lake flushes a little more than once per year. In-lake water quality istherefore highly dependent on the quality of surface water runoff from the watershed. Thehighly developed area surrounding the lake contributes to poor water clarity, which has beendocumented since 1974. Lake Pocotopaug suffers from severe algal blooms and high sedimentloading that reduces water clarity. A fishkill in 1999 prompted accelerated activity toward lakeimprovement.
Poor water clarity is likely the result of a combination of algal density and non-algal turbidity.Lake Pocotopaug is unusual in that it suffers from algal blooms even though total surfacephosphorus concentrations are fairly low. Reducing watershed phosphorus load by 60%, themaximum probable percentage achievable, may not prevent algal blooms in this lake, althoughother lakes in this region cannot typically support high algal densities at this low concentration.Reducing the phosphorus input to Lake Pocotopaug will decrease the probability of blooms,reducing their frequency and/or severity, so such management is still advised.
Internal recycling has been reduced through the application of alum, but future treatment maystill be necessary. Non-algal turbidity is likely the result of inadequate watershed managementpractices resulting in heavy sediment loading and internal resuspension of lake sediment in theshallow basin to the south. Sediment inputs should be controllable. The “Storm WaterRenovation and Management Plan for Lake Pocotopaug” prepared by WMC in 1995 outlinesmany techniques for sediment input reduction. Techniques for controlling internal resuspensionof sediment are expensive on a large scale. A more cost effective but highly experimentalapproach would be an alum treatment of the southern area. This treatment may both congealthe sediments to limit resuspension and inactivate any phosphorus that does get entrained inthe water column.
Lake Pocotopaug has a large panfish population, which may be contributing to low zooplanktondensities and individual size. Increasing piscivore (fish eating fish) populations could improvezooplankton populations and thereby increase grazing on phytoplankton. This “top-down”control is a form of biomanipulation in which biological components of an aquatic system arealtered to create a cascading effect within the food web that results in increased water clarity.
Lake Pocotopaug Restoration Evaluation May 20022
The stocking of walleye in Lake Pocotopaug could have the desired effect. Realistically, it maytake 3-5 years for an observable effect to become manifest, but this is an approach that virtuallyall groups can support.
The cause of the fishkill that occurred in late 1999 and early 2000 remains a mystery. No toxicalgae have been encountered during the time when perch school in the tributaries, and algaldensities at that time (December-January) have not been especially high anyway. Contact withover 30 fishery professionals has not revealed a similar situation elsewhere. While manyplausible explanations for the schooling and fishkill have been offered, no proof has yet beendocumented.
Active management of Lake Pocotopaug and its watershed should continue, but certain aspectsof this system deserve further study to allow the most effective management program to beimplemented and to answer questions that remain from work done to date. Futureinvestigations should focus on:
watershed wet and dry weather sampling, determination of the total phosphorus concentration that limits algal growth in Lake
Pocotopaug, investigating the effect of internal resuspension of lake sediment fish assays to determine if there are toxicity effects on fish resulting in observed
schooling behavior and death.
Lake Pocotopaug Restoration Evaluation May 20023
2.0 INTRODUCTION
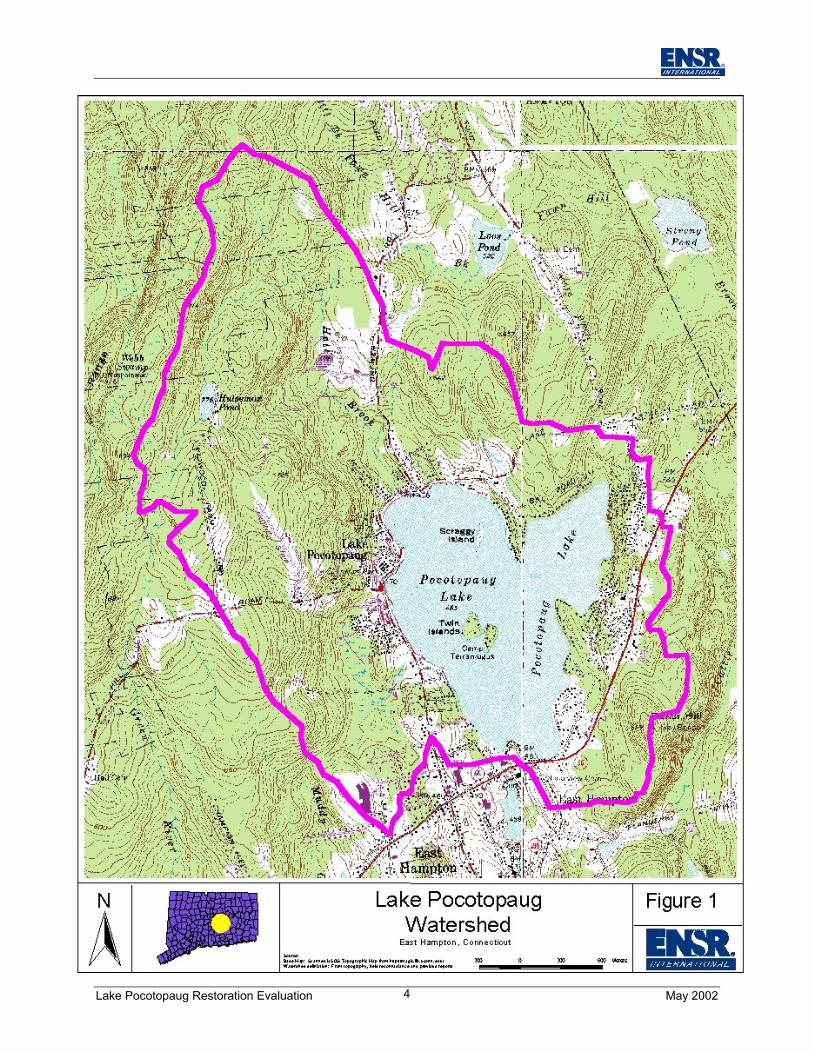
Lake Pocotopaug is located in the Town of East Hampton, Connecticut (Figure 1). It is thelargest freshwater lake in the State of Connecticut (511.7 acres) and serves as a major resourcefor boating, fishing and swimming.
Lake Pocotopaug, meaning “clear water”, was named by the Wagunk during mid 1600’s (Dynia1999, Umba 2000). The lake and surrounding land was sold to early colonist. Industry wasprevalent by mid 1700’s. Industry included iron forging, bell making, and sawmilling. LakePocotopaug became a popular tourist destination by the 1870’s. Tourism increased with roadimprovements and railroad construction. Permanent residents became widespread by mid1900’s. Today the lakeshore area is highly developed. However, much of the 2,381-acrewatershed remains as wooded area (65 – 77%, Ad Hoc 1995 and CT DEP 1994).
The lake has suffered from reduced water clarity associated with severe algal blooms and non-algal turbidity. Poor water clarity has been document since 1974 (Frink and Norvell 1984). Agroup of concerned citizens formed a Lake Study Group to investigate the water qualityproblems of Lake Pocotopaug after a severe algal bloom in 1990. Several studies conducted bythe Volunteer Lake Study Group (VLSG), Town of East Hampton Ad Hoc Lake AdvisoryCommittee (AHLAC), and an Environmental Consulting firm (Fugro-McClelland – now ENSR)have followed. The lake also experiences a strange phenomenon in which fish school in thetwo major tributaries during the winter shortly after ice formation on the lake. The lake hasexperienced fish kills in the past. A chronology of events is provided in the next section tosummarize previous investigations and major events relating to Lake Pocotopaug.
The Town of East Hampton contracted ENSR International (ENSR) for a Lake and WatershedRestoration Evaluation. The restoration evaluation is a yearlong lake and watershed samplingprogram and management alternative investigation in an effort to increase lake water clarity andto help determine the cause of fish kills. The Lake and Watershed Restoration Evaluationbegan in spring of 2001, with in-lake water sampling concluding in December 2001. Results ofthe monthly water sampling and restoration evaluation are the subject of this document.
Lake Pocotopaug Restoration Evaluation May 20024
Lake Pocotopaug Restoration Evaluation May 20025
3.0 BACKGROUND INFORMATION
3.1 Previous Studies and Major Event Chronology
The Town of East Hampton and the Volunteer Lake Study Group provided copies of previousreports. Scientific information and major events relating to Lake Pocotopaug presented in thosereports are summarized here. All publications are listed in the Reference section of this report.Readers are encouraged to obtain original documents for further details, as only shortsummaries are provided below. Raw data from select previous reports are summarized forcomparison purposes throughout the document.
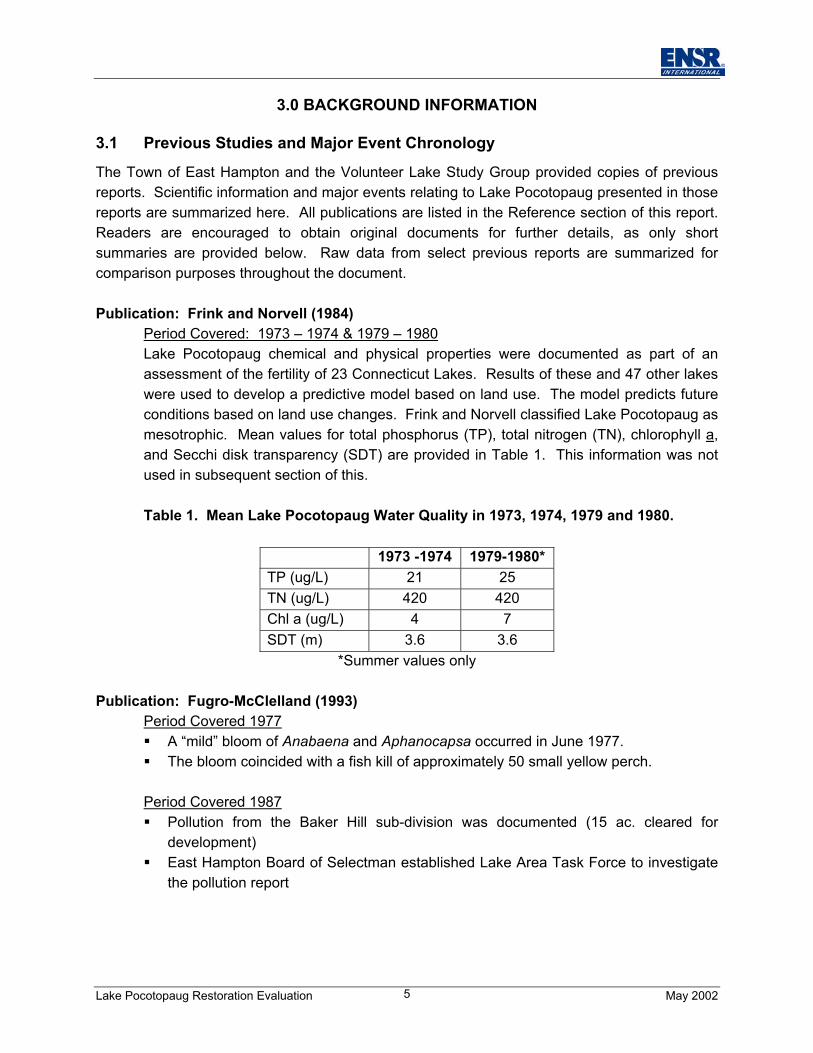
Publication: Frink and Norvell (1984)Period Covered: 1973 – 1974 & 1979 – 1980Lake Pocotopaug chemical and physical properties were documented as part of anassessment of the fertility of 23 Connecticut Lakes. Results of these and 47 other lakeswere used to develop a predictive model based on land use. The model predicts futureconditions based on land use changes. Frink and Norvell classified Lake Pocotopaug asmesotrophic. Mean values for total phosphorus (TP), total nitrogen (TN), chlorophyll a,and Secchi disk transparency (SDT) are provided in Table 1. This information was notused in subsequent section of this.
Table 1. Mean Lake Pocotopaug Water Quality in 1973, 1974, 1979 and 1980.
1973 -1974 1979-1980*TP (ug/L) 21 25TN (ug/L) 420 420Chl a (ug/L) 4 7SDT (m) 3.6 3.6
*Summer values only
Publication: Fugro-McClelland (1993)Period Covered 1977 A “mild” bloom of Anabaena and Aphanocapsa occurred in June 1977. The bloom coincided with a fish kill of approximately 50 small yellow perch.
Period Covered 1987 Pollution from the Baker Hill sub-division was documented (15 ac. cleared for
development) East Hampton Board of Selectman established Lake Area Task Force to investigate
the pollution report
Lake Pocotopaug Restoration Evaluation May 20026
Period Covered 1988 Pollution from the sub-division continued, although an abatement order was issued A reported “oil slick” on the lake was determined to be a diatom bloom of Asterionella
and Tabellaria
Period Covered 1989 Pollution from Baker Hill sub-division continued to be documented
Period Covered 1990 A severe algal bloom occurred in late summer and fall (SDT <1 m on 9/28/90) CT DEP and CT Department of Health Services (CT DHS) Lab identified Anabaena
as dominant alga in September.
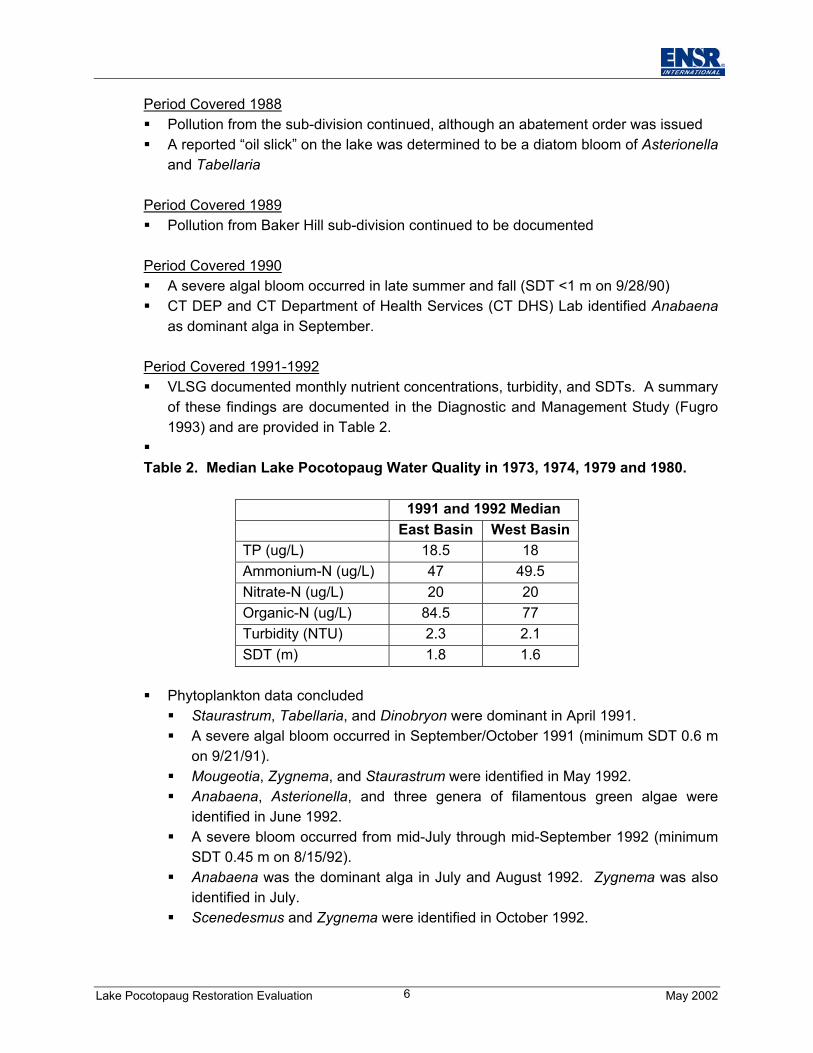
Period Covered 1991-1992 VLSG documented monthly nutrient concentrations, turbidity, and SDTs. A summary
of these findings are documented in the Diagnostic and Management Study (Fugro1993) and are provided in Table 2.
Table 2. Median Lake Pocotopaug Water Quality in 1973, 1974, 1979 and 1980.
1991 and 1992 MedianEast Basin West Basin
TP (ug/L) 18.5 18Ammonium-N (ug/L) 47 49.5Nitrate-N (ug/L) 20 20Organic-N (ug/L) 84.5 77Turbidity (NTU) 2.3 2.1SDT (m) 1.8 1.6
Phytoplankton data concluded Staurastrum, Tabellaria, and Dinobryon were dominant in April 1991. A severe algal bloom occurred in September/October 1991 (minimum SDT 0.6 m
on 9/21/91). Mougeotia, Zygnema, and Staurastrum were identified in May 1992. Anabaena, Asterionella, and three genera of filamentous green algae were
identified in June 1992. A severe bloom occurred from mid-July through mid-September 1992 (minimum
SDT 0.45 m on 8/15/92). Anabaena was the dominant alga in July and August 1992. Zygnema was also
identified in July. Scenedesmus and Zygnema were identified in October 1992.
Lake Pocotopaug Restoration Evaluation May 20027
Period Covered 1992-1993Fugro-McClelland, Inc (Fugro) prepared a Diagnostic and Management Study (D/M) forLake Pocotopaug. The results of seven sampling events from December 1992 untilSeptember 1993 were summarized, and management recommendations were provided.
The report compared 1992-1993 sampling results to previous studies. Water clarity wasgreater in 1993 in comparison to 1991-1992. An algal bloom in July did not occur.However, an algal bloom did occur in September. Dominant algae were Staurastrumand Anabaena. It was hypothesized that September blooms were the result of increasephosphorus released from the sediment during periods of anoxia. Differences in meanphosphorus concentrations from 1993 to 1991-1992 could not be made due to aquestionable laboratory measurement reported in 1993. Median surface values forammonium nitrogen and nitrate nitrogen were comparable to 1991-1992 values. Mediansurface organic nitrogen concentrations were higher in 1992-1993 than in 1991-1992.Median SDT was lower in 1991-1992. Median turbidity values were higher in 1991-1992than in 1992-1993. A hydrologic budget was prepared and is provided in Table 3.
A phosphorus loading analysis was performed based previous values presented in anunpublished work titled “Land Use and Phosphorus Input to Lake Pocotopaug” by theAHLAC, Land Use Subcommittee. This report was later published in 1995. Resultsfrom the Fugro analysis are provided below.
Areal Phosphorus Loading 1263 lbs/yr (0.277 g/m2 yr) 53% of totalIncludes watershed, waterfowl, and atmosphere
Internal Loading 1099 lbs/yr (0.518 g/m2 yr) 47% of total
Table 3. Diagnostic and Management Study Hydrologic Budget (Adapted fromFugro 1993).
Inputsa) Watershed runoff 6.63 x 10⁶ m3
b) Direct Precipitation 2.489 x 10⁶ m3
Lossesa) Outlet 7.647 x 10⁶ m3
b) Evaporation 1.472 x 10⁶ m3
Residence Time 0.78 yearsFlushing Rate 1.3 volumes/year(Assumed no negligible inputs or losses of groundwater and no change in storage volume)
Information from this study was used for portions of the ENSR phosphorus loadinganalysis.
Lake Pocotopaug Restoration Evaluation May 20028
Recommendations included Algacide treatment for short-term relief Phosphorus inactivation treatment of alum (aluminum sulfate) Aeration Biomanipulation to supplement other techniques Watershed Management – specifically altering the small pool in Hales Brook
to function as a sediment basin and follow through with the recommendationsset forth by the Land Use Subcommittee of the Lake Advisory Committee.The AHLAC document was still in preparation at the time of the Diagnosticand Management Study completion.
Publication: WMC Consulting Engineers (1995)Period Covered 1995A Stormwater Renovation and Management Study was conducted to
Document existing conditions of the stormwater drainage system around LakePocotopaug,
Review current regulations and ordinances, and Recommend improvements and control measures to reduce sediment, nutrient
and pollutant loading.
The Stormwater Renovation and Management Study provides an inventory of theexisting drainage systems and a list of areas requiring improvement. ENSR agrees withtheir recommendation although the recommendations are focused more on sedimentremoval and flood control than phosphorus. The same principles for sediment removal,however, often apply to phosphorus reduction. Specific recommendations regardingphosphorus removal are provided in Section 11 of this report.
Publication: Ad Hoc Lake Advisory Committee (1995)Period Covered –multiple years (phosphorus data from 1991-1992, zoning data from1989, etc.)Three reports were published in 1995 by the Ad Hoc Lake Advisory Committee
1. Land Use and Phosphorus Input to Lake Pocotopaug2. Taxes and Water Quality3. Lake Pocotopaug Management Recommendations
Land Use and Phosphorus Input to Lake PocotopaugThe land use and phosphorus report: uses simple phosphorus loading and transparency models to demonstrate
anthropogenic impacts to the lake, uses the models to predict trends in relation to changing land use, and suggests land use changes to reduce watershed impacts to the lake
Lake Pocotopaug Restoration Evaluation May 20029
The estimated phosphorus loading was as follows:61% from the watershed (791 lbs/yr)35% from the atmosphere (455 lbs/yr)4 % from waterfowl (43 lbs/yr)
The phosphorus export value predicted for the future was 1,817 lbs/yr, resulting in aspring in-lake mean TP concentration of 31 ug/L. Predicted water transparency was 0.6meters. Values in this report were used in ENSR calculations and for comparisonpurposes.
Taxes and Water QualityThe “Taxes and Water Quality” report pointed out that taxpayers with large quantities ofundeveloped land (> 15 ac) were paying substantially more (72% more) in taxes thanprior to 1991. The concern is that this increase would promote the development of openspace land. Potential future development will substantially increase phosphorus loadingto Lake Pocotopaug. An assessment of the applicability of the Open Space Provision ofthe Public Act 490 was made. The Open Space Provision, which is an optionalcomponent of the Public Act 490, would provide tax relief to open space landowners asdefined in a the planning commissions “Plan of Development”. Modification of thecurrent “Plan of Development” to include additional open space in Lake Pocotopaug’swatershed to be eligible for tax relief was recommended by the AHLAC, with hopes thatthis would discourage the development of open space.
Lake Pocotopaug Management RecommendationsThe Lake Pocotopaug Management Recommendation report was prepared to “1),reduce current inputs of eutrophication causing material to the lake, and 2), minimizefuture increases from future land use changes in the lake basin.” Three basicrecommendations were outlined:
1. Develop a Lake Advisory Committee devoted to develop and implementwater quality improvement programs,
2. Reduce nutrient and sediment inputs from the watershed through bestmanagement practices and reduce internal nutrient recycling, and
3. Develop and implement land use controls to reduce nutrient and sedimentinputs
Each of these recommendations was described in detail within the report. ENSR agreeswith their recommendations.
Lake Pocotopaug Restoration Evaluation May 200210
Major EventDecember 1999 – Fish killThe cause of the kill is unknown. Several species of all sizes were affected. There wasspeculation of Haptophytes causing the kill, but phytoplankton counts did not reveal apopulation of Haptophytes large enough to result in fish death. Water samples fromtributaries and within in the lake did not reveal the presence of toxic chemicals. Deadfish were collected and analyzed by the University of Connecticut (UCONN) and theUnited States Fish and Wildlife Survey. Toxicity results were non-conclusive.
Major EventJune 2000 – Alum Treatment/Fish KillAlum and sodium aluminate was applied to 22 acres beginning on June 2, 2000 toreduce the internal loading of phosphorus. Monitoring results indicated that pH andalkalinity values remained stable throughout the treatment and no stressed or dead fishwere observed.
A significant number of dead perch were observed the following day. Water testingresults indicated that pH and alkalinity levels were within desirable ranges. Analysis ofthe dead fish by the CT DEP and UCONN revealed elevated levels of aluminum in thefish gills.
Publication: ENSR (2001)Period Covered 2000-2001An analysis of the phosphorus inactivation issues at Lake Pocotopaug was performed byENSR which included:
An evaluation the alum treatment performed in June 2000, Fish bioassay with aluminum sulfate and sodium aluminate, and An evaluation of targeted aluminum dose
The laboratory fish bioassay was used to determine the acute impact of alum/aluminateratios on fathead minnows (Pimephales promulus). Results suggested that fish mortalitywas likely due to aluminum toxicity, specifically from sodium aluminate. A 2:1 ratio ofalum : sodium aluminate was suggested for future treatments, reducing the potential foraluminum toxicity in Lake Pocotopaug. The evaluation report is provided in Appendix A.
Major EventJune 2001 – Alum TreatmentThe treatment of 150 acres occurred in June 2001 using the suggested 2:1 alum:sodiumaluminate ratio and ½ the rate used in 2000. No stressed or dead fish were observedduring or shortly after the alum treatment. Lake users reported clearer water up untilAugust when an algal bloom occurred.
Lake Pocotopaug Restoration Evaluation May 200211
Major EventJanuary 2002– Fish SchoolingFish, specifically white and yellow perch, were observed in large numbers (severalthousand) in the two major tributaries (Christopher and Hales Brook) of LakePocotopaug. The fish were observed in tributaries shortly after ice had formed on thelake. Fish did not appear to be stressed (breathing rate appeared normal, no lesions orspots, etc). Fish were not collected for analysis. However water samples were takenfrom the lake and used in a biological assay. The assay involved toxicity testing withfathead minnows in Lake Pocotopaug water sampled on January 3, 2002. All fishexhibited normal behavior within the 48-hour test period. No fatalities were recorded.Water samples revealed ample oxygen (10.1 mg/L) and normal pH (6.8 SU).
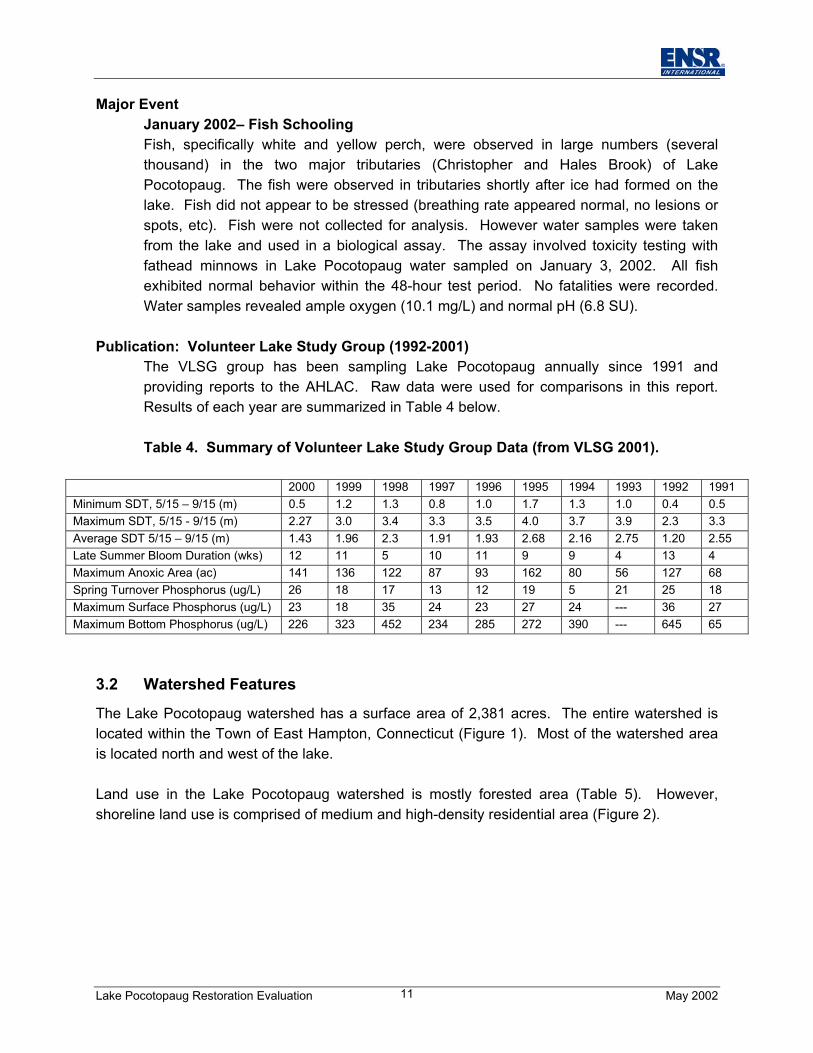
Publication: Volunteer Lake Study Group (1992-2001)The VLSG group has been sampling Lake Pocotopaug annually since 1991 andproviding reports to the AHLAC. Raw data were used for comparisons in this report.Results of each year are summarized in Table 4 below.
Table 4. Summary of Volunteer Lake Study Group Data (from VLSG 2001).
2000 1999 1998 1997 1996 1995 1994 1993 1992 1991Minimum SDT, 5/15 – 9/15 (m) 0.5 1.2 1.3 0.8 1.0 1.7 1.3 1.0 0.4 0.5Maximum SDT, 5/15 - 9/15 (m) 2.27 3.0 3.4 3.3 3.5 4.0 3.7 3.9 2.3 3.3Average SDT 5/15 – 9/15 (m) 1.43 1.96 2.3 1.91 1.93 2.68 2.16 2.75 1.20 2.55Late Summer Bloom Duration (wks) 12 11 5 10 11 9 9 4 13 4Maximum Anoxic Area (ac) 141 136 122 87 93 162 80 56 127 68Spring Turnover Phosphorus (ug/L) 26 18 17 13 12 19 5 21 25 18Maximum Surface Phosphorus (ug/L) 23 18 35 24 23 27 24 --- 36 27Maximum Bottom Phosphorus (ug/L) 226 323 452 234 285 272 390 --- 645 65
3.2 Watershed Features
The Lake Pocotopaug watershed has a surface area of 2,381 acres. The entire watershed islocated within the Town of East Hampton, Connecticut (Figure 1). Most of the watershed areais located north and west of the lake.
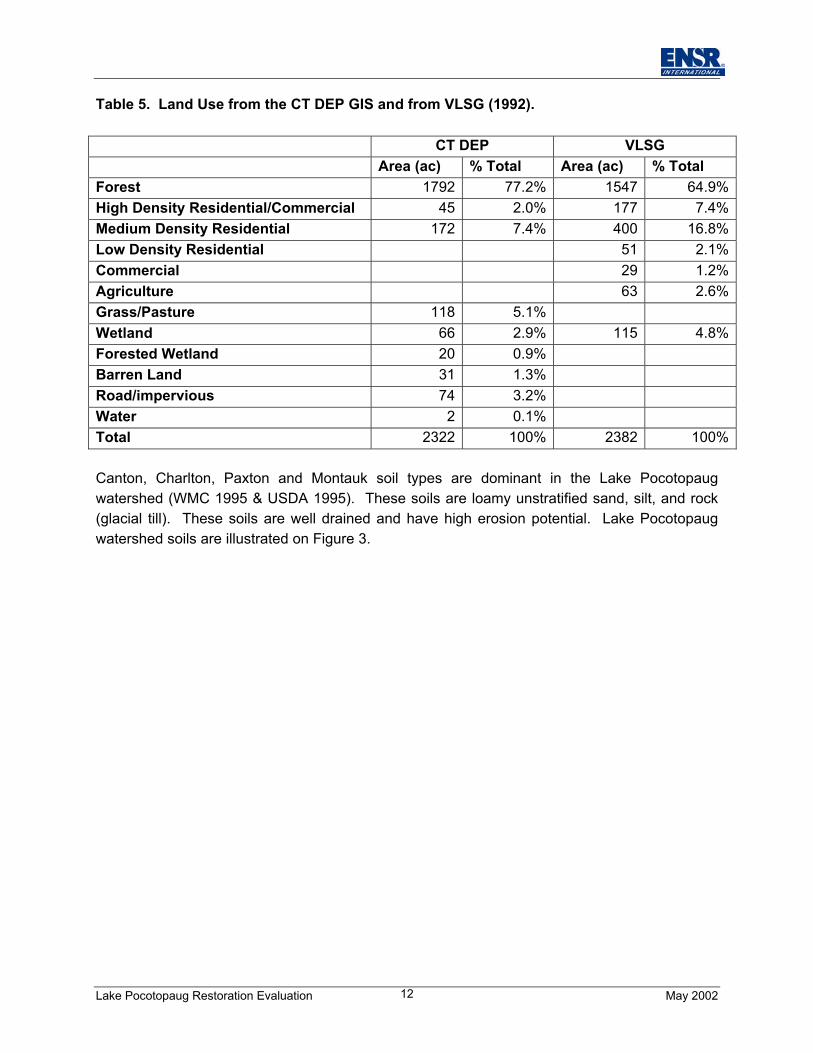
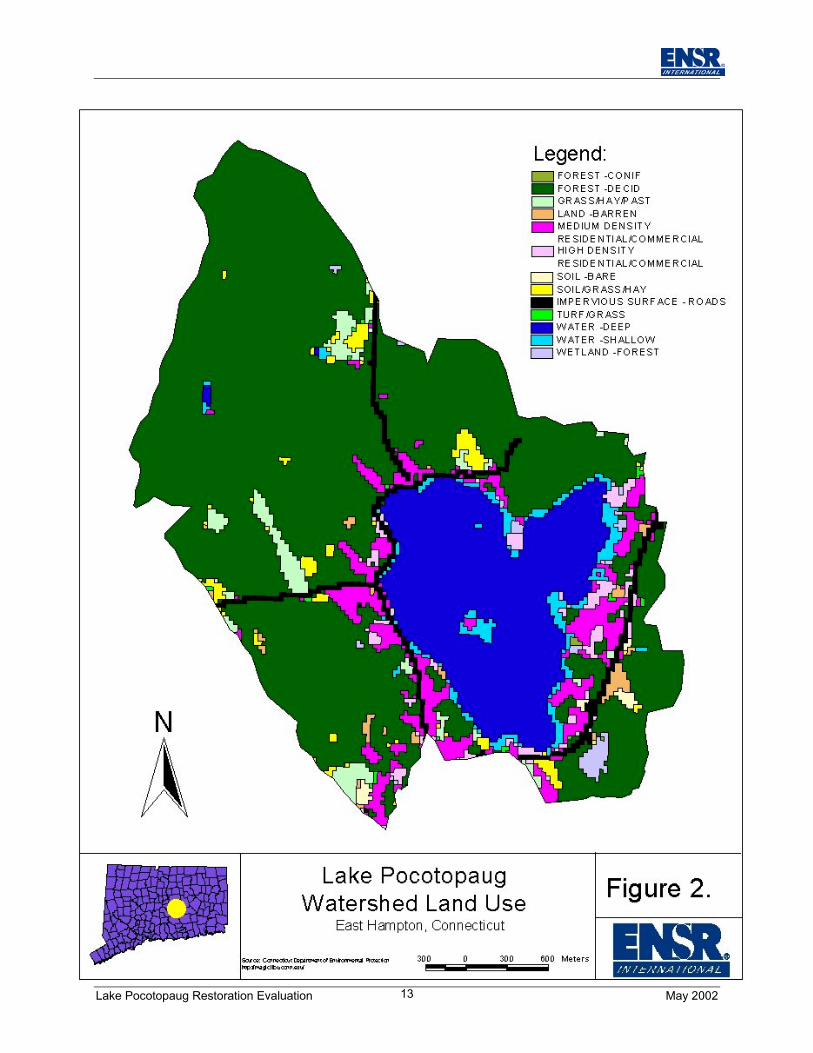
Land use in the Lake Pocotopaug watershed is mostly forested area (Table 5). However,shoreline land use is comprised of medium and high-density residential area (Figure 2).
Lake Pocotopaug Restoration Evaluation May 200212
Table 5. Land Use from the CT DEP GIS and from VLSG (1992).
CT DEP VLSGArea (ac) % Total Area (ac) % Total
Forest 1792 77.2% 1547 64.9%High Density Residential/Commercial 45 2.0% 177 7.4%Medium Density Residential 172 7.4% 400 16.8%Low Density Residential 51 2.1%Commercial 29 1.2%Agriculture 63 2.6%Grass/Pasture 118 5.1%Wetland 66 2.9% 115 4.8%Forested Wetland 20 0.9%Barren Land 31 1.3%Road/impervious 74 3.2%Water 2 0.1%Total 2322 100% 2382 100%
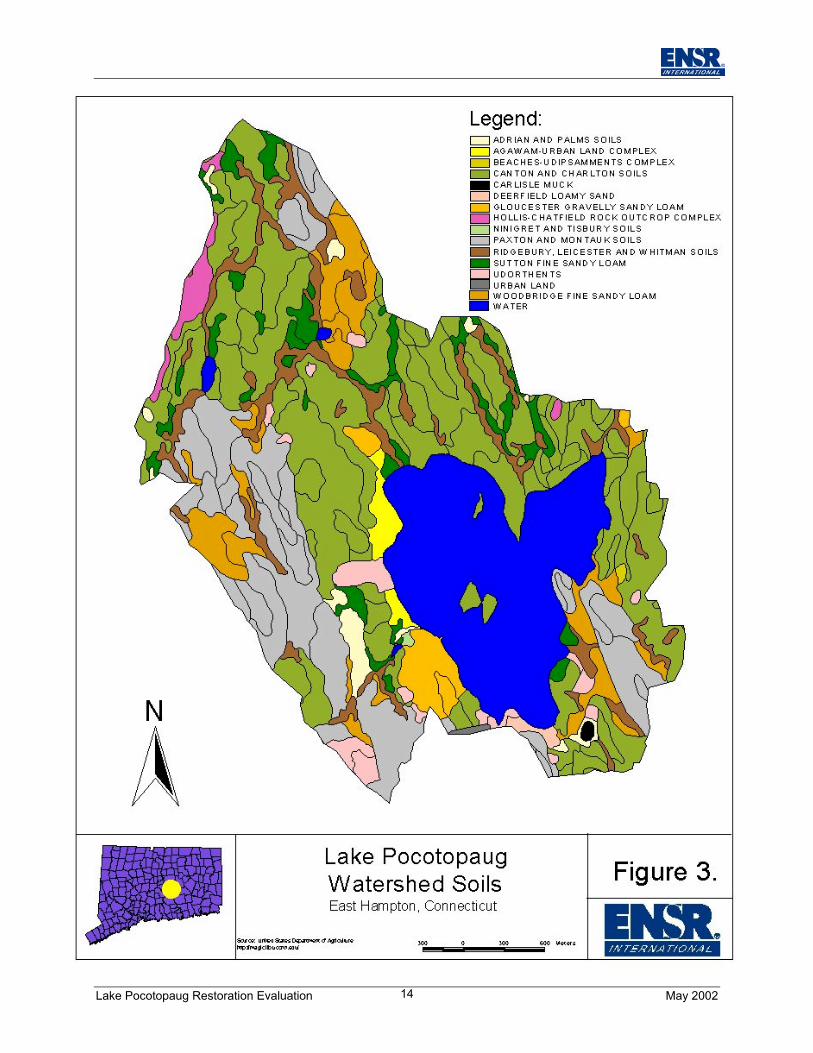
Canton, Charlton, Paxton and Montauk soil types are dominant in the Lake Pocotopaugwatershed (WMC 1995 & USDA 1995). These soils are loamy unstratified sand, silt, and rock(glacial till). These soils are well drained and have high erosion potential. Lake Pocotopaugwatershed soils are illustrated on Figure 3.
Lake Pocotopaug Restoration Evaluation May 200213
Lake Pocotopaug Restoration Evaluation May 200214
Lake Pocotopaug Restoration Evaluation May 200215
3.3 Lake Features
Lake Pocotopaug is an enlarged pond resulting from the construction of a dam in the 1700’s(Loomis 2002). Lake Pocotopaug has a surface area of 511.7 acres (Fugro 1993). Thewatershed:lake surface area ratio is 4.7:1.
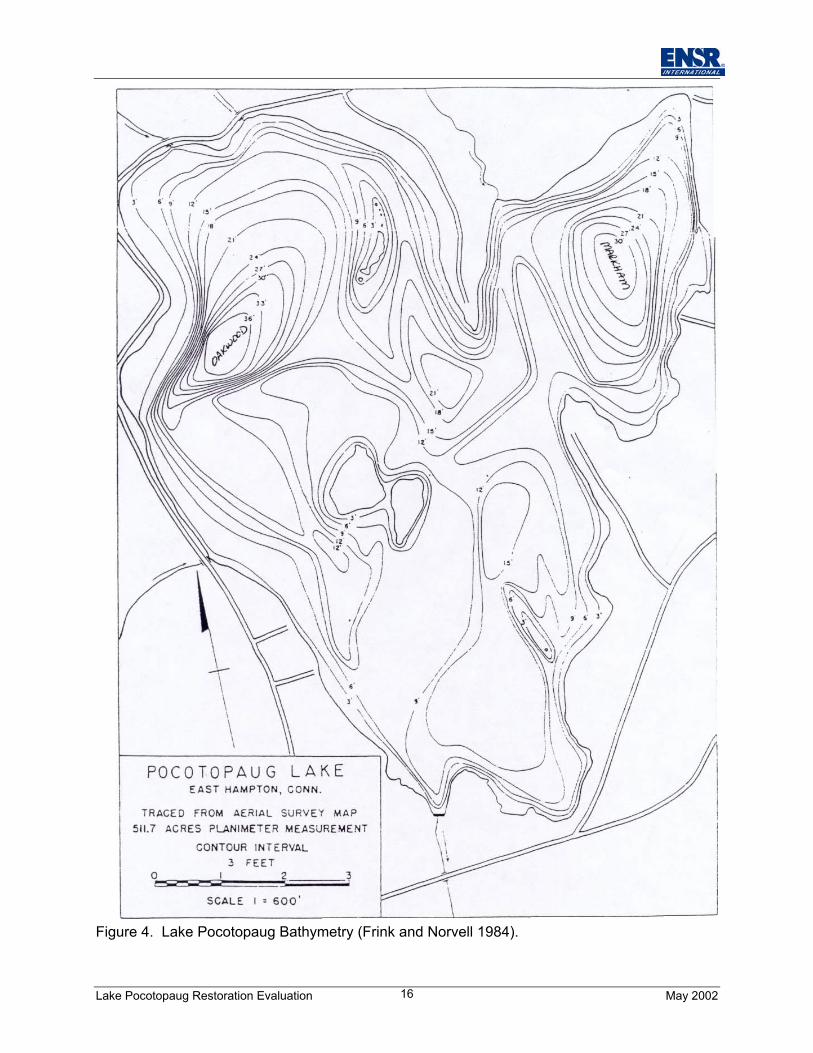
There are two deep basins located in the northern portion of the lake. The western basin,Oakwood, has a maximum depth of approximately 11 meters. The eastern basin isapproximately nine meters in depth. The latest bathymetric map, published in the Frink andNorvell (1984) report, is provided in Figure 4. The southern portion of the lake is relativelyshallow. Mean depth of Lake Pocotopaug is 3.4 meters. Lake volume varies depending on thereference publication. Fugro (1993) shows a lake volume of 7,131,805 m3, whereas the VLSGshows 7,132,239 m3 (7,132,000 m3 was used in calculations for this report).
Lake bathymetry is irregular due to islands, shoals and large rock outcrops. Boating can bedifficult for lake users not familiar with these areas. Slopes are steep within the Oakwood basinand moderate in the Markham basin. The shallow area to the south likely contributes to laketurbidity due to wind mixing. The littoral area is mostly composed of rock, sand, and gravel withmuck dominating in the deeper areas.
Recreational use of Lake Pocotopaug is extensive and varied. Boating of all kinds is verypopular. Motorized watercraft is the preferred method of transportation on the lake. There is apublic boat launch along the western shore. There are sandy beaches located on both theeastern and western shore for public and private use. Fishing is also popular at LakePocotopaug, and is generally practiced from boats. A Connecticut Trophy Award winningchannel catfish was caught in Lake Pocotopaug in 1999. Lake Pocotopaug was stocked withfingerling walleye in 2001 as part of a project to expand sport fishing diversity in the State ofConnecticut. Although a recent fishery study has not been performed in Lake Pocotopaug, thecurrent fish community is likely dominated by panfish (perch, bluegills, etc.). Recreationalactivities continue throughout the winter months with ice fishing, sailing, and skating. Asidefrom human uses, Lake Pocotopaug provides an ideal habitat for aquatic life. Plankton,vascular plants, amphibians, reptiles, invertebrates, fish, birds (both permanent and migratingspecies) and mammals depend on the lake as part of their habitat.
Lake Pocotopaug Restoration Evaluation May 200216
Figure 4. Lake Pocotopaug Bathymetry (Frink and Norvell 1984).
Lake Pocotopaug Restoration Evaluation May 200217
4.0 METHODS AND APPROACH
4.1 Quality Control and Quality Assurance
This Section presents the organization and objectives of the sampling activities and proceduresassociated with the Lake Pocotopaug, Lake and Watershed Restoration Evaluation. Specificprotocols for sampling, sample handling and storage, and laboratory and field analyses aredescribed. All QA/QC procedures were structured in accordance with applicable technicalstandards.
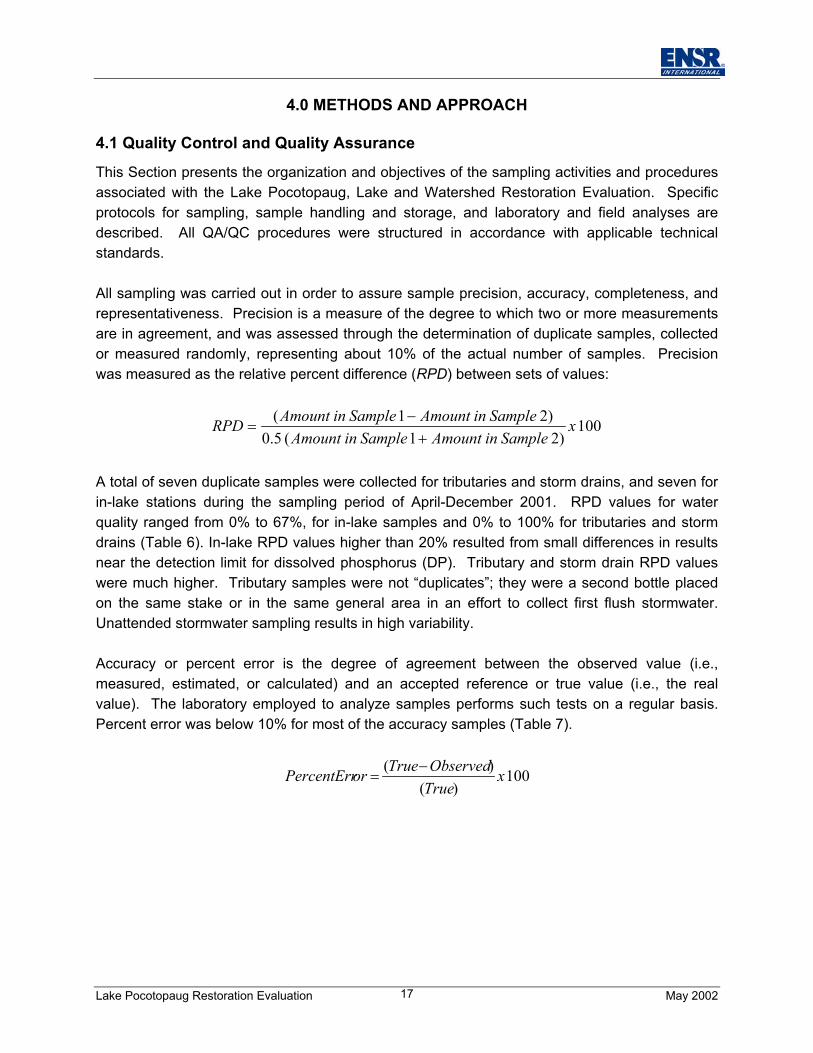
All sampling was carried out in order to assure sample precision, accuracy, completeness, andrepresentativeness. Precision is a measure of the degree to which two or more measurementsare in agreement, and was assessed through the determination of duplicate samples, collectedor measured randomly, representing about 10% of the actual number of samples. Precisionwas measured as the relative percent difference (RPD) between sets of values:
100 )2 1 ( 5.0
)2 1 ( xSampleinAmountSampleinAmountSampleinAmountSampleinAmountRPD
+−
=
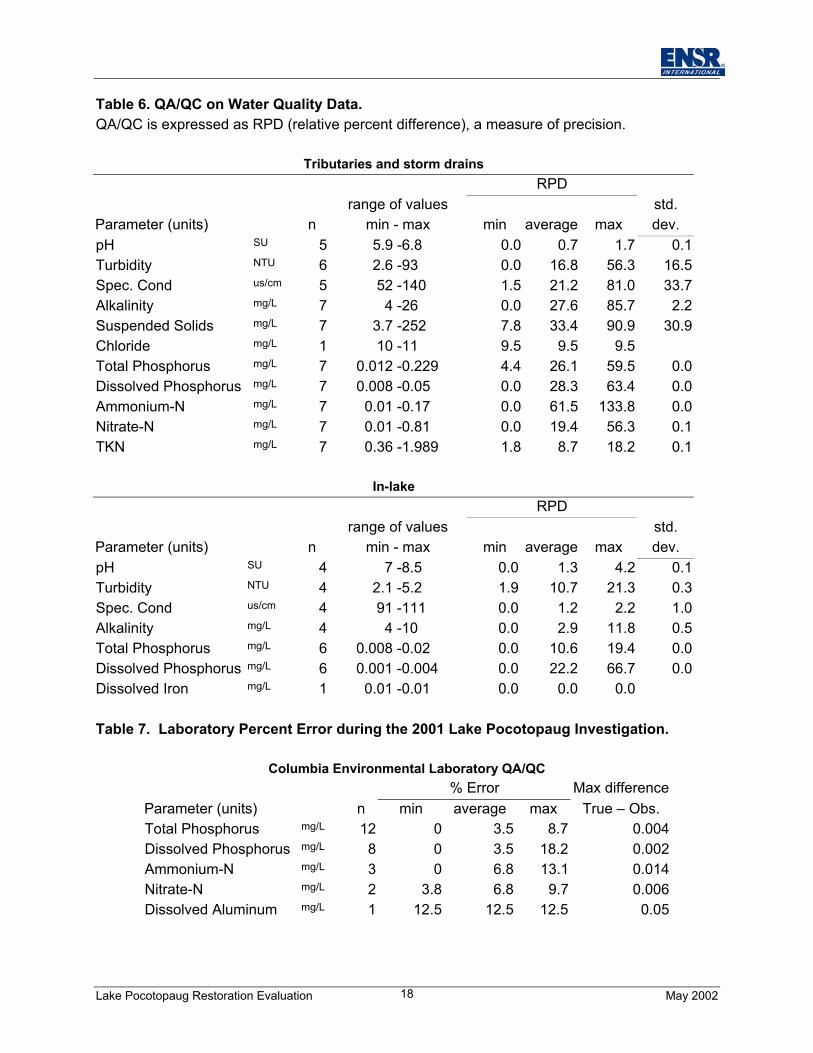
A total of seven duplicate samples were collected for tributaries and storm drains, and seven forin-lake stations during the sampling period of April-December 2001. RPD values for waterquality ranged from 0% to 67%, for in-lake samples and 0% to 100% for tributaries and stormdrains (Table 6). In-lake RPD values higher than 20% resulted from small differences in resultsnear the detection limit for dissolved phosphorus (DP). Tributary and storm drain RPD valueswere much higher. Tributary samples were not “duplicates”; they were a second bottle placedon the same stake or in the same general area in an effort to collect first flush stormwater.Unattended stormwater sampling results in high variability.
Accuracy or percent error is the degree of agreement between the observed value (i.e.,measured, estimated, or calculated) and an accepted reference or true value (i.e., the realvalue). The laboratory employed to analyze samples performs such tests on a regular basis.Percent error was below 10% for most of the accuracy samples (Table 7).
100 )(
)( xTrueObservedTrueorPercentErr −
=
Lake Pocotopaug Restoration Evaluation May 200218
Table 6. QA/QC on Water Quality Data.QA/QC is expressed as RPD (relative percent difference), a measure of precision.
Tributaries and storm drainsRPD
Parameter (units) nrange of values
min - max min average maxstd.dev.
pH SU 5 5.9 -6.8 0.0 0.7 1.7 0.1Turbidity NTU 6 2.6 -93 0.0 16.8 56.3 16.5Spec. Cond us/cm 5 52 -140 1.5 21.2 81.0 33.7Alkalinity mg/L 7 4 -26 0.0 27.6 85.7 2.2Suspended Solids mg/L 7 3.7 -252 7.8 33.4 90.9 30.9Chloride mg/L 1 10 -11 9.5 9.5 9.5Total Phosphorus mg/L 7 0.012 -0.229 4.4 26.1 59.5 0.0Dissolved Phosphorus mg/L 7 0.008 -0.05 0.0 28.3 63.4 0.0Ammonium-N mg/L 7 0.01 -0.17 0.0 61.5 133.8 0.0Nitrate-N mg/L 7 0.01 -0.81 0.0 19.4 56.3 0.1TKN mg/L 7 0.36 -1.989 1.8 8.7 18.2 0.1
In-lakeRPD
Parameter (units) nrange of values
min - max min average maxstd.dev.
pH SU 4 7 -8.5 0.0 1.3 4.2 0.1Turbidity NTU 4 2.1 -5.2 1.9 10.7 21.3 0.3Spec. Cond us/cm 4 91 -111 0.0 1.2 2.2 1.0Alkalinity mg/L 4 4 -10 0.0 2.9 11.8 0.5Total Phosphorus mg/L 6 0.008 -0.02 0.0 10.6 19.4 0.0Dissolved Phosphorus mg/L 6 0.001 -0.004 0.0 22.2 66.7 0.0Dissolved Iron mg/L 1 0.01 -0.01 0.0 0.0 0.0
Table 7. Laboratory Percent Error during the 2001 Lake Pocotopaug Investigation.
Columbia Environmental Laboratory QA/QC% Error Max difference
Parameter (units) n min average max True – Obs.Total Phosphorus mg/L 12 0 3.5 8.7 0.004Dissolved Phosphorus mg/L 8 0 3.5 18.2 0.002Ammonium-N mg/L 3 0 6.8 13.1 0.014Nitrate-N mg/L 2 3.8 6.8 9.7 0.006Dissolved Aluminum mg/L 1 12.5 12.5 12.5 0.05
Lake Pocotopaug Restoration Evaluation May 200219
Completeness is a measure of the amount of valid data obtained from a measurement systemcompared to the amount that was expected to be obtained under normal conditions (defined asthe conditions expected if the sampling plan was implemented as planned). Completeness iscalculated as
100 ) (
) ( xplannedtsmeasuremenofnumber
tsmeasuremenvalidofnumberssCompletene =
and was 100% for in-lake samples. Stormwater sampling was variable. A total of 46 samplerswere set to capture first flush stormwater. Of the 46, 35 filled and were analyzed, resulting in76% completeness. Samplers either did not fill enough or were washed away due to heavyflow.
Representativeness expresses the degree to which data accurately and precisely represent acharacteristic of a parameter, process, population, or environmental condition within a definedspatial and/or temporal boundary. Following the study design and applying the proper samplingtechniques and analytical testing maximized representativeness of the data collected. Wherechoices of stations to be sampled were made, effort was expended to ensure that those sitessampled were most representative of the conditions the study intended to assess.
4.2 Hydrology
Hydrological data for Lake Pocotopaug included water inputs from tributaries, groundwater,direct precipitation, and runoff from the watershed. The hydrology was linked to water qualitydata to evaluate pollutant loads. General runoff from the watershed and incoming water fromthe tributaries were estimated from a combination of actual flow data and yields frommathematical models based on watershed characteristics. Direct precipitation on LakePocotopaug was calculated as the average precipitation (1994-2001 = 124.4 cm) times the lakesurface area. Precipitation data were obtained from East Hampton/Colchester Water PollutionControl Plant and the Weather Underground web site. Ground water balance was estimated by:
1. using stormwater flow rate from the Environmental Protection Agency Rational Method(Q=CIA, where C=slope (0.05), I=rainfall intensity (1”/hr), and A=surface area (200 ac)),and
2. using a rate of 20 liters/m2/day multiplied by area assumed to contribute direct groundwaterflow (200 ac).
Information for physical characteristics of Lake Pocotopaug and its watershed were gatheredfrom the following:
Topography – United States Geological Survey (USGS) 7.5 minute topographic maps atMAGIC University of Connecticut Geographic Information Center web site
Watershed Delineation – Field investigations, previous reports, and United StatesGeological Survey (USGS) 7.5 minute topographic mapsLand Use – CT DEP at MAGIC UCONN Geographic Information Center web site
Lake Pocotopaug Restoration Evaluation May 200220
Soils – USDA at MAGIC UCONN Geographic Information Center web siteLake Bathymetry - Frink and Norvell (1984)Inlets, outlets, and stormwater pipes locations - field investigations, previous reports,
and review of USGS 7.5 minute topographic maps
Tributary flows were estimated in the field on most sampling visits to the lake by determiningcurrent velocity through a transect across the channel, with measured width and average depth.The width and average depth of the channel allows calculation of a cross-sectional area, andmultiplication of this area by the measured velocity yields a flow.
4.3 Water Quality
Water quality was determined for incoming surface (tributaries and storm water drainage pipes)and for in-lake water. Tributary and storm drain water quality samples were divided into twomajor categories: “dry weather” samples and “wet weather” samples. Dry weather is defined asa period of at least 72 hours (3 days) without any measurable precipitation, and wet weatherappropriate for sampling is defined as the first storm event that produces runoff (normally >0.2inches) after a minimum period of 72 hours with no precipitation. In-lake data were collectedonly during dry weather whereas tributaries and storm drains were sampled in both dry and wetweather.
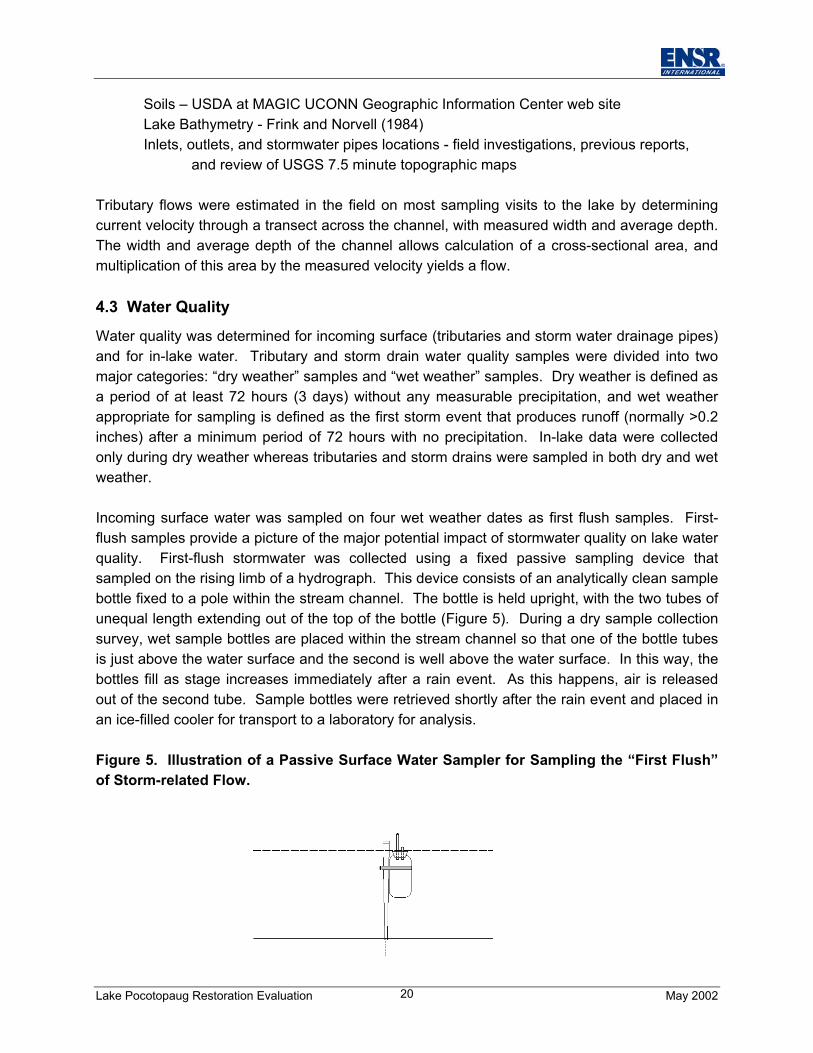
Incoming surface water was sampled on four wet weather dates as first flush samples. First-flush samples provide a picture of the major potential impact of stormwater quality on lake waterquality. First-flush stormwater was collected using a fixed passive sampling device thatsampled on the rising limb of a hydrograph. This device consists of an analytically clean samplebottle fixed to a pole within the stream channel. The bottle is held upright, with the two tubes ofunequal length extending out of the top of the bottle (Figure 5). During a dry sample collectionsurvey, wet sample bottles are placed within the stream channel so that one of the bottle tubesis just above the water surface and the second is well above the water surface. In this way, thebottles fill as stage increases immediately after a rain event. As this happens, air is releasedout of the second tube. Sample bottles were retrieved shortly after the rain event and placed inan ice-filled cooler for transport to a laboratory for analysis.
Figure 5. Illustration of a Passive Surface Water Sampler for Sampling the “First Flush”of Storm-related Flow.
Lake Pocotopaug Restoration Evaluation May 200221
Two bottles per station per sampling event were collected, one for in-situ measurement madeby ENSR and one for subsequent laboratory analysis without cross-contamination. All sampleswere promptly labeled and delivered to an analytical laboratory for analysis (ColumbiaEnvironmental Laboratory - CEL located in Columbia, CT or the State of ConnecticutDepartment of Public Health Division of Laboratory Services). The State Laboratory providedonly metal analyses; CEL provided limited metal analyses and all other analyses, which ENSRcould not perform. Lake and tributary samples were grab samples, representing conditions atthe sampling point at the time of collection.
In-situ measurements were made by ENSR during dry weather sampling for both in-lake andtributary stations. Table 8 lists the water quality variables measured by ENSR personnel andthe independent laboratory.
Lake Pocotopaug Restoration Evaluation May 200222
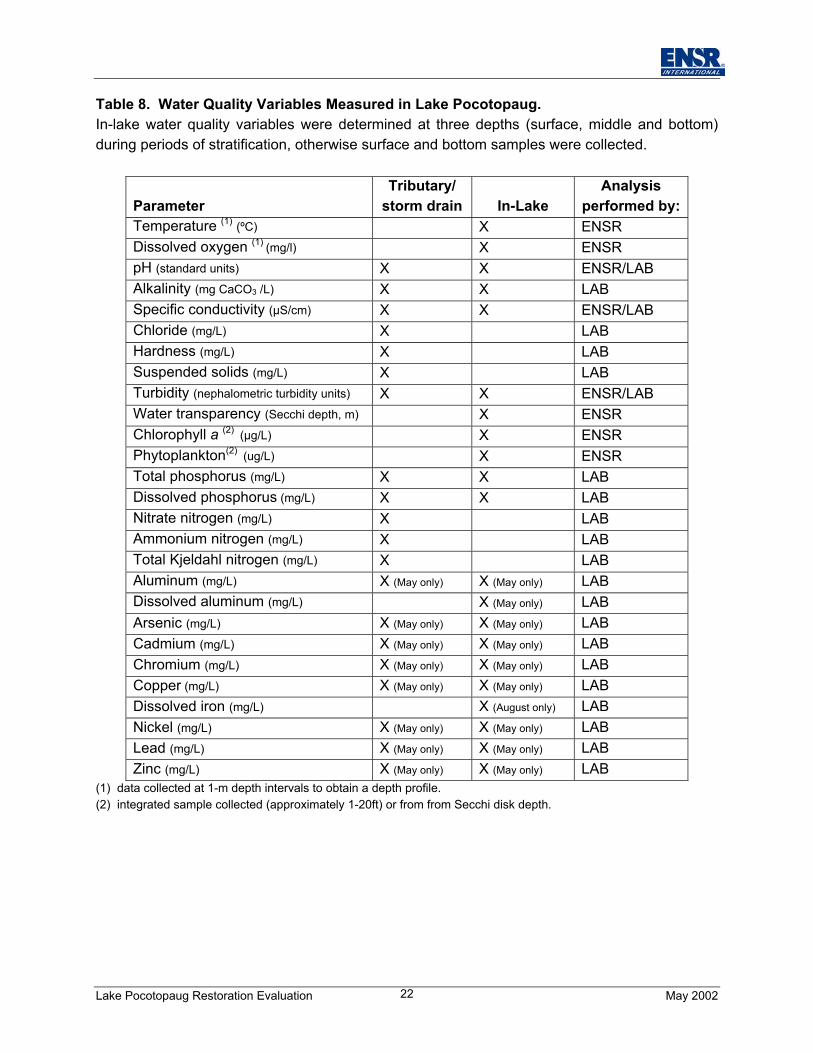
Table 8. Water Quality Variables Measured in Lake Pocotopaug.In-lake water quality variables were determined at three depths (surface, middle and bottom)during periods of stratification, otherwise surface and bottom samples were collected.
ParameterTributary/
storm drain In-LakeAnalysis
performed by:Temperature (1) (ºC) X ENSRDissolved oxygen (1) (mg/l) X ENSRpH (standard units) X X ENSR/LABAlkalinity (mg CaCO3 /L) X X LABSpecific conductivity (µS/cm) X X ENSR/LABChloride (mg/L) X LABHardness (mg/L) X LABSuspended solids (mg/L) X LABTurbidity (nephalometric turbidity units) X X ENSR/LABWater transparency (Secchi depth, m) X ENSRChlorophyll a (2) (µg/L) X ENSRPhytoplankton(2) (ug/L) X ENSRTotal phosphorus (mg/L) X X LABDissolved phosphorus (mg/L) X X LABNitrate nitrogen (mg/L) X LABAmmonium nitrogen (mg/L) X LABTotal Kjeldahl nitrogen (mg/L) X LABAluminum (mg/L) X (May only) X (May only) LABDissolved aluminum (mg/L) X (May only) LABArsenic (mg/L) X (May only) X (May only) LABCadmium (mg/L) X (May only) X (May only) LABChromium (mg/L) X (May only) X (May only) LABCopper (mg/L) X (May only) X (May only) LABDissolved iron (mg/L) X (August only) LABNickel (mg/L) X (May only) X (May only) LABLead (mg/L) X (May only) X (May only) LABZinc (mg/L) X (May only) X (May only) LAB
(1) data collected at 1-m depth intervals to obtain a depth profile.(2) integrated sample collected (approximately 1-20ft) or from from Secchi disk depth.
Lake Pocotopaug Restoration Evaluation May 200223
Lake Pocotopaug water quality was sampled on ten dates starting in April 2001. Two stations(LP-1 and LP-2, Figure 6) were sampled on each visit. At each site, samples were collected atthe surface (0-0.5 m) and near the bottom with the help of a Van Dorn sampler. Samples werecollected at the thermocline depth (usually 5-6 m) during periods of stratification. Water qualityvariables measured on site included pH, conductivity, and turbidity. Additionally, temperatureand dissolved oxygen (DO) profiles were determined at 1 m interval depths at each site. SDTwas also determined, and a depth-integrated (~ 6 m) water sample was collected at each sitefor chlorophyll a analysis and phytoplankton identification and quantification. Sampling namingconvention was as follows:
LP-1S or LP-2S – surface water samplesLP-1M or LP-2M – mid-depth (thermocline) water samplesLP-1B or LP-2B – bottom water samplesLP-1I or LP-2I – integrated water samples
Chlorophyll samples were filtered through a 0.45 µm glass fiber filter within 12 hours fromcollection and frozen until spectrophotometric determination of chlorophyll a content. Thesurface, mid- and bottom depth water samples were collected and sent to an independentanalytical laboratory for determination of total and dissolved phosphorus, and alkalinity.Dissolved and total aluminum was sampled in May. Dissolved aluminum was measured at allthree water depths and total aluminum was measured at the surface and bottom. Also inAugust, dissolved iron was measured at all three depths. Arsenic, cadmium, chromium, copper,nickel, lead, and zinc were measured in May at the surface and bottom.
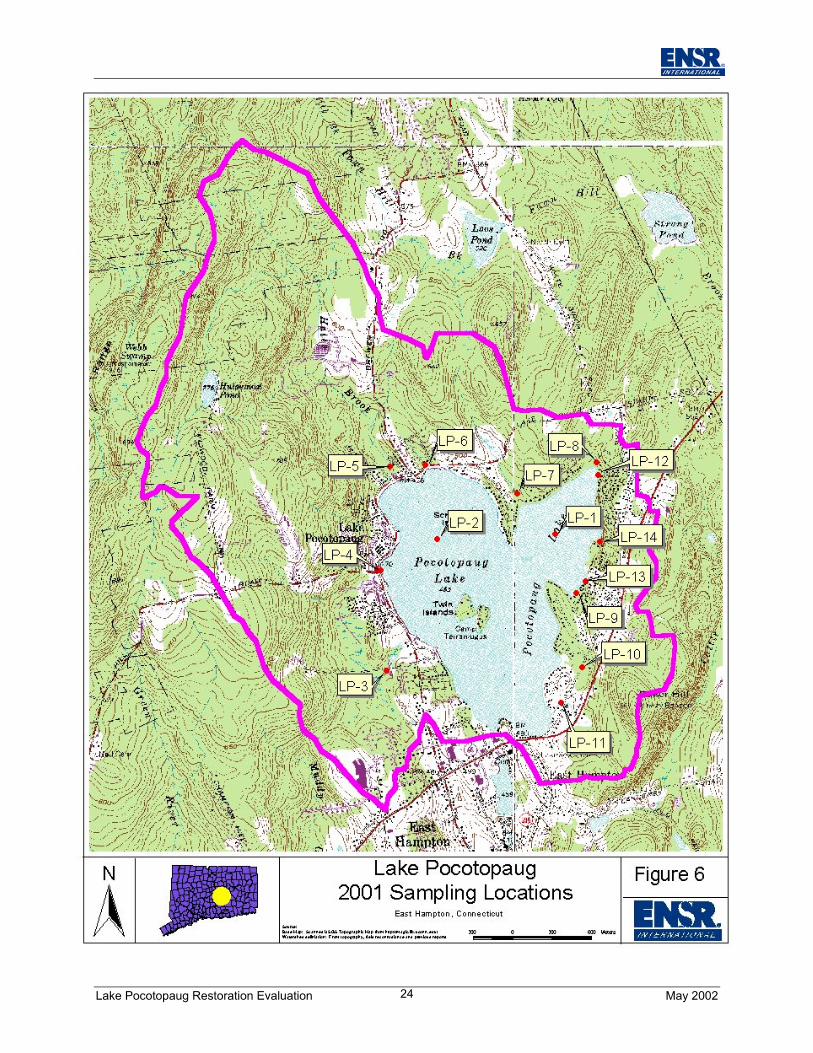
Tributaries and storm water pipes were sampled during four dry weather and four wet weathervisits. The first visit occurred in May 2001, when all potential stations were located, identified,and described. Actual sampling of the stations on subsequent dates was contingent uponexisting conditions (i.e., whether the station was active or not) and budgetary constraints.Location of the water quality sampling stations is provided in Figure 6.
A total of 60 samples were collected from tributaries and storm drains, not including QA/QCduplicates. Descriptions of the locations, corresponding VLSG sampling identifier, and drainageareas (VLSG 1992) are provided in Table 9.
Tributary stations were not sampled when flow was too low to cause any appreciablecontaminant load to the lake. Water quality variables included temperature, pH, DO,conductivity and turbidity (determined in the field by ENSR personnel), suspended solids,alkalinity, chloride, total and dissolved phosphorus, nitrate nitrogen, ammonium nitrogen, andtotal Kjeldahl nitrogen, and alkalinity (determined by an independent analytical laboratory).Aluminum, arsenic, cadmium, chromium, nickel, lead, and zinc were analyzed once during dryand once during wet weather.
Lake Pocotopaug Restoration Evaluation May 200224
Lake Pocotopaug Restoration Evaluation May 200225
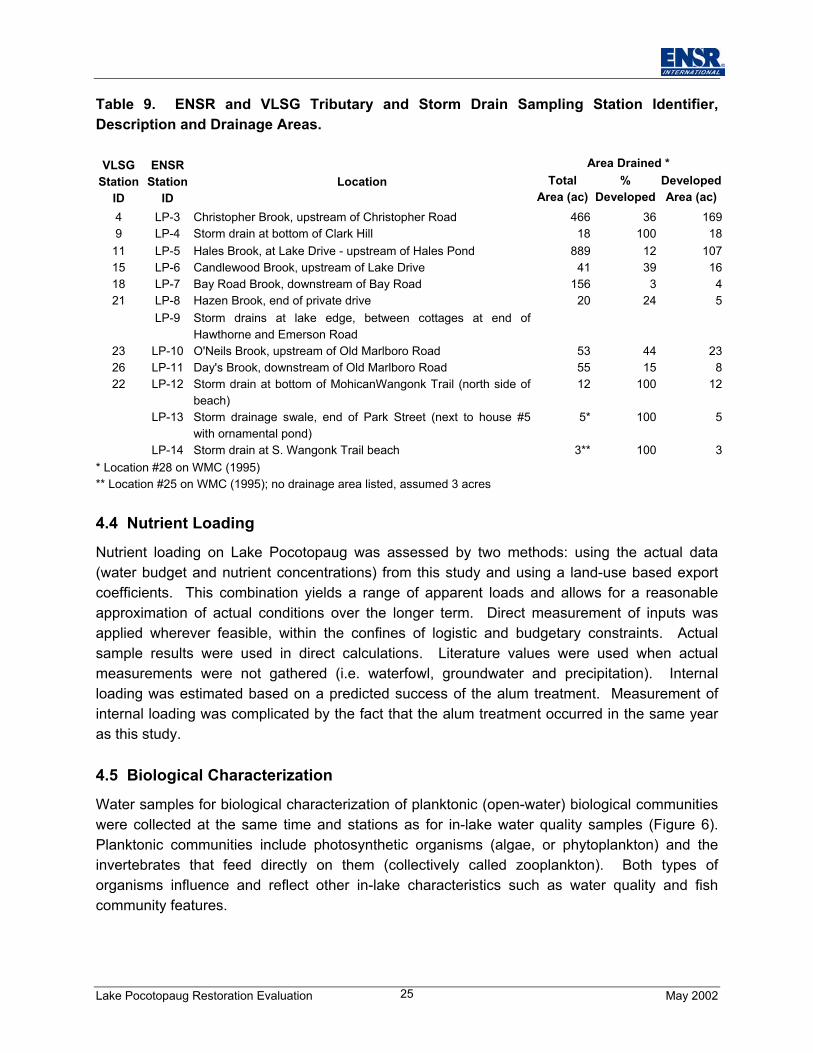
Table 9. ENSR and VLSG Tributary and Storm Drain Sampling Station Identifier,Description and Drainage Areas.
Area Drained *VLSGStation
ID
ENSRStation
IDLocation Total
Area (ac)%
DevelopedDevelopedArea (ac)
4 LP-3 Christopher Brook, upstream of Christopher Road 466 36 1699 LP-4 Storm drain at bottom of Clark Hill 18 100 18
11 LP-5 Hales Brook, at Lake Drive - upstream of Hales Pond 889 12 10715 LP-6 Candlewood Brook, upstream of Lake Drive 41 39 1618 LP-7 Bay Road Brook, downstream of Bay Road 156 3 421 LP-8 Hazen Brook, end of private drive 20 24 5
LP-9 Storm drains at lake edge, between cottages at end ofHawthorne and Emerson Road
23 LP-10 O'Neils Brook, upstream of Old Marlboro Road 53 44 2326 LP-11 Day's Brook, downstream of Old Marlboro Road 55 15 822 LP-12 Storm drain at bottom of MohicanWangonk Trail (north side of
beach)12 100 12
LP-13 Storm drainage swale, end of Park Street (next to house #5with ornamental pond)
5* 100 5
LP-14 Storm drain at S. Wangonk Trail beach 3** 100 3* Location #28 on WMC (1995)** Location #25 on WMC (1995); no drainage area listed, assumed 3 acres
4.4 Nutrient Loading
Nutrient loading on Lake Pocotopaug was assessed by two methods: using the actual data(water budget and nutrient concentrations) from this study and using a land-use based exportcoefficients. This combination yields a range of apparent loads and allows for a reasonableapproximation of actual conditions over the longer term. Direct measurement of inputs wasapplied wherever feasible, within the confines of logistic and budgetary constraints. Actualsample results were used in direct calculations. Literature values were used when actualmeasurements were not gathered (i.e. waterfowl, groundwater and precipitation). Internalloading was estimated based on a predicted success of the alum treatment. Measurement ofinternal loading was complicated by the fact that the alum treatment occurred in the same yearas this study.
4.5 Biological Characterization
Water samples for biological characterization of planktonic (open-water) biological communitieswere collected at the same time and stations as for in-lake water quality samples (Figure 6).Planktonic communities include photosynthetic organisms (algae, or phytoplankton) and theinvertebrates that feed directly on them (collectively called zooplankton). Both types oforganisms influence and reflect other in-lake characteristics such as water quality and fishcommunity features.
Lake Pocotopaug Restoration Evaluation May 200226
Phytoplankton samples were collected by filling a 6-m long, ¾ inch diameter plastic tube withlake water. The tube is immersed vertically, with a terminal weight maintaining the tube verticalposition throughout the water column. When the tube is full, the top end is sealed, the bottomend is retrieved and the content is emptied in a container. The water sample collected this wayis a composite sample of the water column from the surface to the length of the tube (~ 6 m inthis case). Because most of the phytoplankton community lives in the upper water layers of alake, samples collected this way were representative of the open-water algal community. Thecollected planktonic algae were preserved by addition of a few milliliters of Lugol’s solution.
Taxonomic identification and algal counts (density and biomass) were performed by an ENSRtaxonomist, and served as the basis for an expanded ecological discussion of phytoplankton(including community structure, relative abundances, species richness, diversity, and evenness)as related to water quality and other biological components of Lake Pocotopaug. Samples wereconcentrated and the concentrate was viewed in a counting chamber under phase contrastoptics at 400X power. Algae were identified, sized and enumerated, and a computer programconverted the raw data to density, either as cells/ml or biomass (µg/L).
Zooplankton were collected by means of a 53-µm mesh, funnel-shaped plankton net loweredthrough the water column to a depth of ~10 m, and slowly retrieved up to the water surface.The procedure was repeated at least three times for each sample, yielding a concentratedsample of almost 1000 L of lake water. The collected zooplankton were preserved by additionof a few drops of 25% glutaraldehyde solution.
Taxonomic identification and organism counts (density and biomass) were performed by anENSR taxonomist, and served as the basis for an expanded ecological discussion ofzooplankton (including community structure, relative abundance, size distribution, speciesrichness, diversity, and evenness) as related to water quality and other biological components ofLake Pocotopaug. Samples were concentrated and the concentrate was viewed in a countingchamber under brightfield optics at 100X power. Zooplankton were identified, sized andenumerated, and a computer program converted the raw data to density, either as individuals/Lor biomass (µg/L).
Lake Pocotopaug Restoration Evaluation May 200227
5.0 HYDROLOGIC INPUTS
The hydrology of the Lake Pocotopaug system is important to pollutant loading and ecologicalprocesses that make the lake what it is today. Ultimately, precipitation drives the hydrologicbudget, but water may enter the lake as direct precipitation, surface water runoff, direct groundwater seepage, or basal surface water flow (surface water derived from ground water thatenters streams). Some systems also have discharges in addition to the above natural sources,but no such discharges to Lake Pocotopaug are known. Water leaves the lake as surfaceoverflow, groundwater outseepage, or evaporation. Outputs were not calculated as part of thisinvestigation, but can be found in the Fugro (1993) report.
5.1 Precipitation
Precipitation in the East Hampton area averages about 1.24 m per year. This equates to 49.0inches per year. Precipitation landing on the watershed of Lake Pocotopaug must becomerunoff, base flow or groundwater before entering the lake, if it reaches the lake at all.Precipitation landing directly on Lake Pocotopaug amounts to 2.5 million cubic meters per year(2.5 x 10⁶ m3/yr = 1.24 m falling on 204.7 ha). This equates to a flow rate of just under 3 cubicfeet per second (cfs).
5.2 Groundwater
Groundwater flow was not specifically measured in this study. The most direct approach ofmeasuring inseepage and outseepage with seepage meters but was not within the scope of thisinvestigation. As ground water flow was not expected to be a major component of the inflow oroutflow, a simple calculation approach was considered appropriate. Bear in mind that groundwater pumped from wells is exported from the watershed in sewers, so groundwater will beeven less of a source of water (and contaminants) than under natural conditions in this case.
Groundwater flow was calculated by approximating the area of the watershed that contributesgroundwater to Lake Pocotopaug directly (approximately 200 acres) and multiplying this area bythe typical groundwater flow rate for this area of Connecticut (approximately 20 L/m2/d). Theirproduct results in an estimated groundwater input of 588,709 m3/yr. Another method is to usethe equation Q=CIA. This equation uses the product of the slope of the area contributing to thelake (0.05), the intensity of rainfall (1”/hr), and the area directly contributing to the lake (200 ac).Using Q=CIA, predicted groundwater flow is 891,127 m3/yr.
5.3 Surface Water
Surface water flow is often divided into base flow and storm flow, separated by the portion ofprecipitation landing on the watershed that runs off immediately (st orm flow) or seeps into theground but is later captured by streams. Field flow measurements were limited in this study,
Lake Pocotopaug Restoration Evaluation May 200228
where many measurements would have been necessary to characterize the many small inflowsto Lake Pocotopaug. Instead, calculations were applied using land use and expected waterexport coefficients.
The total annual water load (all inputs) to Lake Pocotopaug can be calculated based on the lakevolume (approximately 7,132,000 m3) and the flushing rate (approximately 1.25 volumes/year).Using these values, Lake Pocotopaug receives approximately 8,915,000 m3 of water per year.Subtracting precipitation and groundwater inputs yields an estimate of surface water inputs (5.5– 5.9 million cubic meters per year). Alternatively, a water flow rate per area can be applied tothe watershed to get similar results. Using a flow rate of 1.5 cfs/mi2 (typical runoff for this areaof Connecticut) in a 3.7 mi2 watershed yields a surface water input of approximately 5.6 millioncubic meters per year. Using both methods, a range of surface water input is generated (5.5 –5.9 million cubic meters/year).
Stormwater input can be calculated by multiplying an expected runoff coefficient by annualrainfall and area subject to precipitation. The runoff coefficient used in the WMC report was 0.3for residential land and seems reasonable for this watershed. Using 0.3, 1.2 meters ofprecipitation and the watershed area (9,636,008 m2), stormwater runoff is estimated to be 3.5million cubic meters per year.
Dry weather, or base flow, was estimated by subtracting stormwater flow from the total surfacewater input (2.0 – 2.4 million cubic meters). It was also calculated using the average flow ratemeasured during this investigation (0.3 cfs). The base flow was calculated to be 2.7 millioncubic meters, comparable to the value obtained through subtraction above.
Lake Pocotopaug Restoration Evaluation May 200229
6.0 WATER QUALITY
6.1 In-Lake Water Quality
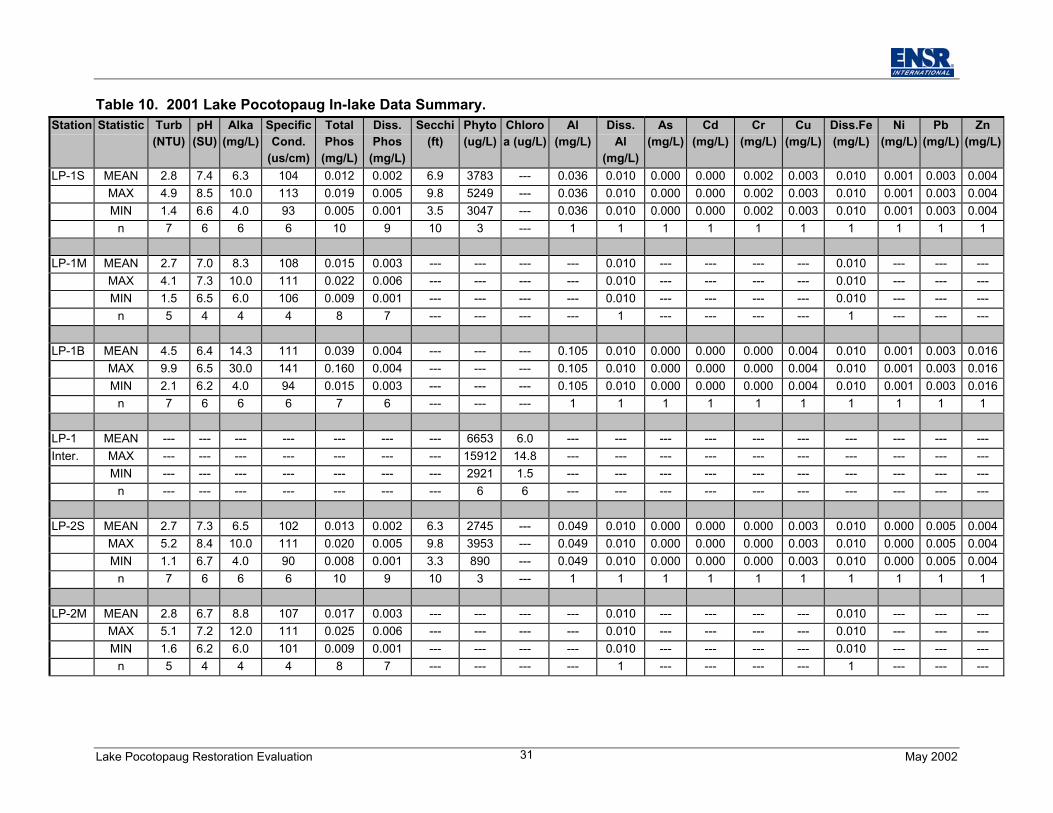
Temperature and DO profiles at the two in-lake stations during April-November 2001 arepresented in Figure 7. Other water quality data are summarized in Table 10. Values recordedbelow the detection limit are reported as ½ the detection limit. 2001 in-lake values for eachsampling and a summary of all data (previous reports and 2001 data) are provided in AppendixB.
Thermal stratification occurs when sunlight warms the upper waters but wind mixing isinsufficient to mix this warmer water all the way to the bottom of the waterbody. This is a naturalprocess, but has distinct implications for lake ecology, as the lower water layer can be a refugeor a detriment depending on how much oxygen is present. Lake Pocotopaug was beginning tothermally stratify in April 2001 and was almost destratified by September. The thermocline waspresent at five meters at LP-1 and at six meters at LP-2 in May. The thermocline dropped to 5.5and 6.5 meters at LP-1 and LP-2, respectively, come July and dropped another 0.5 meters inAugust. These results indicate that Lake Pocotopaug is a typical dimictic water body (twocomplete mixing events in spring and fall separated by summer thermal stratification).
Oxygen stratification roughly followed thermal stratification (Figure 7). DO readings below thethermocline were often less than 1.0 mg/L. DO below 1.0 mg/L was recorded above thethermocline at both stations (6 and 7 meters, respectively) in August. Anoxic conditions werealso recorded above the thermocline in June 2000 (VLSG 2001). DO readings of less than 6mg/l, undesirable for many aquatic life forms, were never recorded at depths above 5 m.
Turbidity is a measure of water clarity. Turbid waters are indicative of high levels of suspendedparticles that may include algal cells, silt, or resuspended sediments and are usually associatedwith poor water quality. Acceptable standards depend on water body use, but turbidity readingshigher than 10 nephalometric turbidity units (NTU) are indicative of potentially undesirable waterquality. Most “clean” New England lakes exhibit turbidity ranging from 1 to ~5 NTU. Maximumturbidity in Lake Pocotopaug surface water exceeded the 5 NTU threshold at LP-2 (5.2 NTUrecorded in August), but averages were below 5 NTU (2.8 and 2.7 NTU, Table 10).
Turbidity was higher near the sediment-water interface. Settling particles accumulating in thedeeper areas of the reservoir were likely responsible, though accidental stirring of finesediments by the sampling procedure could have contributed to the higher readings.
The pH varied little in time and space during the 2001 sampling (Table 10). pH ranged from 6.1to 8.5 SU, with the lower values measured near the bottom and the high values near thesurface. Mean pH ranged from 6.6 to 7.4 SU.
Lake Pocotopaug Restoration Evaluation May 200230
Figure 7. 2001 Temperature and Dissolved Oxygen Profiles.
Lake Pocotopaug Restoration Evaluation May 200231
Table 10. 2001 Lake Pocotopaug In-lake Data Summary.Station Statistic Turb
(NTU)pH
(SU)Alka
(mg/L)SpecificCond.
(us/cm)
TotalPhos
(mg/L)
Diss.Phos
(mg/L)
Secchi(ft)
Phyto(ug/L)
Chloroa (ug/L)
Al(mg/L)
Diss.Al
(mg/L)
As(mg/L)
Cd(mg/L)
Cr(mg/L)
Cu(mg/L)
Diss.Fe(mg/L)
Ni(mg/L)
Pb(mg/L)
Zn(mg/L)
LP-1S MEAN 2.8 7.4 6.3 104 0.012 0.002 6.9 3783 --- 0.036 0.010 0.000 0.000 0.002 0.003 0.010 0.001 0.003 0.004MAX 4.9 8.5 10.0 113 0.019 0.005 9.8 5249 --- 0.036 0.010 0.000 0.000 0.002 0.003 0.010 0.001 0.003 0.004MIN 1.4 6.6 4.0 93 0.005 0.001 3.5 3047 --- 0.036 0.010 0.000 0.000 0.002 0.003 0.010 0.001 0.003 0.004
n 7 6 6 6 10 9 10 3 --- 1 1 1 1 1 1 1 1 1 1
LP-1M MEAN 2.7 7.0 8.3 108 0.015 0.003 --- --- --- --- 0.010 --- --- --- --- 0.010 --- --- ---MAX 4.1 7.3 10.0 111 0.022 0.006 --- --- --- --- 0.010 --- --- --- --- 0.010 --- --- ---MIN 1.5 6.5 6.0 106 0.009 0.001 --- --- --- --- 0.010 --- --- --- --- 0.010 --- --- ---
n 5 4 4 4 8 7 --- --- --- --- 1 --- --- --- --- 1 --- --- ---
LP-1B MEAN 4.5 6.4 14.3 111 0.039 0.004 --- --- --- 0.105 0.010 0.000 0.000 0.000 0.004 0.010 0.001 0.003 0.016MAX 9.9 6.5 30.0 141 0.160 0.004 --- --- --- 0.105 0.010 0.000 0.000 0.000 0.004 0.010 0.001 0.003 0.016MIN 2.1 6.2 4.0 94 0.015 0.003 --- --- --- 0.105 0.010 0.000 0.000 0.000 0.004 0.010 0.001 0.003 0.016
n 7 6 6 6 7 6 --- --- --- 1 1 1 1 1 1 1 1 1 1
LP-1 MEAN --- --- --- --- --- --- --- 6653 6.0 --- --- --- --- --- --- --- --- --- ---Inter. MAX --- --- --- --- --- --- --- 15912 14.8 --- --- --- --- --- --- --- --- --- ---
MIN --- --- --- --- --- --- --- 2921 1.5 --- --- --- --- --- --- --- --- --- ---n --- --- --- --- --- --- --- 6 6 --- --- --- --- --- --- --- --- --- ---
LP-2S MEAN 2.7 7.3 6.5 102 0.013 0.002 6.3 2745 --- 0.049 0.010 0.000 0.000 0.000 0.003 0.010 0.000 0.005 0.004MAX 5.2 8.4 10.0 111 0.020 0.005 9.8 3953 --- 0.049 0.010 0.000 0.000 0.000 0.003 0.010 0.000 0.005 0.004MIN 1.1 6.7 4.0 90 0.008 0.001 3.3 890 --- 0.049 0.010 0.000 0.000 0.000 0.003 0.010 0.000 0.005 0.004
n 7 6 6 6 10 9 10 3 --- 1 1 1 1 1 1 1 1 1 1
LP-2M MEAN 2.8 6.7 8.8 107 0.017 0.003 --- --- --- --- 0.010 --- --- --- --- 0.010 --- --- ---MAX 5.1 7.2 12.0 111 0.025 0.006 --- --- --- --- 0.010 --- --- --- --- 0.010 --- --- ---MIN 1.6 6.2 6.0 101 0.009 0.001 --- --- --- --- 0.010 --- --- --- --- 0.010 --- --- ---
n 5 4 4 4 8 7 --- --- --- --- 1 --- --- --- --- 1 --- --- ---
Lake Pocotopaug Restoration Evaluation May 200232
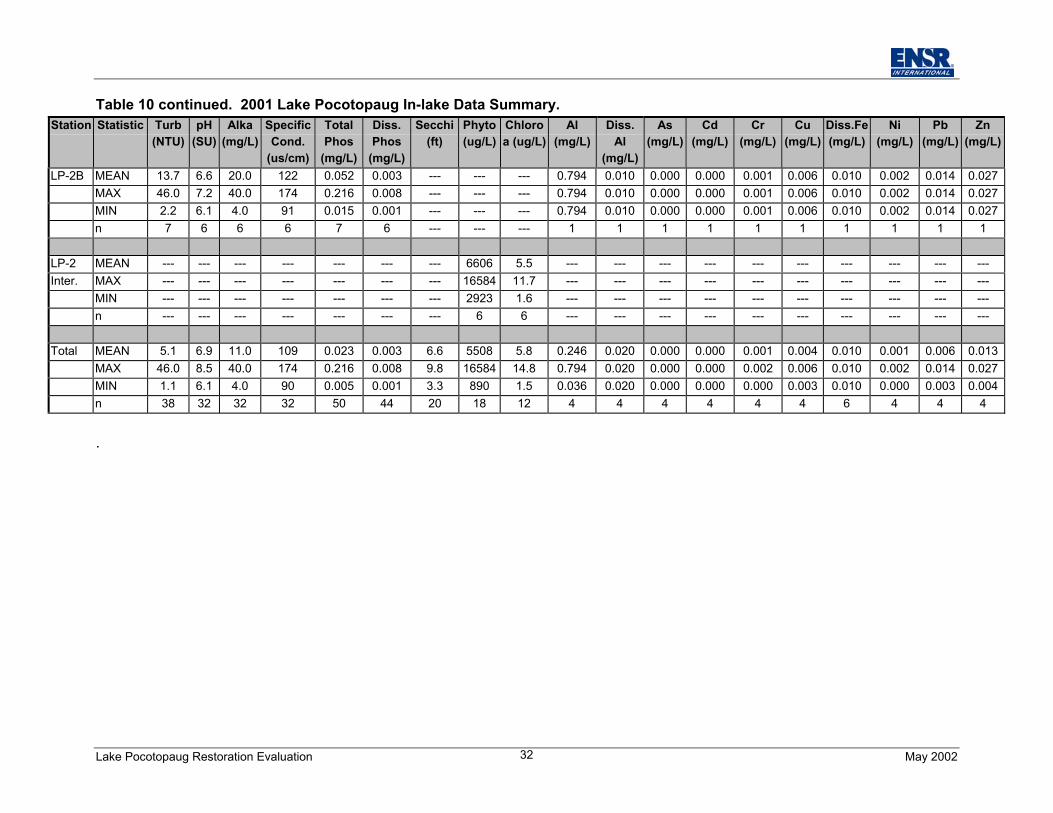
Table 10 continued. 2001 Lake Pocotopaug In-lake Data Summary.Station Statistic Turb
(NTU)pH
(SU)Alka
(mg/L)SpecificCond.
(us/cm)
TotalPhos
(mg/L)
Diss.Phos
(mg/L)
Secchi(ft)
Phyto(ug/L)
Chloroa (ug/L)
Al(mg/L)
Diss.Al
(mg/L)
As(mg/L)
Cd(mg/L)
Cr(mg/L)
Cu(mg/L)
Diss.Fe(mg/L)
Ni(mg/L)
Pb(mg/L)
Zn(mg/L)
LP-2B MEAN 13.7 6.6 20.0 122 0.052 0.003 --- --- --- 0.794 0.010 0.000 0.000 0.001 0.006 0.010 0.002 0.014 0.027MAX 46.0 7.2 40.0 174 0.216 0.008 --- --- --- 0.794 0.010 0.000 0.000 0.001 0.006 0.010 0.002 0.014 0.027MIN 2.2 6.1 4.0 91 0.015 0.001 --- --- --- 0.794 0.010 0.000 0.000 0.001 0.006 0.010 0.002 0.014 0.027n 7 6 6 6 7 6 --- --- --- 1 1 1 1 1 1 1 1 1 1
LP-2 MEAN --- --- --- --- --- --- --- 6606 5.5 --- --- --- --- --- --- --- --- --- ---Inter. MAX --- --- --- --- --- --- --- 16584 11.7 --- --- --- --- --- --- --- --- --- ---
MIN --- --- --- --- --- --- --- 2923 1.6 --- --- --- --- --- --- --- --- --- ---n --- --- --- --- --- --- --- 6 6 --- --- --- --- --- --- --- --- --- ---
Total MEAN 5.1 6.9 11.0 109 0.023 0.003 6.6 5508 5.8 0.246 0.020 0.000 0.000 0.001 0.004 0.010 0.001 0.006 0.013MAX 46.0 8.5 40.0 174 0.216 0.008 9.8 16584 14.8 0.794 0.020 0.000 0.000 0.002 0.006 0.010 0.002 0.014 0.027MIN 1.1 6.1 4.0 90 0.005 0.001 3.3 890 1.5 0.036 0.020 0.000 0.000 0.000 0.003 0.010 0.000 0.003 0.004n 38 32 32 32 50 44 20 18 12 4 4 4 4 4 4 6 4 4 4
.
Lake Pocotopaug Restoration Evaluation May 200233
Alkalinity remained at constant low values (range 4-12 mg/l) at surface and mid-depths in LakePocotopaug in 2001 (Table 10). Bottom values were higher but averages did not exceed 20mg/L. Alkalinity values in 2001 were comparable to previous years. Alkalinity is a measure ofthe buffering capacity of water, its ability to absorb H+ ions without major oscillations in pH thatmay impact the biota. Alkalinity values lower than 2 mg/l indicate no buffering capacity; valuesbetween 2 and 20 mg/l suggest limited buffering capacity. High buffering capacity exists foralkalinity values higher than ~50 mg/l. The low alkalinity in Lake Pocotopaug is consideredtypical range and does not suggest the occurrence of water quality problems at the lake orwatershed scale.
Specific conductivity in 2001 ranged from 90 to 174 µS/cm (Table 10). Mean conductivityranged from 102 to 122 µS/cm. Again, higher values were recorded at the bottom. Conductivityis a measure of the ion concentration in the water, and indirectly of total dissolved solids. The100 µS/cm is considered the threshold below which a water body is likely to be nutrient-poor, asonly a small portion of the dissolved solids are nutrients. Contaminated or fertile lakes, wherenutrient-driven phytoplankton blooms are likely to occur, are characterized by higherconductivity readings (often above 300 µS/cm), although it is possible to have high conductivityand low fertility with a lot of non-nutrient solids.
Water transparency is typically measured as SDT. SDT corresponds to the depth at which lightintensity is approximately 10% of the surface value (Wetzel 1983), thus approximatelydelimitating the range of the photic zone (i.e., where photosynthesis can occur). SDT isassociated with light scattering by particulate matter in suspension, including algae (Carlson1977; Wetzel 1983). SDT can be used as a general measure of lake condition, with depthsgreater than 4 m indicating desirable water quality and depths less than 1 m indicatingundesirable water quality (Carlson 1977). Carlson’s lower threshold is similar to theConnecticut’s Water Quality Standard for mesotrophic lakes (2 – 6 m during the summer).
Water transparency or SDT in Lake Pocotopaug was less than desirable in 2001 (Table 10).Maximum SDT was 3 meters, below the 4 meter desirable threshold. Minimum transparencywas recorded at LP-2 in August (1 m). On average, SDT in 2001 was 2.1 and 1.9 meters forLP-1 and LP-2 respectively. LP-2 often has slightly lower transparencies than LP-1. Minimumtransparencies ranged from 0.4 to 1.7 meters from 1991-2000. Maximum transparencies frommid-May to mid-September in 1991-2000 ranged from 2.3 to 4.0 meters. The greatest SDTswere typically recorded during mid to the end of June (2001 was no exception). However,maximum transparency was recorded in early July in 1997, 1998 and 2000.
Phosphorus is usually the nutrient limiting freshwater photosynthetic organisms, including algae(Hecky & Kilham 1988). Total phosphorus (TP) includes all forms of phosphorus in the watercolumn, from readily absorbable dissolved orthophosphates to refractory particulatephosphorus. TP is often used as a measure of a lake trophic state (Carlson 1977). Surface TPconcentrations below 0.01 mg/l are usually associated with clear water and lack of appreciable

Lake Pocotopaug Restoration Evaluation May 200234
phytoplankton biomass (Wetzel 1983). Nuisance algal blooms and other eutrophication-relatedproblems often occur at TP concentrations above the 0.025-0.030 mg/l threshold (Carlson 1977;Mitchell 2000).
Surface TP concentrations during the 2001 ranged from 0.005 mg/L to 0.019 mg/L at LP-1(average 0.012 mg/L). LP-2 surface TP concentrations ranged from 0.008 to 0.020 mg/L(average 0.013 mg/L). Lake Pocotopaug experiences algal blooms even at these low TPconcentrations. Maximum surface phosphorus concentrations for 1991-2000 ranged from 0.018to 0.036 mg/L. Bottom and mid depth TP concentrations were higher than at the surface.Maximum mid-depth TP concentrations for 2001 ranged from 0.009 – 0.025 mg/L (LP-1 average0.015 and LP-2 average 0.017 mg/L). Bottom TP concentrations in 2001 ranged from 0.015 –0.216 mg/L (LP-1 average 0.039 and LP-2 average 0.052). Maximum TP bottomconcentrations for 1991-2000 ranged from 0.065 – 0.645 mg/L. Figures 8 and 9 display therange of TP values from 1991-2001.
Statistically, there was a significant difference (P< 0.05) in mean summer TP at LP-1B in 2001from 1992, 1994, 1997 and 1998. There was a statistical difference (P< 0.05) in mean summerTP at LP-2B in 2001 from 1998. From these data, one might conclude that the alum treatmentin 2001 was not effective in reducing the internal load, since 6 or the 9 pre-alum treatment yearswere not significantly different than 2001 (post-treatment). However, bottom TP sampling canbe highly variable if particulate material from sediments is present in the sample. Comparingdissolved phosphorus would be a better measure of the efficacy of the alum treatment.Unfortunately, dissolved phosphorus values for 1991-2000 are not available. Summer surfaceand mid-depth TP were not significantly different in 2001 from 1991-2000.
Dissolved phosphorus (DP) refers to the soluble portion of TP (inorganic and organic). DP ismore readily available to aquatic organisms than particulate phosphorus, and may be a moreaccurate variable for predicting water quality than TP. However, methodologic consistency overthe years has led to most relationships being based on TP. Because of the lack of referenceconcentration values for DP, the 0.010-0.025 mg/l TP reference values are used here, but DPmay be cycled so rapidly as to suggest that the presence of measurable DP is a negative sign.As for TP, DP concentration values below the detection limit were reported as ½ the detectionlimit.
Surface DP concentrations during the 2001 ranged from below the 0.001 mg/L detection limit to0.005 mg/L at both stations (averages were both 0.002 mg/L). DP was not measured in 1991-2000. A similar analysis was performed, ortho-phosphosphate, but is not directly comparable.Ortho-phosphate is phosphate that is not associated with organic material. However, ameasurement of ortho-phosphate does not include polyphosphates, another form of inorganicphosphates, which DP does. Ortho-phosphate was measured in 1991, 1992 and 1995.Surface ortho-phosphate values ranged from below the 0.002 mg/L detection limit to 0.030 mg/L
Lake Pocotopaug Restoration Evaluation May 200235
Figure 8. Annual Total Phosphorus from 1991-2001
Outlier
95 Percentile75 PercentileMean
Lake Pocotopaug Restoration Evaluation May 200236
Figure 9. Annual June, July and August Total Phosphorus.
Lake Pocotopaug Restoration Evaluation May 200237
(average LP-1 = 0.003 and LP-2 =0.005 mg/L). 2001 bottom and mid-depth DP concentrationswere higher than at the surface. Maximum mid-depth DP concentrations were 0.006 mg/L forboth stations averages were identical (0.005 mg/L) as well. Average mid-depth ortho-phosphate for 1991, 1992, and 1995 were 0.016 and 0.030 mg/L for LP-1 and LP-2,respectively. Bottom DP concentrations in 2001 ranged below the 0.001 mg/L detection limit to0.008 mg/L. Average DP bottom concentrations were 0.004 and 0.003 mg/L for LP-1 and LP-2,respectively. Maximum ortho-phosphate bottom concentrations for 1991, 1992 and 1995ranged from less than the 0.001 mg/L detection limit to 0.370 mg/L.
Nitrogen is a nutrient that also may be limiting for aquatic organisms such as algae and plants.Nitrogen exists in lakes in many forms. The most important forms of readily absorbable nitrogenare nitrate (NO3
-) and ammonium (NH4+) (Wetzel 1983). Both forms are unlikely to cause water
quality problems such as algal blooms at concentrations below 0.3 mg/l, but problems mayoccur at concentrations above 1 mg/l. Nitrogen was not measured in-lake as part of thisinvestigation. Previous reports suggest that phosphorus is the limiting nutrient in this systemand therefore our focus was phosphorus. Nitrogen values reported in previous studies areprovided in Appendix B. Maximum values did not exceed the 1.0 mg/L threshold, but didexceed 0.3 mg/L.
Total Kjeldahl nitrogen (TKN) is a measure of ammonium-N and organic nitrogen forms presentin the water column. Low (<0.5 mg/l) TKN concentrations are usually indicative of desirablewater quality, with problems such as algal blooms unlikely to occur. Concentrations higher than2 mg/l are indicative of undesirable water quality, with a substantial transition range in betweenthose thresholds. Like nitrate and ammonium nitrogen, TKN was not included in the 2001investigation. Values of TKN from previous reports can be found on Appendix B. In summary,TKN mean values in Lake Pocotopaug exceeded the “low” threshold at mid and bottom depths.The 2.0 mg/L threshold was exceeded at station LP-m at mid-depth.
While phosphorus usually determines phytoplankton biomass (quantity of suspended algae), theN:P ratio often determines phytoplankton species composition (Wetzel 1983). When N:P ishigher than 15:1 (by weight), the water body is typically phosphorus-limited, and green algae(Chlorophyta) are typically favored over blue-greens (Cyanophyta) because of their moreefficient phosphorus uptake (Lee 1989). When N:P is lower than 7:1 (by weight), nitrogenlimitation occurs, and most blue-greens, which can fix dissolved gaseous nitrogen (N2), arefavored over green algae (Lee 1989). When nutrient levels are high overall, nuisance blue-green blooms are more likely to occur. Intermediate N:P ratios are less conclusive forphytoplankton species composition predictions, but algal species have distinct preferences andthe type of algae found is usually a function of nutrient ratios (Tilman 1982).
Using data from previous studies, N:P ratios for Lake Pocotopaug surface waters were 0.5:1 to188:1, with a median value of 37:1. Mid-depth ratios ranged from 1:1 to 311:1, with a medianvalue of 46:1. Bottom ratios ranged from 1:1 to 182:1, with a median ration of 25:1. Ratios
Lake Pocotopaug Restoration Evaluation May 200238
below 7:1 occurred on September 22, 1993 at surface and mid depths and occurred in May,August, and September in 1993 at the bottom.
The trophic state of Lake Pocotopaug, determined as Carlson’s (1977) trophic state index (TSI)from July and August SDT, surface TP, and chlorophyll a (chl a) values was typical ofmesotrophic conditions (intermediate nutrient levels) during summer stratification. TSI valueshigher than 60 are indicative of degraded (eutrophic) conditions, while TSI values below 40typically apply to oligotrophic lakes (Carlson 1977). Mitchell (2000) proposes a TSI=70threshold for contact recreation. TSI for all categories were below 60 but above 40.
Using July and August data from 1991-2001, the trophic state of Lake Pocotopaug, asdetermined from the State of Connecticut Water Quality Standards, is mesotrophic,(intermediate nutrient levels). Table 11 compares Lake Pocotopaug range of means with StateWater Quality Standards for mesotrophic conditions.
Table 11. Lake Pocotopaug July and August Range of Annual Means and Water QualityStandards for Mesotrophic Lakes in Connecticut.
Mesotrophic Standard Lake PocotopaugAnnual Mean Range
(July and August)TP 10-30 ug/L spring and summer 11-23TN 200-600 ug/L spring and summer 440Chl a 2-15 ug/L mid summer 5.5-7.4SDT 2-6 meters mid summer 0.7-3.5
Dissolved iron provides a measure of the potential of a water body to limit phosphorus internalloading. Ferrous iron (Fe++) is often released from anoxic sediments along with dissolvedphosphorus (DP). Ferric iron (Fe+++) is the dominant form of iron in the presence of oxygen, andforms from Fe++. Iron tends to bind with phosphorus during this conversion and, because of lowsolubility, iron phosphates precipitate to the sediment.
Dissolved iron concentrations just above the water-sediment interface provide a measure of thepotential for release of sediment-bound phosphorus and its return to the sediments. Dissolvediron values much higher than 1.0 mg/l are often indicative of substantial redox activity in thesediments, whereby chemical oxidation-reduction reactions can allow certain contaminants tobe released from the sediment back into the water column. However, dissolved iron in excessof ten times the DP level is usually sufficient to precipitate out all DP under oxic conditions, sophosphorus released by this mechanism will not necessarily be available for algal uptake andgrowth.

Lake Pocotopaug Restoration Evaluation May 200239
Dissolved iron concentrations at the water-sediment interface in Lake Pocotopaug wasmeasured in August 2001. Values were low, below the 0.01 mg/L detection limit at both stationsand all water depths (Table 10). These low values in the summer suggest a low phosphorusbinding capacity in Lake Pocotopaug.
Total and dissolved aluminum were analyzed in 2001 prior to the alum treatment. Totalaluminum ranged from 0.036 to 0.794 mg/L. Dissolved aluminum was below the detection limit.Aluminum is not list on the State of Connecticut Water Quality Standard Numerical Criteria, butthese values are consider relatively low. In addition, arsenic, cadmium, chromium, copper,nickel, lead, and zinc were analyzed in May 2001. All values were low (Table 10) and suggestno water column metal contamination in Lake Pocotopaug.
6.2 Tributary and Storm Drain Water Quality
2001 water quality data for tributaries and storm drains are presented for both dry and wetweather in Table 12. Data collected in March of 2001 by the CT DHS are included in thissummary. Locations of the incoming water stations are given in Figure 6 and Table 9.
Generally, stormwater sampling resulted in higher concentrations with the exception of pH,chloride, hardness, conductivity and nitrate. This may indicate that there are constant sources,which are being diluted during precipitation, and/or precipitation itself (acid rain) is loweringthese values.
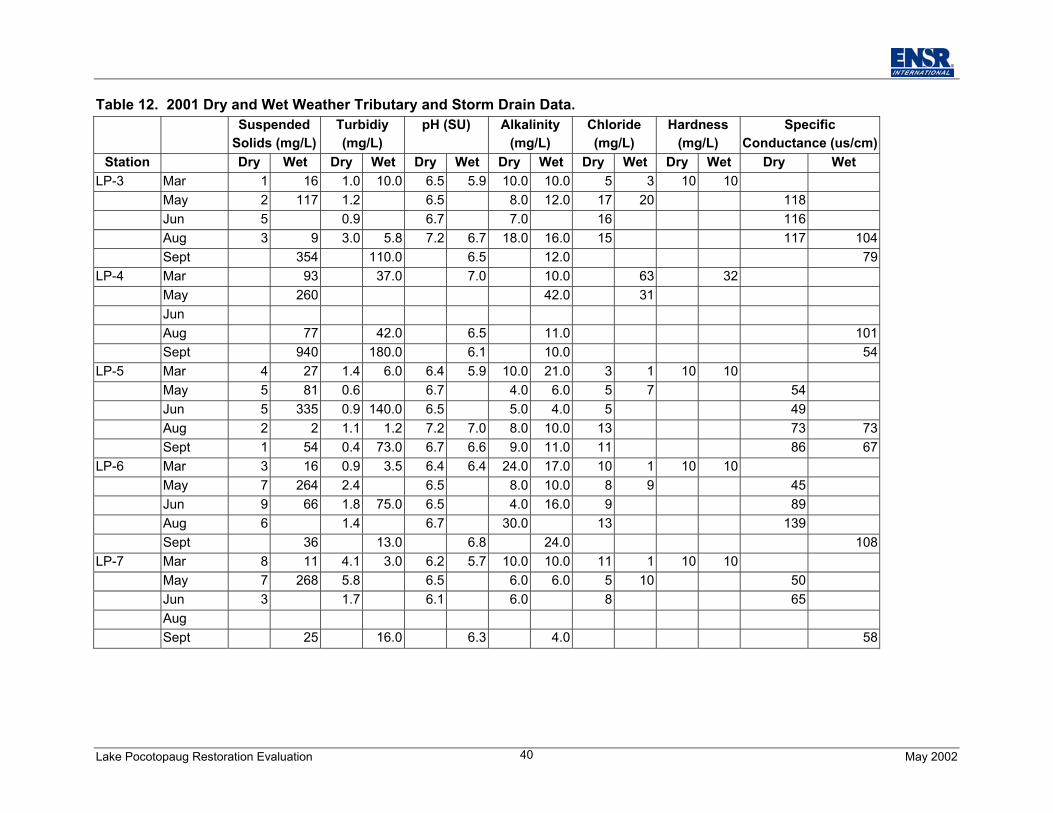
Lake Pocotopaug Restoration Evaluation May 200240
Table 12. 2001 Dry and Wet Weather Tributary and Storm Drain Data.Suspended
Solids (mg/L)Turbidiy(mg/L)
pH (SU) Alkalinity(mg/L)
Chloride(mg/L)
Hardness(mg/L)
SpecificConductance (us/cm)
Station Dry Wet Dry Wet Dry Wet Dry Wet Dry Wet Dry Wet Dry WetLP-3 Mar 1 16 1.0 10.0 6.5 5.9 10.0 10.0 5 3 10 10
May 2 117 1.2 6.5 8.0 12.0 17 20 118Jun 5 0.9 6.7 7.0 16 116Aug 3 9 3.0 5.8 7.2 6.7 18.0 16.0 15 117 104Sept 354 110.0 6.5 12.0 79
LP-4 Mar 93 37.0 7.0 10.0 63 32May 260 42.0 31JunAug 77 42.0 6.5 11.0 101Sept 940 180.0 6.1 10.0 54
LP-5 Mar 4 27 1.4 6.0 6.4 5.9 10.0 21.0 3 1 10 10May 5 81 0.6 6.7 4.0 6.0 5 7 54Jun 5 335 0.9 140.0 6.5 5.0 4.0 5 49Aug 2 2 1.1 1.2 7.2 7.0 8.0 10.0 13 73 73Sept 1 54 0.4 73.0 6.7 6.6 9.0 11.0 11 86 67
LP-6 Mar 3 16 0.9 3.5 6.4 6.4 24.0 17.0 10 1 10 10May 7 264 2.4 6.5 8.0 10.0 8 9 45Jun 9 66 1.8 75.0 6.5 4.0 16.0 9 89Aug 6 1.4 6.7 30.0 13 139Sept 36 13.0 6.8 24.0 108
LP-7 Mar 8 11 4.1 3.0 6.2 5.7 10.0 10.0 11 1 10 10May 7 268 5.8 6.5 6.0 6.0 5 10 50Jun 3 1.7 6.1 6.0 8 65AugSept 25 16.0 6.3 4.0 58
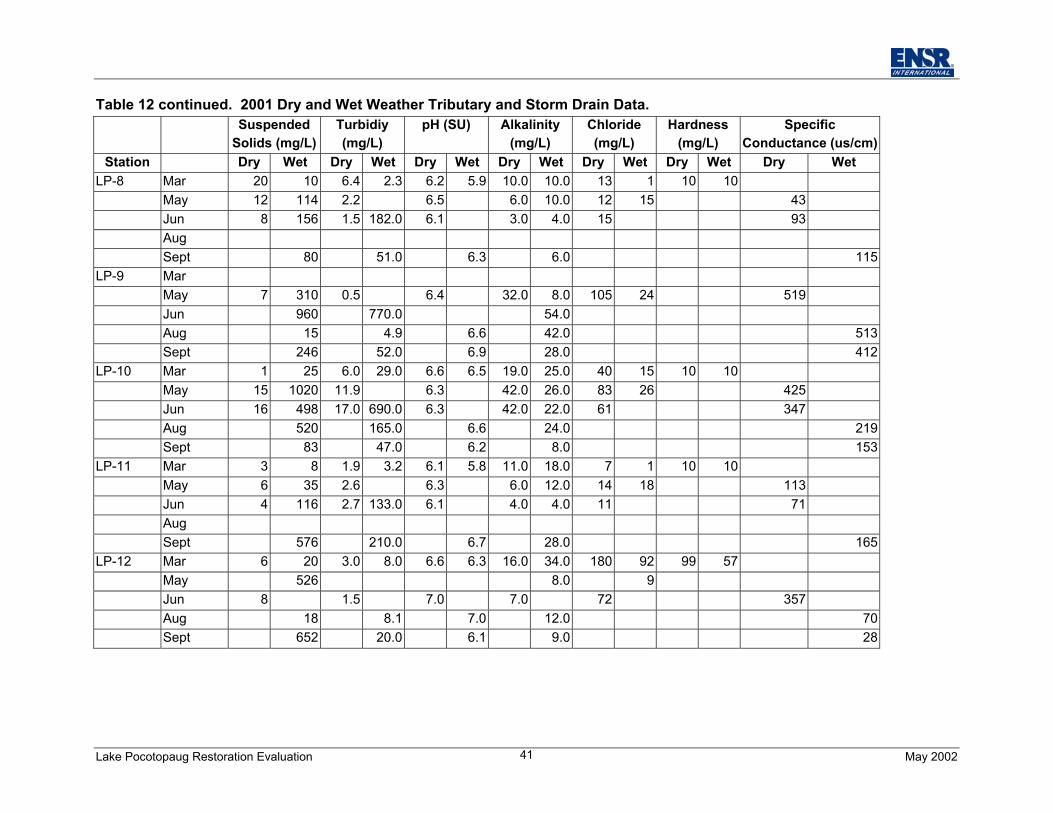
Lake Pocotopaug Restoration Evaluation May 200241
Table 12 continued. 2001 Dry and Wet Weather Tributary and Storm Drain Data.Suspended
Solids (mg/L)Turbidiy(mg/L)
pH (SU) Alkalinity(mg/L)
Chloride(mg/L)
Hardness(mg/L)
SpecificConductance (us/cm)
Station Dry Wet Dry Wet Dry Wet Dry Wet Dry Wet Dry Wet Dry WetLP-8 Mar 20 10 6.4 2.3 6.2 5.9 10.0 10.0 13 1 10 10
May 12 114 2.2 6.5 6.0 10.0 12 15 43Jun 8 156 1.5 182.0 6.1 3.0 4.0 15 93AugSept 80 51.0 6.3 6.0 115
LP-9 MarMay 7 310 0.5 6.4 32.0 8.0 105 24 519Jun 960 770.0 54.0Aug 15 4.9 6.6 42.0 513Sept 246 52.0 6.9 28.0 412
LP-10 Mar 1 25 6.0 29.0 6.6 6.5 19.0 25.0 40 15 10 10May 15 1020 11.9 6.3 42.0 26.0 83 26 425Jun 16 498 17.0 690.0 6.3 42.0 22.0 61 347Aug 520 165.0 6.6 24.0 219Sept 83 47.0 6.2 8.0 153
LP-11 Mar 3 8 1.9 3.2 6.1 5.8 11.0 18.0 7 1 10 10May 6 35 2.6 6.3 6.0 12.0 14 18 113Jun 4 116 2.7 133.0 6.1 4.0 4.0 11 71AugSept 576 210.0 6.7 28.0 165
LP-12 Mar 6 20 3.0 8.0 6.6 6.3 16.0 34.0 180 92 99 57May 526 8.0 9Jun 8 1.5 7.0 7.0 72 357Aug 18 8.1 7.0 12.0 70Sept 652 20.0 6.1 9.0 28
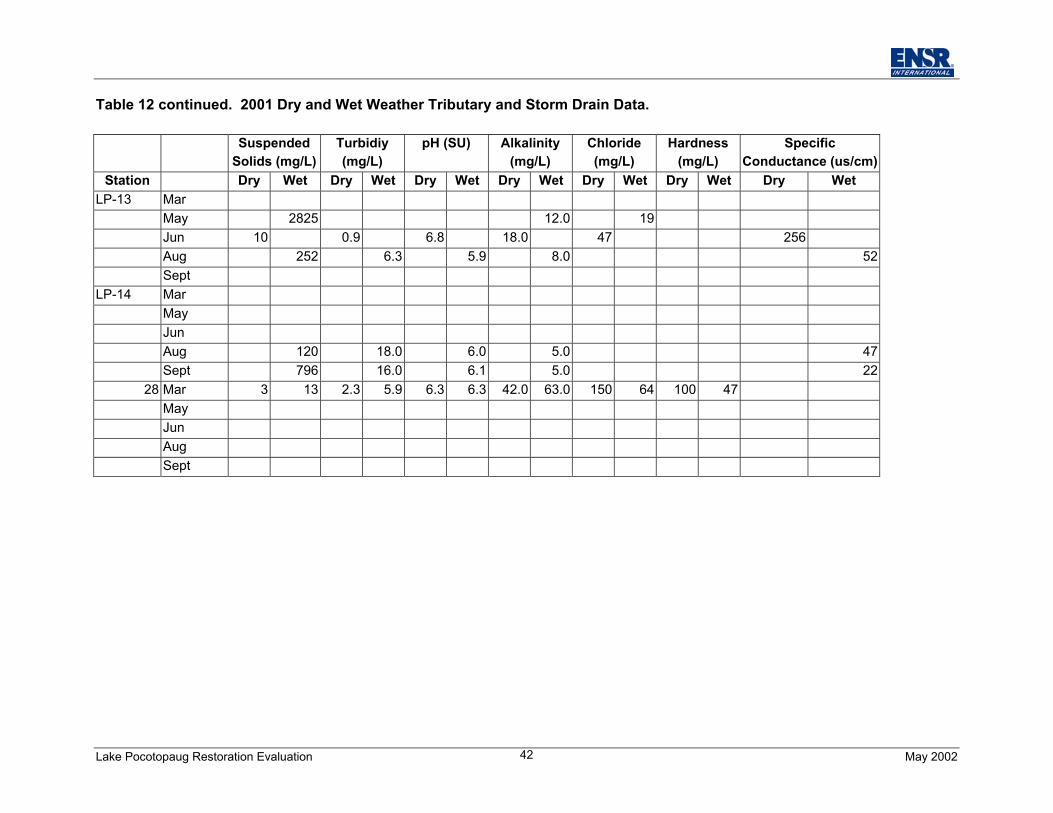
Lake Pocotopaug Restoration Evaluation May 200242
Table 12 continued. 2001 Dry and Wet Weather Tributary and Storm Drain Data.
SuspendedSolids (mg/L)
Turbidiy(mg/L)
pH (SU) Alkalinity(mg/L)
Chloride(mg/L)
Hardness(mg/L)
SpecificConductance (us/cm)
Station Dry Wet Dry Wet Dry Wet Dry Wet Dry Wet Dry Wet Dry WetLP-13 Mar
May 2825 12.0 19Jun 10 0.9 6.8 18.0 47 256Aug 252 6.3 5.9 8.0 52Sept
LP-14 MarMayJunAug 120 18.0 6.0 5.0 47Sept 796 16.0 6.1 5.0 22
28 Mar 3 13 2.3 5.9 6.3 6.3 42.0 63.0 150 64 100 47MayJunAugSept
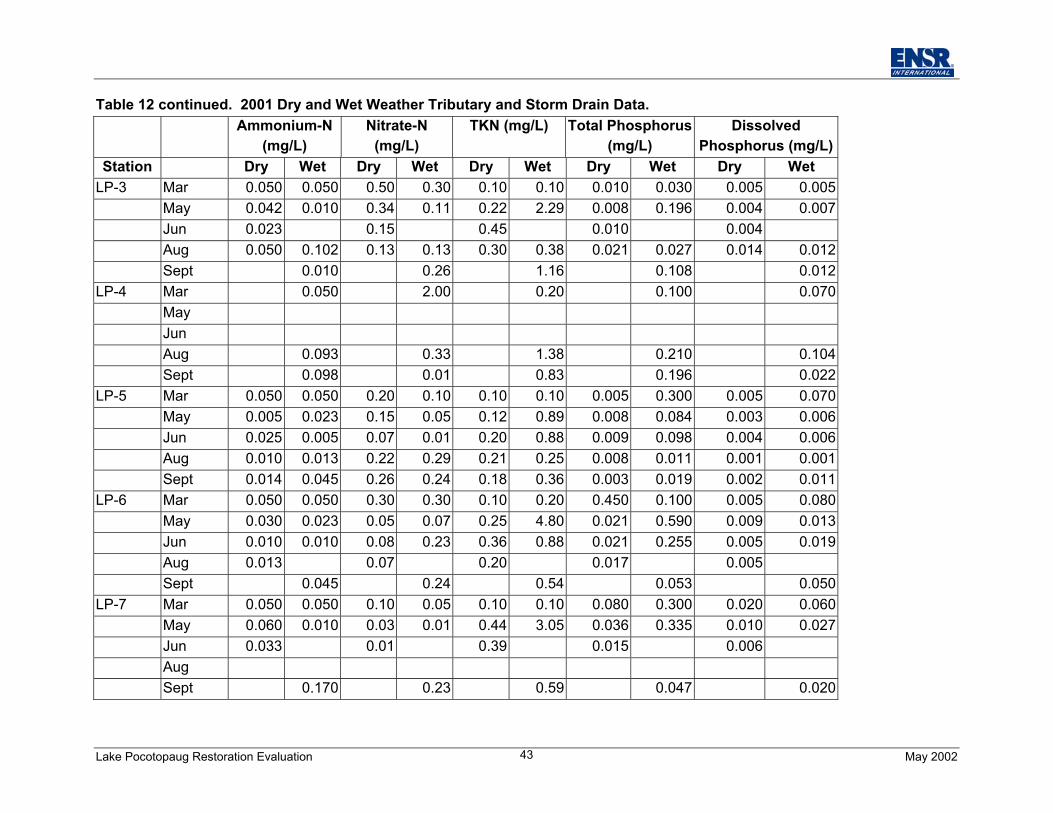
Lake Pocotopaug Restoration Evaluation May 200243
Table 12 continued. 2001 Dry and Wet Weather Tributary and Storm Drain Data.Ammonium-N
(mg/L)Nitrate-N
(mg/L)TKN (mg/L) Total Phosphorus
(mg/L)Dissolved
Phosphorus (mg/L)Station Dry Wet Dry Wet Dry Wet Dry Wet Dry Wet
LP-3 Mar 0.050 0.050 0.50 0.30 0.10 0.10 0.010 0.030 0.005 0.005May 0.042 0.010 0.34 0.11 0.22 2.29 0.008 0.196 0.004 0.007Jun 0.023 0.15 0.45 0.010 0.004Aug 0.050 0.102 0.13 0.13 0.30 0.38 0.021 0.027 0.014 0.012Sept 0.010 0.26 1.16 0.108 0.012
LP-4 Mar 0.050 2.00 0.20 0.100 0.070MayJunAug 0.093 0.33 1.38 0.210 0.104Sept 0.098 0.01 0.83 0.196 0.022
LP-5 Mar 0.050 0.050 0.20 0.10 0.10 0.10 0.005 0.300 0.005 0.070May 0.005 0.023 0.15 0.05 0.12 0.89 0.008 0.084 0.003 0.006Jun 0.025 0.005 0.07 0.01 0.20 0.88 0.009 0.098 0.004 0.006Aug 0.010 0.013 0.22 0.29 0.21 0.25 0.008 0.011 0.001 0.001Sept 0.014 0.045 0.26 0.24 0.18 0.36 0.003 0.019 0.002 0.011
LP-6 Mar 0.050 0.050 0.30 0.30 0.10 0.20 0.450 0.100 0.005 0.080May 0.030 0.023 0.05 0.07 0.25 4.80 0.021 0.590 0.009 0.013Jun 0.010 0.010 0.08 0.23 0.36 0.88 0.021 0.255 0.005 0.019Aug 0.013 0.07 0.20 0.017 0.005Sept 0.045 0.24 0.54 0.053 0.050
LP-7 Mar 0.050 0.050 0.10 0.05 0.10 0.10 0.080 0.300 0.020 0.060May 0.060 0.010 0.03 0.01 0.44 3.05 0.036 0.335 0.010 0.027Jun 0.033 0.01 0.39 0.015 0.006AugSept 0.170 0.23 0.59 0.047 0.020
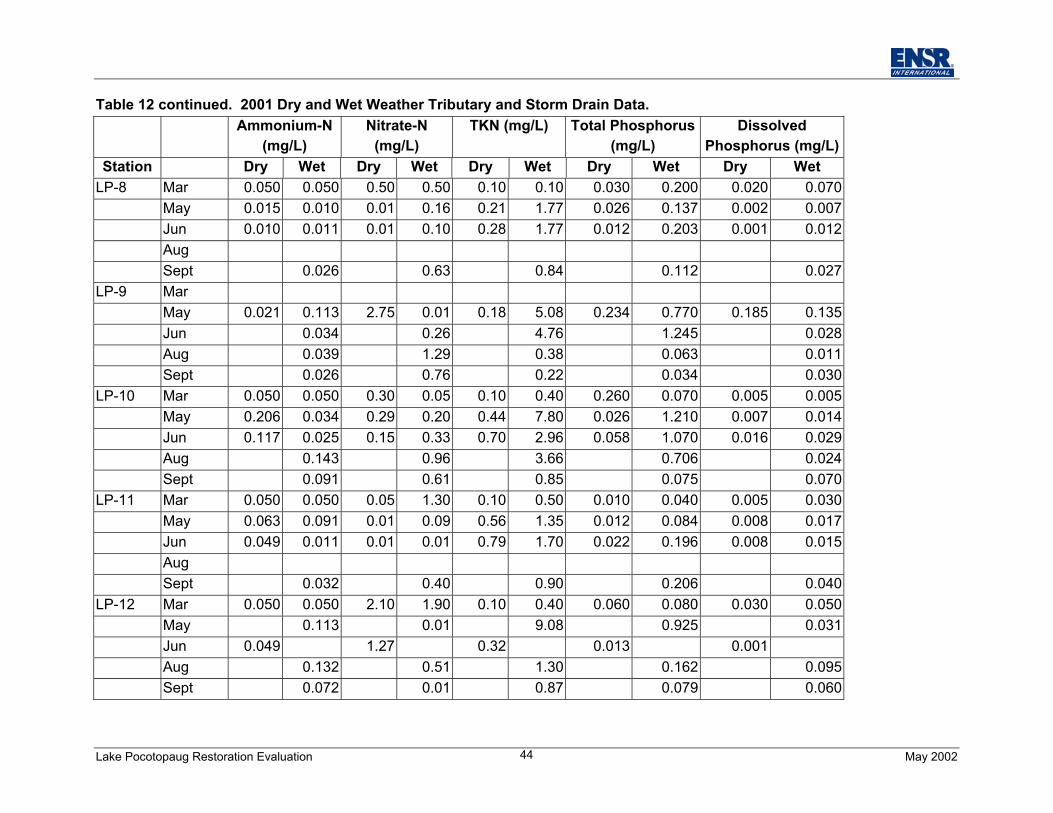
Lake Pocotopaug Restoration Evaluation May 200244
Table 12 continued. 2001 Dry and Wet Weather Tributary and Storm Drain Data.Ammonium-N
(mg/L)Nitrate-N
(mg/L)TKN (mg/L) Total Phosphorus
(mg/L)Dissolved
Phosphorus (mg/L)Station Dry Wet Dry Wet Dry Wet Dry Wet Dry Wet
LP-8 Mar 0.050 0.050 0.50 0.50 0.10 0.10 0.030 0.200 0.020 0.070May 0.015 0.010 0.01 0.16 0.21 1.77 0.026 0.137 0.002 0.007Jun 0.010 0.011 0.01 0.10 0.28 1.77 0.012 0.203 0.001 0.012AugSept 0.026 0.63 0.84 0.112 0.027
LP-9 MarMay 0.021 0.113 2.75 0.01 0.18 5.08 0.234 0.770 0.185 0.135Jun 0.034 0.26 4.76 1.245 0.028Aug 0.039 1.29 0.38 0.063 0.011Sept 0.026 0.76 0.22 0.034 0.030
LP-10 Mar 0.050 0.050 0.30 0.05 0.10 0.40 0.260 0.070 0.005 0.005May 0.206 0.034 0.29 0.20 0.44 7.80 0.026 1.210 0.007 0.014Jun 0.117 0.025 0.15 0.33 0.70 2.96 0.058 1.070 0.016 0.029Aug 0.143 0.96 3.66 0.706 0.024Sept 0.091 0.61 0.85 0.075 0.070
LP-11 Mar 0.050 0.050 0.05 1.30 0.10 0.50 0.010 0.040 0.005 0.030May 0.063 0.091 0.01 0.09 0.56 1.35 0.012 0.084 0.008 0.017Jun 0.049 0.011 0.01 0.01 0.79 1.70 0.022 0.196 0.008 0.015AugSept 0.032 0.40 0.90 0.206 0.040
LP-12 Mar 0.050 0.050 2.10 1.90 0.10 0.40 0.060 0.080 0.030 0.050May 0.113 0.01 9.08 0.925 0.031Jun 0.049 1.27 0.32 0.013 0.001Aug 0.132 0.51 1.30 0.162 0.095Sept 0.072 0.01 0.87 0.079 0.060
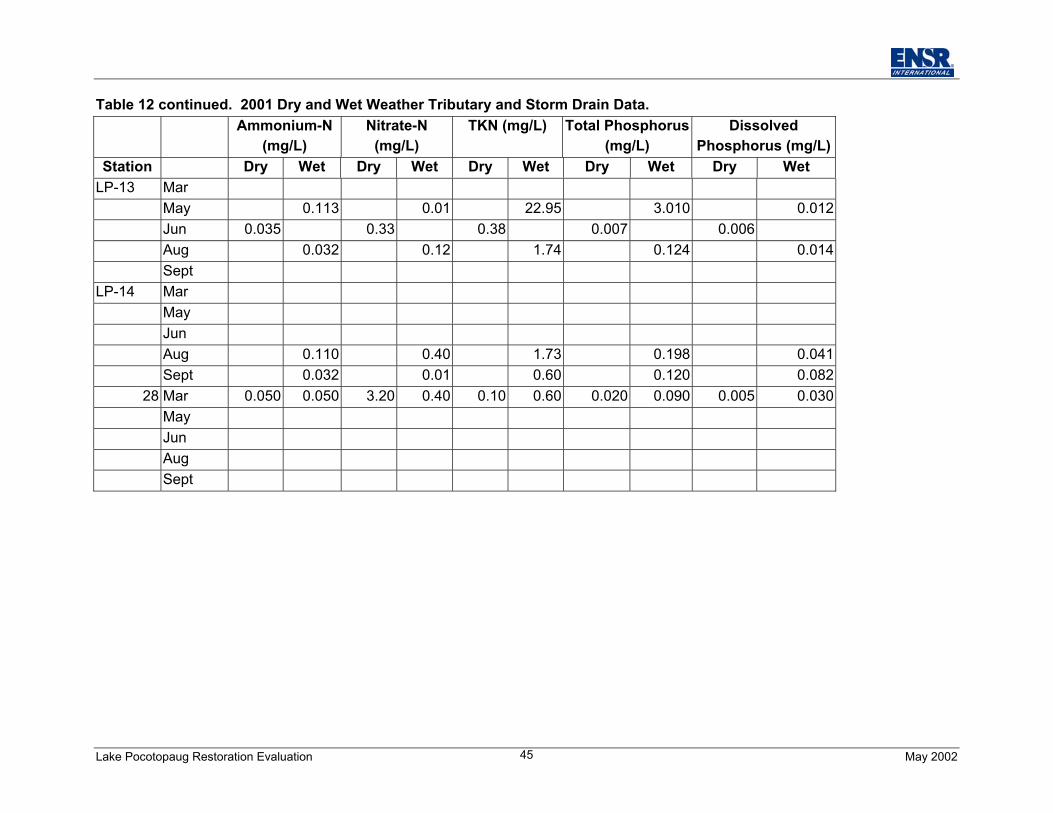
Lake Pocotopaug Restoration Evaluation May 200245
Table 12 continued. 2001 Dry and Wet Weather Tributary and Storm Drain Data.Ammonium-N
(mg/L)Nitrate-N
(mg/L)TKN (mg/L) Total Phosphorus
(mg/L)Dissolved
Phosphorus (mg/L)Station Dry Wet Dry Wet Dry Wet Dry Wet Dry Wet
LP-13 MarMay 0.113 0.01 22.95 3.010 0.012Jun 0.035 0.33 0.38 0.007 0.006Aug 0.032 0.12 1.74 0.124 0.014Sept
LP-14 MarMayJunAug 0.110 0.40 1.73 0.198 0.041Sept 0.032 0.01 0.60 0.120 0.082
28 Mar 0.050 0.050 3.20 0.40 0.10 0.60 0.020 0.090 0.005 0.030MayJunAugSept
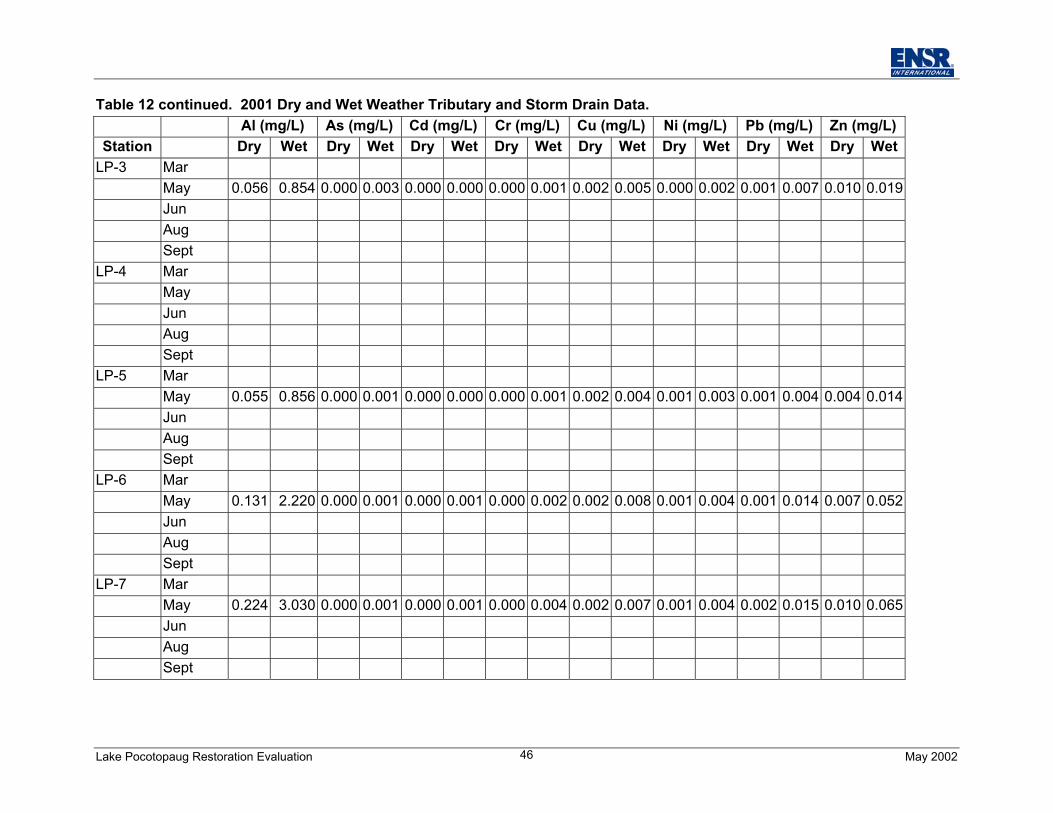
Lake Pocotopaug Restoration Evaluation May 200246
Table 12 continued. 2001 Dry and Wet Weather Tributary and Storm Drain Data.Al (mg/L) As (mg/L) Cd (mg/L) Cr (mg/L) Cu (mg/L) Ni (mg/L) Pb (mg/L) Zn (mg/L)
Station Dry Wet Dry Wet Dry Wet Dry Wet Dry Wet Dry Wet Dry Wet Dry WetLP-3 Mar
May 0.056 0.854 0.000 0.003 0.000 0.000 0.000 0.001 0.002 0.005 0.000 0.002 0.001 0.007 0.010 0.019JunAugSept
LP-4 MarMayJunAugSept
LP-5 MarMay 0.055 0.856 0.000 0.001 0.000 0.000 0.000 0.001 0.002 0.004 0.001 0.003 0.001 0.004 0.004 0.014JunAugSept
LP-6 MarMay 0.131 2.220 0.000 0.001 0.000 0.001 0.000 0.002 0.002 0.008 0.001 0.004 0.001 0.014 0.007 0.052JunAugSept
LP-7 MarMay 0.224 3.030 0.000 0.001 0.000 0.001 0.000 0.004 0.002 0.007 0.001 0.004 0.002 0.015 0.010 0.065JunAugSept
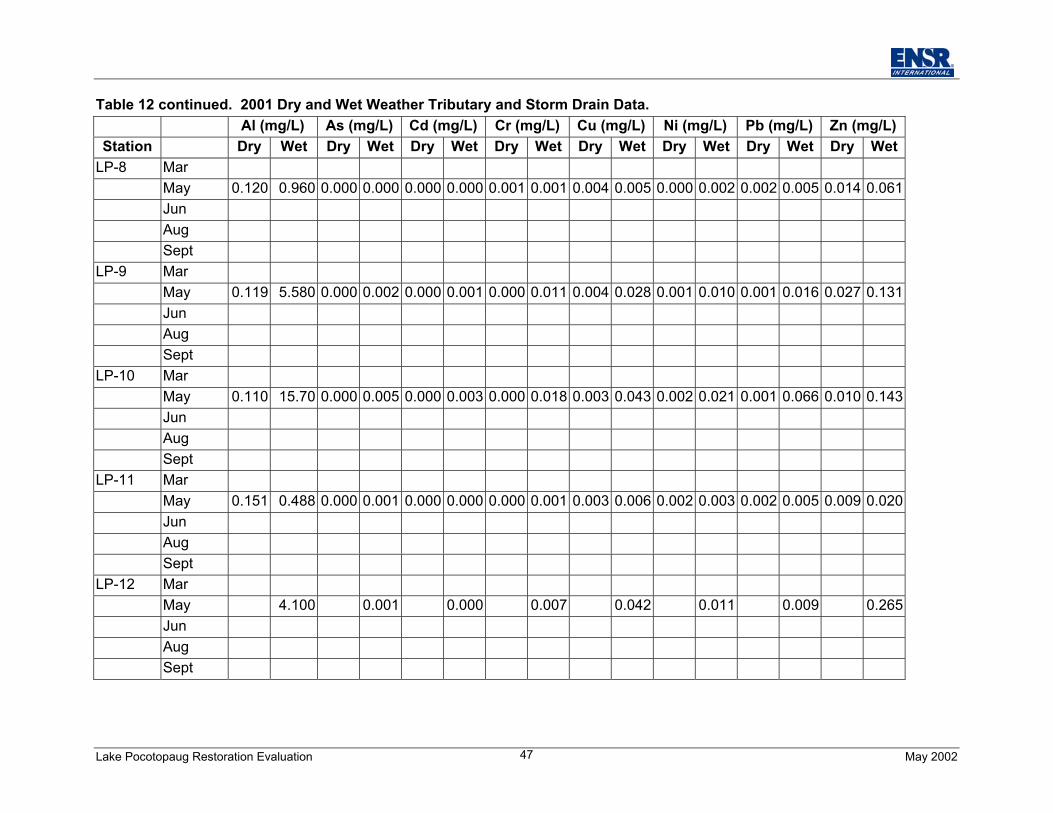
Lake Pocotopaug Restoration Evaluation May 200247
Table 12 continued. 2001 Dry and Wet Weather Tributary and Storm Drain Data.Al (mg/L) As (mg/L) Cd (mg/L) Cr (mg/L) Cu (mg/L) Ni (mg/L) Pb (mg/L) Zn (mg/L)
Station Dry Wet Dry Wet Dry Wet Dry Wet Dry Wet Dry Wet Dry Wet Dry WetLP-8 Mar
May 0.120 0.960 0.000 0.000 0.000 0.000 0.001 0.001 0.004 0.005 0.000 0.002 0.002 0.005 0.014 0.061JunAugSept
LP-9 MarMay 0.119 5.580 0.000 0.002 0.000 0.001 0.000 0.011 0.004 0.028 0.001 0.010 0.001 0.016 0.027 0.131JunAugSept
LP-10 MarMay 0.110 15.70 0.000 0.005 0.000 0.003 0.000 0.018 0.003 0.043 0.002 0.021 0.001 0.066 0.010 0.143JunAugSept
LP-11 MarMay 0.151 0.488 0.000 0.001 0.000 0.000 0.000 0.001 0.003 0.006 0.002 0.003 0.002 0.005 0.009 0.020JunAugSept
LP-12 MarMay 4.100 0.001 0.000 0.007 0.042 0.011 0.009 0.265JunAugSept
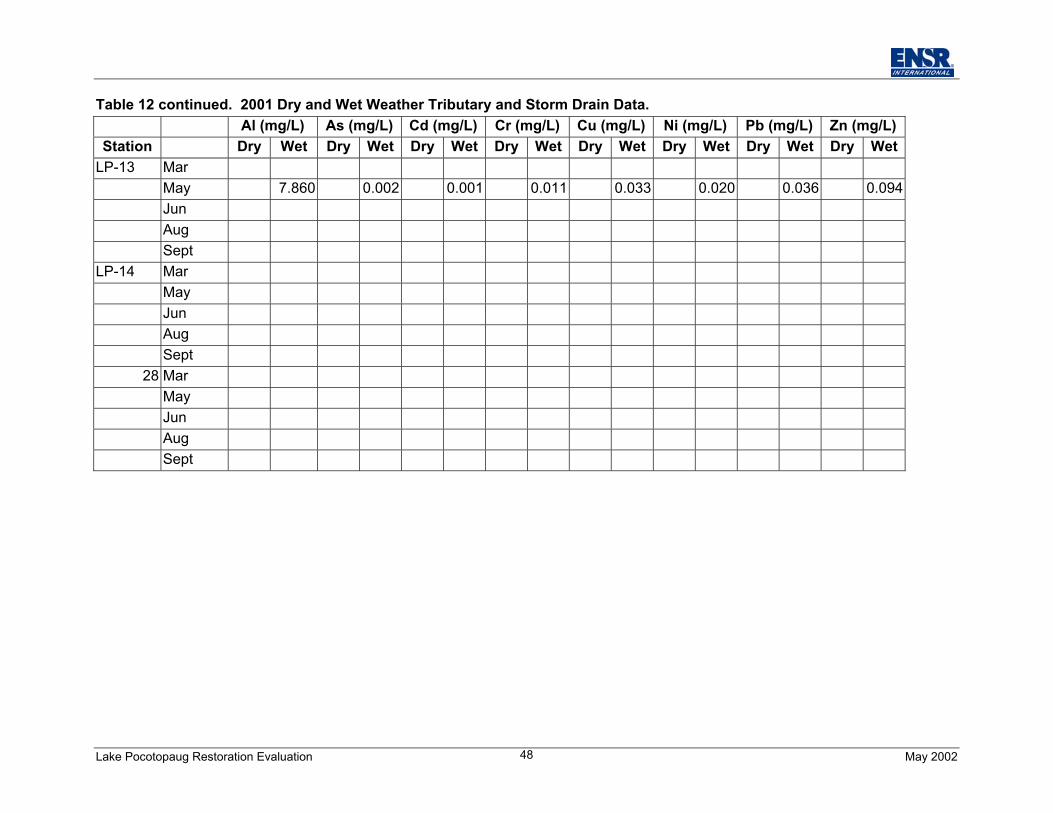
Lake Pocotopaug Restoration Evaluation May 200248
Table 12 continued. 2001 Dry and Wet Weather Tributary and Storm Drain Data.Al (mg/L) As (mg/L) Cd (mg/L) Cr (mg/L) Cu (mg/L) Ni (mg/L) Pb (mg/L) Zn (mg/L)
Station Dry Wet Dry Wet Dry Wet Dry Wet Dry Wet Dry Wet Dry Wet Dry WetLP-13 Mar
May 7.860 0.002 0.001 0.011 0.033 0.020 0.036 0.094JunAugSept
LP-14 MarMayJunAugSept
28 MarMayJunAugSept
Lake Pocotopaug Restoration Evaluation May 200249
Suspended solids and turbidity concentrations were substantially higher in wet weather,indicating that sediment loading to Lake Pocotopaug is significant. WMC documented highsediment load and provided a detailed list of procedures with costs to reduce this load in their1995 report (Appendix C).
pH was moderately to slightly acidic in all tributaries and storm drains. pH ranged from 5.7 to7.2 SU during dry and wet weather combined. Average, across all stations, was slightly lowerduring wet weather, likely due to acid precipitation. Alkalinity was slightly higher in wet weather(average 14 vs 16 mg/L in dry and wet conditions, respectively).
Chloride, hardness and conductivity were slightly lower in wet weather; average chloride valueswere 32 to 20 mg/L (dry and wet, respectively), average hardness were 30 to 21 mg/L (dry andwet, respectively), and average conductivity were 154 and 128 mg/L (dry and wet, respectively).These lower values during wet conditions suggest a constant load from the watershed that isbeing diluted during precipitation.
Nutrients, for the most part, were higher during wet weather than during dry conditions onaverage in 2001. Ammonium and TKN concentrations were generally higher duringprecipitation events. However, nitrate was lower on average. TKN was the only nitrogenvariable that was substantially different in dry verses wet weather in 2001 (average 0.27 and 2.0mg/L during dry and wet weather respectively). Total and dissolved phosphorus values weresignificantly higher (P< 0.005) during wet weather. Wet weather TP concentrations ranged from0.01 to 3.01 mg/L; DP wet weather concentrations ranged from 0.001 to 0.135 mg/L. Averagedry weather TP and DP concentrations were 0.050 and 0.013 mg/L. Average wet weather TPand TP concentrations were 0.317 and 0.035 mg/L, respectively.
Dry weather metal concentrations were generally low. Concentrations increased for the mostpart during wet weather. Aluminum concentrations ranged from 0.06 to 15.7 mg/L. Cadmium,copper, lead and zinc exceed the State of Connecticut Water Quality Standards for AcuteToxicity to Freshwater Aquatic Life during wet weather conditions. Arsenic, chromium andnickel were below the state standards.
6.3 In-Lake Biology
6.3.1 PhytoplanktonThe phytoplankton of Lake Pocotopaug were sampled and analyzed monthly from April throughDecember 2001, with samples collected from two stations. From April through Septembersamples were collected as a composite of the epilimnetic waters (roughly the upper 20 ft), whiletwo discrete samples were collected near the surface and at the Secchi depth in Octoberthrough December. Samples were preserved in Lugol’s solution, concentrated by settling, andviewed in a Palmer Maloney counting chamber at 400x under phase optics. Phytoplankton
Lake Pocotopaug Restoration Evaluation May 200250
were identified to genus and enumerated as cells/ml (Table 13). Conversion to biomass wasbased on cell size, cell shape, and a specific gravity of 1.0 (Table 14).
The phytoplankton of Lake Pocotopaug in 2001 were fairly typical of high mesotrophic to loweutrophic lakes in New England (Tables 13 and 14, Figures 10 and 11). The phosphorusinactivation treatment performed in 2001 may have affected composition and density somewhat,but the general phytoplankton features of 2001 do not appear radically altered from earlieryears. Furthermore, the pattern was quite similar among the two stations. Overall algalbiomass was moderate (>1000 but <10,000 ug/L) except in the August samples, and wasusually between 3000 and 7000 ug/L. This quantity of algae will impart color and turbidity to thelake, but not at a level that makes it unappealing for contact recreation. Since algae form thebase of the aquatic food web and Lake Pocotopaug has a desirable fishery that depends onenergy derived indirectly from algae, algal density on most dates would be consideredacceptable and appropriate to all lake uses. It is only the August bloom, at about 16,000 ug/L,that presents a major concern.
Spring phytoplankton assemblages were dominated by Bacillariophyta (diatoms) andChrysophyta (golden algae), both cold water forms that produce a brownish color in the waterbut are not harmful to people. In fact, these algae are an excellent food source for zooplankton,which in turn are consumed by small fish. The diatom-golden assemblage continues throughJune, but is replaced by blue-greens in July. Blue-green algae are actually photosyntheticallyactive bacteria, and are more properly called Cyanobacteria, but they are commonly includedwith algae in plankton analyses. Blue-greens occur in a wide range of conditions, but are thegroup most often responsible for dense blooms, foul odors, and sometimes illness (e.g., rashes,gastroenteritis). They often become nuisances in warm, nutrient-rich waters. Althoughdominant in July through September, blue-greens did not produce excessive biomass until lateAugust, and declined by mid-September. The primary blue-green genera were Anabaena andLyngbya, with several species of the former detected.
In October the assemblage was mixed, with diatoms and cryptomonads (small flagellates) atmoderate densities, lower densities of golden algae and blue-greens, and traces of green algaeand euglenoids. There was no appreciable difference among stations or water depths. Goldenand green algae were more abundant in November, and overall biomass declined somewhat.Golden algae were most abundant in the December samples, with a similar biomass to thatobserved in November at LP-1 and a higher biomass at LP-2. The pattern of water clarity maydiffer from algal biomass with shifts in algal composition. The transition to dominance by goldenalgae over the fall could be expected to result in higher water clarity, even without a majorchange in biomass, as particle size and pigment composition greatly affects water clarity.
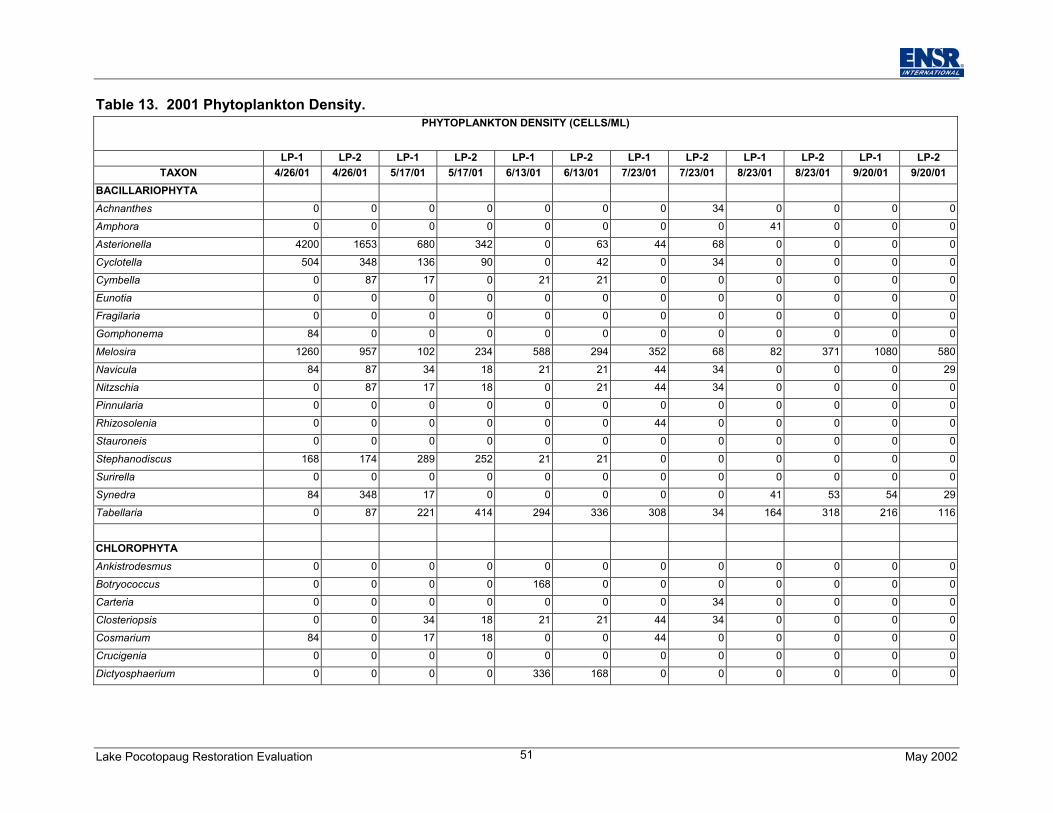
Lake Pocotopaug Restoration Evaluation May 200251
Table 13. 2001 Phytoplankton Density.PHYTOPLANKTON DENSITY (CELLS/ML)
LP-1 LP-2 LP-1 LP-2 LP-1 LP-2 LP-1 LP-2 LP-1 LP-2 LP-1 LP-2TAXON 4/26/01 4/26/01 5/17/01 5/17/01 6/13/01 6/13/01 7/23/01 7/23/01 8/23/01 8/23/01 9/20/01 9/20/01
BACILLARIOPHYTAAchnanthes 0 0 0 0 0 0 0 34 0 0 0 0Amphora 0 0 0 0 0 0 0 0 41 0 0 0Asterionella 4200 1653 680 342 0 63 44 68 0 0 0 0Cyclotella 504 348 136 90 0 42 0 34 0 0 0 0Cymbella 0 87 17 0 21 21 0 0 0 0 0 0Eunotia 0 0 0 0 0 0 0 0 0 0 0 0Fragilaria 0 0 0 0 0 0 0 0 0 0 0 0Gomphonema 84 0 0 0 0 0 0 0 0 0 0 0Melosira 1260 957 102 234 588 294 352 68 82 371 1080 580Navicula 84 87 34 18 21 21 44 34 0 0 0 29Nitzschia 0 87 17 18 0 21 44 34 0 0 0 0Pinnularia 0 0 0 0 0 0 0 0 0 0 0 0Rhizosolenia 0 0 0 0 0 0 44 0 0 0 0 0Stauroneis 0 0 0 0 0 0 0 0 0 0 0 0Stephanodiscus 168 174 289 252 21 21 0 0 0 0 0 0Surirella 0 0 0 0 0 0 0 0 0 0 0 0Synedra 84 348 17 0 0 0 0 0 41 53 54 29Tabellaria 0 87 221 414 294 336 308 34 164 318 216 116
CHLOROPHYTAAnkistrodesmus 0 0 0 0 0 0 0 0 0 0 0 0Botryococcus 0 0 0 0 168 0 0 0 0 0 0 0Carteria 0 0 0 0 0 0 0 34 0 0 0 0Closteriopsis 0 0 34 18 21 21 44 34 0 0 0 0Cosmarium 84 0 17 18 0 0 44 0 0 0 0 0Crucigenia 0 0 0 0 0 0 0 0 0 0 0 0Dictyosphaerium 0 0 0 0 336 168 0 0 0 0 0 0
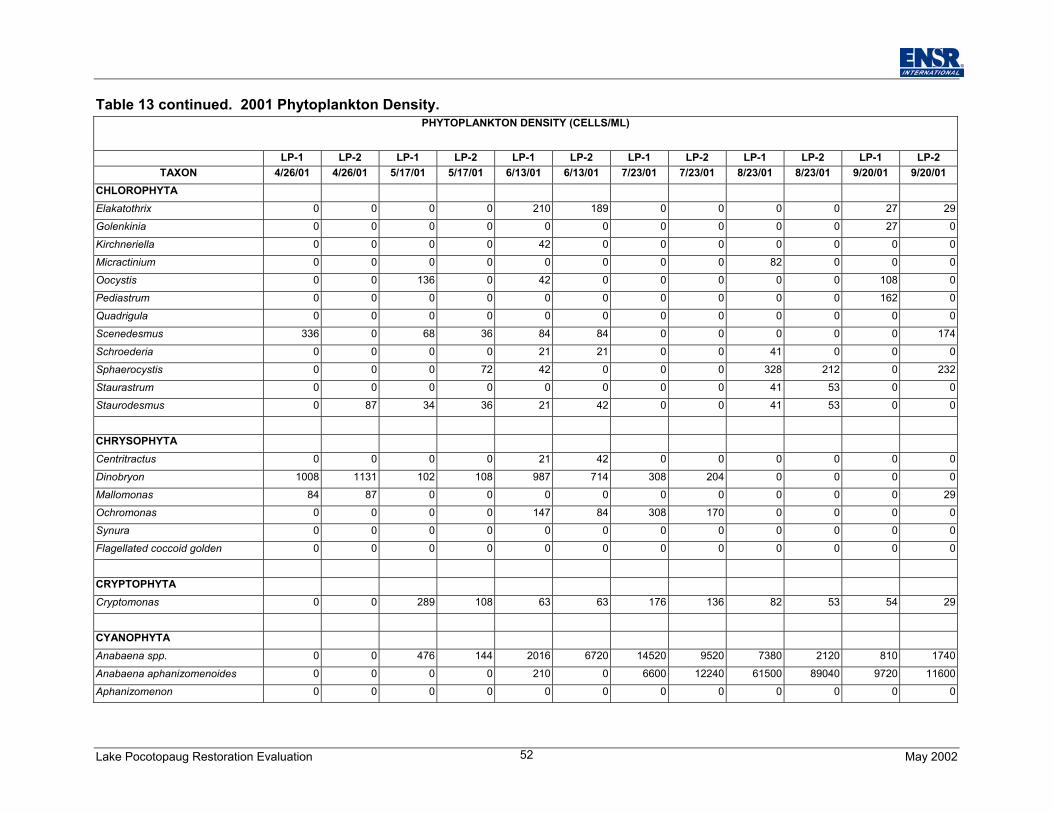
Lake Pocotopaug Restoration Evaluation May 200252
Table 13 continued. 2001 Phytoplankton Density.PHYTOPLANKTON DENSITY (CELLS/ML)
LP-1 LP-2 LP-1 LP-2 LP-1 LP-2 LP-1 LP-2 LP-1 LP-2 LP-1 LP-2TAXON 4/26/01 4/26/01 5/17/01 5/17/01 6/13/01 6/13/01 7/23/01 7/23/01 8/23/01 8/23/01 9/20/01 9/20/01
CHLOROPHYTAElakatothrix 0 0 0 0 210 189 0 0 0 0 27 29Golenkinia 0 0 0 0 0 0 0 0 0 0 27 0Kirchneriella 0 0 0 0 42 0 0 0 0 0 0 0Micractinium 0 0 0 0 0 0 0 0 82 0 0 0Oocystis 0 0 136 0 42 0 0 0 0 0 108 0Pediastrum 0 0 0 0 0 0 0 0 0 0 162 0Quadrigula 0 0 0 0 0 0 0 0 0 0 0 0Scenedesmus 336 0 68 36 84 84 0 0 0 0 0 174Schroederia 0 0 0 0 21 21 0 0 41 0 0 0Sphaerocystis 0 0 0 72 42 0 0 0 328 212 0 232Staurastrum 0 0 0 0 0 0 0 0 41 53 0 0Staurodesmus 0 87 34 36 21 42 0 0 41 53 0 0
CHRYSOPHYTACentritractus 0 0 0 0 21 42 0 0 0 0 0 0Dinobryon 1008 1131 102 108 987 714 308 204 0 0 0 0Mallomonas 84 87 0 0 0 0 0 0 0 0 0 29Ochromonas 0 0 0 0 147 84 308 170 0 0 0 0Synura 0 0 0 0 0 0 0 0 0 0 0 0Flagellated coccoid golden 0 0 0 0 0 0 0 0 0 0 0 0
CRYPTOPHYTACryptomonas 0 0 289 108 63 63 176 136 82 53 54 29
CYANOPHYTAAnabaena spp. 0 0 476 144 2016 6720 14520 9520 7380 2120 810 1740Anabaena aphanizomenoides 0 0 0 0 210 0 6600 12240 61500 89040 9720 11600Aphanizomenon 0 0 0 0 0 0 0 0 0 0 0 0
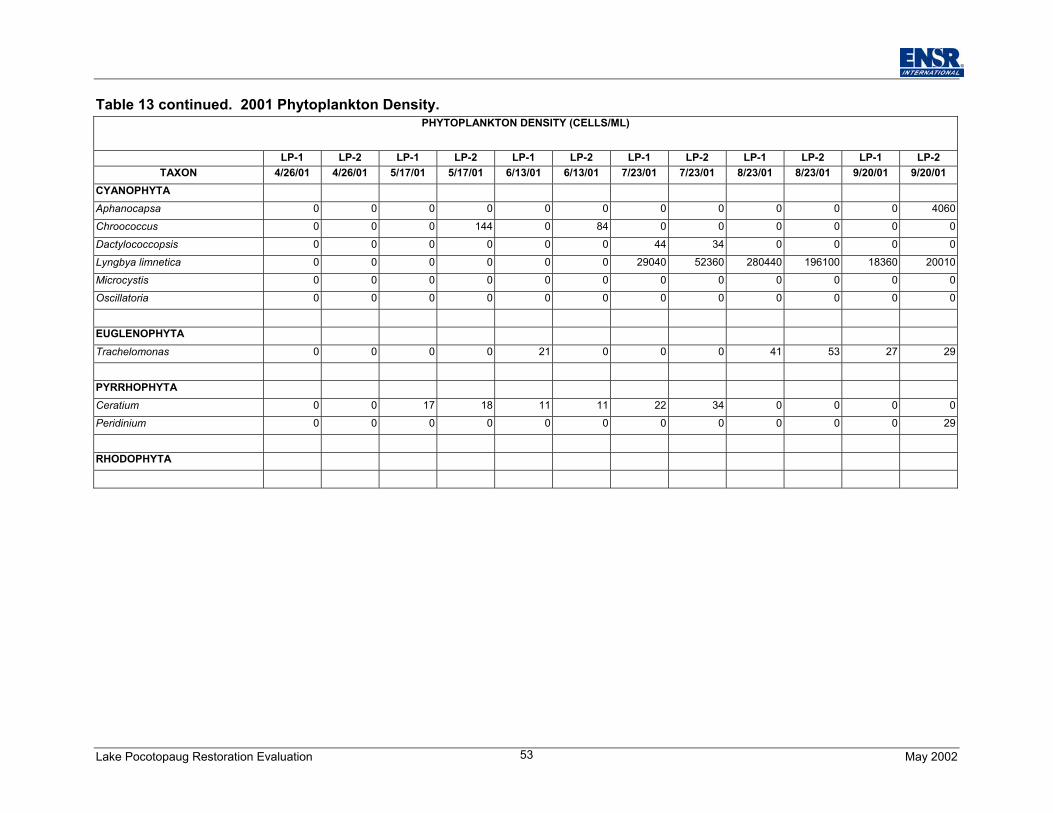
Lake Pocotopaug Restoration Evaluation May 200253
Table 13 continued. 2001 Phytoplankton Density.PHYTOPLANKTON DENSITY (CELLS/ML)
LP-1 LP-2 LP-1 LP-2 LP-1 LP-2 LP-1 LP-2 LP-1 LP-2 LP-1 LP-2TAXON 4/26/01 4/26/01 5/17/01 5/17/01 6/13/01 6/13/01 7/23/01 7/23/01 8/23/01 8/23/01 9/20/01 9/20/01
CYANOPHYTAAphanocapsa 0 0 0 0 0 0 0 0 0 0 0 4060Chroococcus 0 0 0 144 0 84 0 0 0 0 0 0Dactylococcopsis 0 0 0 0 0 0 44 34 0 0 0 0Lyngbya limnetica 0 0 0 0 0 0 29040 52360 280440 196100 18360 20010Microcystis 0 0 0 0 0 0 0 0 0 0 0 0Oscillatoria 0 0 0 0 0 0 0 0 0 0 0 0
EUGLENOPHYTATrachelomonas 0 0 0 0 21 0 0 0 41 53 27 29
PYRRHOPHYTACeratium 0 0 17 18 11 11 22 34 0 0 0 0Peridinium 0 0 0 0 0 0 0 0 0 0 0 29
RHODOPHYTA
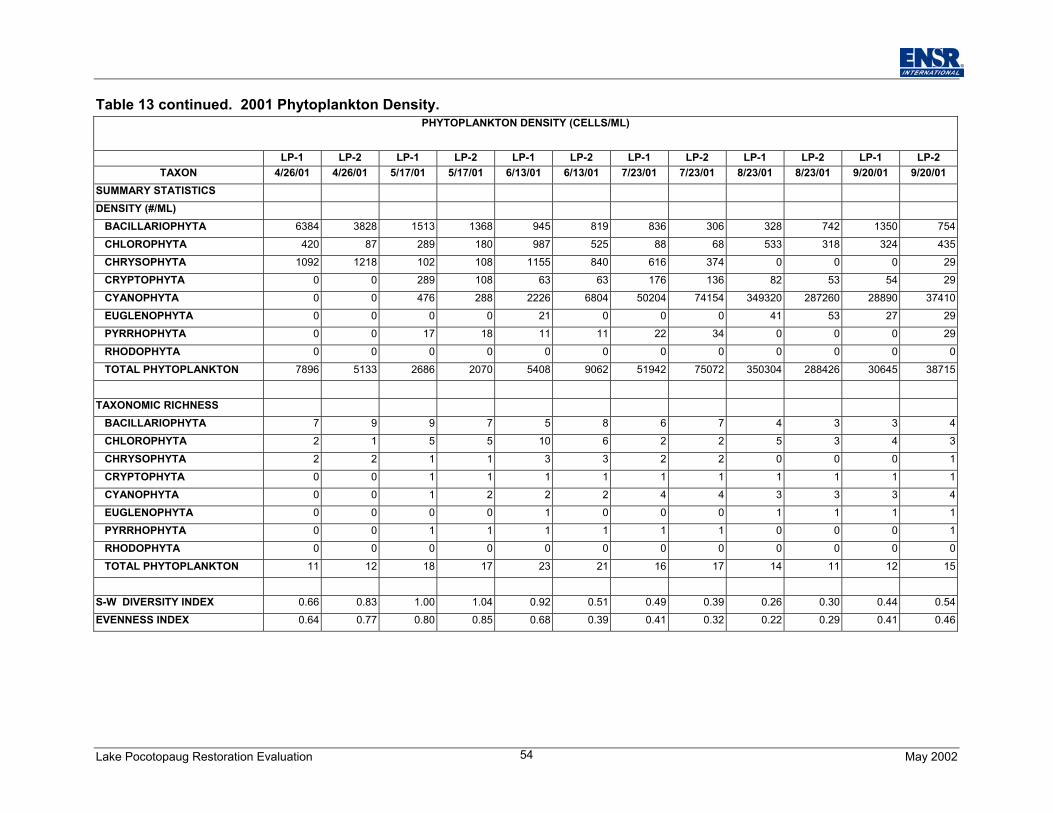
Lake Pocotopaug Restoration Evaluation May 200254
Table 13 continued. 2001 Phytoplankton Density.PHYTOPLANKTON DENSITY (CELLS/ML)
LP-1 LP-2 LP-1 LP-2 LP-1 LP-2 LP-1 LP-2 LP-1 LP-2 LP-1 LP-2TAXON 4/26/01 4/26/01 5/17/01 5/17/01 6/13/01 6/13/01 7/23/01 7/23/01 8/23/01 8/23/01 9/20/01 9/20/01
SUMMARY STATISTICSDENSITY (#/ML) BACILLARIOPHYTA 6384 3828 1513 1368 945 819 836 306 328 742 1350 754 CHLOROPHYTA 420 87 289 180 987 525 88 68 533 318 324 435 CHRYSOPHYTA 1092 1218 102 108 1155 840 616 374 0 0 0 29 CRYPTOPHYTA 0 0 289 108 63 63 176 136 82 53 54 29 CYANOPHYTA 0 0 476 288 2226 6804 50204 74154 349320 287260 28890 37410 EUGLENOPHYTA 0 0 0 0 21 0 0 0 41 53 27 29 PYRRHOPHYTA 0 0 17 18 11 11 22 34 0 0 0 29 RHODOPHYTA 0 0 0 0 0 0 0 0 0 0 0 0 TOTAL PHYTOPLANKTON 7896 5133 2686 2070 5408 9062 51942 75072 350304 288426 30645 38715
TAXONOMIC RICHNESS BACILLARIOPHYTA 7 9 9 7 5 8 6 7 4 3 3 4 CHLOROPHYTA 2 1 5 5 10 6 2 2 5 3 4 3 CHRYSOPHYTA 2 2 1 1 3 3 2 2 0 0 0 1 CRYPTOPHYTA 0 0 1 1 1 1 1 1 1 1 1 1 CYANOPHYTA 0 0 1 2 2 2 4 4 3 3 3 4 EUGLENOPHYTA 0 0 0 0 1 0 0 0 1 1 1 1 PYRRHOPHYTA 0 0 1 1 1 1 1 1 0 0 0 1 RHODOPHYTA 0 0 0 0 0 0 0 0 0 0 0 0 TOTAL PHYTOPLANKTON 11 12 18 17 23 21 16 17 14 11 12 15
S-W DIVERSITY INDEX 0.66 0.83 1.00 1.04 0.92 0.51 0.49 0.39 0.26 0.30 0.44 0.54EVENNESS INDEX 0.64 0.77 0.80 0.85 0.68 0.39 0.41 0.32 0.22 0.29 0.41 0.46
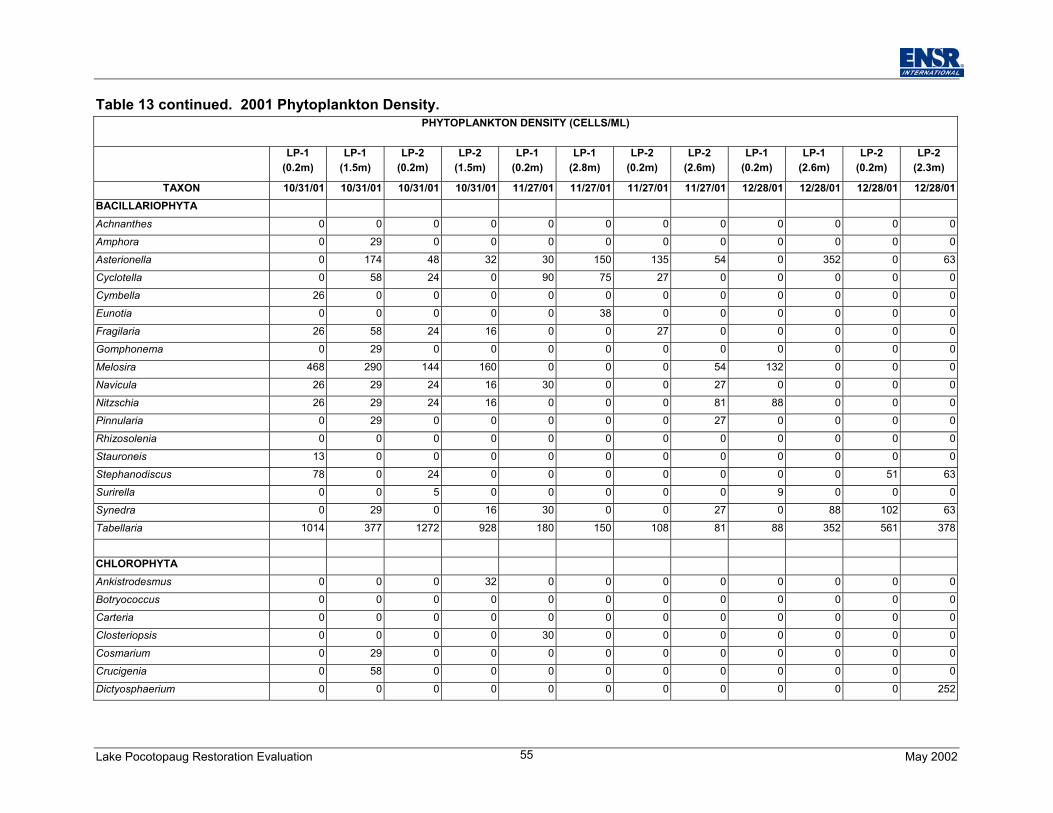
Lake Pocotopaug Restoration Evaluation May 200255
Table 13 continued. 2001 Phytoplankton Density.PHYTOPLANKTON DENSITY (CELLS/ML)
LP-1(0.2m)
LP-1(1.5m)
LP-2(0.2m)
LP-2(1.5m)
LP-1(0.2m)
LP-1(2.8m)
LP-2(0.2m)
LP-2(2.6m)
LP-1(0.2m)
LP-1(2.6m)
LP-2(0.2m)
LP-2(2.3m)
TAXON 10/31/01 10/31/01 10/31/01 10/31/01 11/27/01 11/27/01 11/27/01 11/27/01 12/28/01 12/28/01 12/28/01 12/28/01BACILLARIOPHYTAAchnanthes 0 0 0 0 0 0 0 0 0 0 0 0Amphora 0 29 0 0 0 0 0 0 0 0 0 0Asterionella 0 174 48 32 30 150 135 54 0 352 0 63Cyclotella 0 58 24 0 90 75 27 0 0 0 0 0Cymbella 26 0 0 0 0 0 0 0 0 0 0 0Eunotia 0 0 0 0 0 38 0 0 0 0 0 0Fragilaria 26 58 24 16 0 0 27 0 0 0 0 0Gomphonema 0 29 0 0 0 0 0 0 0 0 0 0Melosira 468 290 144 160 0 0 0 54 132 0 0 0Navicula 26 29 24 16 30 0 0 27 0 0 0 0Nitzschia 26 29 24 16 0 0 0 81 88 0 0 0Pinnularia 0 29 0 0 0 0 0 27 0 0 0 0Rhizosolenia 0 0 0 0 0 0 0 0 0 0 0 0Stauroneis 13 0 0 0 0 0 0 0 0 0 0 0Stephanodiscus 78 0 24 0 0 0 0 0 0 0 51 63Surirella 0 0 5 0 0 0 0 0 9 0 0 0Synedra 0 29 0 16 30 0 0 27 0 88 102 63Tabellaria 1014 377 1272 928 180 150 108 81 88 352 561 378
CHLOROPHYTAAnkistrodesmus 0 0 0 32 0 0 0 0 0 0 0 0Botryococcus 0 0 0 0 0 0 0 0 0 0 0 0Carteria 0 0 0 0 0 0 0 0 0 0 0 0Closteriopsis 0 0 0 0 30 0 0 0 0 0 0 0Cosmarium 0 29 0 0 0 0 0 0 0 0 0 0Crucigenia 0 58 0 0 0 0 0 0 0 0 0 0Dictyosphaerium 0 0 0 0 0 0 0 0 0 0 0 252
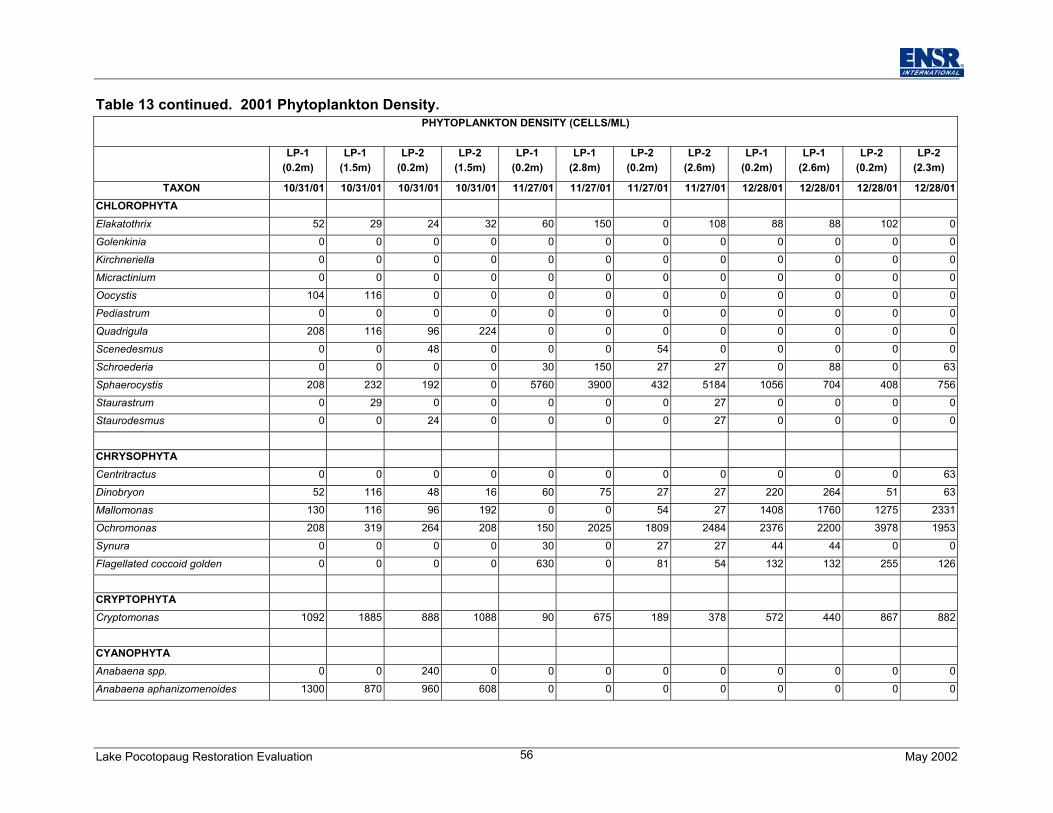
Lake Pocotopaug Restoration Evaluation May 200256
Table 13 continued. 2001 Phytoplankton Density.PHYTOPLANKTON DENSITY (CELLS/ML)
LP-1(0.2m)
LP-1(1.5m)
LP-2(0.2m)
LP-2(1.5m)
LP-1(0.2m)
LP-1(2.8m)
LP-2(0.2m)
LP-2(2.6m)
LP-1(0.2m)
LP-1(2.6m)
LP-2(0.2m)
LP-2(2.3m)
TAXON 10/31/01 10/31/01 10/31/01 10/31/01 11/27/01 11/27/01 11/27/01 11/27/01 12/28/01 12/28/01 12/28/01 12/28/01CHLOROPHYTAElakatothrix 52 29 24 32 60 150 0 108 88 88 102 0Golenkinia 0 0 0 0 0 0 0 0 0 0 0 0Kirchneriella 0 0 0 0 0 0 0 0 0 0 0 0Micractinium 0 0 0 0 0 0 0 0 0 0 0 0Oocystis 104 116 0 0 0 0 0 0 0 0 0 0Pediastrum 0 0 0 0 0 0 0 0 0 0 0 0Quadrigula 208 116 96 224 0 0 0 0 0 0 0 0Scenedesmus 0 0 48 0 0 0 54 0 0 0 0 0Schroederia 0 0 0 0 30 150 27 27 0 88 0 63Sphaerocystis 208 232 192 0 5760 3900 432 5184 1056 704 408 756Staurastrum 0 29 0 0 0 0 0 27 0 0 0 0Staurodesmus 0 0 24 0 0 0 0 27 0 0 0 0
CHRYSOPHYTACentritractus 0 0 0 0 0 0 0 0 0 0 0 63Dinobryon 52 116 48 16 60 75 27 27 220 264 51 63Mallomonas 130 116 96 192 0 0 54 27 1408 1760 1275 2331Ochromonas 208 319 264 208 150 2025 1809 2484 2376 2200 3978 1953Synura 0 0 0 0 30 0 27 27 44 44 0 0Flagellated coccoid golden 0 0 0 0 630 0 81 54 132 132 255 126
CRYPTOPHYTACryptomonas 1092 1885 888 1088 90 675 189 378 572 440 867 882
CYANOPHYTAAnabaena spp. 0 0 240 0 0 0 0 0 0 0 0 0Anabaena aphanizomenoides 1300 870 960 608 0 0 0 0 0 0 0 0
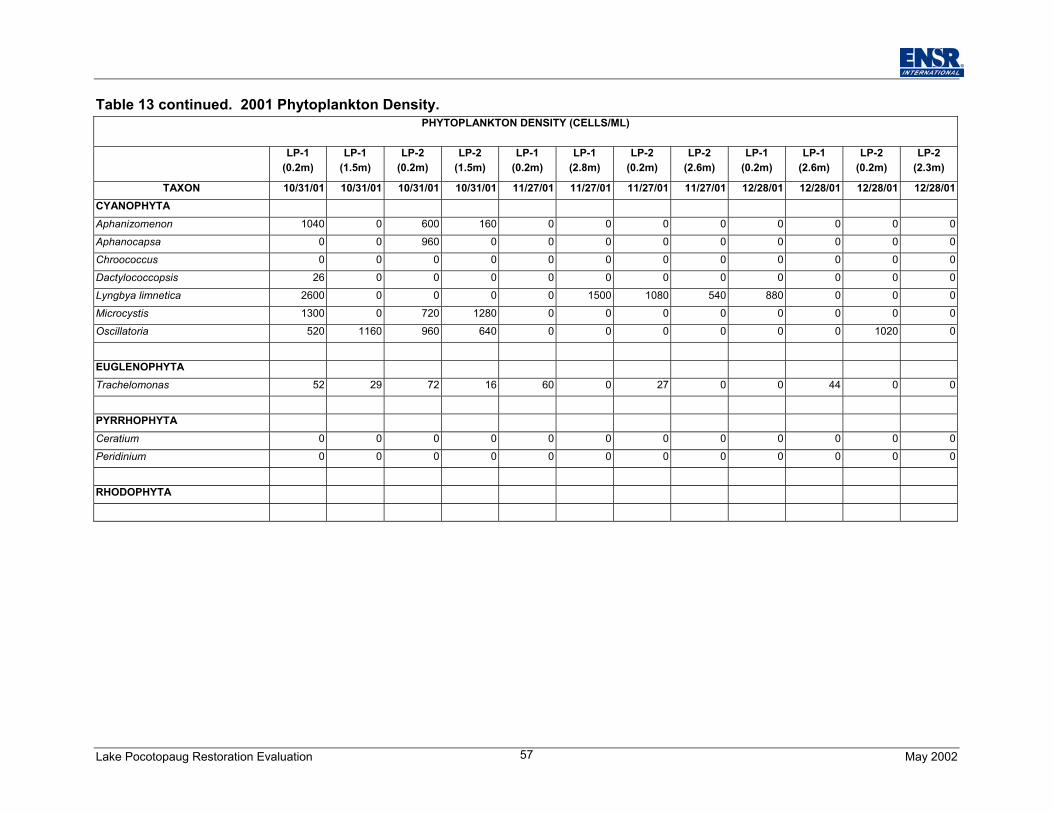
Lake Pocotopaug Restoration Evaluation May 200257
Table 13 continued. 2001 Phytoplankton Density.PHYTOPLANKTON DENSITY (CELLS/ML)
LP-1(0.2m)
LP-1(1.5m)
LP-2(0.2m)
LP-2(1.5m)
LP-1(0.2m)
LP-1(2.8m)
LP-2(0.2m)
LP-2(2.6m)
LP-1(0.2m)
LP-1(2.6m)
LP-2(0.2m)
LP-2(2.3m)
TAXON 10/31/01 10/31/01 10/31/01 10/31/01 11/27/01 11/27/01 11/27/01 11/27/01 12/28/01 12/28/01 12/28/01 12/28/01CYANOPHYTAAphanizomenon 1040 0 600 160 0 0 0 0 0 0 0 0Aphanocapsa 0 0 960 0 0 0 0 0 0 0 0 0Chroococcus 0 0 0 0 0 0 0 0 0 0 0 0Dactylococcopsis 26 0 0 0 0 0 0 0 0 0 0 0Lyngbya limnetica 2600 0 0 0 0 1500 1080 540 880 0 0 0Microcystis 1300 0 720 1280 0 0 0 0 0 0 0 0Oscillatoria 520 1160 960 640 0 0 0 0 0 0 1020 0
EUGLENOPHYTATrachelomonas 52 29 72 16 60 0 27 0 0 44 0 0
PYRRHOPHYTACeratium 0 0 0 0 0 0 0 0 0 0 0 0Peridinium 0 0 0 0 0 0 0 0 0 0 0 0
RHODOPHYTA
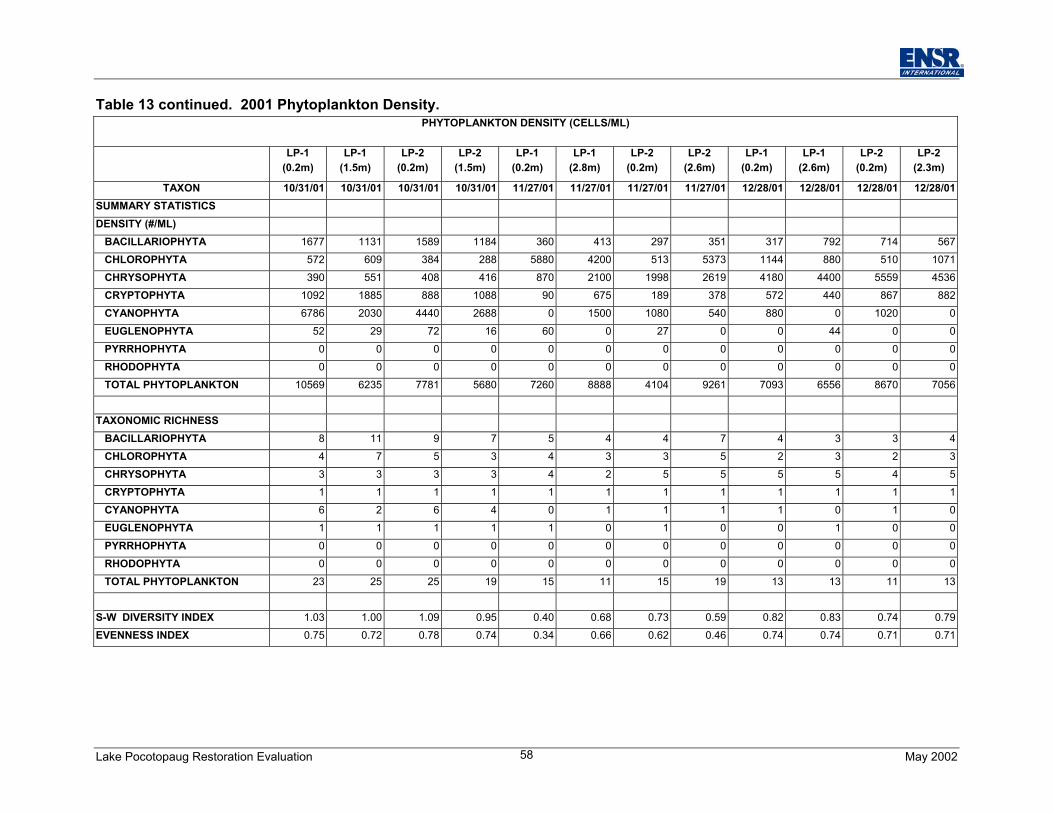
Lake Pocotopaug Restoration Evaluation May 200258
Table 13 continued. 2001 Phytoplankton Density.PHYTOPLANKTON DENSITY (CELLS/ML)
LP-1(0.2m)
LP-1(1.5m)
LP-2(0.2m)
LP-2(1.5m)
LP-1(0.2m)
LP-1(2.8m)
LP-2(0.2m)
LP-2(2.6m)
LP-1(0.2m)
LP-1(2.6m)
LP-2(0.2m)
LP-2(2.3m)
TAXON 10/31/01 10/31/01 10/31/01 10/31/01 11/27/01 11/27/01 11/27/01 11/27/01 12/28/01 12/28/01 12/28/01 12/28/01SUMMARY STATISTICSDENSITY (#/ML) BACILLARIOPHYTA 1677 1131 1589 1184 360 413 297 351 317 792 714 567 CHLOROPHYTA 572 609 384 288 5880 4200 513 5373 1144 880 510 1071 CHRYSOPHYTA 390 551 408 416 870 2100 1998 2619 4180 4400 5559 4536 CRYPTOPHYTA 1092 1885 888 1088 90 675 189 378 572 440 867 882 CYANOPHYTA 6786 2030 4440 2688 0 1500 1080 540 880 0 1020 0 EUGLENOPHYTA 52 29 72 16 60 0 27 0 0 44 0 0 PYRRHOPHYTA 0 0 0 0 0 0 0 0 0 0 0 0 RHODOPHYTA 0 0 0 0 0 0 0 0 0 0 0 0 TOTAL PHYTOPLANKTON 10569 6235 7781 5680 7260 8888 4104 9261 7093 6556 8670 7056
TAXONOMIC RICHNESS BACILLARIOPHYTA 8 11 9 7 5 4 4 7 4 3 3 4 CHLOROPHYTA 4 7 5 3 4 3 3 5 2 3 2 3 CHRYSOPHYTA 3 3 3 3 4 2 5 5 5 5 4 5 CRYPTOPHYTA 1 1 1 1 1 1 1 1 1 1 1 1 CYANOPHYTA 6 2 6 4 0 1 1 1 1 0 1 0 EUGLENOPHYTA 1 1 1 1 1 0 1 0 0 1 0 0 PYRRHOPHYTA 0 0 0 0 0 0 0 0 0 0 0 0 RHODOPHYTA 0 0 0 0 0 0 0 0 0 0 0 0 TOTAL PHYTOPLANKTON 23 25 25 19 15 11 15 19 13 13 11 13
S-W DIVERSITY INDEX 1.03 1.00 1.09 0.95 0.40 0.68 0.73 0.59 0.82 0.83 0.74 0.79EVENNESS INDEX 0.75 0.72 0.78 0.74 0.34 0.66 0.62 0.46 0.74 0.74 0.71 0.71
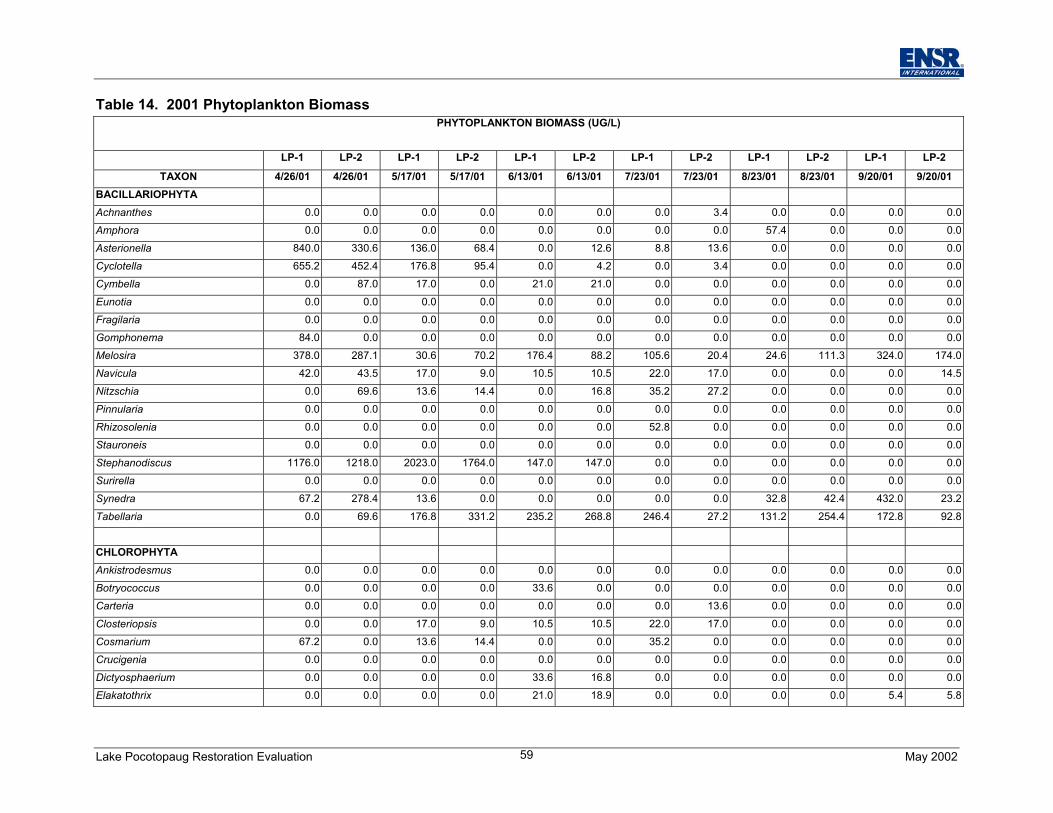
Lake Pocotopaug Restoration Evaluation May 200259
Table 14. 2001 Phytoplankton BiomassPHYTOPLANKTON BIOMASS (UG/L)
LP-1 LP-2 LP-1 LP-2 LP-1 LP-2 LP-1 LP-2 LP-1 LP-2 LP-1 LP-2
TAXON 4/26/01 4/26/01 5/17/01 5/17/01 6/13/01 6/13/01 7/23/01 7/23/01 8/23/01 8/23/01 9/20/01 9/20/01BACILLARIOPHYTAAchnanthes 0.0 0.0 0.0 0.0 0.0 0.0 0.0 3.4 0.0 0.0 0.0 0.0Amphora 0.0 0.0 0.0 0.0 0.0 0.0 0.0 0.0 57.4 0.0 0.0 0.0Asterionella 840.0 330.6 136.0 68.4 0.0 12.6 8.8 13.6 0.0 0.0 0.0 0.0Cyclotella 655.2 452.4 176.8 95.4 0.0 4.2 0.0 3.4 0.0 0.0 0.0 0.0Cymbella 0.0 87.0 17.0 0.0 21.0 21.0 0.0 0.0 0.0 0.0 0.0 0.0Eunotia 0.0 0.0 0.0 0.0 0.0 0.0 0.0 0.0 0.0 0.0 0.0 0.0Fragilaria 0.0 0.0 0.0 0.0 0.0 0.0 0.0 0.0 0.0 0.0 0.0 0.0Gomphonema 84.0 0.0 0.0 0.0 0.0 0.0 0.0 0.0 0.0 0.0 0.0 0.0Melosira 378.0 287.1 30.6 70.2 176.4 88.2 105.6 20.4 24.6 111.3 324.0 174.0Navicula 42.0 43.5 17.0 9.0 10.5 10.5 22.0 17.0 0.0 0.0 0.0 14.5Nitzschia 0.0 69.6 13.6 14.4 0.0 16.8 35.2 27.2 0.0 0.0 0.0 0.0Pinnularia 0.0 0.0 0.0 0.0 0.0 0.0 0.0 0.0 0.0 0.0 0.0 0.0Rhizosolenia 0.0 0.0 0.0 0.0 0.0 0.0 52.8 0.0 0.0 0.0 0.0 0.0Stauroneis 0.0 0.0 0.0 0.0 0.0 0.0 0.0 0.0 0.0 0.0 0.0 0.0Stephanodiscus 1176.0 1218.0 2023.0 1764.0 147.0 147.0 0.0 0.0 0.0 0.0 0.0 0.0Surirella 0.0 0.0 0.0 0.0 0.0 0.0 0.0 0.0 0.0 0.0 0.0 0.0Synedra 67.2 278.4 13.6 0.0 0.0 0.0 0.0 0.0 32.8 42.4 432.0 23.2Tabellaria 0.0 69.6 176.8 331.2 235.2 268.8 246.4 27.2 131.2 254.4 172.8 92.8
CHLOROPHYTAAnkistrodesmus 0.0 0.0 0.0 0.0 0.0 0.0 0.0 0.0 0.0 0.0 0.0 0.0Botryococcus 0.0 0.0 0.0 0.0 33.6 0.0 0.0 0.0 0.0 0.0 0.0 0.0Carteria 0.0 0.0 0.0 0.0 0.0 0.0 0.0 13.6 0.0 0.0 0.0 0.0Closteriopsis 0.0 0.0 17.0 9.0 10.5 10.5 22.0 17.0 0.0 0.0 0.0 0.0Cosmarium 67.2 0.0 13.6 14.4 0.0 0.0 35.2 0.0 0.0 0.0 0.0 0.0Crucigenia 0.0 0.0 0.0 0.0 0.0 0.0 0.0 0.0 0.0 0.0 0.0 0.0Dictyosphaerium 0.0 0.0 0.0 0.0 33.6 16.8 0.0 0.0 0.0 0.0 0.0 0.0Elakatothrix 0.0 0.0 0.0 0.0 21.0 18.9 0.0 0.0 0.0 0.0 5.4 5.8
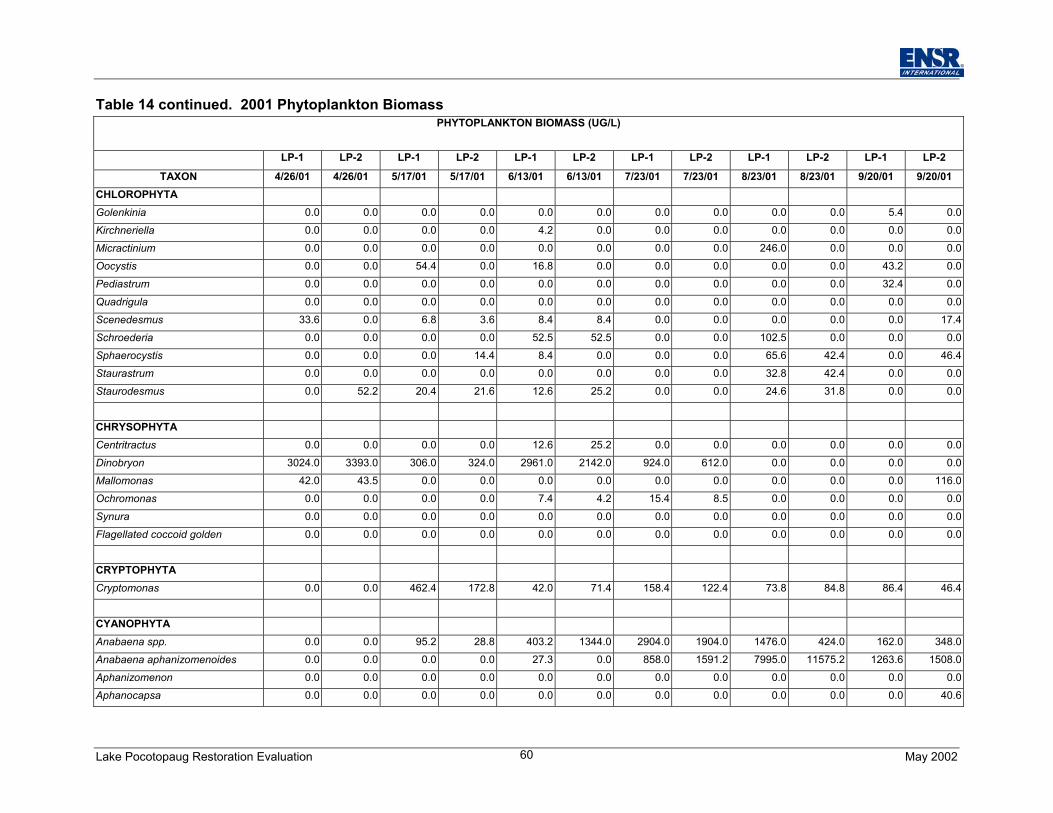
Lake Pocotopaug Restoration Evaluation May 200260
Table 14 continued. 2001 Phytoplankton BiomassPHYTOPLANKTON BIOMASS (UG/L)
LP-1 LP-2 LP-1 LP-2 LP-1 LP-2 LP-1 LP-2 LP-1 LP-2 LP-1 LP-2
TAXON 4/26/01 4/26/01 5/17/01 5/17/01 6/13/01 6/13/01 7/23/01 7/23/01 8/23/01 8/23/01 9/20/01 9/20/01CHLOROPHYTAGolenkinia 0.0 0.0 0.0 0.0 0.0 0.0 0.0 0.0 0.0 0.0 5.4 0.0Kirchneriella 0.0 0.0 0.0 0.0 4.2 0.0 0.0 0.0 0.0 0.0 0.0 0.0Micractinium 0.0 0.0 0.0 0.0 0.0 0.0 0.0 0.0 246.0 0.0 0.0 0.0Oocystis 0.0 0.0 54.4 0.0 16.8 0.0 0.0 0.0 0.0 0.0 43.2 0.0Pediastrum 0.0 0.0 0.0 0.0 0.0 0.0 0.0 0.0 0.0 0.0 32.4 0.0Quadrigula 0.0 0.0 0.0 0.0 0.0 0.0 0.0 0.0 0.0 0.0 0.0 0.0Scenedesmus 33.6 0.0 6.8 3.6 8.4 8.4 0.0 0.0 0.0 0.0 0.0 17.4Schroederia 0.0 0.0 0.0 0.0 52.5 52.5 0.0 0.0 102.5 0.0 0.0 0.0Sphaerocystis 0.0 0.0 0.0 14.4 8.4 0.0 0.0 0.0 65.6 42.4 0.0 46.4Staurastrum 0.0 0.0 0.0 0.0 0.0 0.0 0.0 0.0 32.8 42.4 0.0 0.0Staurodesmus 0.0 52.2 20.4 21.6 12.6 25.2 0.0 0.0 24.6 31.8 0.0 0.0
CHRYSOPHYTACentritractus 0.0 0.0 0.0 0.0 12.6 25.2 0.0 0.0 0.0 0.0 0.0 0.0Dinobryon 3024.0 3393.0 306.0 324.0 2961.0 2142.0 924.0 612.0 0.0 0.0 0.0 0.0Mallomonas 42.0 43.5 0.0 0.0 0.0 0.0 0.0 0.0 0.0 0.0 0.0 116.0Ochromonas 0.0 0.0 0.0 0.0 7.4 4.2 15.4 8.5 0.0 0.0 0.0 0.0Synura 0.0 0.0 0.0 0.0 0.0 0.0 0.0 0.0 0.0 0.0 0.0 0.0Flagellated coccoid golden 0.0 0.0 0.0 0.0 0.0 0.0 0.0 0.0 0.0 0.0 0.0 0.0
CRYPTOPHYTACryptomonas 0.0 0.0 462.4 172.8 42.0 71.4 158.4 122.4 73.8 84.8 86.4 46.4
CYANOPHYTAAnabaena spp. 0.0 0.0 95.2 28.8 403.2 1344.0 2904.0 1904.0 1476.0 424.0 162.0 348.0Anabaena aphanizomenoides 0.0 0.0 0.0 0.0 27.3 0.0 858.0 1591.2 7995.0 11575.2 1263.6 1508.0Aphanizomenon 0.0 0.0 0.0 0.0 0.0 0.0 0.0 0.0 0.0 0.0 0.0 0.0Aphanocapsa 0.0 0.0 0.0 0.0 0.0 0.0 0.0 0.0 0.0 0.0 0.0 40.6
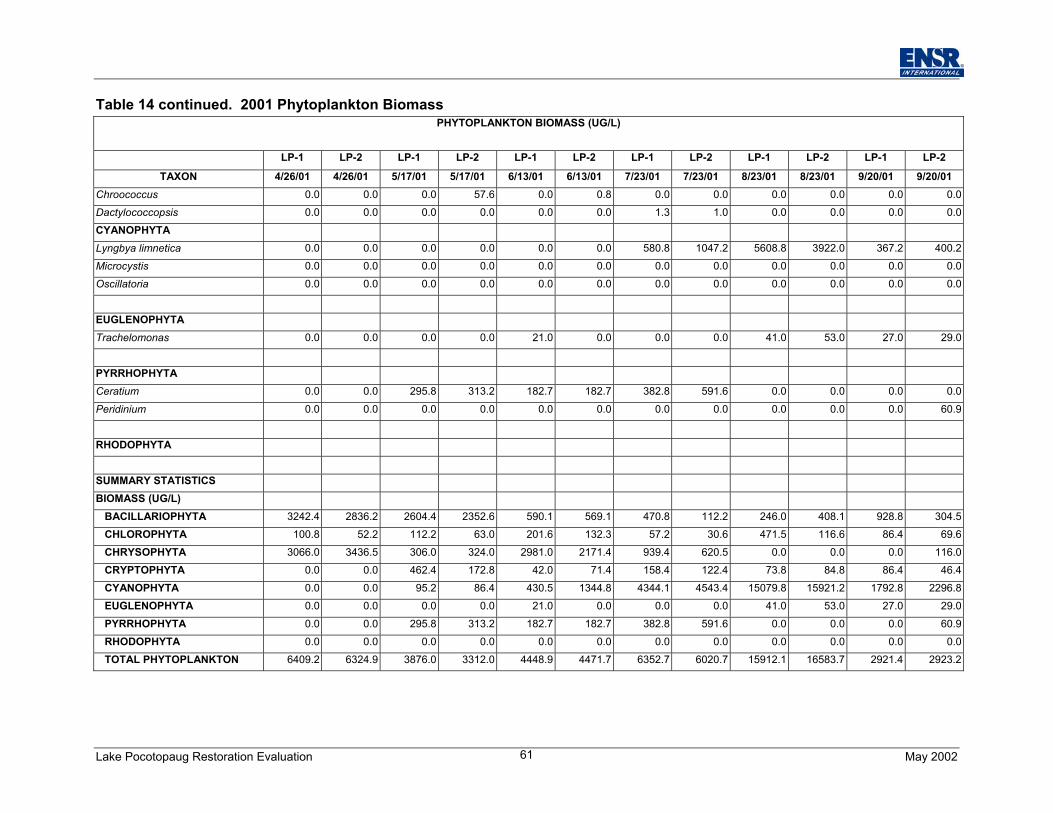
Lake Pocotopaug Restoration Evaluation May 200261
Table 14 continued. 2001 Phytoplankton BiomassPHYTOPLANKTON BIOMASS (UG/L)
LP-1 LP-2 LP-1 LP-2 LP-1 LP-2 LP-1 LP-2 LP-1 LP-2 LP-1 LP-2
TAXON 4/26/01 4/26/01 5/17/01 5/17/01 6/13/01 6/13/01 7/23/01 7/23/01 8/23/01 8/23/01 9/20/01 9/20/01Chroococcus 0.0 0.0 0.0 57.6 0.0 0.8 0.0 0.0 0.0 0.0 0.0 0.0Dactylococcopsis 0.0 0.0 0.0 0.0 0.0 0.0 1.3 1.0 0.0 0.0 0.0 0.0CYANOPHYTALyngbya limnetica 0.0 0.0 0.0 0.0 0.0 0.0 580.8 1047.2 5608.8 3922.0 367.2 400.2Microcystis 0.0 0.0 0.0 0.0 0.0 0.0 0.0 0.0 0.0 0.0 0.0 0.0Oscillatoria 0.0 0.0 0.0 0.0 0.0 0.0 0.0 0.0 0.0 0.0 0.0 0.0
EUGLENOPHYTATrachelomonas 0.0 0.0 0.0 0.0 21.0 0.0 0.0 0.0 41.0 53.0 27.0 29.0
PYRRHOPHYTACeratium 0.0 0.0 295.8 313.2 182.7 182.7 382.8 591.6 0.0 0.0 0.0 0.0Peridinium 0.0 0.0 0.0 0.0 0.0 0.0 0.0 0.0 0.0 0.0 0.0 60.9
RHODOPHYTA
SUMMARY STATISTICSBIOMASS (UG/L) BACILLARIOPHYTA 3242.4 2836.2 2604.4 2352.6 590.1 569.1 470.8 112.2 246.0 408.1 928.8 304.5 CHLOROPHYTA 100.8 52.2 112.2 63.0 201.6 132.3 57.2 30.6 471.5 116.6 86.4 69.6 CHRYSOPHYTA 3066.0 3436.5 306.0 324.0 2981.0 2171.4 939.4 620.5 0.0 0.0 0.0 116.0 CRYPTOPHYTA 0.0 0.0 462.4 172.8 42.0 71.4 158.4 122.4 73.8 84.8 86.4 46.4 CYANOPHYTA 0.0 0.0 95.2 86.4 430.5 1344.8 4344.1 4543.4 15079.8 15921.2 1792.8 2296.8 EUGLENOPHYTA 0.0 0.0 0.0 0.0 21.0 0.0 0.0 0.0 41.0 53.0 27.0 29.0 PYRRHOPHYTA 0.0 0.0 295.8 313.2 182.7 182.7 382.8 591.6 0.0 0.0 0.0 60.9 RHODOPHYTA 0.0 0.0 0.0 0.0 0.0 0.0 0.0 0.0 0.0 0.0 0.0 0.0 TOTAL PHYTOPLANKTON 6409.2 6324.9 3876.0 3312.0 4448.9 4471.7 6352.7 6020.7 15912.1 16583.7 2921.4 2923.2
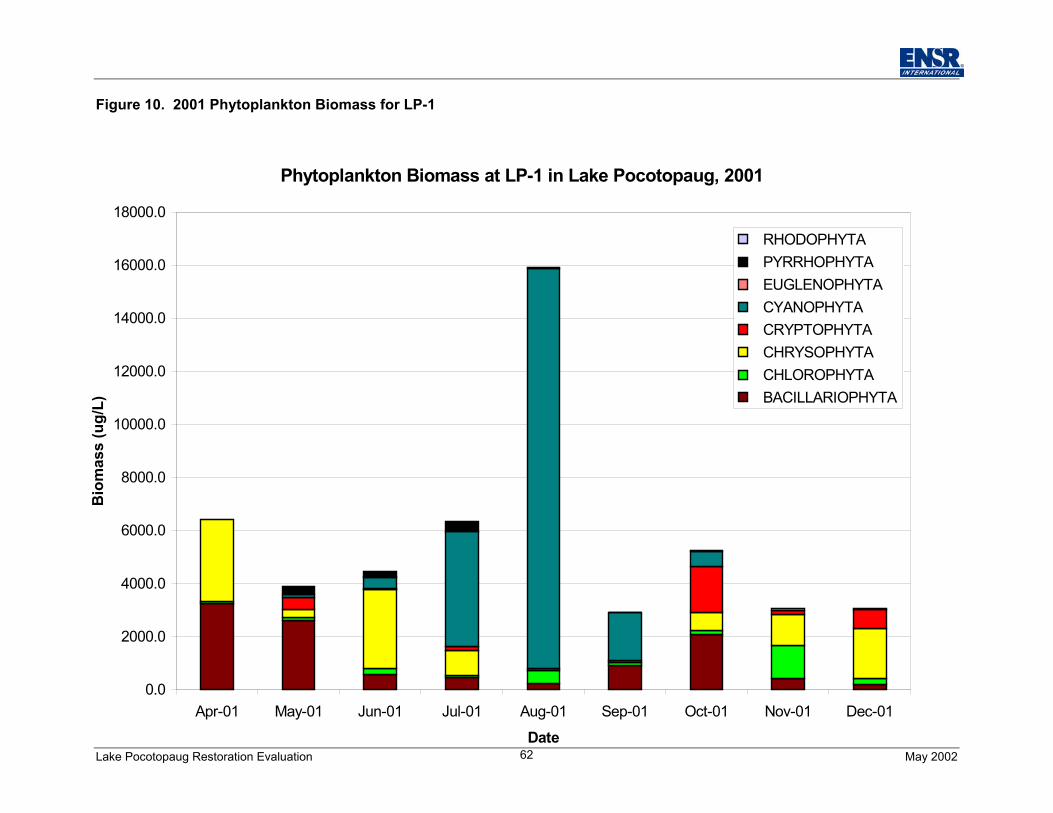
Lake Pocotopaug Restoration Evaluation May 200262
Figure 10. 2001 Phytoplankton Biomass for LP-1
Phytoplankton Biomass at LP-1 in Lake Pocotopaug, 2001
0.0
2000.0
4000.0
6000.0
8000.0
10000.0
12000.0
14000.0
16000.0
18000.0
Apr-01 May-01 Jun-01 Jul-01 Aug-01 Sep-01 Oct-01 Nov-01 Dec-01
Date
Bio
mas
s (u
g/L)
RHODOPHYTA PYRRHOPHYTA EUGLENOPHYTA CYANOPHYTA CRYPTOPHYTA CHRYSOPHYTA CHLOROPHYTA BACILLARIOPHYTA
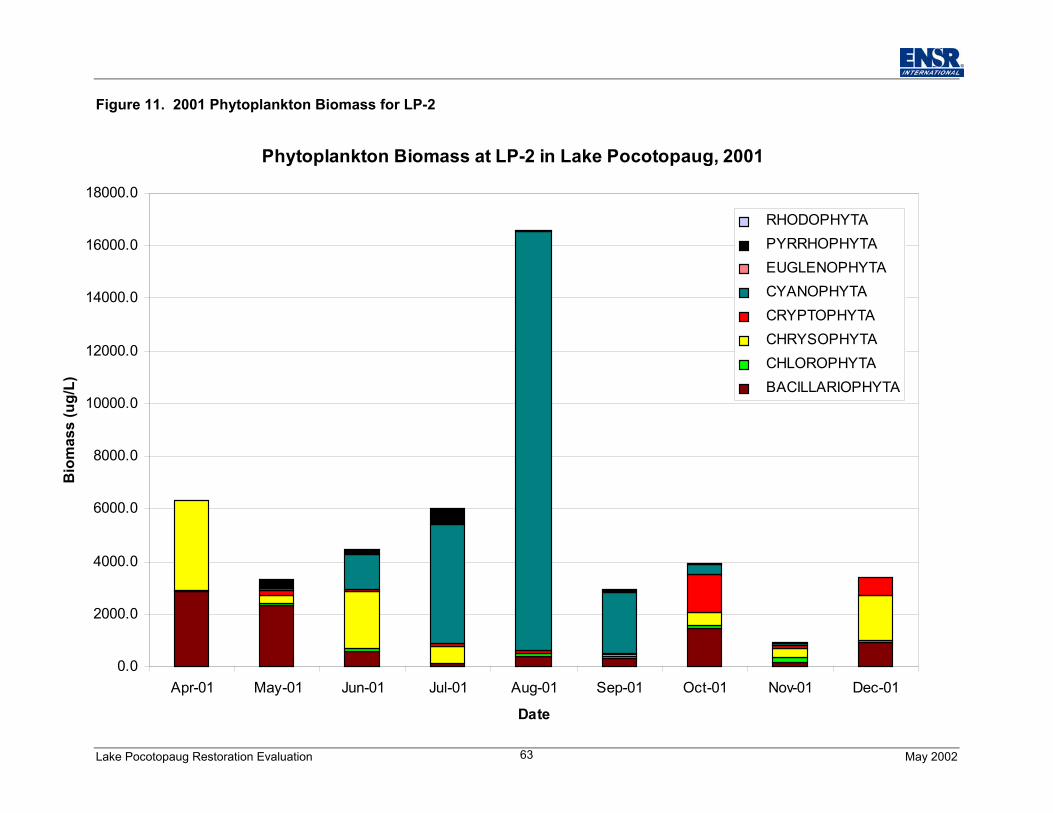
Lake Pocotopaug Restoration Evaluation May 200263
Figure 11. 2001 Phytoplankton Biomass for LP-2
Phytoplankton Biomass at LP-2 in Lake Pocotopaug, 2001
0.0
2000.0
4000.0
6000.0
8000.0
10000.0
12000.0
14000.0
16000.0
18000.0
Apr-01 May-01 Jun-01 Jul-01 Aug-01 Sep-01 Oct-01 Nov-01 Dec-01
Date
Bio
mas
s (u
g/L)
RHODOPHYTA PYRRHOPHYTA EUGLENOPHYTA CYANOPHYTA CRYPTOPHYTA CHRYSOPHYTA CHLOROPHYTA BACILLARIOPHYTA

Lake Pocotopaug Restoration Evaluation May 200264
The late summer bloom of blue-greens is consistent with conditions in past years. Water claritywas higher for longer in the summer than in most recent years, but the eventual decline to levelsundesirable for contact recreation suggests that the successful inactivation of phosphorus indeeper sediments of the lake is not the whole answer to controlling algae in Lake Pocotopaug.
Hypolimnetic phosphorus levels were indeed very low in 2001, and epilimnetic phosphorusconcentrations rarely >10 ug/L, but the bloom still occurred. This is an unusual phenomenon insouthern New England lakes and warrants further investigation.
It has been hypothesized that a bloom of toxic golden algae in the fall of 1999 was responsiblefor the fish kill of late 1999 and early 2000. It is assumed that an increase in claritycorresponded to a die off of those algae, with release of the toxin into the water. Althoughplausible, this scenario does not appear to be consistent with observed 2001 conditions. Nohaptophytes were found in the Pocotopaug samples collected in the fall and early winter of2001. Even if those specific types of golden algae known to be potentially toxic are present inLake Pocotopaug, the densities observed in 2001 appear too low to elicit a toxic response byfish. Fish did again school up at the mouths of tributaries to the lake, and there was anoticeable increase in clarity in December, but the increase in clarity corresponds to a shift togreater dominance by non-haptophyte golden algae. It is possible that algae bloomed and diedoff between the November and December sampling dates, but this is highly speculative.
6.3.2 Chlorophyll aChlorophyll a samples were collected utilizing the same methods as phytoplakton. However,chlorophyll a samples were taken from April to September only.
Chlorophyll is the green pigment in plants, with chlorophyll a common to all plants and oftenused as a surrogate for biomass or primary production potential in aquatic environments.Values <1 µg/l are hardly detectable to human eyes, while values >10 µg/l usually impart somecolor to the water. Values >20 µg/l are often associated with undesirable conditions, with levels>100 µg/l often described as appearing like a “paint spill” or “pea soup”. Chlorophyll breaksdown into other pigments that can be measured, with phaeophytin usually taken as an indicatorof dying algae. Even a healthy algae community will have some phaeophytin, but it should be aminor component of the total chlorophyll concentration.
Total chlorophyll a concentration in Lake Pocotopaug ranged from 1.5 to 14.8 µg/l with anaverage of 6.0 and 5.5 µg/l for LP-1 and LP-2, respectively (Table 10). Most of this pigmentwas active, healthy chlorophyll. As seen in the past, nuisance levels of phytoplankton exist atchlorophyll levels below the 20 ug/L threshold in Lake Pocotopaug. Values at peakphytoplankton biomass were between 6 and 11 ug/L. Therefore Wetzel’s (1983) cutoff value of4 µg/l for overfertilized (eutrophic) systems is a more appropriate target for mean chlorophylllevels in Lake Pocotopaug than the 10 ug/L threshold. This represents enough of a food base
Lake Pocotopaug Restoration Evaluation May 200265
to support a thriving fishery but not enough to present any aesthetic or safety issues forswimmers and boaters.
6.3.3 ZooplanktonThe zooplankton of Lake Pocotopaug were sampled at two stations monthly from April toSeptember. A net with 53 um mesh size was towed through 30 m of water, yielding aconcentrate from 942 liters of water. Concentrates were examined in a Sedgewick Raftercounting chamber at 40x to 100x with brightfield optics. Zooplankters were identified, measuredand enumerated (Table 15). Results were converted to biomass based on genus-specificlength-weight regressions (Table 16).
Types of zooplankton in Lake Pocotopaug were typical of southern New England lakes, withprotozoans, rotifers, copepods and cladocerans all present, as well as the phantom midgeChaoborus (found in two samples). Copepods and cladocerans were the most abundantzooplankters, but overall abundance was quite low in most samples. A biomass of >100 ug/L isgenerally considered necessary to provide adequate fish food and filter enough lake water on adaily basis to exercise some control over algal abundance. Only the May sample from station 1exhibited a biomass >100 ug/L, and over half the biomass values were <30 ug/L.
While several large bodied cladocerans (especially Daphnia pulex and D. retrocurva) wereobserved in May samples, these were generally absent later in the year and the largestzooplankters were often copepods. The overall mean length of zooplankters was low (<0.4mm) in half the samples and moderate (>0.4 but <0.7 mm) in the other half. Mean size for justthe crustacean zooplankters (copepods and cladocerans) was moderate at 0.41 to 0.76 mm.Small to moderate mean length and low biomass indicate both sub-optimal grazing control overalgae and limited food availability for small fish. Food quality can affect zooplankton sizedistribution and abundance, but there is no indication of poor quality (mainly diatoms and goldenalgae) in spring, and predation by abundant panfish is suspected as the primary force shapingthe zooplankton community.

Lake Pocotopaug Restoration Evaluation May 200266
Table 15. 2001 Zooplankton DensityZOOPLANKTON DENSITY (#/L)
LP-1 LP-2 LP-1 LP-2 LP-1 LP-2 LP-1 LP-2 LP-1 LP-2 LP-1 LP-2TAXON 04/26/01 04/26/01 05/17/01 05/17/01 06/13/01 06/13/01 07/23/01 07/23/01 08/23/01 08/23/01 09/20/01 09/20/01
PROTOZOACiliophora 0.0 0.0 23.5 11.2 0.0 0.0 0.0 0.0 0.0 0.0 0.0 0.0Mastigophora 0.0 0.0 0.0 0.0 0.0 0.0 0.0 0.0 0.0 0.0 0.0 0.0Sarcodina 0.0 0.0 0.0 0.0 0.0 0.0 0.0 0.0 0.0 0.0 0.0 0.0
ROTIFERAAsplanchna 0.0 0.3 0.0 0.2 0.0 0.0 0.0 0.0 0.0 0.0 0.0 0.0Conochilus 0.0 0.0 15.7 10.4 0.0 0.0 0.0 0.0 0.1 0.0 0.0 0.0Filinia 0.0 0.3 0.0 0.0 0.0 0.0 0.0 0.0 0.0 0.0 0.0 0.0Kellicottia 0.0 4.0 0.0 0.0 0.0 0.0 0.0 0.0 0.0 0.0 0.2 0.2Keratella 2.7 6.1 6.9 2.9 1.3 0.3 2.5 0.8 0.3 0.2 0.1 0.9Polyarthra 0.0 0.3 0.0 0.4 0.5 0.2 0.0 0.0 0.0 0.0 0.0 0.1Trichocerca 0.0 0.0 0.0 0.2 0.0 0.0 0.0 0.0 0.1 0.0 0.1 0.1
COPEPODACopepoda-CyclopoidaCyclops 1.4 1.9 11.3 4.0 0.5 3.4 0.0 0.0 0.0 0.0 0.8 0.3Mesocyclops 0.0 0.0 0.0 0.9 0.2 0.2 2.5 3.8 0.5 0.5 0.7 0.7Copepoda-CalanoidaDiaptomus 0.9 0.8 1.0 0.7 0.5 0.2 6.3 6.1 1.3 1.9 0.4 0.5Copepoda-Harpacticoida 0.0 0.0 0.0 0.0 0.0 0.0 0.0 0.0 0.0 0.0 0.0 0.0Other Copepoda-Adults 0.0 0.0 0.0 0.0 0.0 0.0 0.0 0.0 0.0 0.0 0.0 0.0Other Copepoda-Copepodites 0.0 0.0 1.5 0.9 0.0 0.2 0.0 0.0 0.0 0.0 0.0 0.0Other Copepoda-Nauplii 0.1 0.2 5.9 0.7 0.5 0.6 2.9 3.5 0.7 0.5 0.7 0.4
CLADOCERAAlona 0.0 0.0 0.0 0.0 0.0 0.0 0.0 0.0 0.0 0.0 0.0 0.0Bosmina 0.9 1.0 5.4 0.7 0.0 0.0 0.4 0.3 0.0 0.0 0.0 0.0Ceriodaphnia 0.0 0.0 0.0 0.4 0.2 0.2 0.4 0.0 2.3 1.0 0.0 0.0Chydorus 0.3 0.2 0.0 0.0 0.0 0.0 0.0 0.2 7.5 25.2 7.9 8.8
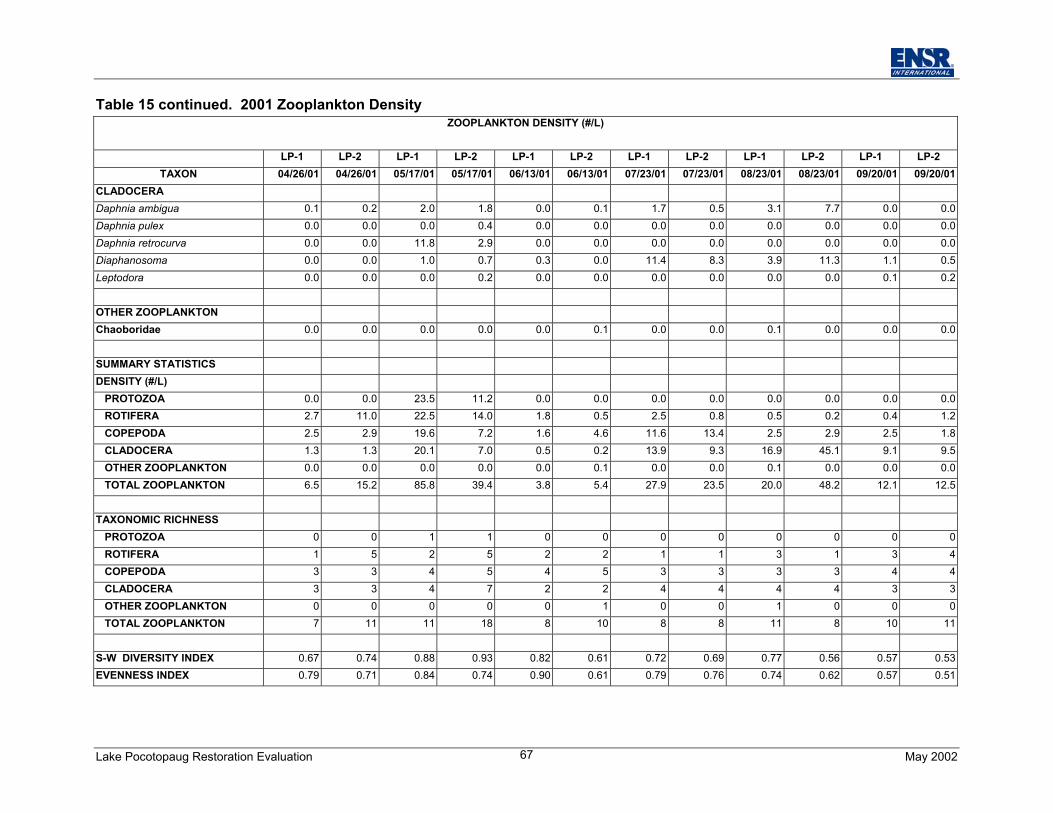
Lake Pocotopaug Restoration Evaluation May 200267
Table 15 continued. 2001 Zooplankton DensityZOOPLANKTON DENSITY (#/L)
LP-1 LP-2 LP-1 LP-2 LP-1 LP-2 LP-1 LP-2 LP-1 LP-2 LP-1 LP-2TAXON 04/26/01 04/26/01 05/17/01 05/17/01 06/13/01 06/13/01 07/23/01 07/23/01 08/23/01 08/23/01 09/20/01 09/20/01
CLADOCERADaphnia ambigua 0.1 0.2 2.0 1.8 0.0 0.1 1.7 0.5 3.1 7.7 0.0 0.0Daphnia pulex 0.0 0.0 0.0 0.4 0.0 0.0 0.0 0.0 0.0 0.0 0.0 0.0Daphnia retrocurva 0.0 0.0 11.8 2.9 0.0 0.0 0.0 0.0 0.0 0.0 0.0 0.0Diaphanosoma 0.0 0.0 1.0 0.7 0.3 0.0 11.4 8.3 3.9 11.3 1.1 0.5Leptodora 0.0 0.0 0.0 0.2 0.0 0.0 0.0 0.0 0.0 0.0 0.1 0.2
OTHER ZOOPLANKTONChaoboridae 0.0 0.0 0.0 0.0 0.0 0.1 0.0 0.0 0.1 0.0 0.0 0.0
SUMMARY STATISTICSDENSITY (#/L) PROTOZOA 0.0 0.0 23.5 11.2 0.0 0.0 0.0 0.0 0.0 0.0 0.0 0.0 ROTIFERA 2.7 11.0 22.5 14.0 1.8 0.5 2.5 0.8 0.5 0.2 0.4 1.2 COPEPODA 2.5 2.9 19.6 7.2 1.6 4.6 11.6 13.4 2.5 2.9 2.5 1.8 CLADOCERA 1.3 1.3 20.1 7.0 0.5 0.2 13.9 9.3 16.9 45.1 9.1 9.5 OTHER ZOOPLANKTON 0.0 0.0 0.0 0.0 0.0 0.1 0.0 0.0 0.1 0.0 0.0 0.0 TOTAL ZOOPLANKTON 6.5 15.2 85.8 39.4 3.8 5.4 27.9 23.5 20.0 48.2 12.1 12.5
TAXONOMIC RICHNESS PROTOZOA 0 0 1 1 0 0 0 0 0 0 0 0 ROTIFERA 1 5 2 5 2 2 1 1 3 1 3 4 COPEPODA 3 3 4 5 4 5 3 3 3 3 4 4 CLADOCERA 3 3 4 7 2 2 4 4 4 4 3 3 OTHER ZOOPLANKTON 0 0 0 0 0 1 0 0 1 0 0 0 TOTAL ZOOPLANKTON 7 11 11 18 8 10 8 8 11 8 10 11
S-W DIVERSITY INDEX 0.67 0.74 0.88 0.93 0.82 0.61 0.72 0.69 0.77 0.56 0.57 0.53EVENNESS INDEX 0.79 0.71 0.84 0.74 0.90 0.61 0.79 0.76 0.74 0.62 0.57 0.51
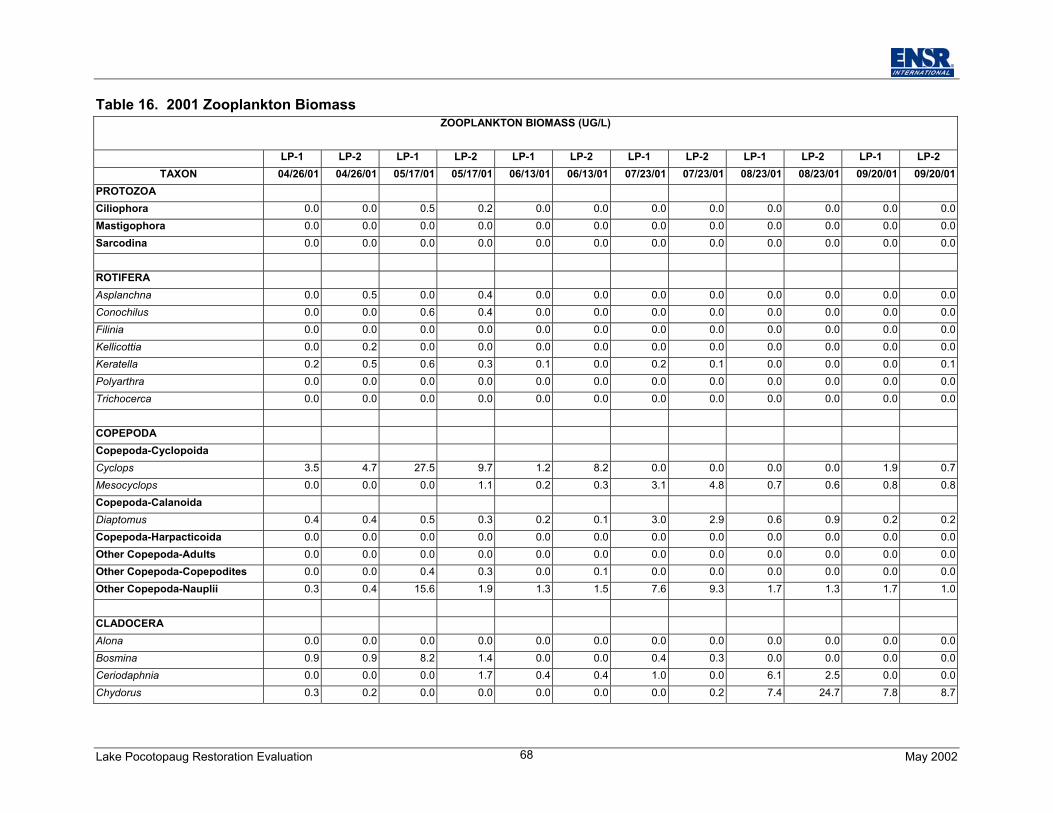
Lake Pocotopaug Restoration Evaluation May 200268
Table 16. 2001 Zooplankton BiomassZOOPLANKTON BIOMASS (UG/L)
LP-1 LP-2 LP-1 LP-2 LP-1 LP-2 LP-1 LP-2 LP-1 LP-2 LP-1 LP-2TAXON 04/26/01 04/26/01 05/17/01 05/17/01 06/13/01 06/13/01 07/23/01 07/23/01 08/23/01 08/23/01 09/20/01 09/20/01
PROTOZOACiliophora 0.0 0.0 0.5 0.2 0.0 0.0 0.0 0.0 0.0 0.0 0.0 0.0Mastigophora 0.0 0.0 0.0 0.0 0.0 0.0 0.0 0.0 0.0 0.0 0.0 0.0Sarcodina 0.0 0.0 0.0 0.0 0.0 0.0 0.0 0.0 0.0 0.0 0.0 0.0
ROTIFERAAsplanchna 0.0 0.5 0.0 0.4 0.0 0.0 0.0 0.0 0.0 0.0 0.0 0.0Conochilus 0.0 0.0 0.6 0.4 0.0 0.0 0.0 0.0 0.0 0.0 0.0 0.0Filinia 0.0 0.0 0.0 0.0 0.0 0.0 0.0 0.0 0.0 0.0 0.0 0.0Kellicottia 0.0 0.2 0.0 0.0 0.0 0.0 0.0 0.0 0.0 0.0 0.0 0.0Keratella 0.2 0.5 0.6 0.3 0.1 0.0 0.2 0.1 0.0 0.0 0.0 0.1Polyarthra 0.0 0.0 0.0 0.0 0.0 0.0 0.0 0.0 0.0 0.0 0.0 0.0Trichocerca 0.0 0.0 0.0 0.0 0.0 0.0 0.0 0.0 0.0 0.0 0.0 0.0
COPEPODACopepoda-CyclopoidaCyclops 3.5 4.7 27.5 9.7 1.2 8.2 0.0 0.0 0.0 0.0 1.9 0.7Mesocyclops 0.0 0.0 0.0 1.1 0.2 0.3 3.1 4.8 0.7 0.6 0.8 0.8Copepoda-CalanoidaDiaptomus 0.4 0.4 0.5 0.3 0.2 0.1 3.0 2.9 0.6 0.9 0.2 0.2Copepoda-Harpacticoida 0.0 0.0 0.0 0.0 0.0 0.0 0.0 0.0 0.0 0.0 0.0 0.0Other Copepoda-Adults 0.0 0.0 0.0 0.0 0.0 0.0 0.0 0.0 0.0 0.0 0.0 0.0Other Copepoda-Copepodites 0.0 0.0 0.4 0.3 0.0 0.1 0.0 0.0 0.0 0.0 0.0 0.0Other Copepoda-Nauplii 0.3 0.4 15.6 1.9 1.3 1.5 7.6 9.3 1.7 1.3 1.7 1.0
CLADOCERAAlona 0.0 0.0 0.0 0.0 0.0 0.0 0.0 0.0 0.0 0.0 0.0 0.0Bosmina 0.9 0.9 8.2 1.4 0.0 0.0 0.4 0.3 0.0 0.0 0.0 0.0Ceriodaphnia 0.0 0.0 0.0 1.7 0.4 0.4 1.0 0.0 6.1 2.5 0.0 0.0Chydorus 0.3 0.2 0.0 0.0 0.0 0.0 0.0 0.2 7.4 24.7 7.8 8.7
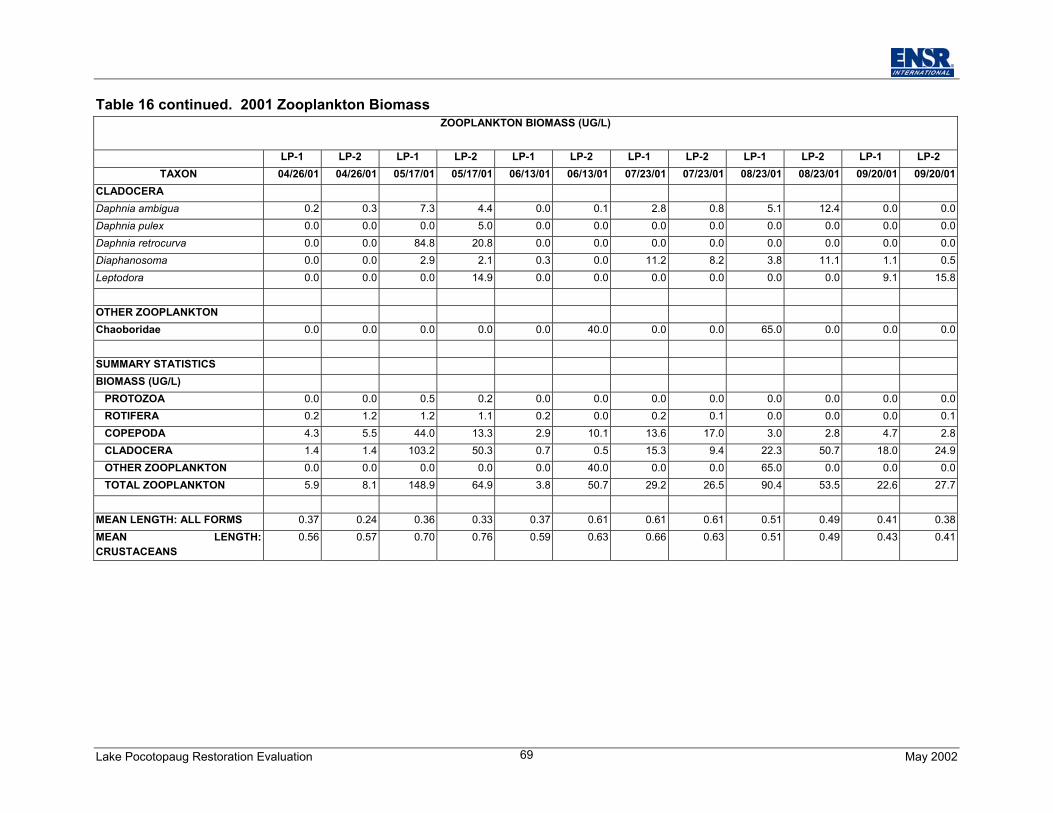
Lake Pocotopaug Restoration Evaluation May 200269
Table 16 continued. 2001 Zooplankton BiomassZOOPLANKTON BIOMASS (UG/L)
LP-1 LP-2 LP-1 LP-2 LP-1 LP-2 LP-1 LP-2 LP-1 LP-2 LP-1 LP-2TAXON 04/26/01 04/26/01 05/17/01 05/17/01 06/13/01 06/13/01 07/23/01 07/23/01 08/23/01 08/23/01 09/20/01 09/20/01
CLADOCERADaphnia ambigua 0.2 0.3 7.3 4.4 0.0 0.1 2.8 0.8 5.1 12.4 0.0 0.0Daphnia pulex 0.0 0.0 0.0 5.0 0.0 0.0 0.0 0.0 0.0 0.0 0.0 0.0Daphnia retrocurva 0.0 0.0 84.8 20.8 0.0 0.0 0.0 0.0 0.0 0.0 0.0 0.0Diaphanosoma 0.0 0.0 2.9 2.1 0.3 0.0 11.2 8.2 3.8 11.1 1.1 0.5Leptodora 0.0 0.0 0.0 14.9 0.0 0.0 0.0 0.0 0.0 0.0 9.1 15.8
OTHER ZOOPLANKTONChaoboridae 0.0 0.0 0.0 0.0 0.0 40.0 0.0 0.0 65.0 0.0 0.0 0.0
SUMMARY STATISTICSBIOMASS (UG/L) PROTOZOA 0.0 0.0 0.5 0.2 0.0 0.0 0.0 0.0 0.0 0.0 0.0 0.0 ROTIFERA 0.2 1.2 1.2 1.1 0.2 0.0 0.2 0.1 0.0 0.0 0.0 0.1 COPEPODA 4.3 5.5 44.0 13.3 2.9 10.1 13.6 17.0 3.0 2.8 4.7 2.8 CLADOCERA 1.4 1.4 103.2 50.3 0.7 0.5 15.3 9.4 22.3 50.7 18.0 24.9 OTHER ZOOPLANKTON 0.0 0.0 0.0 0.0 0.0 40.0 0.0 0.0 65.0 0.0 0.0 0.0 TOTAL ZOOPLANKTON 5.9 8.1 148.9 64.9 3.8 50.7 29.2 26.5 90.4 53.5 22.6 27.7
MEAN LENGTH: ALL FORMS 0.37 0.24 0.36 0.33 0.37 0.61 0.61 0.61 0.51 0.49 0.41 0.38MEAN LENGTH:CRUSTACEANS
0.56 0.57 0.70 0.76 0.59 0.63 0.66 0.63 0.51 0.49 0.43 0.41
Lake Pocotopaug Restoration Evaluation May 200270
7.0 RELATIONSHIPS AND TRENDS
7.1 Precipitation
There is no significant relationship between four of the five in-lake water quality variablesanalyzed and precipitation. The sum of precipitation values 7 and 30 days prior to samplingwere plotted against turbidity, TP, DP, SDT, and chlorophyll a from 1991-2001. There was nosignificant correlation between any of these variables and 7 and 30 days of accumulatedprecipitation. However, when only summer values were regressed, a significant correlation wasreported for chlorophyll a and 30 days of precipitation (P < 0.05). Approximately 97% of thevariation in chlorophyll a were accounted for by precipitation (Figure 12).
Precipitation patterns by year and water quality variable concentration graphs are provided inAppendix B.
7.2 Secchi Disk Transparency, Total Phosphorus and Chlorophyll a
Mathematical relationships between SDT, TP and chl a have been developed over time. Datafrom Lake Pocotopaug was plotted against relationships established by:
♦ Carlson (1977) - using a data set from all of North America,♦ Frink and Norvell (1984) - using Connecticut lake data for SDT vs chl a, and chl a vs TP,
and♦ Ad Hoc Lake Advisory Committee – using Lake Pocotopaug Data for SDT vs TP
Using all surface water in-lake data (1991 – 2001), SDT was plotted against TP. This producedsubstantial scatter (Figure 13) and does not appear to follow the trend outlined by either Carlsonor the AHLAC. Plotting only July and August data did not reduce scatter but data were closer tothe AHLAC curve. Data were further reduced to include only 2001 SDT and TP (Figure 14).Although some data fell along the VLSG curve, the majority of it was skewed to the left (lowerTP concentration vs SDT). Surface and mid-depth phosphorus values were then average,assuming that mid-depth TP was available for phytoplankton uptake, shifting the values towardthe right (Figure 15). Interestingly, SDT was the lowest in August (concurrent with the highestphytoplankton density), yet TP values were low (approximately 10 ug/L); down and to the left ofthe AHLAC curve. In summary, Lake Pocotopaug exhibits lower SDT than predicted based onTP concentrations. Either SDT is limited by non-algal turbidity and/or phytoplankton are presentin moderate to high densities even with limited phosphorus availability.

Lake Pocotopaug Restoration Evaluation May 200271
Figure 12. Average Surface July and August Chlorophyll a vs. 30 Days of Precipitation.
30 Day Precipitation vs Chlorophyll a
R2 = 0.9718
0.00
1.00
2.00
3.00
4.00
5.00
6.00
7.00
8.00
0 5 10 15 20 25
Chlorophyll a (ug/L)
Prec
ipita
tion
(in)
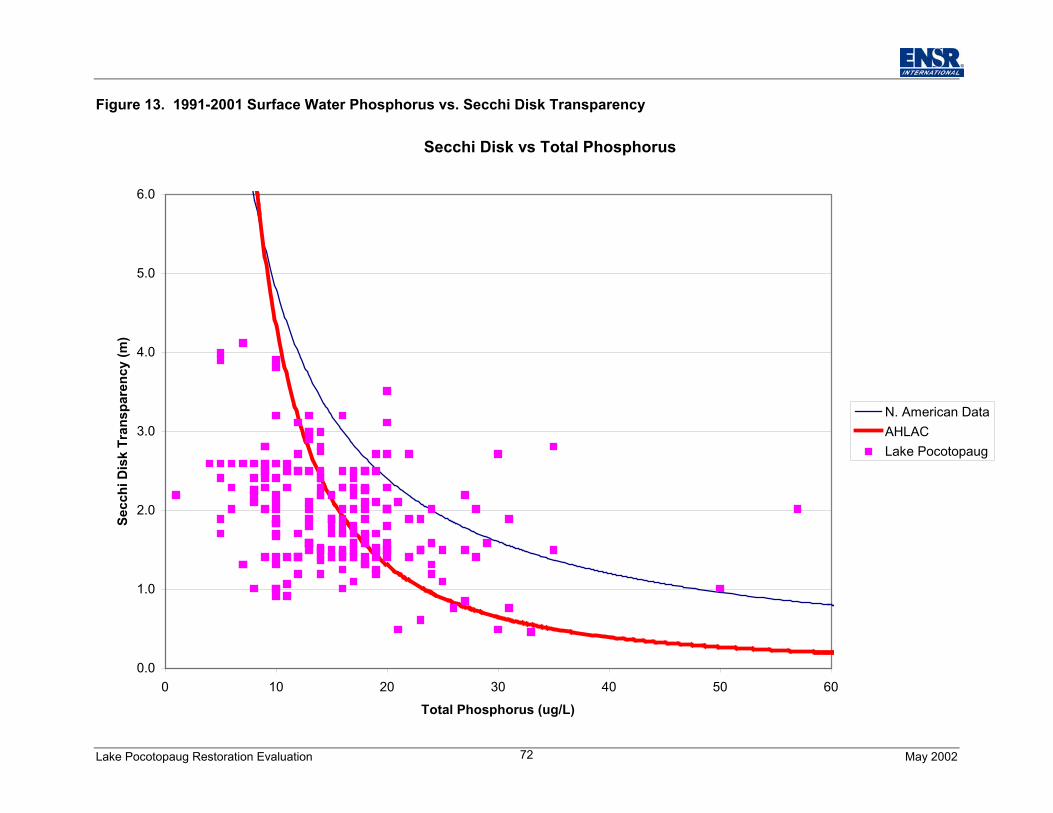
Lake Pocotopaug Restoration Evaluation May 200272
Figure 13. 1991-2001 Surface Water Phosphorus vs. Secchi Disk Transparency
Secchi Disk vs Total Phosphorus
0.0
1.0
2.0
3.0
4.0
5.0
6.0
0 10 20 30 40 50 60
Total Phosphorus (ug/L)
Secc
hi D
isk
Tran
spar
ency
(m)
N. American DataAHLACLake Pocotopaug
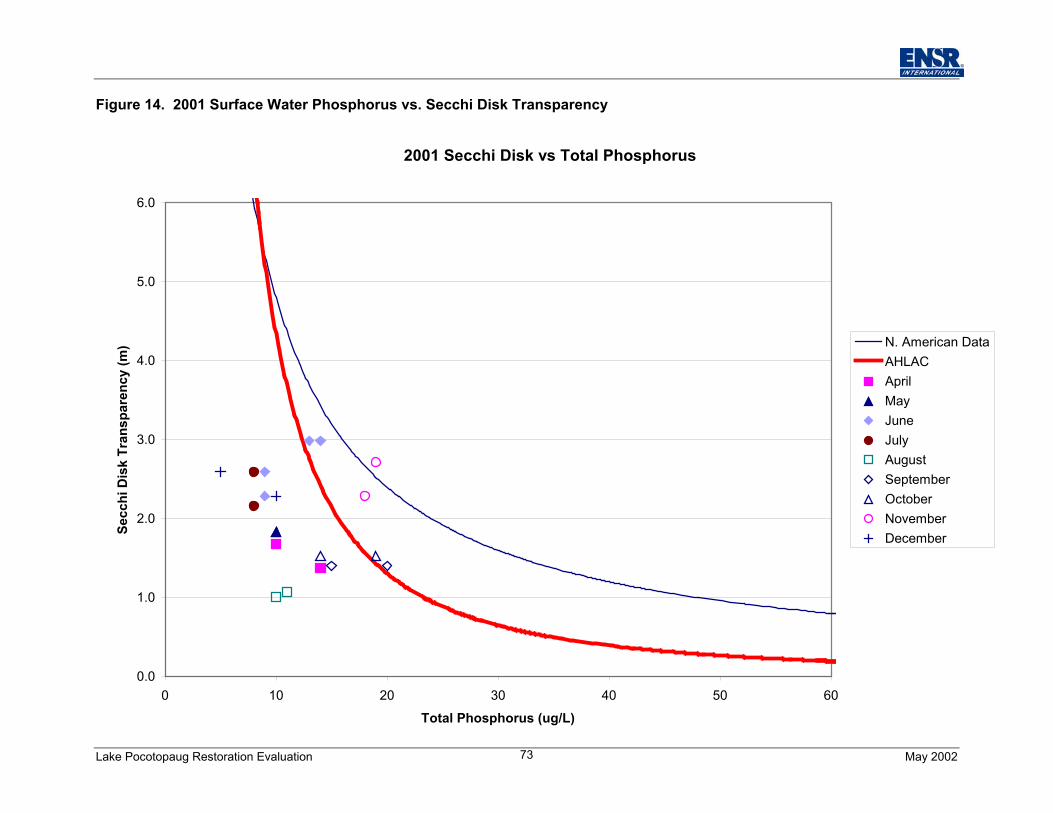
Lake Pocotopaug Restoration Evaluation May 200273
Figure 14. 2001 Surface Water Phosphorus vs. Secchi Disk Transparency
2001 Secchi Disk vs Total Phosphorus
0.0
1.0
2.0
3.0
4.0
5.0
6.0
0 10 20 30 40 50 60
Total Phosphorus (ug/L)
Secc
hi D
isk
Tran
spar
ency
(m) N. American Data
AHLACAprilMayJuneJulyAugustSeptemberOctoberNovemberDecember
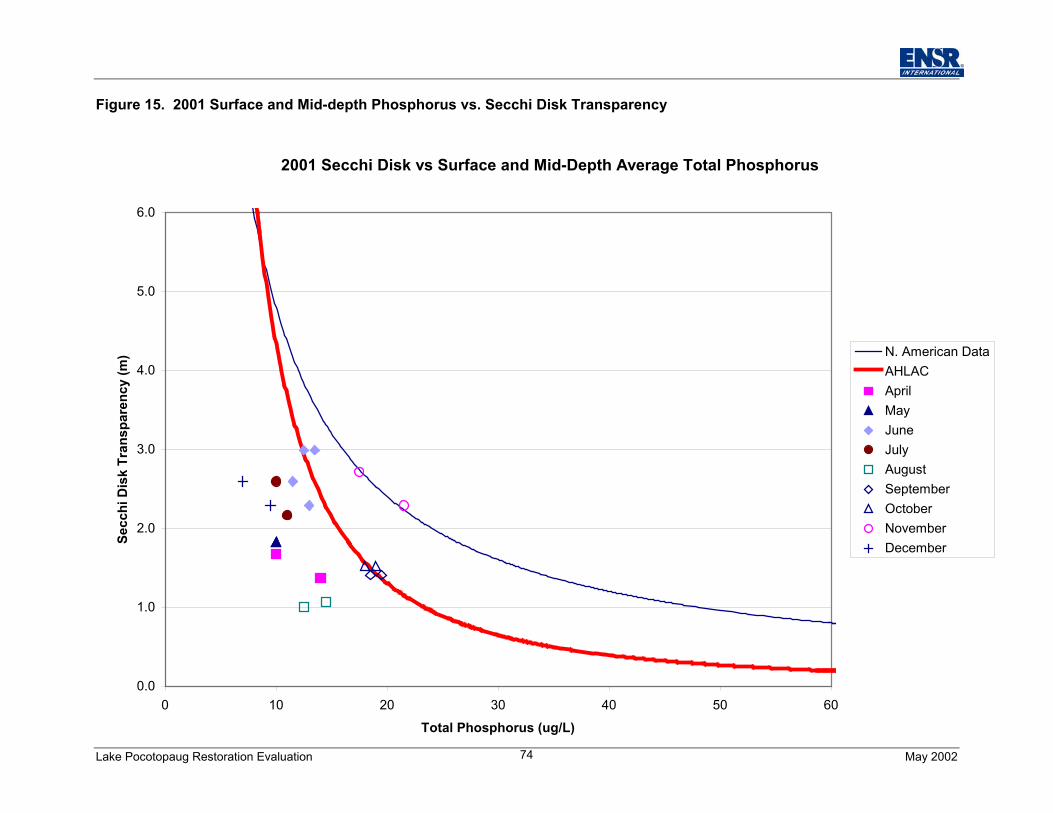
Lake Pocotopaug Restoration Evaluation May 200274
Figure 15. 2001 Surface and Mid-depth Phosphorus vs. Secchi Disk Transparency
2001 Secchi Disk vs Surface and Mid-Depth Average Total Phosphorus
0.0
1.0
2.0
3.0
4.0
5.0
6.0
0 10 20 30 40 50 60
Total Phosphorus (ug/L)
Secc
hi D
isk
Tran
spar
ency
(m) N. American Data
AHLACAprilMayJuneJulyAugustSeptemberOctoberNovemberDecember
Lake Pocotopaug Restoration Evaluation May 200275
The same analysis was performed with SDT and chlorophyll a values from 1991-2001, but usingCarlsons and Frink and Norvell data (Figure 16). Scatter was worse; data did not fit eithercurve. Reducing the data set to July and August values did not increase the correlation (Figure17). Data by year was plotted. 2001 appeared to follow the trend, but values were again shifteddown and to the left (Figure 18); indicating that Pocotopaug is exhibiting lower SDT based onchlorophyll a values. One could conclude that SDT is based more on non-algal turbidity.
Total phosphorus and chlorophyll a values were plotted and compared to Carlson’s and Frinkand Norvell’s data. Again, all 1991-2001 and July/August data produced much scatter (Figures19 and 20). 1991, 1993 and 2001 data were plotted separately (these are the only three yearswith chlorophyll a data). 2001 data provided the closest fit, although the slope was steeper thanCarlson or Frink and Norvell (Figure 21). The steeper upward trend indicates that there is morechlorophyll a than predicted by phosphorus concentrations. Algal density is higher thanexpected; algae are thriving in a lower phosphorus environment. However, more chlorophyll adata are needed to verify this trend.
When comparing Lake Pocotopaug 2001 (TP between 10 and 20 ug/L) data to empirical modelspresented in literature, we find that average chlorophyll a in Lake Pocotopaug should bebetween 2.1 and 9.9 ug/L (Table 17). In 2001, Lake Pocotopaug average chlorophyll was 5.8ug/L, within the predicted average of the four empirical model calculations (3.1 – 7.6 ug/L).However, considering that average TP concentrations in 2001 were closer to the 10 ug/L (12and 13 ug/L), 2001 chlorophyll values are high compared to the empirical model predictions.Similarly, maximum chlorophyll values in Lake Pocotopaug were 11.7 and 14.8 ug/L at LP-1 andLP-2 respectively, within the 11.2 – 26.1 ug/L average maxima range. Indicating that LakePocotopaug resembles most lakes at their worst condition (maxima are closer to measuredLake Pocotopaug values than averages). Average 2001 SDT was 2.01 m, below the predictedaverage for both 10 and 20 ug/L. Maximum 2001 SDT was 2.99 m, below predicted maxima.
Using the average and maximum predicted chlorophyll, SDT was predicted using Carlson(1977) and Frink and Norvell (1984) calculations. Carlson’s average and maximum SDT rangedfrom 1.93 – 3.57 m and 0.84 – 1.49 m, respectively. Frink and Norvell average and maximumSDT ranged from 2.98 – 4.78 and 1.18 – 2.30 m, respectively. This indicates that if LakePocotopaug behaved more like other lakes (reduce chlorophyll concentrations per unit TP),average SDT should be slightly lower than 3.57 and 4.78 m, with a worse case scenario ofslightly less than 1.49 – 2.30 m. Thus, increasing current average SDT by 1.5 m or greater,provided that SDT in Lake Pocotopaug is chl a driven.
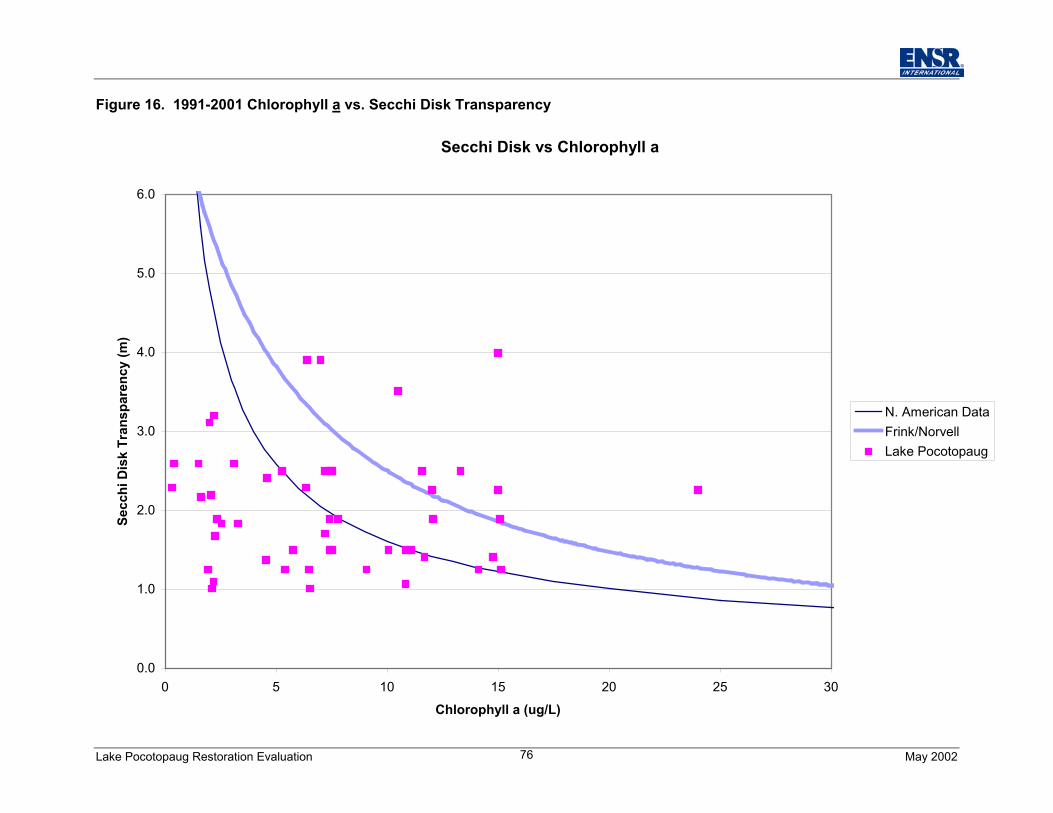
Lake Pocotopaug Restoration Evaluation May 200276
Figure 16. 1991-2001 Chlorophyll a vs. Secchi Disk Transparency
Secchi Disk vs Chlorophyll a
0.0
1.0
2.0
3.0
4.0
5.0
6.0
0 5 10 15 20 25 30
Chlorophyll a (ug/L)
Secc
hi D
isk
Tran
spar
ency
(m)
N. American DataFrink/NorvellLake Pocotopaug
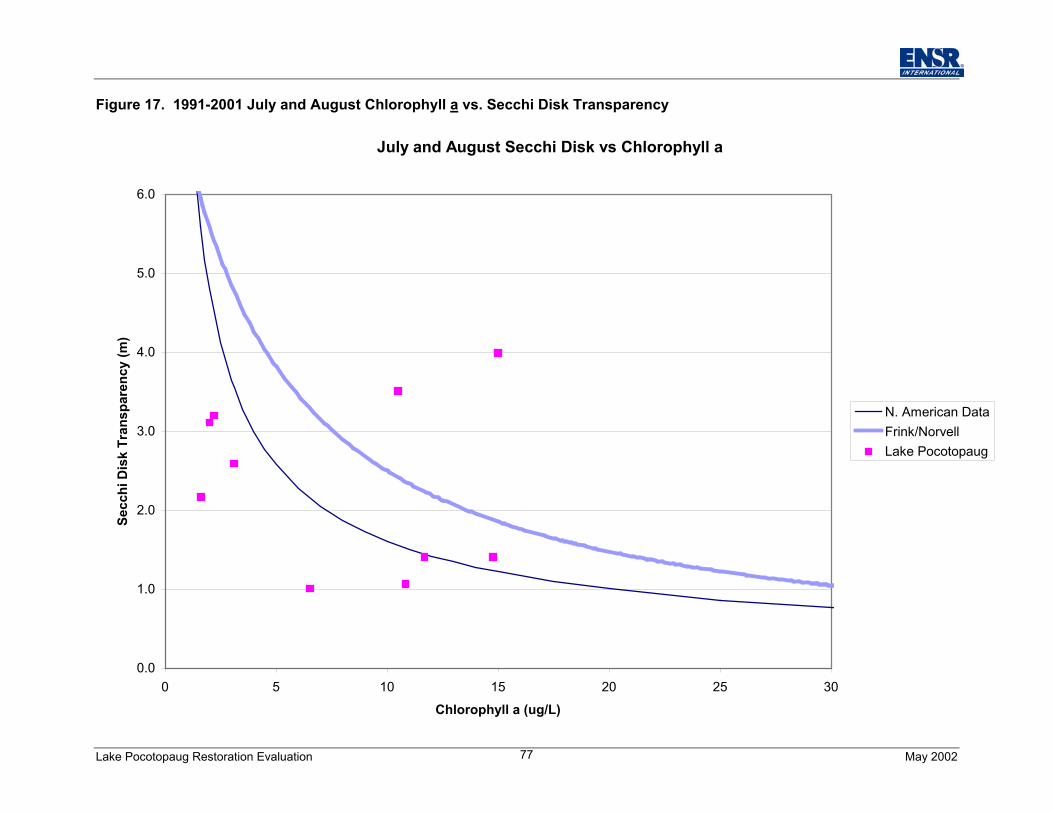
Lake Pocotopaug Restoration Evaluation May 200277
Figure 17. 1991-2001 July and August Chlorophyll a vs. Secchi Disk Transparency
July and August Secchi Disk vs Chlorophyll a
0.0
1.0
2.0
3.0
4.0
5.0
6.0
0 5 10 15 20 25 30
Chlorophyll a (ug/L)
Secc
hi D
isk
Tran
spar
ency
(m)
N. American DataFrink/NorvellLake Pocotopaug
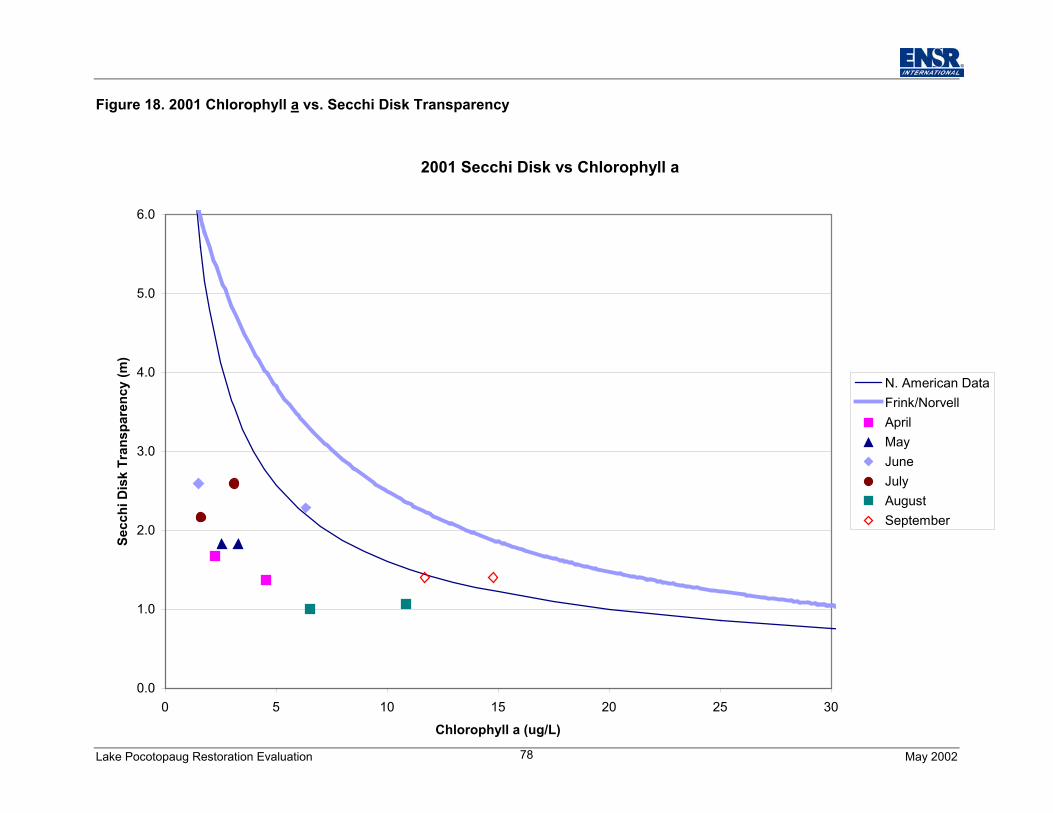
Lake Pocotopaug Restoration Evaluation May 200278
Figure 18. 2001 Chlorophyll a vs. Secchi Disk Transparency
2001 Secchi Disk vs Chlorophyll a
0.0
1.0
2.0
3.0
4.0
5.0
6.0
0 5 10 15 20 25 30
Chlorophyll a (ug/L)
Secc
hi D
isk
Tran
spar
ency
(m)
N. American DataFrink/NorvellAprilMayJuneJulyAugustSeptember
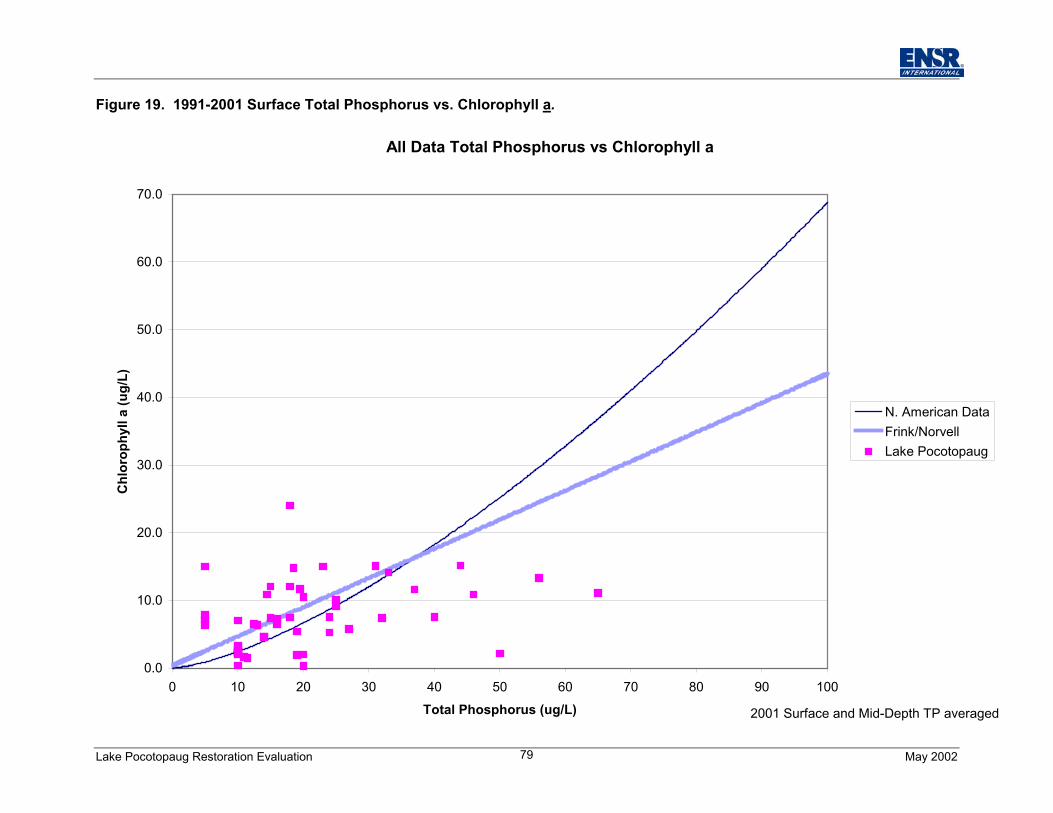
Lake Pocotopaug Restoration Evaluation May 200279
Figure 19. 1991-2001 Surface Total Phosphorus vs. Chlorophyll a.
All Data Total Phosphorus vs Chlorophyll a
0.0
10.0
20.0
30.0
40.0
50.0
60.0
70.0
0 10 20 30 40 50 60 70 80 90 100
Total Phosphorus (ug/L)
Chl
orop
hyll
a (u
g/L)
N. American DataFrink/NorvellLake Pocotopaug
2001 Surface and Mid-Depth TP averaged
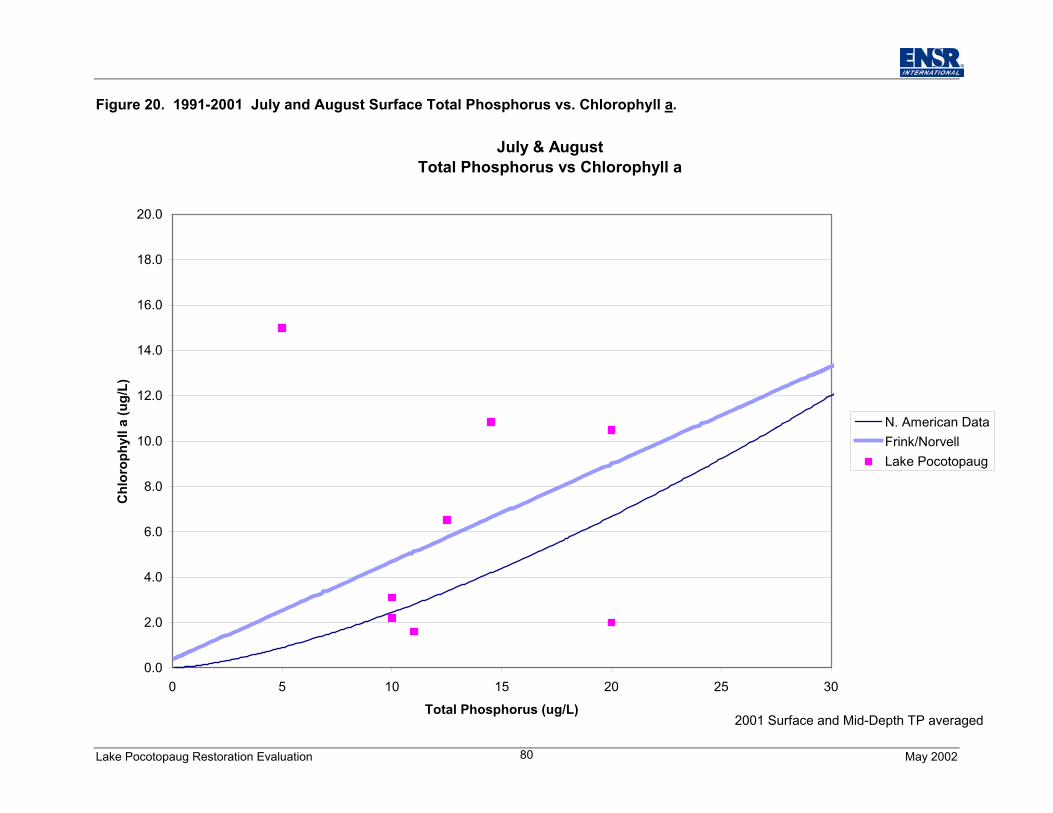
Lake Pocotopaug Restoration Evaluation May 200280
Figure 20. 1991-2001 July and August Surface Total Phosphorus vs. Chlorophyll a.
July & August Total Phosphorus vs Chlorophyll a
0.0
2.0
4.0
6.0
8.0
10.0
12.0
14.0
16.0
18.0
20.0
0 5 10 15 20 25 30
Total Phosphorus (ug/L)
Chl
orop
hyll
a (u
g/L)
N. American DataFrink/NorvellLake Pocotopaug
2001 Surface and Mid-Depth TP averaged
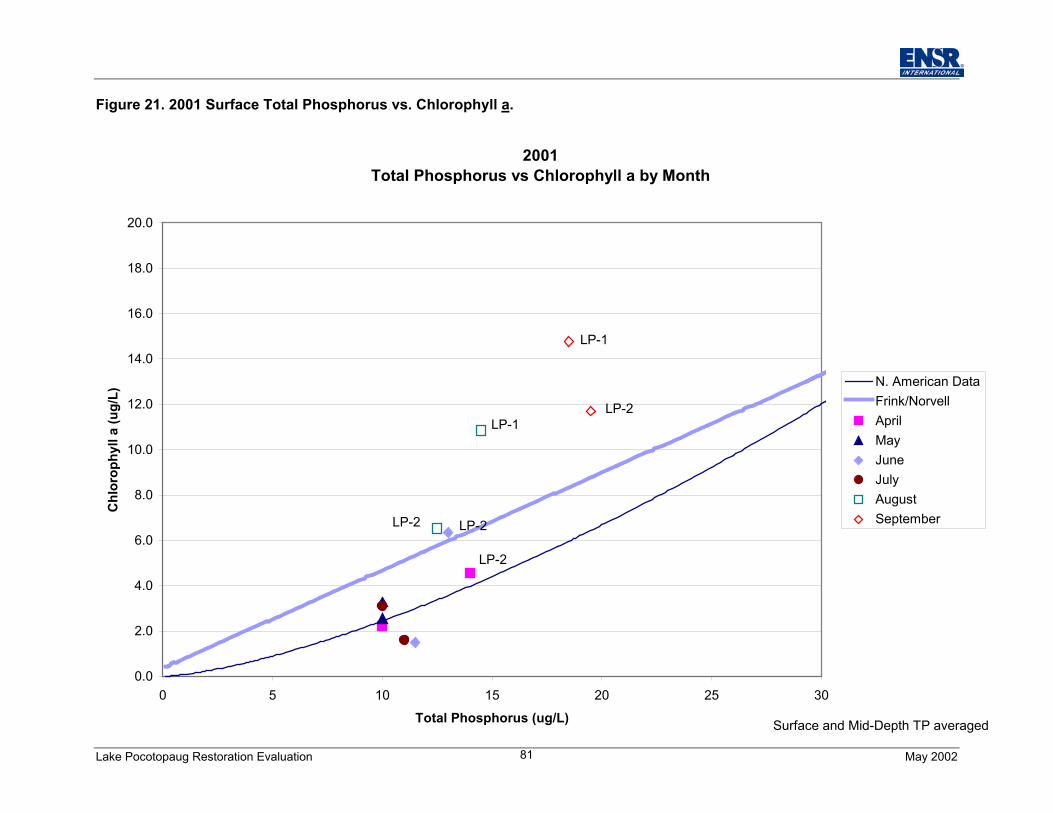
Lake Pocotopaug Restoration Evaluation May 200281
Figure 21. 2001 Surface Total Phosphorus vs. Chlorophyll a.
2001Total Phosphorus vs Chlorophyll a by Month
0.0
2.0
4.0
6.0
8.0
10.0
12.0
14.0
16.0
18.0
20.0
0 5 10 15 20 25 30
Total Phosphorus (ug/L)
Chl
orop
hyll
a (u
g/L)
N. American DataFrink/NorvellAprilMayJuneJulyAugustSeptember
LP-1
LP-2LP-1
LP-2 LP-2
LP-2
Surface and Mid-Depth TP averaged
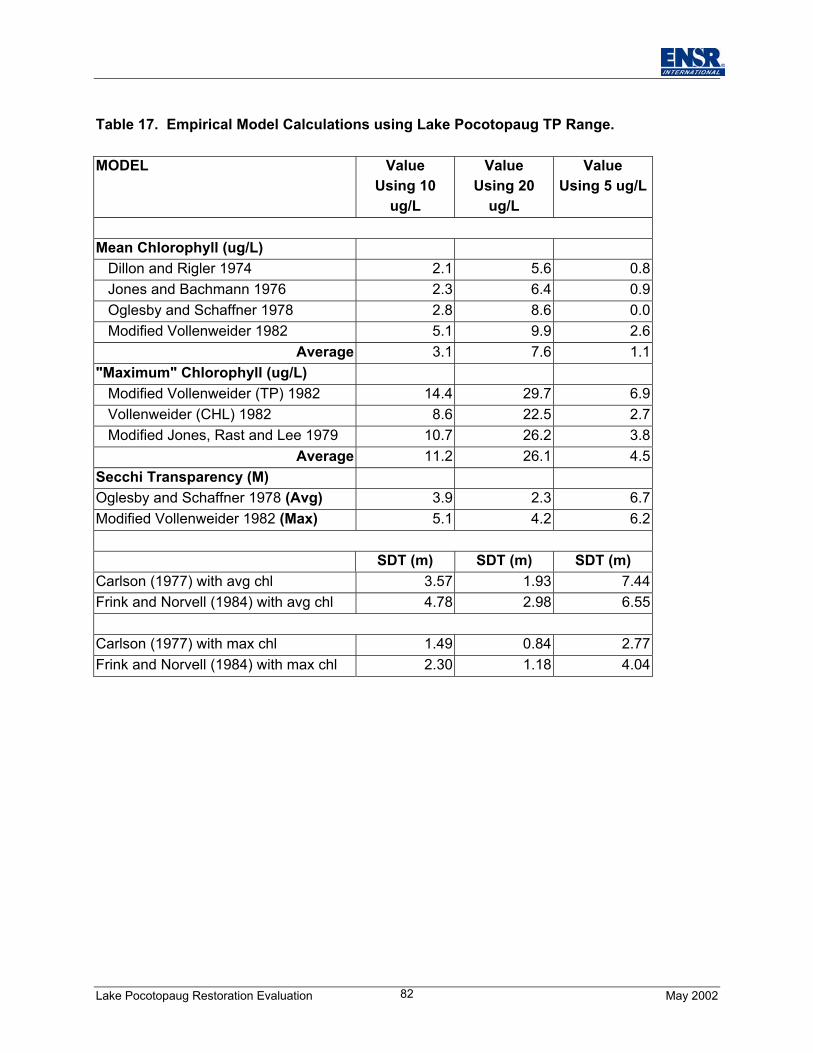
Lake Pocotopaug Restoration Evaluation May 200282
Table 17. Empirical Model Calculations using Lake Pocotopaug TP Range.
MODEL ValueUsing 10
ug/L
ValueUsing 20
ug/L
ValueUsing 5 ug/L
Mean Chlorophyll (ug/L) Dillon and Rigler 1974 2.1 5.6 0.8 Jones and Bachmann 1976 2.3 6.4 0.9 Oglesby and Schaffner 1978 2.8 8.6 0.0 Modified Vollenweider 1982 5.1 9.9 2.6
Average 3.1 7.6 1.1"Maximum" Chlorophyll (ug/L) Modified Vollenweider (TP) 1982 14.4 29.7 6.9 Vollenweider (CHL) 1982 8.6 22.5 2.7 Modified Jones, Rast and Lee 1979 10.7 26.2 3.8
Average 11.2 26.1 4.5Secchi Transparency (M)Oglesby and Schaffner 1978 (Avg) 3.9 2.3 6.7Modified Vollenweider 1982 (Max) 5.1 4.2 6.2
SDT (m) SDT (m) SDT (m)Carlson (1977) with avg chl 3.57 1.93 7.44Frink and Norvell (1984) with avg chl 4.78 2.98 6.55
Carlson (1977) with max chl 1.49 0.84 2.77Frink and Norvell (1984) with max chl 2.30 1.18 4.04
Lake Pocotopaug Restoration Evaluation May 200283
8.0 PHOSPHORUS LOADING
The loading of phosphorus to Lake Pocotopaug is critical to its ecological function andgeneral appearance. To clearly define inputs, a very large amount of sampling isneeded over an extended time period. As it is seldom possible to perform this level ofsampling, most studies combine a lower sampling frequency with modeling efforts toestimate the range of likely loading. This study has involved several in-lake samplingsand tributary samplings covering both wet and dry conditions. The phosphorus loadinganalysis presented here uses phosphorus literature values and concentrations recordedduring 2001. Total phosphorus concentrations are multiplied by the volume of eachinput to obtain an estimate of the total phosphorus load to Lake Pocotopaug.
8.1 Loading Sources
A total of 30 dry weather and 45 wet weather samples were collected the 2001investigation. Sites included both tributaries and stormwater inputs. Not all stationswere sampled on all dates, as flow was minimal in some cases and extensive flowswashed away some of the passive stormwater samplers.
Direct precipitation loading was calculated from a range of values of precipitation TPconcentration of 10-20 ug/L, based on studies of other southern New England lakes byENSR staff. The volume of water entering Lake Pocotopaug through precipitation wasmultiplied by the TP values. A value slightly lower than the average (simply as afunction of convenient rounding) was used as the “best estimate” for phosphorus loadingfrom precipitation (Table 18). Groundwater loading was estimated in a similar way (10-20 ug/L multiplied by volume of water entering Lake Pocotopaug), based on valuesobtained for other lakes by ENSR staff. An average was used as the “best estimate” forphosphorus loading from groundwater. Given the few septic systems in this largelysewered watershed, it can be reasonably expected that loading of phosphorus fromgroundwater will be small.
Wet weather loading was calculated using median and mean TP values recorded during2001 (0.124 and 0.317 mg/L). The volume of water entering the lake during wet weatherwas multiplied by median and mean TP concentrations to obtain a wet weather loadingrange of 434 – 1110 kg/yr. The best estimate was calculated using the percent DP inthe TP samples, since it is likely that much of the phosphorus entering the lake is boundand unavailable, and much of it settles to the bottom (Table 18). Dry weatherphosphorus loading was calculated using the same methodology. Median and mean dryweather phosphorus values were 0.019 and 0.050 mg/L. Again, the best estimate wascalculated using the percent DP in the TP samples (Table 18).
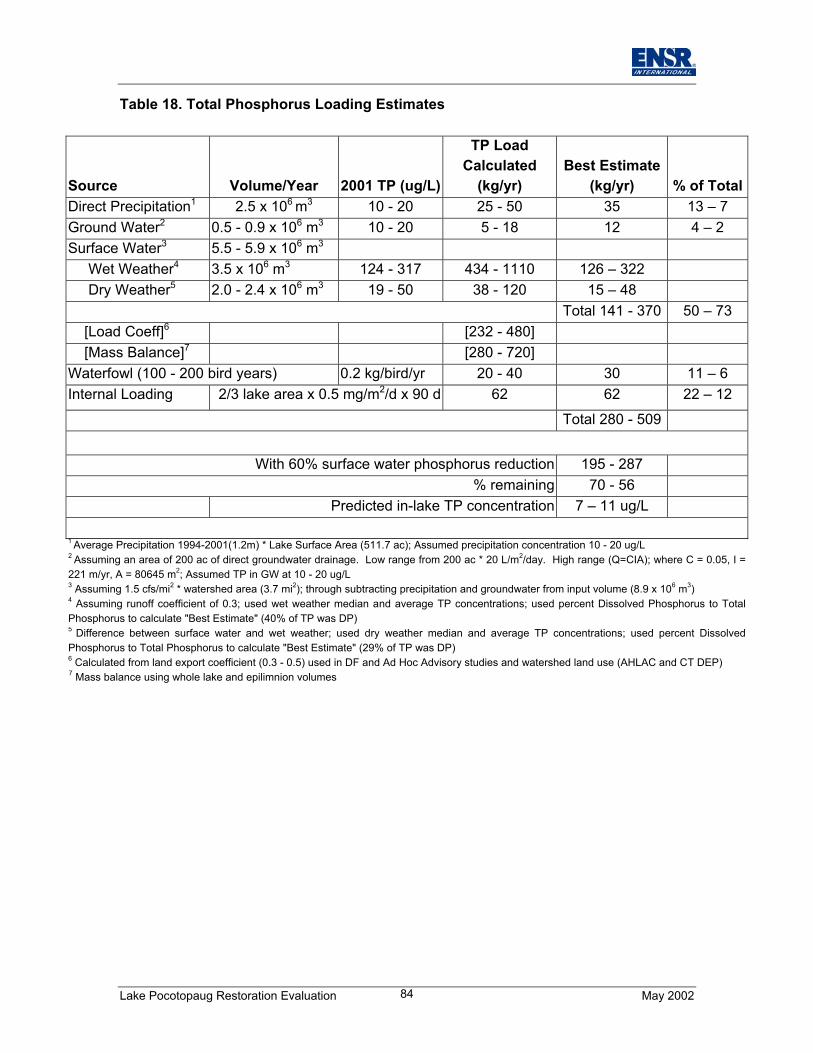
Lake Pocotopaug Restoration Evaluation May 200284
Table 18. Total Phosphorus Loading Estimates
Source Volume/Year 2001 TP (ug/L)
TP LoadCalculated
(kg/yr)Best Estimate
(kg/yr) % of TotalDirect Precipitation1 2.5 x 10⁶ m3 10 - 20 25 - 50 35 13 – 7Ground Water2 0.5 - 0.9 x 10⁶ m3 10 - 20 5 - 18 12 4 – 2Surface Water3 5.5 - 5.9 x 10⁶ m3
Wet Weather4 3.5 x 10⁶ m3 124 - 317 434 - 1110 126 – 322 Dry Weather5 2.0 - 2.4 x 10⁶ m3 19 - 50 38 - 120 15 – 48
Total 141 - 370 50 – 73 [Load Coeff]6 [232 - 480] [Mass Balance]7 [280 - 720]Waterfowl (100 - 200 bird years) 0.2 kg/bird/yr 20 - 40 30 11 – 6Internal Loading 2/3 lake area x 0.5 mg/m2/d x 90 d 62 62 22 – 12
Total 280 - 509
With 60% surface water phosphorus reduction 195 - 287% remaining 70 - 56
Predicted in-lake TP concentration 7 – 11 ug/L
1 Average Precipitation 1994-2001(1.2m) * Lake Surface Area (511.7 ac); Assumed precipitation concentration 10 - 20 ug/L2 Assuming an area of 200 ac of direct groundwater drainage. Low range from 200 ac * 20 L/m2/day. High range (Q=CIA); where C = 0.05, I =221 m/yr, A = 80645 m2; Assumed TP in GW at 10 - 20 ug/L3 Assuming 1.5 cfs/mi2 * watershed area (3.7 mi2); through subtracting precipitation and groundwater from input volume (8.9 x 10⁶ m3)4 Assuming runoff coefficient of 0.3; used wet weather median and average TP concentrations; used percent Dissolved Phosphorus to TotalPhosphorus to calculate "Best Estimate" (40% of TP was DP)5 Difference between surface water and wet weather; used dry weather median and average TP concentrations; used percent DissolvedPhosphorus to Total Phosphorus to calculate "Best Estimate" (29% of TP was DP)6 Calculated from land export coefficient (0.3 - 0.5) used in DF and Ad Hoc Advisory studies and watershed land use (AHLAC and CT DEP)7 Mass balance using whole lake and epilimnion volumes
Lake Pocotopaug Restoration Evaluation May 200285
Surface water TP loading can also be calculated by using a load coefficient. Thistechnique was used by the AHLAC and the range of values was tighter than the rangecalculated using actual data (as described in the previous paragraph). A load coefficientof 0.3 – 0.5, depending on land use was used, in previous investigations, predicting a TPload of 232 – 480 kg/yr.
Additionally, a mass balance equation (using both whole lake and eplimnion areas and a75% retention rate) was to estimate the TP load. Mass balance results provide a TPrange of 280 – 720 kg/yr.
Waterfowl contributions were based an estimated 100-200 bird/years multiplied by aphosphorus concentration of 0.2 kg/bird/yr (Brezonik, 1973; Manny et al., 1994).Waterfowl are estimated to provide 6 to 11 percent of the total phosphorus load to LakePocotopaug. Fugro (1993) estimated that waterfowl contribute 43 kg/yr (about 4% of thebudget estimated by Fugro).
Internal loading was calculated based on the expected remaining sediment releasefollowing alum treatment. The 2002 in-lake data clearly indicate that internal loadingand the rate of contribution were greatly reduced by the alum treatment. Therefore, anadjusted rate of 0.5 mg/m2/day (typical of oxic sedments in other lakes studied by ENSRstaff) was applied to the untreated lake area for a period of 90 days (summer), resultingin an annual load of 62 kg/yr, or 12 – 22 % of the current TP budget.
8.4 Tributary and Storm Drain Loading
A method for determining the phosphorus load from the watershed used in the “LandUse and Phosphorus Input to Lake Pocotopaug” by the AHLAC in 1995 was repeatedusing median 2001 stormwater data and is presented in Table 19.
Additionally, the relative phosphorus load was calculated using median stormwaterconcentrations in 2001 (Table 20). Table 20 is sorted by percent relative loadcontribution. Hales, Bay, O’Neils, and Christopher Brooks contribute the bulk of the TPentering Lake Pocotopaug. However, excessive phosphorus loading is prevalentthroughout the watershed.
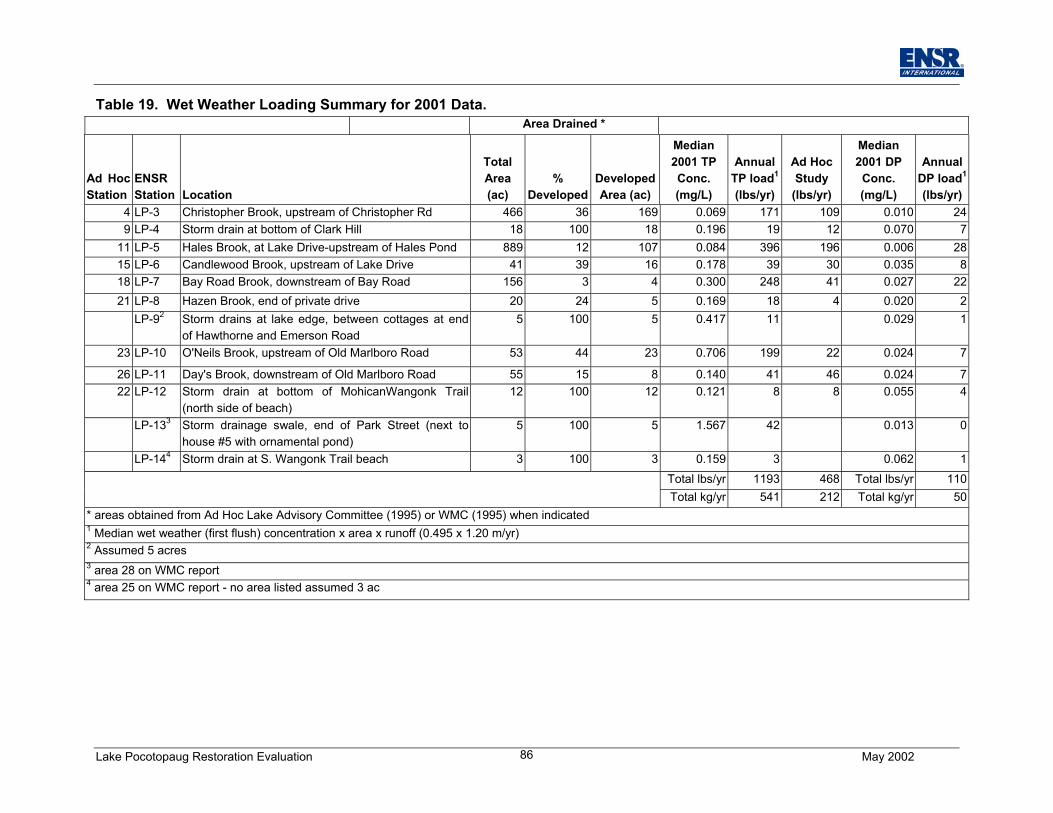
Lake Pocotopaug Restoration Evaluation May 200286
Table 19. Wet Weather Loading Summary for 2001 Data.Area Drained *
Ad HocStation
ENSRStation Location
TotalArea(ac)
%Developed
DevelopedArea (ac)
Median2001 TPConc.(mg/L)
AnnualTP load1
(lbs/yr)
Ad HocStudy
(lbs/yr)
Median2001 DPConc.(mg/L)
AnnualDP load1
(lbs/yr)4 LP-3 Christopher Brook, upstream of Christopher Rd 466 36 169 0.069 171 109 0.010 249 LP-4 Storm drain at bottom of Clark Hill 18 100 18 0.196 19 12 0.070 7
11 LP-5 Hales Brook, at Lake Drive-upstream of Hales Pond 889 12 107 0.084 396 196 0.006 2815 LP-6 Candlewood Brook, upstream of Lake Drive 41 39 16 0.178 39 30 0.035 818 LP-7 Bay Road Brook, downstream of Bay Road 156 3 4 0.300 248 41 0.027 2221 LP-8 Hazen Brook, end of private drive 20 24 5 0.169 18 4 0.020 2
LP-92 Storm drains at lake edge, between cottages at endof Hawthorne and Emerson Road
5 100 5 0.417 11 0.029 1
23 LP-10 O'Neils Brook, upstream of Old Marlboro Road 53 44 23 0.706 199 22 0.024 7
26 LP-11 Day's Brook, downstream of Old Marlboro Road 55 15 8 0.140 41 46 0.024 722 LP-12 Storm drain at bottom of MohicanWangonk Trail
(north side of beach)12 100 12 0.121 8 8 0.055 4
LP-133 Storm drainage swale, end of Park Street (next tohouse #5 with ornamental pond)
5 100 5 1.567 42 0.013 0
LP-144 Storm drain at S. Wangonk Trail beach 3 100 3 0.159 3 0.062 1Total lbs/yr 1193 468 Total lbs/yr 110Total kg/yr 541 212 Total kg/yr 50
* areas obtained from Ad Hoc Lake Advisory Committee (1995) or WMC (1995) when indicated1 Median wet weather (first flush) concentration x area x runoff (0.495 x 1.20 m/yr)2 Assumed 5 acres3 area 28 on WMC report4 area 25 on WMC report - no area listed assumed 3 ac
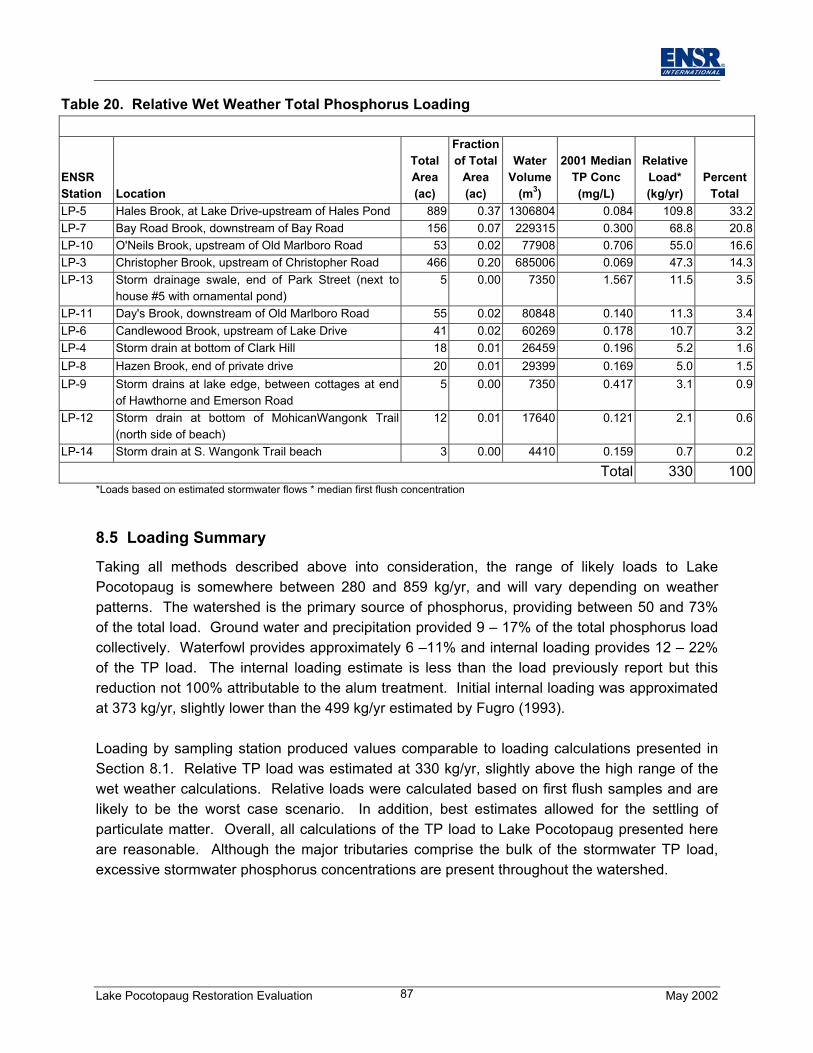
Lake Pocotopaug Restoration Evaluation May 200287
Table 20. Relative Wet Weather Total Phosphorus Loading
ENSRStation Location
TotalArea(ac)
Fractionof Total
Area(ac)
WaterVolume
(m3)
2001 MedianTP Conc(mg/L)
RelativeLoad*(kg/yr)
PercentTotal
LP-5 Hales Brook, at Lake Drive-upstream of Hales Pond 889 0.37 1306804 0.084 109.8 33.2LP-7 Bay Road Brook, downstream of Bay Road 156 0.07 229315 0.300 68.8 20.8LP-10 O'Neils Brook, upstream of Old Marlboro Road 53 0.02 77908 0.706 55.0 16.6LP-3 Christopher Brook, upstream of Christopher Road 466 0.20 685006 0.069 47.3 14.3LP-13 Storm drainage swale, end of Park Street (next to
house #5 with ornamental pond)5 0.00 7350 1.567 11.5 3.5
LP-11 Day's Brook, downstream of Old Marlboro Road 55 0.02 80848 0.140 11.3 3.4LP-6 Candlewood Brook, upstream of Lake Drive 41 0.02 60269 0.178 10.7 3.2LP-4 Storm drain at bottom of Clark Hill 18 0.01 26459 0.196 5.2 1.6LP-8 Hazen Brook, end of private drive 20 0.01 29399 0.169 5.0 1.5LP-9 Storm drains at lake edge, between cottages at end
of Hawthorne and Emerson Road5 0.00 7350 0.417 3.1 0.9
LP-12 Storm drain at bottom of MohicanWangonk Trail(north side of beach)
12 0.01 17640 0.121 2.1 0.6
LP-14 Storm drain at S. Wangonk Trail beach 3 0.00 4410 0.159 0.7 0.2
Total 330 100*Loads based on estimated stormwater flows * median first flush concentration
8.5 Loading Summary
Taking all methods described above into consideration, the range of likely loads to LakePocotopaug is somewhere between 280 and 859 kg/yr, and will vary depending on weatherpatterns. The watershed is the primary source of phosphorus, providing between 50 and 73%of the total load. Ground water and precipitation provided 9 – 17% of the total phosphorus loadcollectively. Waterfowl provides approximately 6 –11% and internal loading provides 12 – 22%of the TP load. The internal loading estimate is less than the load previously report but thisreduction not 100% attributable to the alum treatment. Initial internal loading was approximatedat 373 kg/yr, slightly lower than the 499 kg/yr estimated by Fugro (1993).
Loading by sampling station produced values comparable to loading calculations presented inSection 8.1. Relative TP load was estimated at 330 kg/yr, slightly above the high range of thewet weather calculations. Relative loads were calculated based on first flush samples and arelikely to be the worst case scenario. In addition, best estimates allowed for the settling ofparticulate matter. Overall, all calculations of the TP load to Lake Pocotopaug presented hereare reasonable. Although the major tributaries comprise the bulk of the stormwater TP load,excessive stormwater phosphorus concentrations are present throughout the watershed.

Lake Pocotopaug Restoration Evaluation May 200288
With the best possible treatment of surface water inputs, a reduction of 60%, TP values in-lakeare predicted to be about 7 to 11 ug/L. This may not be enough to control algal growths to theextent desired, as blooms have formed when surface concentrations were as low as 10 to 11ug/L. However, the frequency and severity of blooms may decline, and combined with othertechniques (e.g., biomanipulation) this may be adequate to satisfy users of the lake.
.
Lake Pocotopaug Restoration Evaluation May 200289
9.0 DIAGNOSTIC SUMMARY
Lake Pocotopaug was enhanced back in the 1700’s by the construction of a dam. Industry andtourism became a major part of East Hampton’s economy. Increased transportation efficiencysoon lead to development around the lake shore with year-round homes. The lake is nowapproximately 511.7 acres with mean and maximum depths of 3.4 and 11.6 meters,respectively. Total water volume is estimate to be 7.1 million cubic meters. It is a heart shapedwaterbody with the shallowest area to the south and deeper hole in the upper lobes. LakePocotopaug has islands and exposed bedrock that make navigation around the lake difficult forinexperienced boaters.
The watershed of Lake Pocotopaug is approximately 2,381 acres. Much of this land is forested(65 – 77%). The low watershed:lake area ratio (<5:1) suggests limited water flow to this largewater body and high potential for successful water quality management. However, much of theshoreline is developed. Developed land near Lake Pocotopaug has a disproportionately largepotential for water quality impact, and appropriate land management practices are necessary toprotect the lake. Future development is limited by topographic features and environmentalregulations, but is great enough to pose a threat to current water quality.
Hydrologically, Lake Pocotopaug receives enough water annually to replace the full volume justover one time. That means that water entering the lake has an average residence time of justunder a year. The inflow of the surface waters provides roughly 65% of total inflow.Precipitation and groundwater provide 35%. Flows are very uneven over the course of a year,however, and fall-winter drawdown, spring refill, and summer water level maintenancecomplicates the hydrologic budget.
Water quality in Lake Pocotopaug and its tributaries is generally acceptable for designateduses. Oxygen is low below the thermocline and anoxia occasionally occurs just above thethermocline. Internal recycling is evident, but the recent alum treatment is expected to reducethat load from 47% (Fugro 1995) to 12 – 22% of the total phosphorus load. Although chemicallysafe, Lake Pocotopaug is sometimes aesthetically unappealing, which may deter contactrecreation.
Nutrient levels are generally low, and are typically below the level below at which algal bloomsare generally found. However, Lake Pocotopaug is unusual in this regard. Algal blooms arepresent even under this relatively low phosphorus condition. Reducing the surface waterphosphorus concentration by 60%, about the maximum it is reasonable to expect, is predictedto result in phosphorus concentrations between 7 – 11 ug/L (as opposed to the current 10-22ug/L), a level at which blooms may still occur in Lake Pocotopaug.
Differences can be observed between developed and undeveloped areas of the watershedwhen examining both dry weather and storm water quality, suggesting that protection of lake
Lake Pocotopaug Restoration Evaluation May 200290
water quality should focus on inputs from developed areas. Unstable soils and lack of functionfrom the existing storm water attenuation devices yield substantial solid and nutrient loading.There is no “smoking gun” in the watershed. Excessive nutrient concentrations are found in alltributaries and storm drains, although runoff from developed areas tends to provide the highestvalues. However, spring runoff seems to be more detrimental than summer runoff and themajor tributaries are suspect due to the higher portion of the load they contribute.
Excessive external and possibly internal solid loading, and algal growth reduce in-lake waterclarity. Disturbance of sediments in the shallow basin could influence whole lake water clarity,could provide nutrients to support algal growth, and should be investigated as a potentialsource.
Using the predictive curves and mathematical empirical models, Lake Pocotopaug shouldcurrently experience reduced phytoplankton density if it behaved more like other lakes. In otherwords, current phosphorus concentrations should be low enough to control algal growth, basedon empirical relationships established from data for many lakes. However, Lake Pocotopaugproduces more algae per unit of phosphorus than most other lakes, placing it on the fringe ofknown relationships between phosphorus and chlorophyll and chlorophyll and water clarity.Finding and managing the differences between Lake Pocotopaug and other lakes could beimportant to reducing excessive growths of algae.
Phytoplankton and zooplankton communities in Lake Pocotopaug are less than ideal, and mayrepresent important differences from other lakes. Phytoplankton densities are typicallymoderate to high and zooplankton densities are relatively low. As a result, water clarity issometimes undesirable for recreational uses. Since phytoplankton are thriving at lowphosphorus concentrations, reducing TP alone (within reasonable constraints) may not achievedesired results; a top down control method supplementing phosphorus reduction may benecessary. Altering the fish community to have more predators and less planktivorous panfishcould increase zooplankton grazing on phytoplankton. The recent stocking of walleye couldproduce a desirable secondary affect, if the population is large enough and is not decimated byfishing too quickly.
There was no information gathered from this study that provides a conclusive explanation ofpast fish kills and recent schooling behavior; more detailed fish investigation was beyond thescope of this project. Panfish may be looking for alternative food sources in the tributaries dueto low in-lake zooplankton density. Sediment-water quality interactions during the time ofdecreasing lake temperature may play a role. Sporadic inputs from certain tributaries could bestressing fish in some locations. Pockets of supercooled water could be a stressor. Contactwith over 30 fishery professionals from a range of states did not reveal any clear explanation,however, and the data on hand are insufficient to explain observations.
Lake Pocotopaug Restoration Evaluation May 200291
Although some may argue that by appearance Lake Pocotopaug is eutrophic, it is classified asmesotrophic by the State of Connecticut, largely due to the low nutrient levels. Unfortunately,lowering nutrient levels may not be a realistic solution to Lake Pocotopaug’s low water clarity,given practical limits on such reductions. Certainly the maintenance of low phosphorus is aprerequisite for increasing water clarity, but it may not be the whole answer.
Lake Pocotopaug Restoration Evaluation May 200292
10.0 MANAGEMENT NEEDS AND OBJECTIVES
Although once used for industrial purposes, current use of Lake Pocotopaug is heavily weightedtowards recreational activities, and providing continued high quality swimming, boating andfishing experiences is the primary goal of management for this system. Achieving this goaldepends upon managing the watershed and the lake for reduced sediment and nutrient loading,less algae, and healthy fish populations.
The surrounding watershed is heavily forested. However, this land is primarily privately ownedand protecting this land from development may be a difficult task. Development, realistically, isinevitable, although current environmental regulations will restrict it to some degree and willdictate some water quality safeguards. Ensuring proper storm water Best ManagementPractices (BMPs) during and after any development is essential. Unfortunately for the lake,development around the lakeshore is already dense. Reducing impacts from this area inaddition to protection of what is now undeveloped land should be the focus for management ofLake Pocotopaug and it’s watershed.
Concerns expressed early in this study included low water clarity and excessive algal densities.Poor water clarity has been documented since the early 1970’s. It does not appear to be solelyinfluenced by algal density, as storm-induced solids inputs and resuspended sediment fromwithin the lake are significant sources of turbidity (and reduced clarity), but algal blooms in latesummer do severely reduce water clarity without appreciable non-algal particulate abundance.Reduced suspended solids and reduced algal density are therefore the primary objectives ofmanagement for Lake Pocotopaug. These objectives will be addressed in the subsequentsections.
Lake Pocotopaug Restoration Evaluation May 200293
11.0 POTENTIAL MANAGEMENT OPTIONS
11.1 Reducing Non-Algal Turbidity
Control of non-algal turbidity requires understanding the sources and having the economicresources available. In the case of Lake Pocotopaug, the source of non-algal turbidity isunclear. Sediment loading is extensive and well documented. However, there is no significantrelationship between precipitation and in-lake turbidity. This is not to say that stormwater runoffdoes not contribute to in-lake turbidity or more importantly, to sedimentation (the infilling of thelake). What it does suggest is that an additional source may be present. Lake sediment in thesouthern portion of the lake may be entrained in the water column through wind action,distributing fine sediment throughout the lake and reducing water clarity. More data are neededto prove or disprove this theory, but observations suggest that this may be a substantial factor inlowered water clarity much of the year.
If mixing is a source for decreased water clarity, management can be difficult. Changing windpatterns or mixing resistance is highly impractical. Dredging of the shallow areas to reducingmixing potential or the use of benthic barriers may help in this regard, but these measures areexpensive on a large scale and do not seem appropriate for Lake Pocotopaug at this time.Alum treatment of the southern area, avoided previously because it is not deep enough to havestrong anoxia and associated phosphorus release, may both help congeal the sediments to limitresuspension and inactivate any phosphorus that does get entrained in the water column. Thisapproach has seldom been tried, however, and is somewhat experimental.
Sediment inputs should be controllable. The “Storm Water Renovation and Management Planfor Lake Pocotopaug” prepared by WMC in 1995 outlines many techniques for sediment inputreduction. The plan is provided in Appendix C for further reference. This section will notdiscuss each drainage basin and the techniques to employ, as the WMC report was fairlythorough, but it will give several options to consider for sediment reduction.
Areas of concern are beaches (public or private), catch basins throughout the watershed andmajor tributaries (Christopher, Hales, Bay and O’Neill Brooks). Beaches might be provided witha vegetated buffer strip, although this is unpopular with beach goers. Alternatively, using thecoarsest possible sand for beaches will help, and covering the beach with filter fabric or settingup silt fence may be viable in the off-season. The most critical time is in the spring when thereis a high potential for runoff and beach attendance is minimal, but it may be necessary to takeaction in late autumn to ensure spring protection.
Beaches are only a small part of the problem, however, and management of other watershedlands will be essential to reducing solids inputs. Most alternatives for reducing sedimentation gohand in hand with phosphorus reducing techniques (a method of controlling algae). In an effortto avoid repeating sections, reduction of sediment and phosphorus will be discussed together inthe next section.
Lake Pocotopaug Restoration Evaluation May 200294
11.2 Reducing Total Phosphorus and Sediment Loading from the Watershed
Objectives are strongly linked to watershed management, and specifically to management ofdeveloped areas. Development of a watershed creates impervious surface that changes thehydrology of the area and tends to increase loading of pollutants to waterways. Pollutants fallingfrom the sky as atmospheric deposition are not incorporated into soils as in forests or meadows,but rather are transported into the aquatic environment. Additional pollutants from humanactivities in developed areas include solids from exposed soils, nutrients from fertilizers andwaste disposal, bacteria from waste disposal, urban wildlife and pets, hydrocarbons fromautomotive and other machine use, and metals from a variety of sources. These are alsocarried into the aquatic environment and can cause water quality degradation and useimpairment. Similar consequences result from agricultural development, but with more solidsand nutrients and less metals and hydrocarbons. Some degree of additional pollutant loading isalmost inevitable with development, but there are methods for minimizing inputs and impacts.
In the Lake Pocotopaug watershed there are both residential lands and agricultural lands,although the residential land is more abundant and is close to the lake and more likely to impactwater quality in the lake. Nutrient loading analysis based on recent data suggest that currentloads are excessive, that loads from developed areas are higher than for undeveloped areas,and that protection of water quality can be gained by addressing pollutant sources and transportin developed areas. Techniques for reducing pollutant loads and associated impacts arediscussed below.
11.2.1 Source ControlsAgricultural Best Management PracticesAgricultural Best Management Practices (BMPs) incorporate techniques in forestry, animalscience, and crop science to minimize adverse impacts to water resources. This managementapproach actually relies upon a combination of techniques in source reduction and transportmitigation. Such practices include manure management, fertilizer management, use of covercrops, and use of buffer zones. The use of agricultural BMP’s is highly recommended in theLake Pocotopaug watershed. However, with the small amount of land in agriculture, this is notlikely to provide a major change in the water quality of Lake Pocotopaug. Rather, this is aprotective measure to be encouraged, especially where livestock are involved, as their nutrientinput per unit area involved can be very large. Many of the techniques discussed as BMPs forresidential areas are also applicable to agricultural lands.
Bank and Slope StabilizationErosion control is an important component of an overall management plan designed todecrease pollutant loading to aquatic ecosystems. This is especially important in areas of newdevelopment or re-development, where soils are both exposed and susceptible to erosion.Stabilization of stream banks and road shoulders in the vicinity of crossings is another importantarea for application, particularly when dirt roads are involved. Other critical areas include stormwater drainage ditches and small tributaries in developed areas. This is a recommended
Lake Pocotopaug Restoration Evaluation May 200295
management technique in the lake Pocotopaug watershed, and the towns and the CT DEPshould maintain lists of susceptible areas and check them periodically.
Source Controls for Residential LandSource controls are methods used to reduce the amount of pollutants generated in thewatershed, or to prevent their release to the environment. Eliminating some sources isimpractical, but minimizing unnecessary pollutant use and keeping the pollutant from contactingstorm water or ground water may be feasible. Helpful texts include Hansen et al. (1988),Humstone Squires (1990) and Maine COLA (1991). The focus is on limiting the amount of anypollutant that is available to be transported in runoff. In most cases this involves behavioralchanges by homeowners.
Behavioral modifications involve changing the actions of watershed residents and lake users toimprove water quality. Such changes may include conversion to non-phosphate detergents,elimination of garbage grinders, proper inspection and maintenance of septic systems, limits onlawn fertilization, and eliminating illegal dumping in roadways and watercourses. Behavioralmodifications can be brought about in two principal ways, through public education and/or theimplementation of local bylaws and bans. Education is a critical first step and should precedeany attempt at regulation.
Public education can be accomplished by mailing an informative brochure on watershedmanagement to all residents in the watershed, through the use of video programs on localaccess television, by placing informative signs in high access areas, or by holding publicmeetings for watershed residents. Public education relies heavily upon cooperation fromresidents and other lake users, and is not likely to result in major improvements in water qualityby itself. However, some level of improvement has been noted in other studies and theeducation process sets the stage for community involvement and cooperation. Public educationis a recommended management technique for Lake Pocotopaug, and should focus onlandscape management.
Information on relevant ordinances has been provided separately to East Hampton officials, butthe most obvious need is control of lawn fertilization. Education is preferable to regulation, butthe latter may be necessary, in which case education should precede regulation.
Land Use ConversionLand use conversion involves purchasing properties that contribute excessive amounts ofpollutants and converting these properties to less deleterious land uses. For example, the CTDEP or a town may decide to purchase an agricultural property and convert the land to openspace, thus reducing pollutant generation from this parcel of land. This is a very expensiveproposition and is not practical on a large scale in most cases, but may be practical for targetingspecific properties that could generate excessive amounts of pollutants that eventuallydischarge into Lake Pocotopaug. Since a large portion of the watershed is currently
Lake Pocotopaug Restoration Evaluation May 200296
undeveloped forest land, an opportunity may exist to preserve some of this land. Thistechnique, if economically feasible, is an option for minimizing pollutant loading from the LakePocotopaug watershed.
Land Use ConversionLand use conversion involves purchasing properties that contribute excessive amounts ofpollutants and converting these properties to less deleterious land uses. For example, the CTDEP or a town may decide to purchase an agricultural property and convert the land to openspace, thus reducing pollutant generation from this parcel of land. This is a very expensiveproposition and is not practical on a large scale in most cases, but may be practical for targetingspecific properties that could generate excessive amounts of pollutants that eventuallydischarge into Lake Pocotopaug. Since a large portion of the watershed is currentlyundeveloped forest land, an opportunity may exist to preserve some of this land. Thistechnique, if economically feasible, is an option for minimizing pollutant loading from the LakePocotopaug watershed.
Zoning and Land Use PlanningThis is a very important component in controlling watershed inputs to aquatic resources. Astrong relationship exists between land use type and pollutant generation, with developed lands(including agriculture) typically generating greater pollutant loads than non-developed lands.Preserving undeveloped land in the Lake Pocotopaug watershed is highly recommended, withparticular emphasis on preserving areas of land that form buffer zones along the lake and itstributaries; undeveloped land near the lake is minimal, but land along tributaries is worthevaluating. The zoning laws of East Hampton in the watershed should be reviewed withmaintenance of buffer strips in mind. A summary of land use and zoning issues andrecommendations are provided in the “Stormwater Renovation and Management Plan for theLake Pocotopaug Watershed” prepared by WMC in 1995 (Appendix C).
Much of the watershed is privately controlled with most of the undeveloped land suitable fordevelopment. There may be increasing development pressure over the next decade, andplanning now to minimize impacts of possible future development is strongly recommended.Development need not be prevented in this case, but should conform to all applicableregulations. Consideration at the town level of appropriate development features around LakePocotopaug and throughout its watershed is warranted.
Waste Water ManagementA properly functioning on-site waste disposal system (e.g., septic system) can be an effectivemeans of reducing pollutant loading to an aquatic ecosystem. Of particular concern are thosesystems where septic effluent is breaking-out above ground and is transported to the lake or atributary during storm events. We have no evidence of failing septic systems in this watershed,and sanitary sewers service much of the watershed.
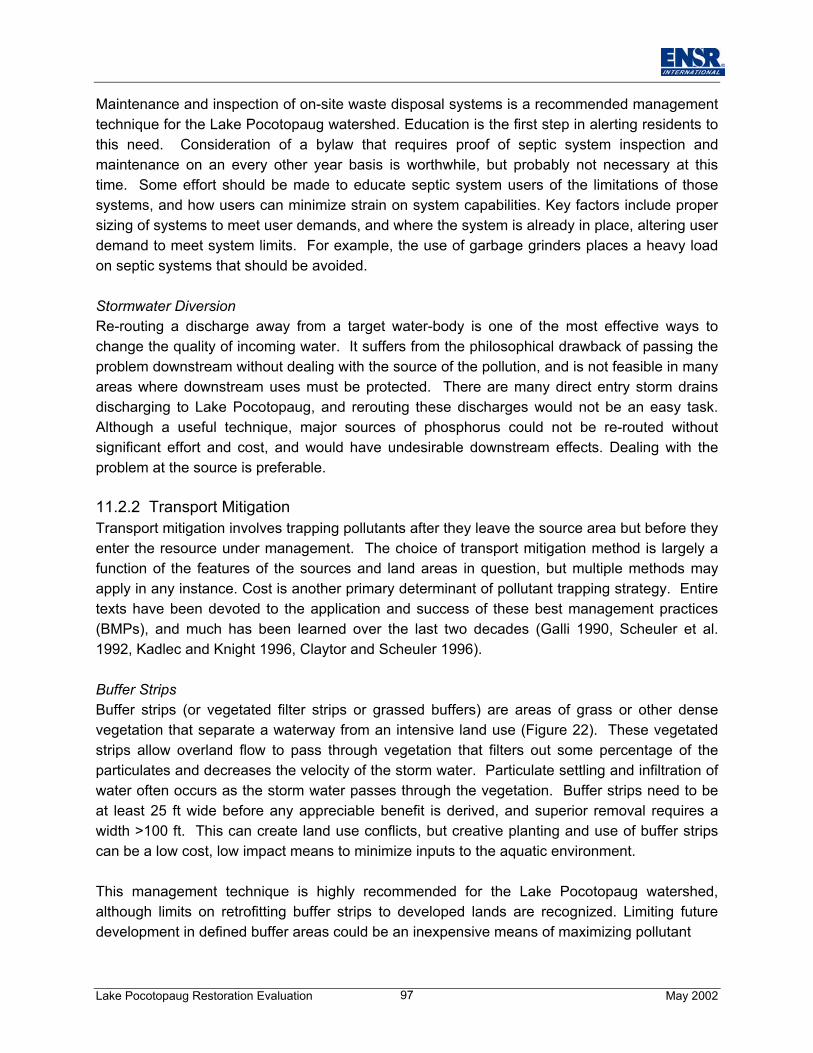
Lake Pocotopaug Restoration Evaluation May 200297
Maintenance and inspection of on-site waste disposal systems is a recommended managementtechnique for the Lake Pocotopaug watershed. Education is the first step in alerting residents tothis need. Consideration of a bylaw that requires proof of septic system inspection andmaintenance on an every other year basis is worthwhile, but probably not necessary at thistime. Some effort should be made to educate septic system users of the limitations of thosesystems, and how users can minimize strain on system capabilities. Key factors include propersizing of systems to meet user demands, and where the system is already in place, altering userdemand to meet system limits. For example, the use of garbage grinders places a heavy loadon septic systems that should be avoided.
Stormwater DiversionRe-routing a discharge away from a target water-body is one of the most effective ways tochange the quality of incoming water. It suffers from the philosophical drawback of passing theproblem downstream without dealing with the source of the pollution, and is not feasible in manyareas where downstream uses must be protected. There are many direct entry storm drainsdischarging to Lake Pocotopaug, and rerouting these discharges would not be an easy task.Although a useful technique, major sources of phosphorus could not be re-routed withoutsignificant effort and cost, and would have undesirable downstream effects. Dealing with theproblem at the source is preferable.
11.2.2 Transport MitigationTransport mitigation involves trapping pollutants after they leave the source area but before theyenter the resource under management. The choice of transport mitigation method is largely afunction of the features of the sources and land areas in question, but multiple methods mayapply in any instance. Cost is another primary determinant of pollutant trapping strategy. Entiretexts have been devoted to the application and success of these best management practices(BMPs), and much has been learned over the last two decades (Galli 1990, Scheuler et al.1992, Kadlec and Knight 1996, Claytor and Scheuler 1996).
Buffer StripsBuffer strips (or vegetated filter strips or grassed buffers) are areas of grass or other densevegetation that separate a waterway from an intensive land use (Figure 22). These vegetatedstrips allow overland flow to pass through vegetation that filters out some percentage of theparticulates and decreases the velocity of the storm water. Particulate settling and infiltration ofwater often occurs as the storm water passes through the vegetation. Buffer strips need to beat least 25 ft wide before any appreciable benefit is derived, and superior removal requires awidth >100 ft. This can create land use conflicts, but creative planting and use of buffer stripscan be a low cost, low impact means to minimize inputs to the aquatic environment.
This management technique is highly recommended for the Lake Pocotopaug watershed,although limits on retrofitting buffer strips to developed lands are recognized. Limiting futuredevelopment in defined buffer areas could be an inexpensive means of maximizing pollutant
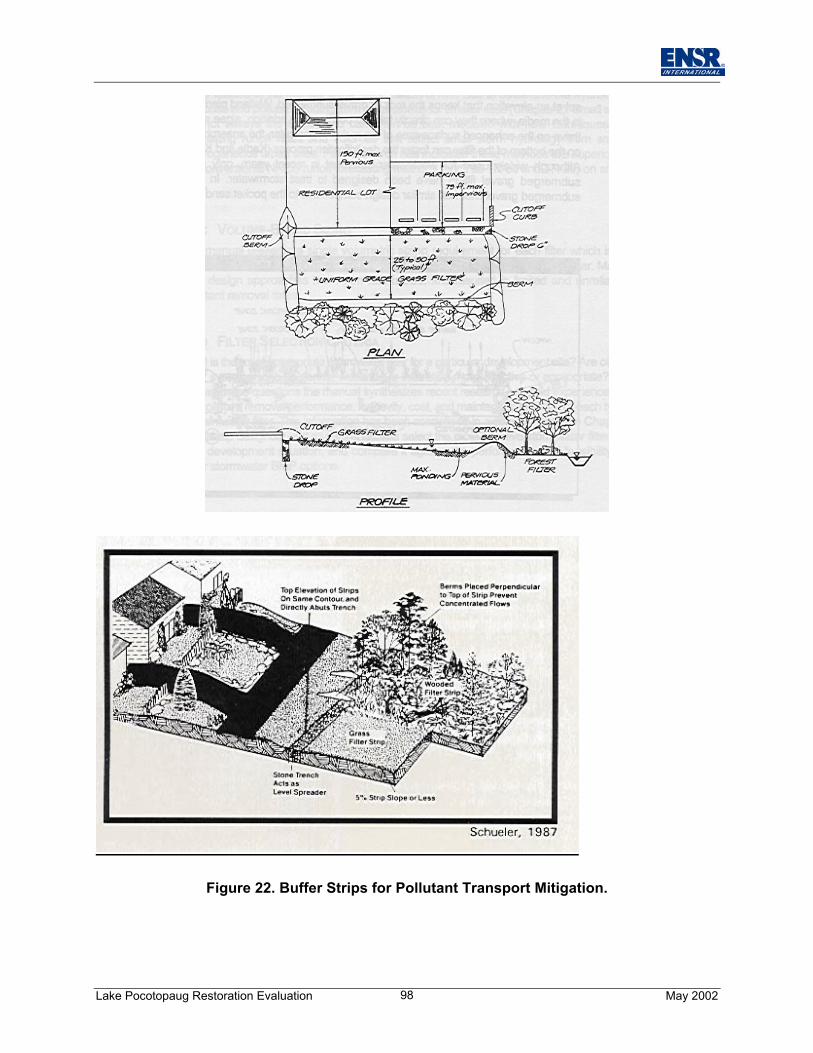
Lake Pocotopaug Restoration Evaluation May 200298
Figure 22. Buffer Strips for Pollutant Transport Mitigation.
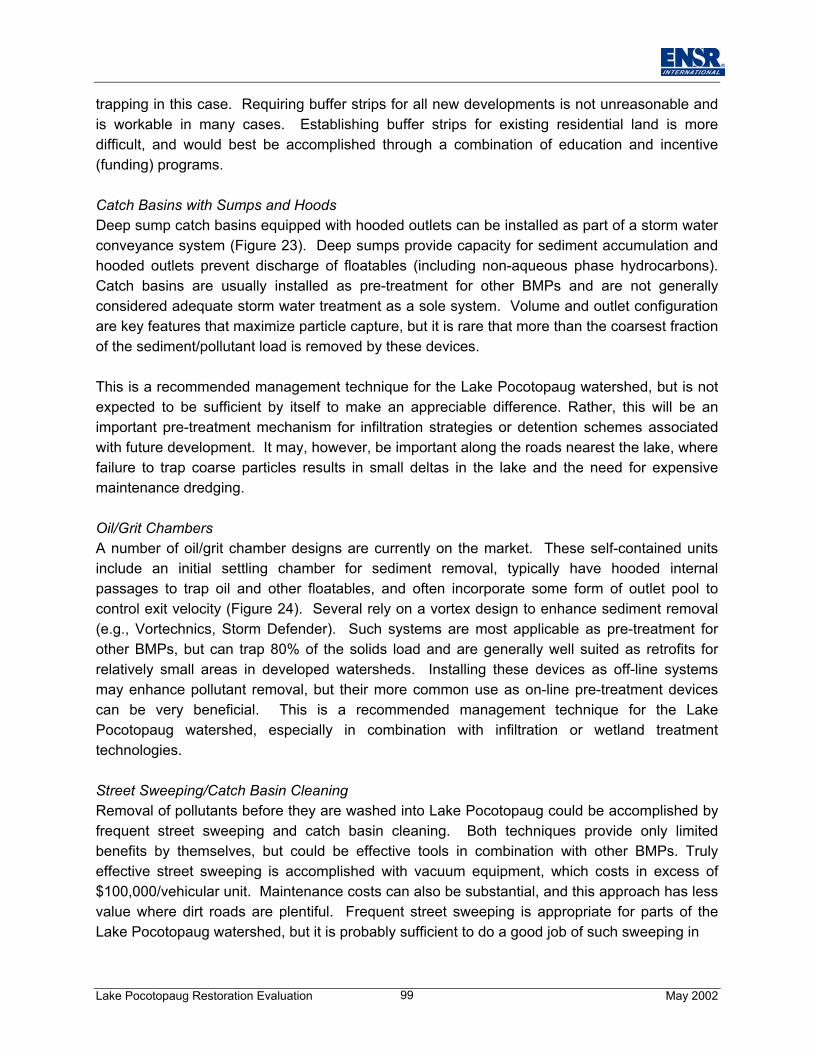
Lake Pocotopaug Restoration Evaluation May 200299
trapping in this case. Requiring buffer strips for all new developments is not unreasonable andis workable in many cases. Establishing buffer strips for existing residential land is moredifficult, and would best be accomplished through a combination of education and incentive(funding) programs.
Catch Basins with Sumps and HoodsDeep sump catch basins equipped with hooded outlets can be installed as part of a storm waterconveyance system (Figure 23). Deep sumps provide capacity for sediment accumulation andhooded outlets prevent discharge of floatables (including non-aqueous phase hydrocarbons).Catch basins are usually installed as pre-treatment for other BMPs and are not generallyconsidered adequate storm water treatment as a sole system. Volume and outlet configurationare key features that maximize particle capture, but it is rare that more than the coarsest fractionof the sediment/pollutant load is removed by these devices.
This is a recommended management technique for the Lake Pocotopaug watershed, but is notexpected to be sufficient by itself to make an appreciable difference. Rather, this will be animportant pre-treatment mechanism for infiltration strategies or detention schemes associatedwith future development. It may, however, be important along the roads nearest the lake, wherefailure to trap coarse particles results in small deltas in the lake and the need for expensivemaintenance dredging.
Oil/Grit ChambersA number of oil/grit chamber designs are currently on the market. These self-contained unitsinclude an initial settling chamber for sediment removal, typically have hooded internalpassages to trap oil and other floatables, and often incorporate some form of outlet pool tocontrol exit velocity (Figure 24). Several rely on a vortex design to enhance sediment removal(e.g., Vortechnics, Storm Defender). Such systems are most applicable as pre-treatment forother BMPs, but can trap 80% of the solids load and are generally well suited as retrofits forrelatively small areas in developed watersheds. Installing these devices as off-line systemsmay enhance pollutant removal, but their more common use as on-line pre-treatment devicescan be very beneficial. This is a recommended management technique for the LakePocotopaug watershed, especially in combination with infiltration or wetland treatmenttechnologies.
Street Sweeping/Catch Basin CleaningRemoval of pollutants before they are washed into Lake Pocotopaug could be accomplished byfrequent street sweeping and catch basin cleaning. Both techniques provide only limitedbenefits by themselves, but could be effective tools in combination with other BMPs. Trulyeffective street sweeping is accomplished with vacuum equipment, which costs in excess of$100,000/vehicular unit. Maintenance costs can also be substantial, and this approach has lessvalue where dirt roads are plentiful. Frequent street sweeping is appropriate for parts of theLake Pocotopaug watershed, but it is probably sufficient to do a good job of such sweeping in
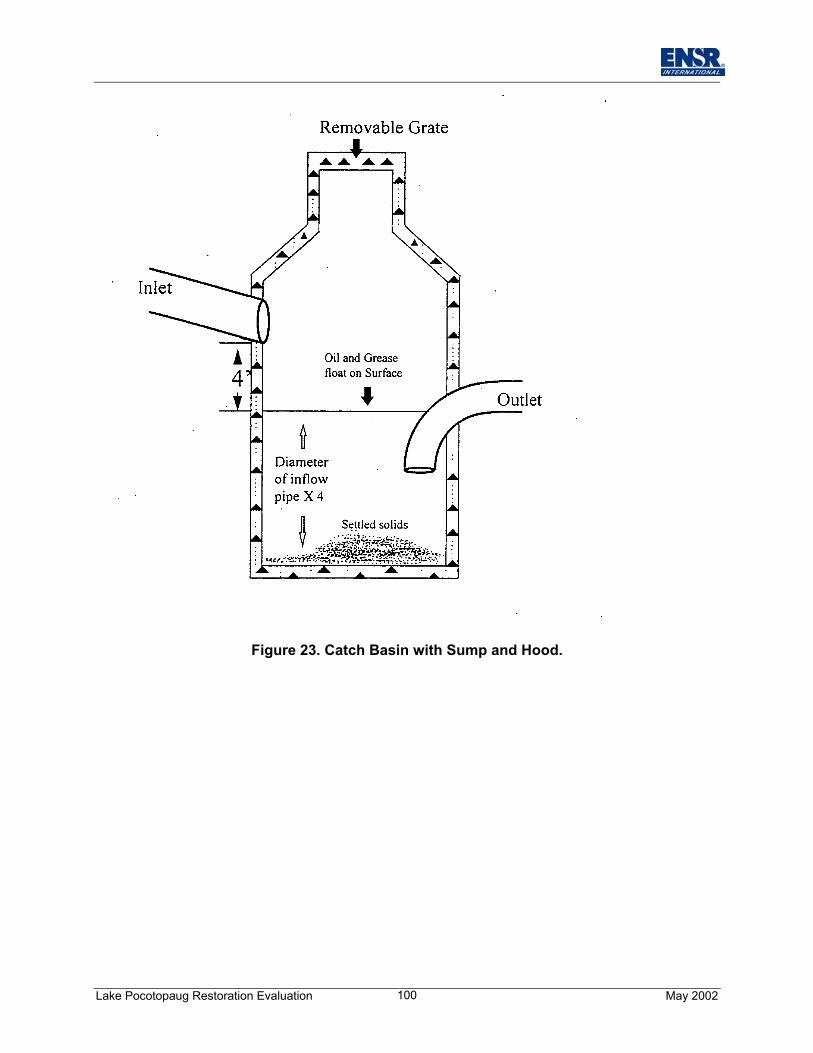
Lake Pocotopaug Restoration Evaluation May 2002100
Figure 23. Catch Basin with Sump and Hood.
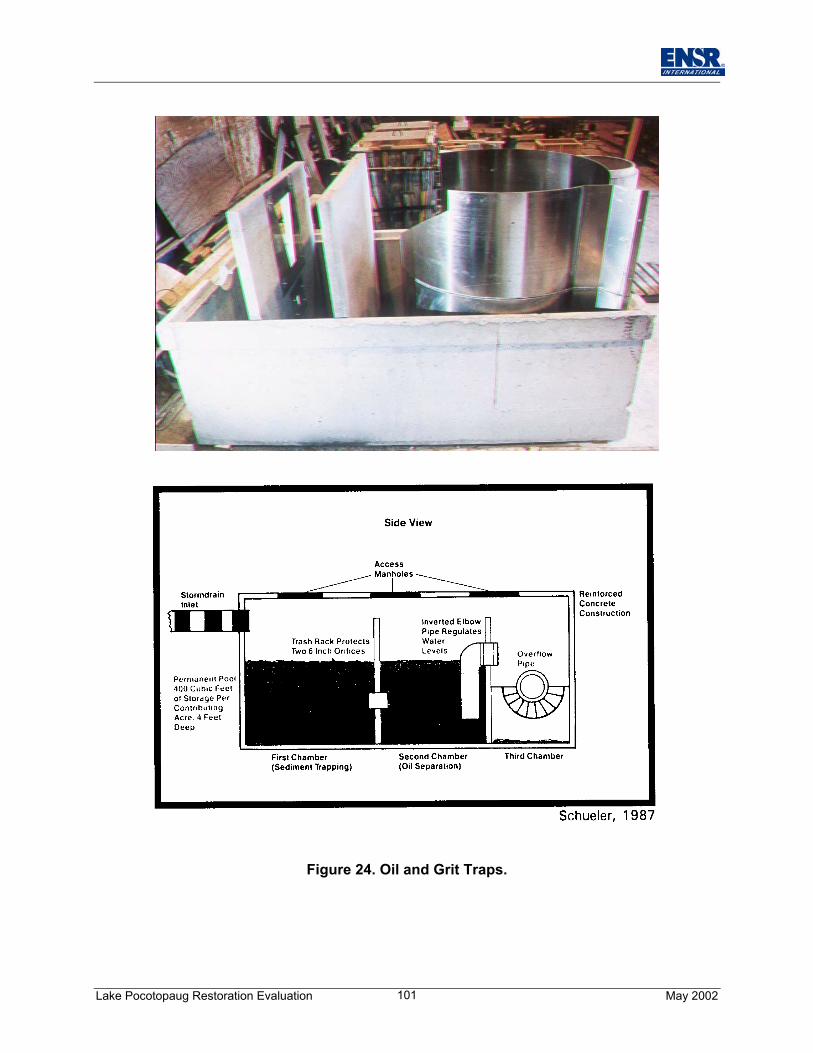
Lake Pocotopaug Restoration Evaluation May 2002101
Figure 24. Oil and Grit Traps.
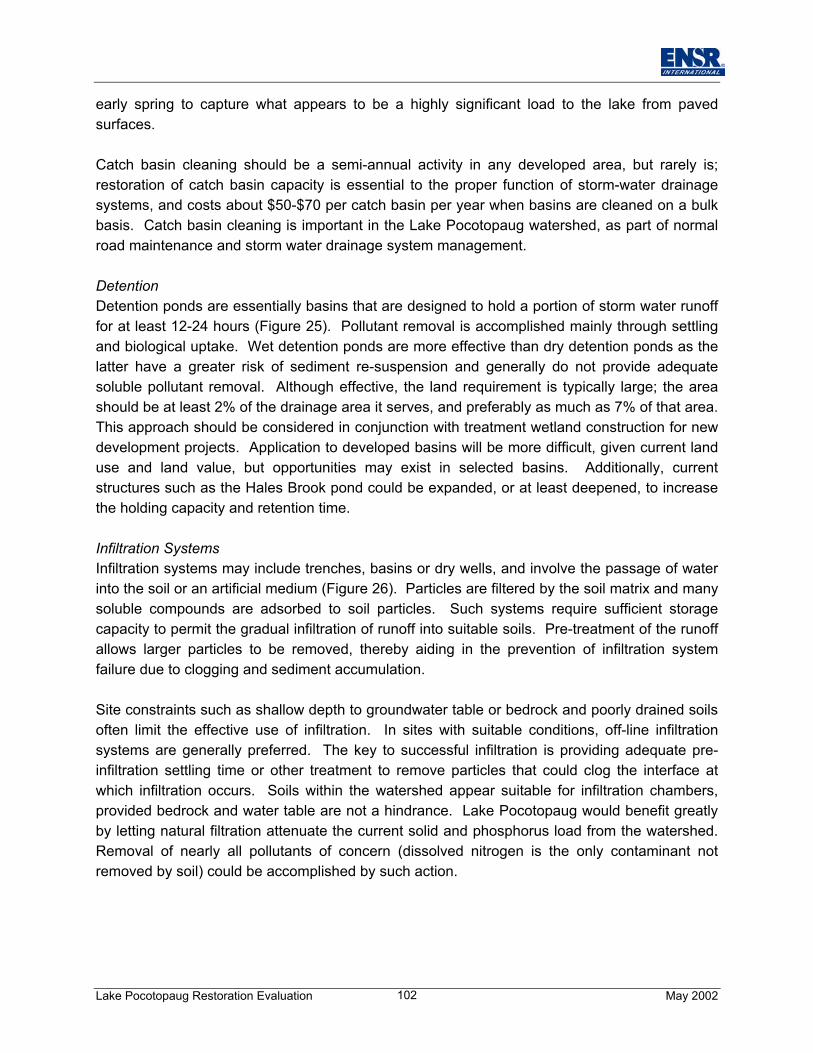
Lake Pocotopaug Restoration Evaluation May 2002102
early spring to capture what appears to be a highly significant load to the lake from pavedsurfaces.
Catch basin cleaning should be a semi-annual activity in any developed area, but rarely is;restoration of catch basin capacity is essential to the proper function of storm-water drainagesystems, and costs about $50-$70 per catch basin per year when basins are cleaned on a bulkbasis. Catch basin cleaning is important in the Lake Pocotopaug watershed, as part of normalroad maintenance and storm water drainage system management.
DetentionDetention ponds are essentially basins that are designed to hold a portion of storm water runofffor at least 12-24 hours (Figure 25). Pollutant removal is accomplished mainly through settlingand biological uptake. Wet detention ponds are more effective than dry detention ponds as thelatter have a greater risk of sediment re-suspension and generally do not provide adequatesoluble pollutant removal. Although effective, the land requirement is typically large; the areashould be at least 2% of the drainage area it serves, and preferably as much as 7% of that area.This approach should be considered in conjunction with treatment wetland construction for newdevelopment projects. Application to developed basins will be more difficult, given current landuse and land value, but opportunities may exist in selected basins. Additionally, currentstructures such as the Hales Brook pond could be expanded, or at least deepened, to increasethe holding capacity and retention time.
Infiltration SystemsInfiltration systems may include trenches, basins or dry wells, and involve the passage of waterinto the soil or an artificial medium (Figure 26). Particles are filtered by the soil matrix and manysoluble compounds are adsorbed to soil particles. Such systems require sufficient storagecapacity to permit the gradual infiltration of runoff into suitable soils. Pre-treatment of the runoffallows larger particles to be removed, thereby aiding in the prevention of infiltration systemfailure due to clogging and sediment accumulation.
Site constraints such as shallow depth to groundwater table or bedrock and poorly drained soilsoften limit the effective use of infiltration. In sites with suitable conditions, off-line infiltrationsystems are generally preferred. The key to successful infiltration is providing adequate pre-infiltration settling time or other treatment to remove particles that could clog the interface atwhich infiltration occurs. Soils within the watershed appear suitable for infiltration chambers,provided bedrock and water table are not a hindrance. Lake Pocotopaug would benefit greatlyby letting natural filtration attenuate the current solid and phosphorus load from the watershed.Removal of nearly all pollutants of concern (dissolved nitrogen is the only contaminant notremoved by soil) could be accomplished by such action.
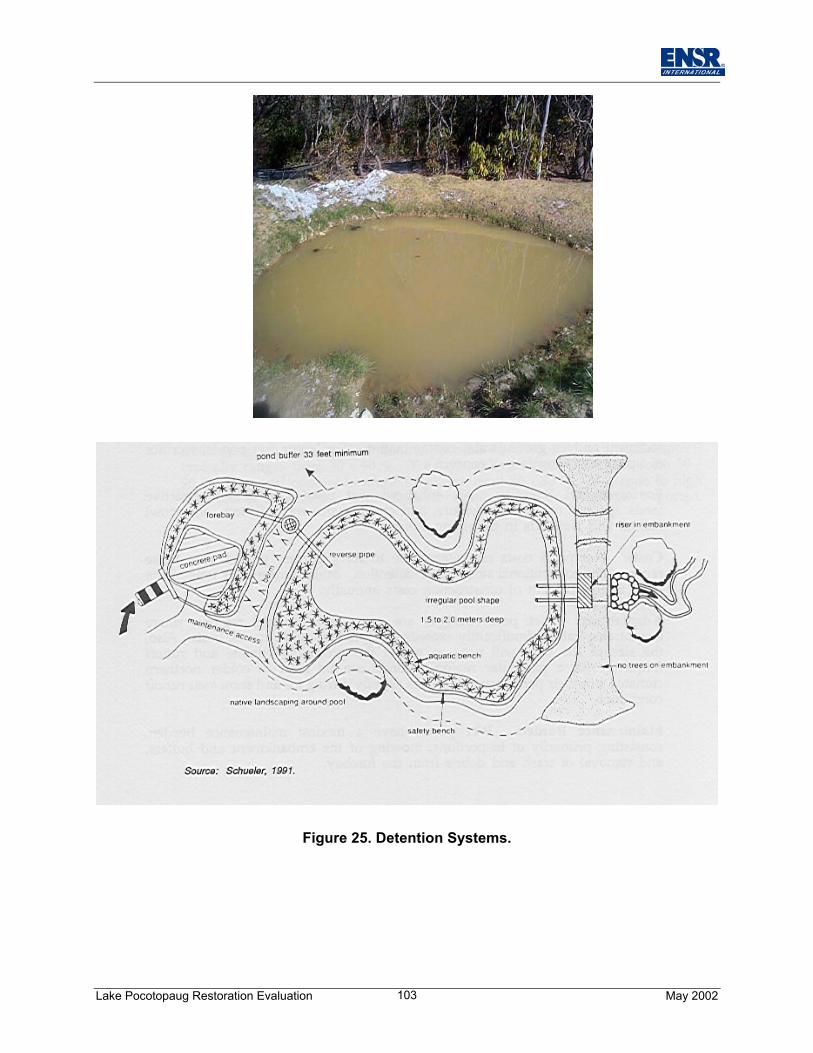
Lake Pocotopaug Restoration Evaluation May 2002103
Figure 25. Detention Systems.
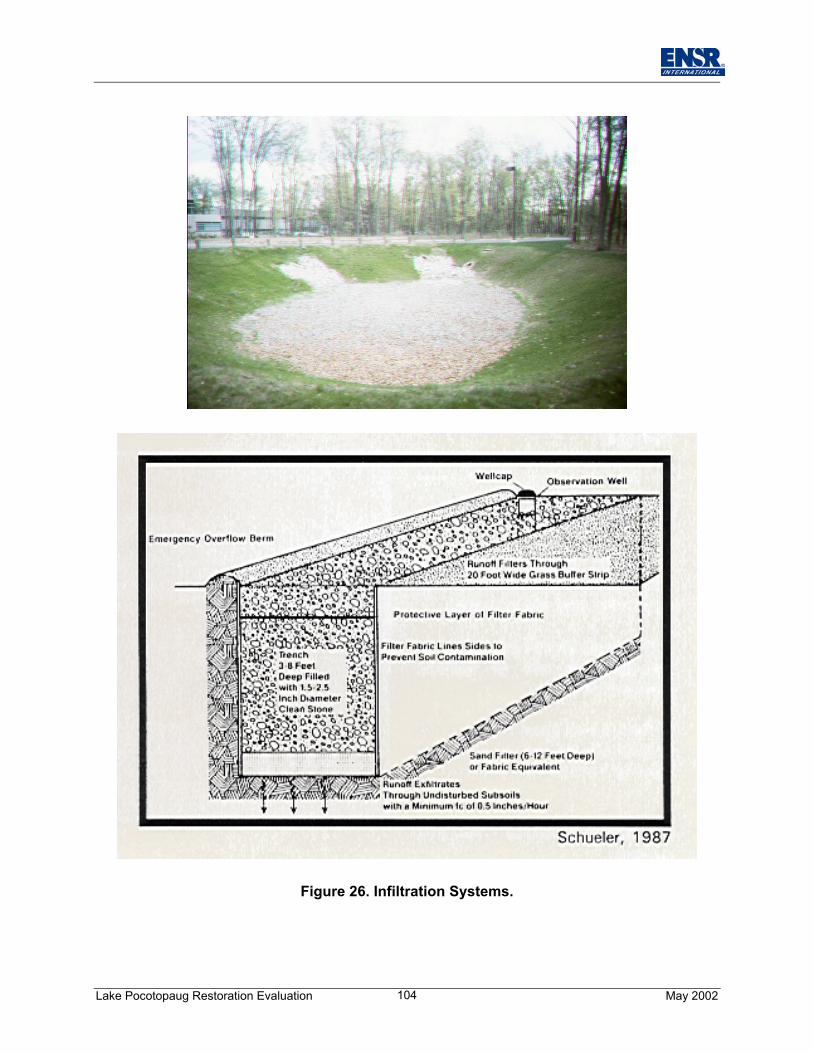
Lake Pocotopaug Restoration Evaluation May 2002104
Figure 26. Infiltration Systems.
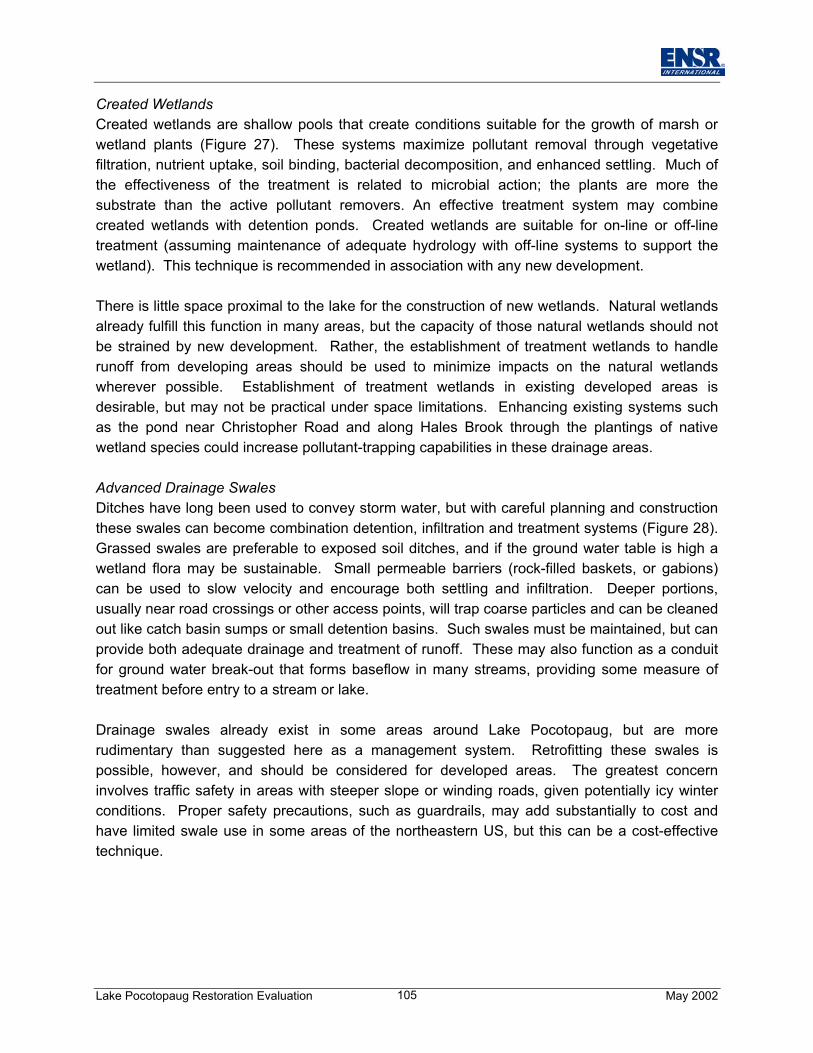
Lake Pocotopaug Restoration Evaluation May 2002105
Created WetlandsCreated wetlands are shallow pools that create conditions suitable for the growth of marsh orwetland plants (Figure 27). These systems maximize pollutant removal through vegetativefiltration, nutrient uptake, soil binding, bacterial decomposition, and enhanced settling. Much ofthe effectiveness of the treatment is related to microbial action; the plants are more thesubstrate than the active pollutant removers. An effective treatment system may combinecreated wetlands with detention ponds. Created wetlands are suitable for on-line or off-linetreatment (assuming maintenance of adequate hydrology with off-line systems to support thewetland). This technique is recommended in association with any new development.
There is little space proximal to the lake for the construction of new wetlands. Natural wetlandsalready fulfill this function in many areas, but the capacity of those natural wetlands should notbe strained by new development. Rather, the establishment of treatment wetlands to handlerunoff from developing areas should be used to minimize impacts on the natural wetlandswherever possible. Establishment of treatment wetlands in existing developed areas isdesirable, but may not be practical under space limitations. Enhancing existing systems suchas the pond near Christopher Road and along Hales Brook through the plantings of nativewetland species could increase pollutant-trapping capabilities in these drainage areas.
Advanced Drainage SwalesDitches have long been used to convey storm water, but with careful planning and constructionthese swales can become combination detention, infiltration and treatment systems (Figure 28).Grassed swales are preferable to exposed soil ditches, and if the ground water table is high awetland flora may be sustainable. Small permeable barriers (rock-filled baskets, or gabions)can be used to slow velocity and encourage both settling and infiltration. Deeper portions,usually near road crossings or other access points, will trap coarse particles and can be cleanedout like catch basin sumps or small detention basins. Such swales must be maintained, but canprovide both adequate drainage and treatment of runoff. These may also function as a conduitfor ground water break-out that forms baseflow in many streams, providing some measure oftreatment before entry to a stream or lake.
Drainage swales already exist in some areas around Lake Pocotopaug, but are morerudimentary than suggested here as a management system. Retrofitting these swales ispossible, however, and should be considered for developed areas. The greatest concerninvolves traffic safety in areas with steeper slope or winding roads, given potentially icy winterconditions. Proper safety precautions, such as guardrails, may add substantially to cost andhave limited swale use in some areas of the northeastern US, but this can be a cost-effectivetechnique.
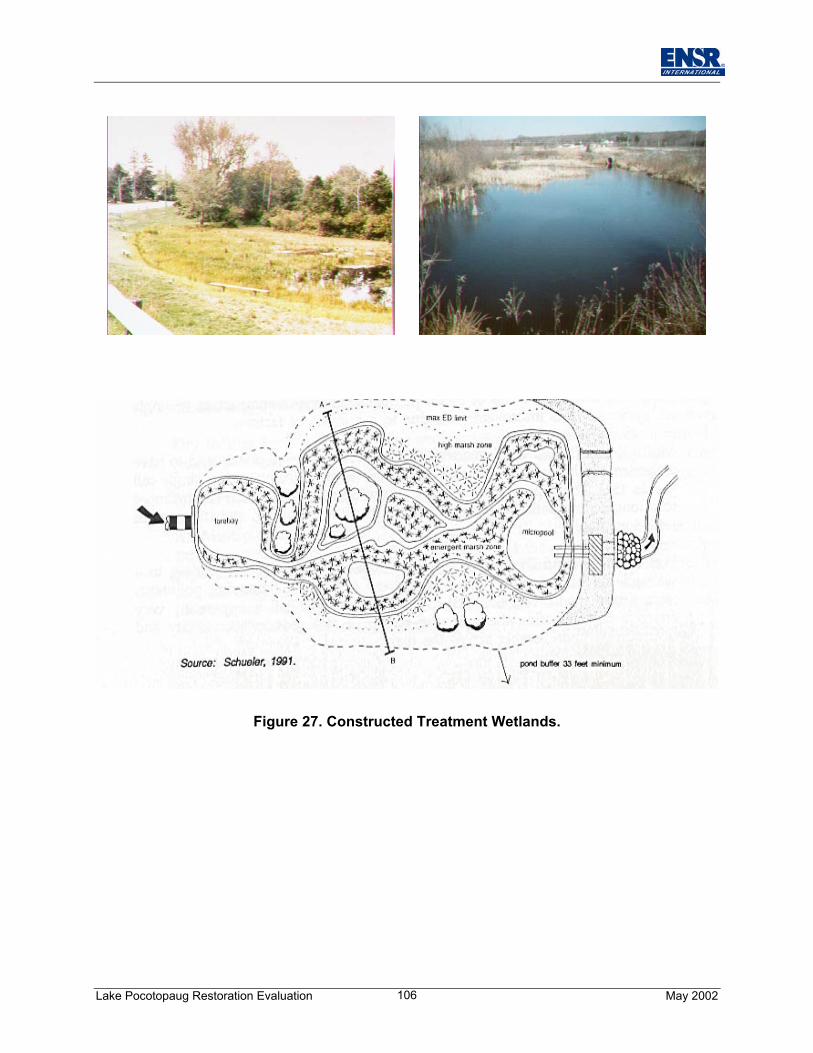
Lake Pocotopaug Restoration Evaluation May 2002106
Figure 27. Constructed Treatment Wetlands.
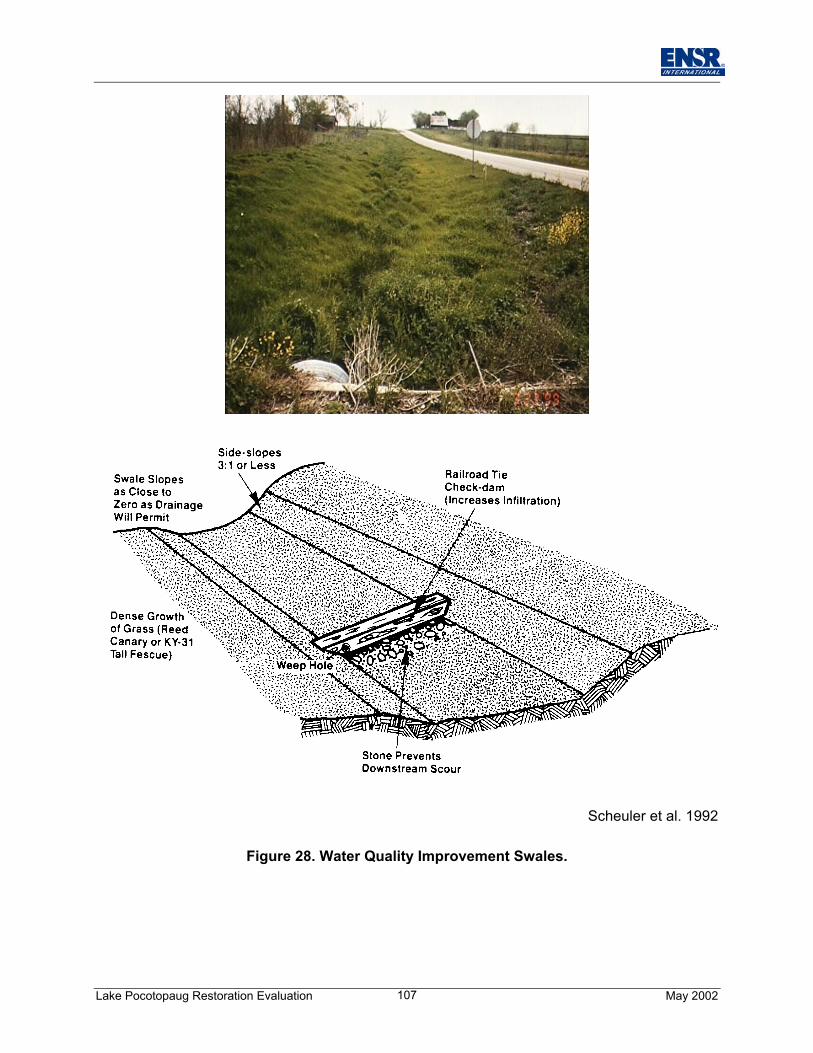
Lake Pocotopaug Restoration Evaluation May 2002107
Scheuler et al. 1992
Figure 28. Water Quality Improvement Swales.
Lake Pocotopaug Restoration Evaluation May 2002108
Chemical TreatmentIn-stream chemical treatment involves the dosing of stream flows with alum or other coagulantsto bind phosphorus and coagulate sediments to promote settling. During this process,phosphorus permanently complexes with aluminum or another binding agent, rendering itunavailable for biological uptake by algae. Clarification of drinking water uses alum extensively,and removal of phosphorus from wastewater in tertiary treatment systems often involves alum.This in-stream treatment technology has been successfully applied in other regions, especiallyFlorida. The primary application of this technology has been for phosphorus removal whereother BMPs were not viable. Phosphorus removal rates ranging from 50-95% have beenreported. Removal rates ranging from 50-99% have also been documented for other pollutantssuch as suspended solids, nitrogen, color, and bacteria. The alum treatment performed in thelake itself was intended to inactivate past inputs from the watershed; application in thewatershed would constitute pre-entry inactivation.
Although effective, this technique is not recommended for Lake Pocotopaug due to highoperational and maintenance costs. A dosing station would be needed for each dischargepoint, with at least four major locations possible. It may be possible to selectively treat the mostproblematic discharges, but this would not be considered until other means of controlling loadshave been explored, attempted, and dismissed.
11.3 Prevent algal blooms from occurring and maximize water clarity
Algal blooms are an issue at Lake Pocotopaug. Low nutrient availability typically controls algalgrowth, but not to the desired extent in this system. Blooms have occurred when totalphosphorus concentrations were as low as 10 ug/L, a level considered safe in most systems.This problem may be due to the types of algae present (a high volume to mass ratio blue-greenis dominant in blooms), additional nutrient sources not being measured by water columnmonitoring (sediment uptake) or lack of substantial zooplankton grazing. When consideringgraphs of the relationship between water clarity and chlorophyll or phosphorus, LakePocotopaug falls along the outside edge of the range of observed values. That is, while theobserved relationships are within the range observed elsewhere, this lake is experiencing aboutas high a level of production per unit of available phosphorus as allowed anywhere and as low awater clarity per unit of chlorophyll as might be expected. This means that management mustaim to do better than average – there is nothing average about Lake Pocotopaug!
The most preferable approach to eliminating algal blooms involves reducing the in-lakephosphorus concentrations even further, but there are practical limits to this approach. Allmethods described previously will reduce incoming phosphorus concentrations, but at best wemight reasonably expect a 60% reduction in the in-lake concentration of phosphorus could berealized. This should reduce the probability of blooms, but in-lake concentrations will still behigh enough at times to fuel algal blooms in this lake. Acting to reduce loading isrecommended, but it may not be sufficient by itself to achieve the desired results.
Lake Pocotopaug Restoration Evaluation May 2002109
Means by which algal blooms might be controlled through in-lake actions and the primaryadvantages and disadvantages are listed in Table 21. Most have some applicability to LakePocotopaug, but with what has been learned to date, many can be eliminated as front linemethods going forward from here. Further in-lake phosphorus inactivation should not be ruledout, but it does not seem appropriate to pursue this approach further until other sources ofphosphorus loading have been addressed. Use of algaecides is generally not a good ideaexcept in emergencies, as direct and indirect side effects can be substantial. Some techniques,such as large-scale dredging, drawdown or hypolimnetic withdrawal are minimally applicable tothis case. A review of options in Table 21 suggests that the most advantageous in-lake method(after the phosphorus inactivation approach implemented in 2001) is biological control throughenhanced grazing by zooplankton on algae.
Biological, or top-down control, is a form of biomanipulation in which biological components ofan aquatic system are altered to create a cascading effect within the food web that results insome desirable change. In this and many other cases that change would be increase waterclarity. Reducing predation on zooplankton by panfish, currently very abundant in LakePocotopaug, should increase zooplankton size and density. Larger and more abundantzooplankton will be a more effective phytoplankton grazing influence, thereby reducing algaldensity. This relationship has been demonstrated in the lab, in small ponds, and in some fairlylarge lakes, with each increase in size of resource accompanied by a longer time period toachieve the desired biological structure and enhanced water clarity.
Biological interactions are quite complicated, however, and not nearly as consistent as chemicalor physical control methods. The normal approach to enhancing grazing by zooplanktoninvolves either directly removing panfish or stocking predator fish to consume more panfish.The latter approach is generally considered preferable, but adds a step and further complicatesthe chain of events. If the stocked predator fish reproduce, their young may eat zooplankton forsome time before switching to the target panfish assemblage, so zooplankton predationintensity tends to vary considerably over time. Some algae resist grazing fairly well, allowingblooms to form in the presence of abundant zooplankton. However, empirical research hasshown that the degree of zooplankton grazing is a major factor in where a lake is positionedwithin the range of possible chlorophyll and water clarity values for a given phosphorusconcentration.
The stocking of walleye in Lake Pocotopaug may have the desired affect. Walleye werestocked in several lakes throughout Connecticut in an effort to increase fishing diversity, but oneof the prerequisites for successful walleye introduction is an abundant population of small perch.Lake Pocotopaug certain provides that condition, and if enough walleye were stocked in LakePocotopaug, panfish densities should decrease, zooplankton body size and abundance shouldincrease, and phytoplankton densities should decrease. A fisheries study is warranted todetermine if enough fish were stocked to have this secondary effect on Lake Pocotopaug.
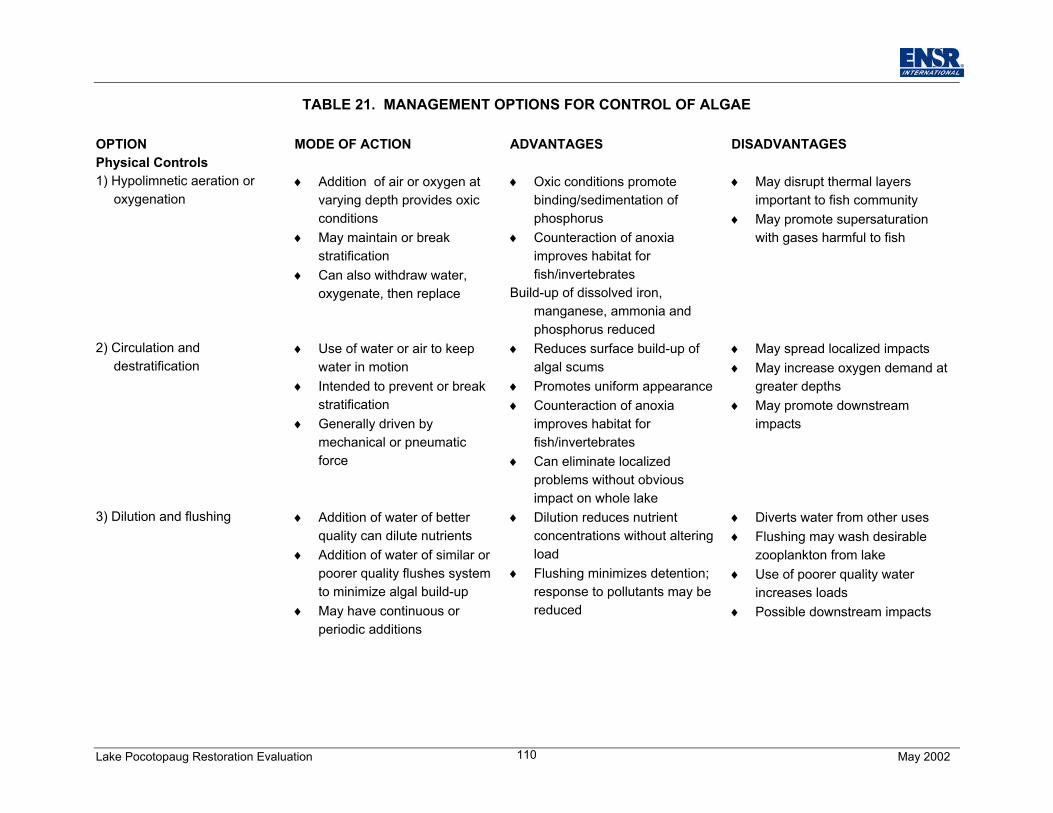
Lake Pocotopaug Restoration Evaluation May 2002110
TABLE 21. MANAGEMENT OPTIONS FOR CONTROL OF ALGAE
OPTION MODE OF ACTION ADVANTAGES DISADVANTAGESPhysical Controls1) Hypolimnetic aeration or
oxygenation♦ Addition of air or oxygen at
varying depth provides oxicconditions
♦ May maintain or breakstratification
♦ Can also withdraw water,oxygenate, then replace
♦ Oxic conditions promotebinding/sedimentation ofphosphorus
♦ Counteraction of anoxiaimproves habitat forfish/invertebrates
Build-up of dissolved iron,manganese, ammonia andphosphorus reduced
♦ May disrupt thermal layersimportant to fish community
♦ May promote supersaturationwith gases harmful to fish
2) Circulation anddestratification
♦ Use of water or air to keepwater in motion
♦ Intended to prevent or breakstratification
♦ Generally driven bymechanical or pneumaticforce
♦ Reduces surface build-up ofalgal scums
♦ Promotes uniform appearance♦ Counteraction of anoxia
improves habitat forfish/invertebrates
♦ Can eliminate localizedproblems without obviousimpact on whole lake
♦ May spread localized impacts♦ May increase oxygen demand at
greater depths♦ May promote downstream
impacts
3) Dilution and flushing ♦ Addition of water of betterquality can dilute nutrients
♦ Addition of water of similar orpoorer quality flushes systemto minimize algal build-up
♦ May have continuous orperiodic additions
♦ Dilution reduces nutrientconcentrations without alteringload
♦ Flushing minimizes detention;response to pollutants may bereduced
♦ Diverts water from other uses♦ Flushing may wash desirable
zooplankton from lake♦ Use of poorer quality water
increases loads♦ Possible downstream impacts
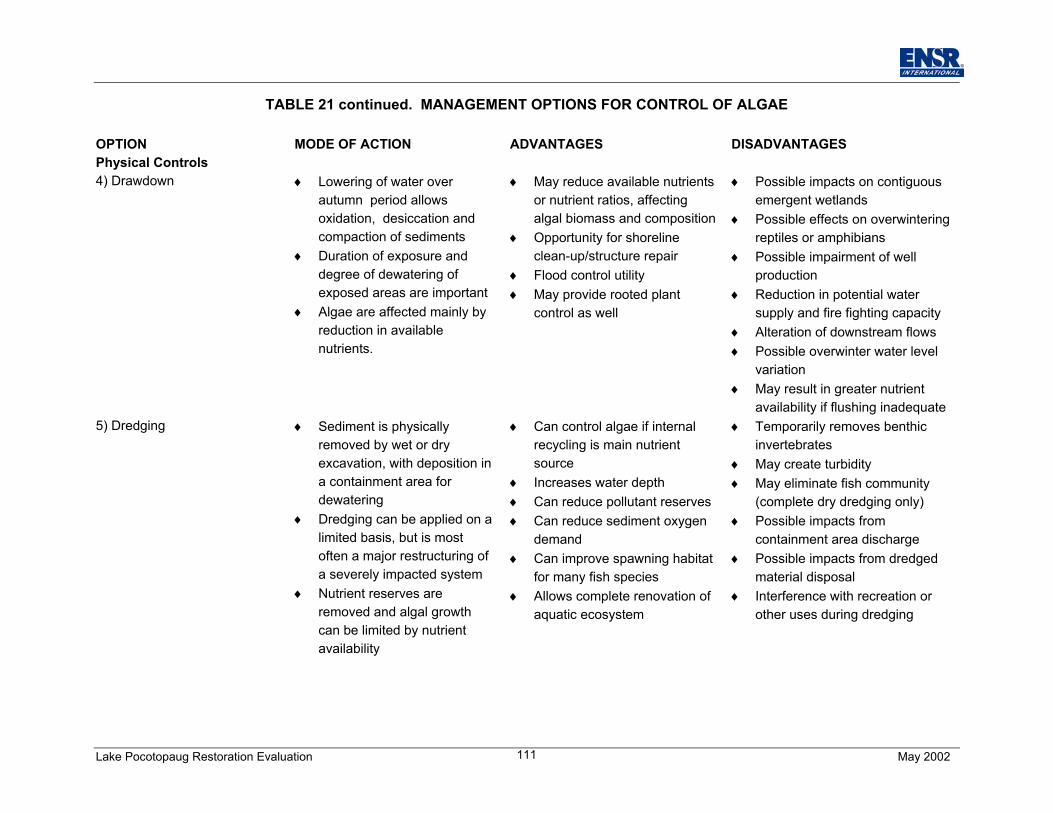
Lake Pocotopaug Restoration Evaluation May 2002111
TABLE 21 continued. MANAGEMENT OPTIONS FOR CONTROL OF ALGAE
OPTION MODE OF ACTION ADVANTAGES DISADVANTAGESPhysical Controls4) Drawdown ♦ Lowering of water over
autumn period allowsoxidation, desiccation andcompaction of sediments
♦ Duration of exposure anddegree of dewatering ofexposed areas are important
♦ Algae are affected mainly byreduction in availablenutrients.
♦ May reduce available nutrientsor nutrient ratios, affectingalgal biomass and composition
♦ Opportunity for shorelineclean-up/structure repair
♦ Flood control utility♦ May provide rooted plant
control as well
♦ Possible impacts on contiguousemergent wetlands
♦ Possible effects on overwinteringreptiles or amphibians
♦ Possible impairment of wellproduction
♦ Reduction in potential watersupply and fire fighting capacity
♦ Alteration of downstream flows♦ Possible overwinter water level
variation♦ May result in greater nutrient
availability if flushing inadequate5) Dredging ♦ Sediment is physically
removed by wet or dryexcavation, with deposition ina containment area fordewatering
♦ Dredging can be applied on alimited basis, but is mostoften a major restructuring ofa severely impacted system
♦ Nutrient reserves areremoved and algal growthcan be limited by nutrientavailability
♦ Can control algae if internalrecycling is main nutrientsource
♦ Increases water depth♦ Can reduce pollutant reserves♦ Can reduce sediment oxygen
demand♦ Can improve spawning habitat
for many fish species♦ Allows complete renovation of
aquatic ecosystem
♦ Temporarily removes benthicinvertebrates
♦ May create turbidity♦ May eliminate fish community
(complete dry dredging only)♦ Possible impacts from
containment area discharge♦ Possible impacts from dredged
material disposal♦ Interference with recreation or
other uses during dredging
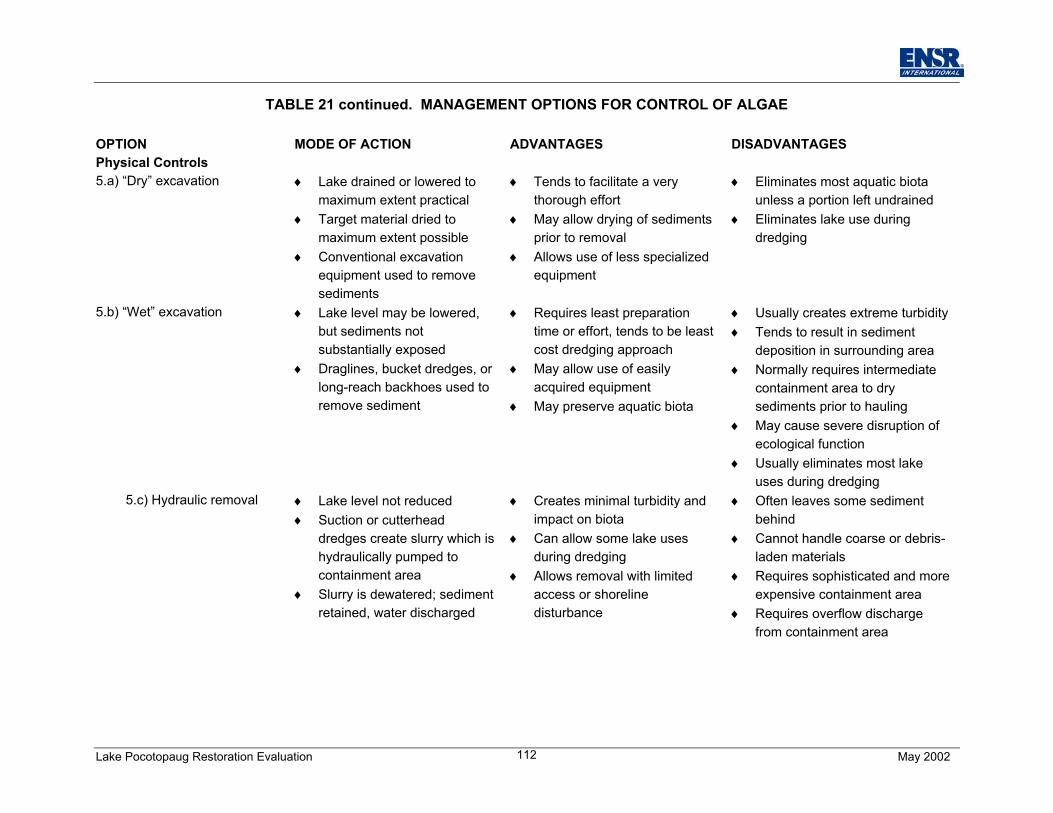
Lake Pocotopaug Restoration Evaluation May 2002112
TABLE 21 continued. MANAGEMENT OPTIONS FOR CONTROL OF ALGAE
OPTION MODE OF ACTION ADVANTAGES DISADVANTAGESPhysical Controls 5.a) “Dry” excavation ♦ Lake drained or lowered to
maximum extent practical♦ Target material dried to
maximum extent possible♦ Conventional excavation
equipment used to removesediments
♦ Tends to facilitate a verythorough effort
♦ May allow drying of sedimentsprior to removal
♦ Allows use of less specializedequipment
♦ Eliminates most aquatic biotaunless a portion left undrained
♦ Eliminates lake use duringdredging
5.b) “Wet” excavation ♦ Lake level may be lowered,but sediments notsubstantially exposed
♦ Draglines, bucket dredges, orlong-reach backhoes used toremove sediment
♦ Requires least preparationtime or effort, tends to be leastcost dredging approach
♦ May allow use of easilyacquired equipment
♦ May preserve aquatic biota
♦ Usually creates extreme turbidity♦ Tends to result in sediment
deposition in surrounding area♦ Normally requires intermediate
containment area to drysediments prior to hauling
♦ May cause severe disruption ofecological function
♦ Usually eliminates most lakeuses during dredging
5.c) Hydraulic removal ♦ Lake level not reduced♦ Suction or cutterhead
dredges create slurry which ishydraulically pumped tocontainment area
♦ Slurry is dewatered; sedimentretained, water discharged
♦ Creates minimal turbidity andimpact on biota
♦ Can allow some lake usesduring dredging
♦ Allows removal with limitedaccess or shorelinedisturbance
♦ Often leaves some sedimentbehind
♦ Cannot handle coarse or debris-laden materials
♦ Requires sophisticated and moreexpensive containment area
♦ Requires overflow dischargefrom containment area
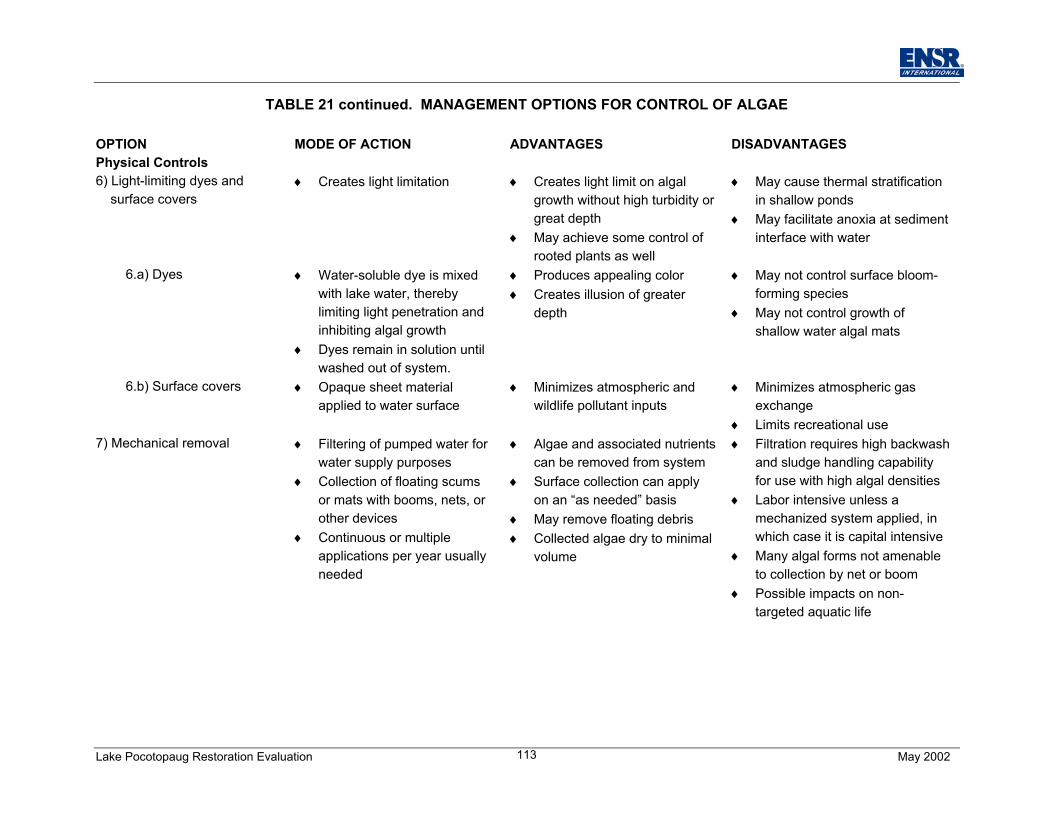
Lake Pocotopaug Restoration Evaluation May 2002113
TABLE 21 continued. MANAGEMENT OPTIONS FOR CONTROL OF ALGAE
OPTION MODE OF ACTION ADVANTAGES DISADVANTAGESPhysical Controls 6) Light-limiting dyes and surface covers
♦ Creates light limitation ♦ Creates light limit on algalgrowth without high turbidity orgreat depth
♦ May achieve some control ofrooted plants as well
♦ May cause thermal stratificationin shallow ponds
♦ May facilitate anoxia at sedimentinterface with water
6.a) Dyes ♦ Water-soluble dye is mixedwith lake water, therebylimiting light penetration andinhibiting algal growth
♦ Dyes remain in solution untilwashed out of system.
♦ Produces appealing color♦ Creates illusion of greater
depth
♦ May not control surface bloom-forming species
♦ May not control growth ofshallow water algal mats
6.b) Surface covers ♦ Opaque sheet materialapplied to water surface
♦ Minimizes atmospheric andwildlife pollutant inputs
♦ Minimizes atmospheric gasexchange
♦ Limits recreational use 7) Mechanical removal
♦ Filtering of pumped water forwater supply purposes
♦ Collection of floating scumsor mats with booms, nets, orother devices
♦ Continuous or multipleapplications per year usuallyneeded
♦ Algae and associated nutrientscan be removed from system
♦ Surface collection can applyon an “as needed” basis
♦ May remove floating debris♦ Collected algae dry to minimal
volume
♦ Filtration requires high backwashand sludge handling capabilityfor use with high algal densities
♦ Labor intensive unless amechanized system applied, inwhich case it is capital intensive
♦ Many algal forms not amenableto collection by net or boom
♦ Possible impacts on non-targeted aquatic life
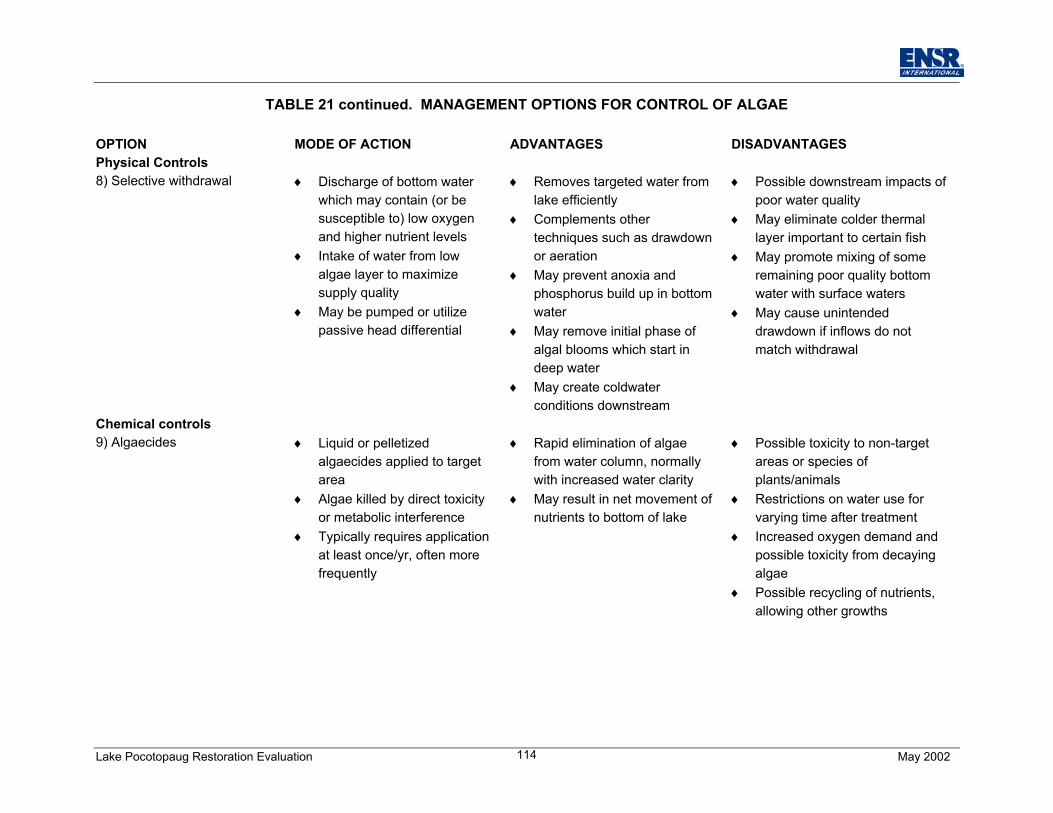
Lake Pocotopaug Restoration Evaluation May 2002114
TABLE 21 continued. MANAGEMENT OPTIONS FOR CONTROL OF ALGAE
OPTION MODE OF ACTION ADVANTAGES DISADVANTAGESPhysical Controls8) Selective withdrawal ♦ Discharge of bottom water
which may contain (or besusceptible to) low oxygenand higher nutrient levels
♦ Intake of water from lowalgae layer to maximizesupply quality
♦ May be pumped or utilizepassive head differential
♦ Removes targeted water fromlake efficiently
♦ Complements othertechniques such as drawdownor aeration
♦ May prevent anoxia andphosphorus build up in bottomwater
♦ May remove initial phase ofalgal blooms which start indeep water
♦ May create coldwaterconditions downstream
♦ Possible downstream impacts ofpoor water quality
♦ May eliminate colder thermallayer important to certain fish
♦ May promote mixing of someremaining poor quality bottomwater with surface waters
♦ May cause unintendeddrawdown if inflows do notmatch withdrawal
Chemical controls 9) Algaecides ♦ Liquid or pelletized
algaecides applied to targetarea
♦ Algae killed by direct toxicityor metabolic interference
♦ Typically requires applicationat least once/yr, often morefrequently
♦ Rapid elimination of algaefrom water column, normallywith increased water clarity
♦ May result in net movement ofnutrients to bottom of lake
♦ Possible toxicity to non-targetareas or species ofplants/animals
♦ Restrictions on water use forvarying time after treatment
♦ Increased oxygen demand andpossible toxicity from decayingalgae
♦ Possible recycling of nutrients,allowing other growths
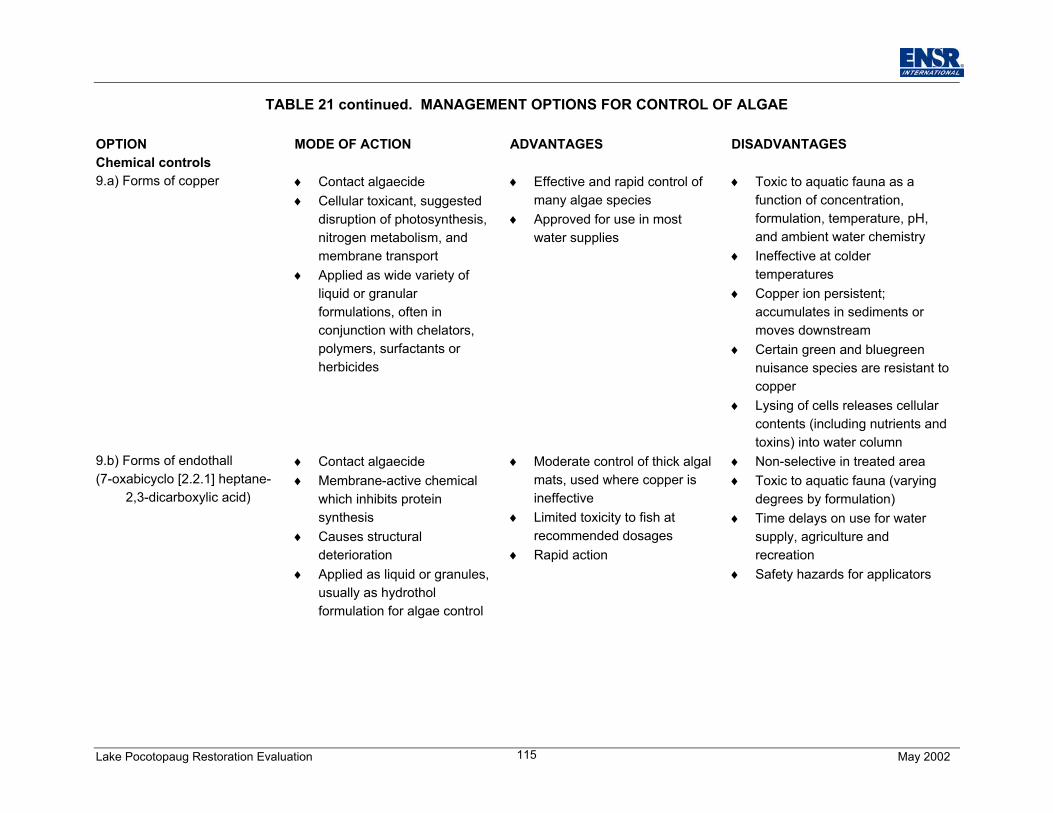
Lake Pocotopaug Restoration Evaluation May 2002115
TABLE 21 continued. MANAGEMENT OPTIONS FOR CONTROL OF ALGAE
OPTION MODE OF ACTION ADVANTAGES DISADVANTAGES Chemical controls 9.a) Forms of copper
♦ Contact algaecide♦ Cellular toxicant, suggested
disruption of photosynthesis,nitrogen metabolism, andmembrane transport
♦ Applied as wide variety ofliquid or granularformulations, often inconjunction with chelators,polymers, surfactants orherbicides
♦ Effective and rapid control ofmany algae species
♦ Approved for use in mostwater supplies
♦ Toxic to aquatic fauna as afunction of concentration,formulation, temperature, pH,and ambient water chemistry
♦ Ineffective at coldertemperatures
♦ Copper ion persistent;accumulates in sediments ormoves downstream
♦ Certain green and bluegreennuisance species are resistant tocopper
♦ Lysing of cells releases cellularcontents (including nutrients andtoxins) into water column
9.b) Forms of endothall (7-oxabicyclo [2.2.1] heptane-
2,3-dicarboxylic acid)
♦ Contact algaecide♦ Membrane-active chemical
which inhibits proteinsynthesis
♦ Causes structuraldeterioration
♦ Applied as liquid or granules,usually as hydrotholformulation for algae control
♦ Moderate control of thick algalmats, used where copper isineffective
♦ Limited toxicity to fish atrecommended dosages
♦ Rapid action
♦ Non-selective in treated area♦ Toxic to aquatic fauna (varying
degrees by formulation)♦ Time delays on use for water
supply, agriculture andrecreation
♦ Safety hazards for applicators
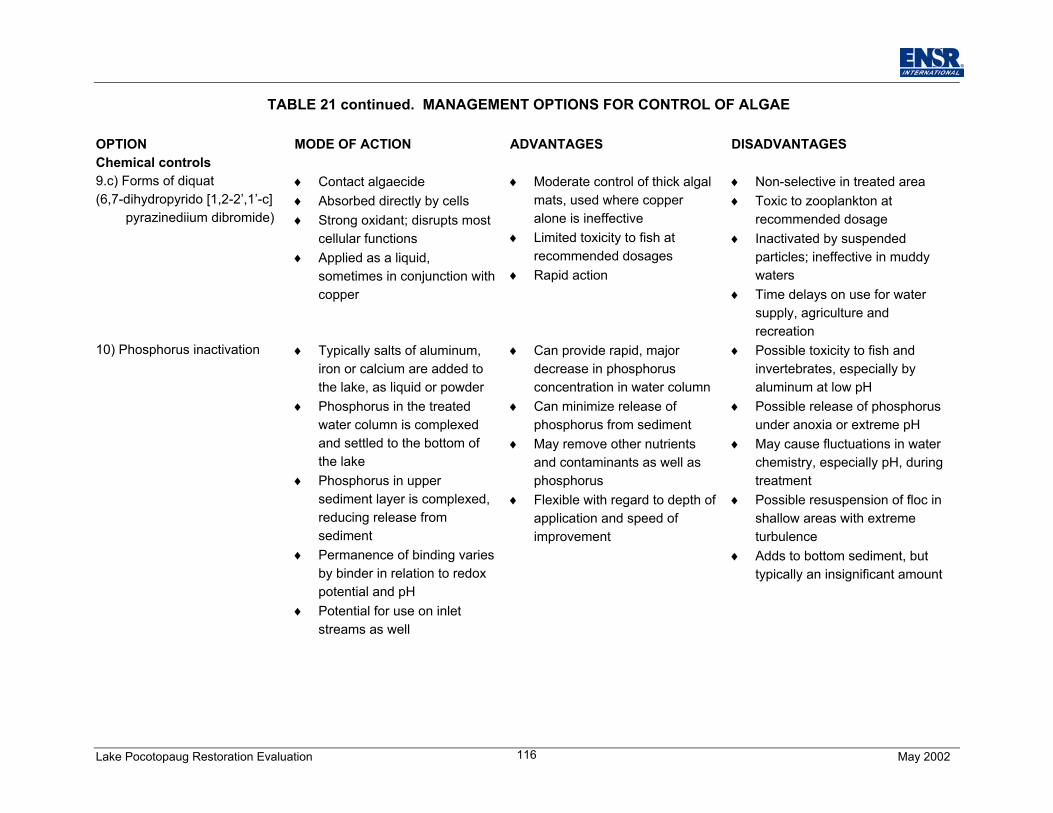
Lake Pocotopaug Restoration Evaluation May 2002116
TABLE 21 continued. MANAGEMENT OPTIONS FOR CONTROL OF ALGAE
OPTION MODE OF ACTION ADVANTAGES DISADVANTAGES Chemical controls 9.c) Forms of diquat (6,7-dihydropyrido [1,2-2’,1’-c]
pyrazinediium dibromide)
♦ Contact algaecide♦ Absorbed directly by cells♦ Strong oxidant; disrupts most
cellular functions♦ Applied as a liquid,
sometimes in conjunction withcopper
♦ Moderate control of thick algalmats, used where copperalone is ineffective
♦ Limited toxicity to fish atrecommended dosages
♦ Rapid action
♦ Non-selective in treated area♦ Toxic to zooplankton at
recommended dosage♦ Inactivated by suspended
particles; ineffective in muddywaters
♦ Time delays on use for watersupply, agriculture andrecreation
10) Phosphorus inactivation ♦ Typically salts of aluminum,iron or calcium are added tothe lake, as liquid or powder
♦ Phosphorus in the treatedwater column is complexedand settled to the bottom ofthe lake
♦ Phosphorus in uppersediment layer is complexed,reducing release fromsediment
♦ Permanence of binding variesby binder in relation to redoxpotential and pH
♦ Potential for use on inletstreams as well
♦ Can provide rapid, majordecrease in phosphorusconcentration in water column
♦ Can minimize release ofphosphorus from sediment
♦ May remove other nutrientsand contaminants as well asphosphorus
♦ Flexible with regard to depth ofapplication and speed ofimprovement
♦ Possible toxicity to fish andinvertebrates, especially byaluminum at low pH
♦ Possible release of phosphorusunder anoxia or extreme pH
♦ May cause fluctuations in waterchemistry, especially pH, duringtreatment
♦ Possible resuspension of floc inshallow areas with extremeturbulence
♦ Adds to bottom sediment, buttypically an insignificant amount
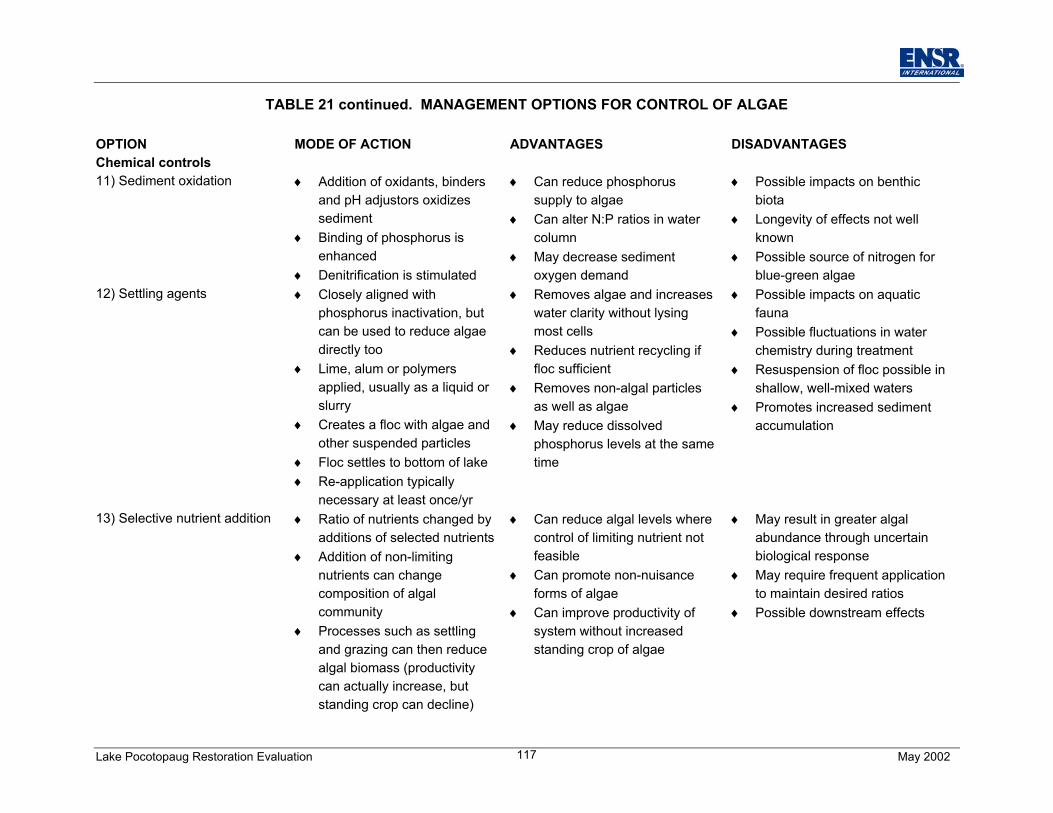
Lake Pocotopaug Restoration Evaluation May 2002117
TABLE 21 continued. MANAGEMENT OPTIONS FOR CONTROL OF ALGAE
OPTION MODE OF ACTION ADVANTAGES DISADVANTAGES Chemical controls 11) Sediment oxidation ♦ Addition of oxidants, binders
and pH adjustors oxidizessediment
♦ Binding of phosphorus isenhanced
♦ Denitrification is stimulated
♦ Can reduce phosphorussupply to algae
♦ Can alter N:P ratios in watercolumn
♦ May decrease sedimentoxygen demand
♦ Possible impacts on benthicbiota
♦ Longevity of effects not wellknown
♦ Possible source of nitrogen forblue-green algae
12) Settling agents ♦ Closely aligned withphosphorus inactivation, butcan be used to reduce algaedirectly too
♦ Lime, alum or polymersapplied, usually as a liquid orslurry
♦ Creates a floc with algae andother suspended particles
♦ Floc settles to bottom of lake♦ Re-application typically
necessary at least once/yr
♦ Removes algae and increaseswater clarity without lysingmost cells
♦ Reduces nutrient recycling iffloc sufficient
♦ Removes non-algal particlesas well as algae
♦ May reduce dissolvedphosphorus levels at the sametime
♦ Possible impacts on aquaticfauna
♦ Possible fluctuations in waterchemistry during treatment
♦ Resuspension of floc possible inshallow, well-mixed waters
♦ Promotes increased sedimentaccumulation
13) Selective nutrient addition ♦ Ratio of nutrients changed byadditions of selected nutrients
♦ Addition of non-limitingnutrients can changecomposition of algalcommunity
♦ Processes such as settlingand grazing can then reducealgal biomass (productivitycan actually increase, butstanding crop can decline)
♦ Can reduce algal levels wherecontrol of limiting nutrient notfeasible
♦ Can promote non-nuisanceforms of algae
♦ Can improve productivity ofsystem without increasedstanding crop of algae
♦ May result in greater algalabundance through uncertainbiological response
♦ May require frequent applicationto maintain desired ratios
♦ Possible downstream effects
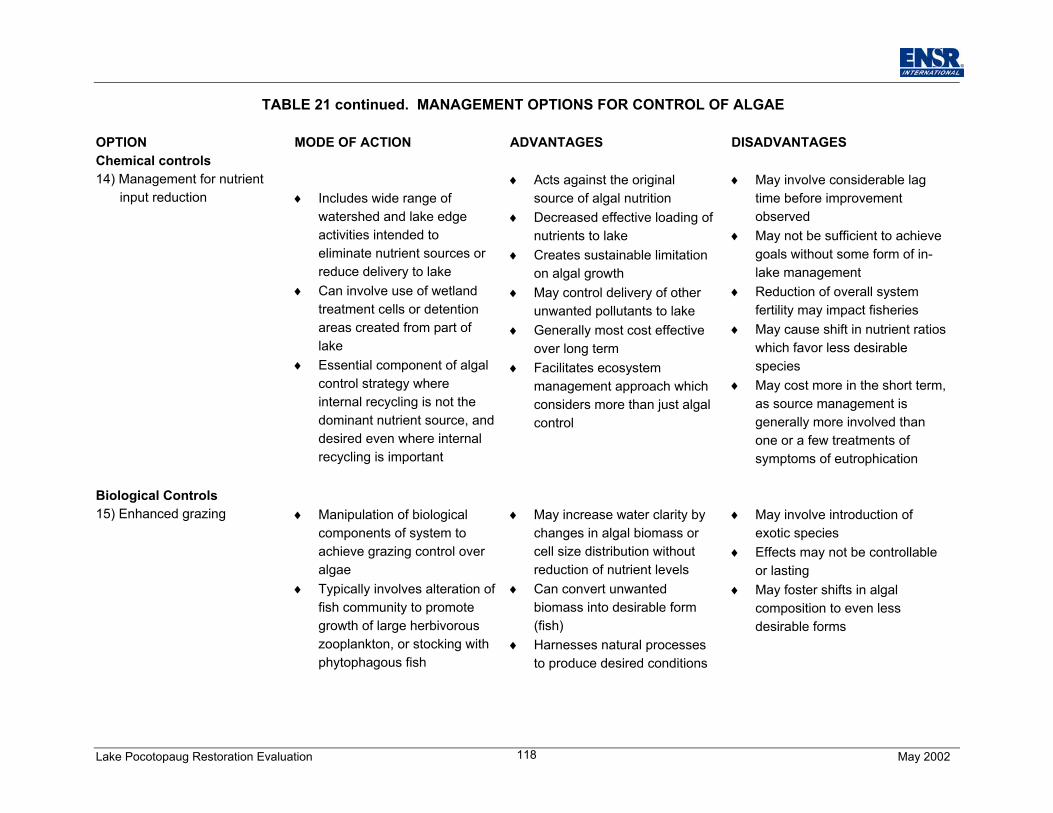
Lake Pocotopaug Restoration Evaluation May 2002118
TABLE 21 continued. MANAGEMENT OPTIONS FOR CONTROL OF ALGAE
OPTION MODE OF ACTION ADVANTAGES DISADVANTAGES Chemical controls 14) Management for nutrient
input reduction ♦ Includes wide range ofwatershed and lake edgeactivities intended toeliminate nutrient sources orreduce delivery to lake
♦ Can involve use of wetlandtreatment cells or detentionareas created from part oflake
♦ Essential component of algalcontrol strategy whereinternal recycling is not thedominant nutrient source, anddesired even where internalrecycling is important
♦ Acts against the originalsource of algal nutrition
♦ Decreased effective loading ofnutrients to lake
♦ Creates sustainable limitationon algal growth
♦ May control delivery of otherunwanted pollutants to lake
♦ Generally most cost effectiveover long term
♦ Facilitates ecosystemmanagement approach whichconsiders more than just algalcontrol
♦ May involve considerable lagtime before improvementobserved
♦ May not be sufficient to achievegoals without some form of in-lake management
♦ Reduction of overall systemfertility may impact fisheries
♦ May cause shift in nutrient ratioswhich favor less desirablespecies
♦ May cost more in the short term,as source management isgenerally more involved thanone or a few treatments ofsymptoms of eutrophication
Biological Controls 15) Enhanced grazing ♦ Manipulation of biological
components of system toachieve grazing control overalgae
♦ Typically involves alteration offish community to promotegrowth of large herbivorouszooplankton, or stocking withphytophagous fish
♦ May increase water clarity bychanges in algal biomass orcell size distribution withoutreduction of nutrient levels
♦ Can convert unwantedbiomass into desirable form(fish)
♦ Harnesses natural processesto produce desired conditions
♦ May involve introduction ofexotic species
♦ Effects may not be controllableor lasting
♦ May foster shifts in algalcomposition to even lessdesirable forms
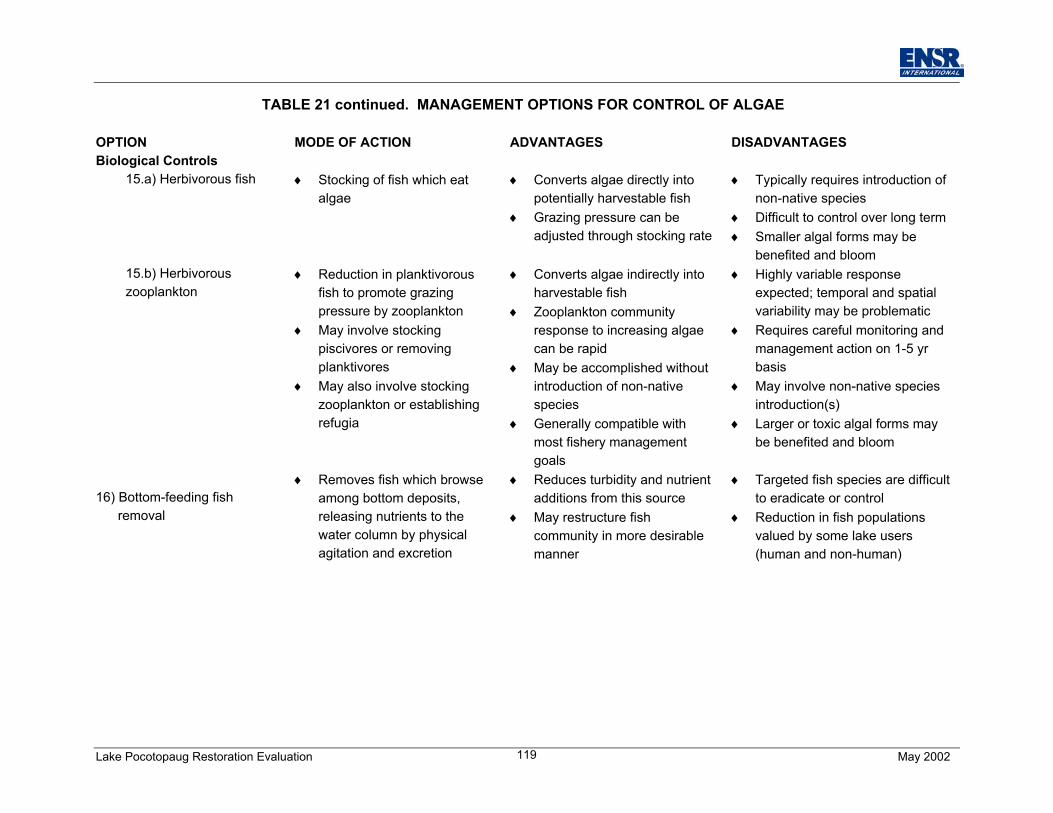
Lake Pocotopaug Restoration Evaluation May 2002119
TABLE 21 continued. MANAGEMENT OPTIONS FOR CONTROL OF ALGAE
OPTION MODE OF ACTION ADVANTAGES DISADVANTAGES Biological Controls
15.a) Herbivorous fish ♦ Stocking of fish which eatalgae
♦ Converts algae directly intopotentially harvestable fish
♦ Grazing pressure can beadjusted through stocking rate
♦ Typically requires introduction ofnon-native species
♦ Difficult to control over long term♦ Smaller algal forms may be
benefited and bloom 15.b) Herbivorouszooplankton
♦ Reduction in planktivorousfish to promote grazingpressure by zooplankton
♦ May involve stockingpiscivores or removingplanktivores
♦ May also involve stockingzooplankton or establishingrefugia
♦ Converts algae indirectly intoharvestable fish
♦ Zooplankton communityresponse to increasing algaecan be rapid
♦ May be accomplished withoutintroduction of non-nativespecies
♦ Generally compatible withmost fishery managementgoals
♦ Highly variable responseexpected; temporal and spatialvariability may be problematic
♦ Requires careful monitoring andmanagement action on 1-5 yrbasis
♦ May involve non-native speciesintroduction(s)
♦ Larger or toxic algal forms maybe benefited and bloom
16) Bottom-feeding fish removal
♦ Removes fish which browseamong bottom deposits,releasing nutrients to thewater column by physicalagitation and excretion
♦ Reduces turbidity and nutrientadditions from this source
♦ May restructure fishcommunity in more desirablemanner
♦ Targeted fish species are difficultto eradicate or control
♦ Reduction in fish populationsvalued by some lake users(human and non-human)
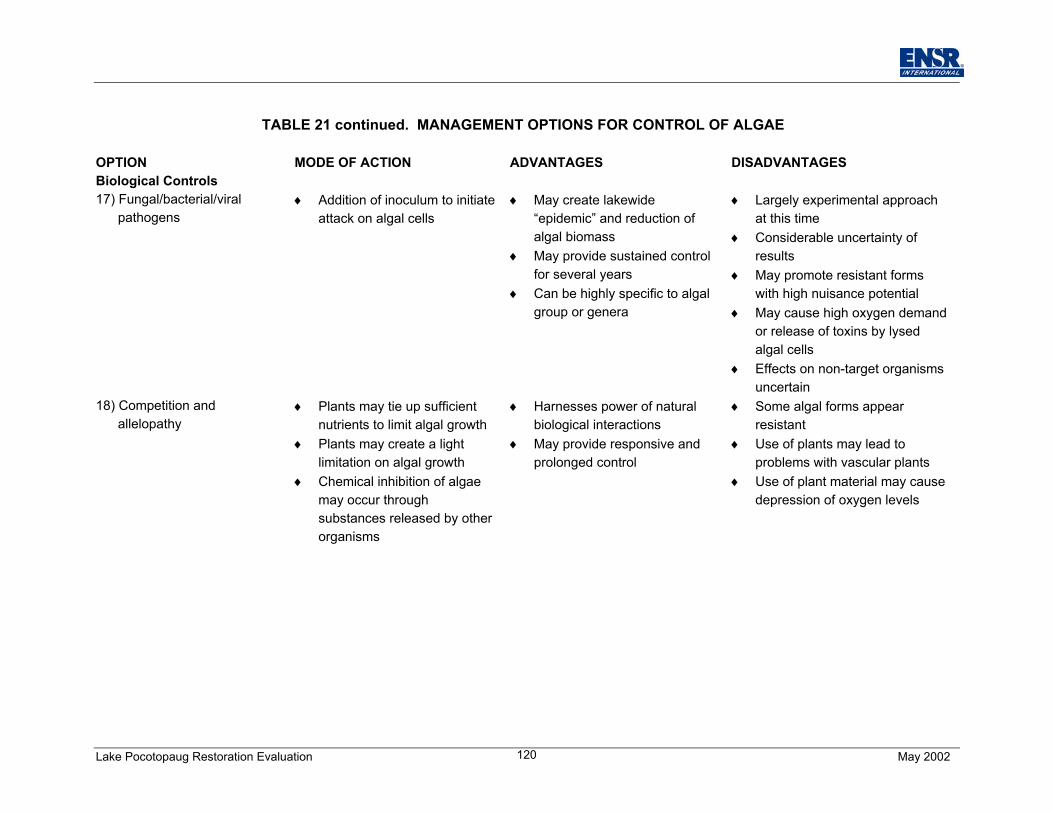
Lake Pocotopaug Restoration Evaluation May 2002120
TABLE 21 continued. MANAGEMENT OPTIONS FOR CONTROL OF ALGAE
OPTION MODE OF ACTION ADVANTAGES DISADVANTAGES Biological Controls 17) Fungal/bacterial/viral pathogens
♦ Addition of inoculum to initiateattack on algal cells
♦ May create lakewide“epidemic” and reduction ofalgal biomass
♦ May provide sustained controlfor several years
♦ Can be highly specific to algalgroup or genera
♦ Largely experimental approachat this time
♦ Considerable uncertainty ofresults
♦ May promote resistant formswith high nuisance potential
♦ May cause high oxygen demandor release of toxins by lysedalgal cells
♦ Effects on non-target organismsuncertain
18) Competition and allelopathy
♦ Plants may tie up sufficientnutrients to limit algal growth
♦ Plants may create a lightlimitation on algal growth
♦ Chemical inhibition of algaemay occur throughsubstances released by otherorganisms
♦ Harnesses power of naturalbiological interactions
♦ May provide responsive andprolonged control
♦ Some algal forms appearresistant
♦ Use of plants may lead toproblems with vascular plants
♦ Use of plant material may causedepression of oxygen levels
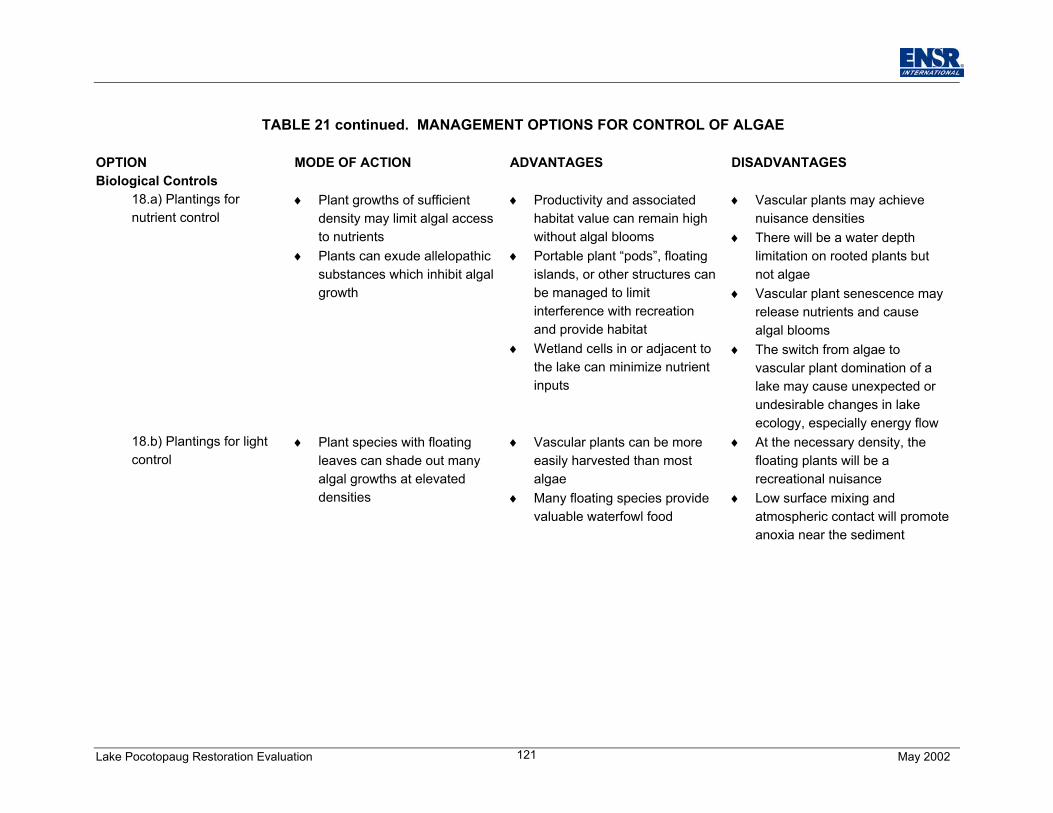
Lake Pocotopaug Restoration Evaluation May 2002121
TABLE 21 continued. MANAGEMENT OPTIONS FOR CONTROL OF ALGAE
OPTION MODE OF ACTION ADVANTAGES DISADVANTAGES Biological Controls
18.a) Plantings fornutrient control
♦ Plant growths of sufficientdensity may limit algal accessto nutrients
♦ Plants can exude allelopathicsubstances which inhibit algalgrowth
♦ Productivity and associatedhabitat value can remain highwithout algal blooms
♦ Portable plant “pods”, floatingislands, or other structures canbe managed to limitinterference with recreationand provide habitat
♦ Wetland cells in or adjacent tothe lake can minimize nutrientinputs
♦ Vascular plants may achievenuisance densities
♦ There will be a water depthlimitation on rooted plants butnot algae
♦ Vascular plant senescence mayrelease nutrients and causealgal blooms
♦ The switch from algae tovascular plant domination of alake may cause unexpected orundesirable changes in lakeecology, especially energy flow
18.b) Plantings for lightcontrol
♦ Plant species with floatingleaves can shade out manyalgal growths at elevateddensities
♦ Vascular plants can be moreeasily harvested than mostalgae
♦ Many floating species providevaluable waterfowl food
♦ At the necessary density, thefloating plants will be arecreational nuisance
♦ Low surface mixing andatmospheric contact will promoteanoxia near the sediment
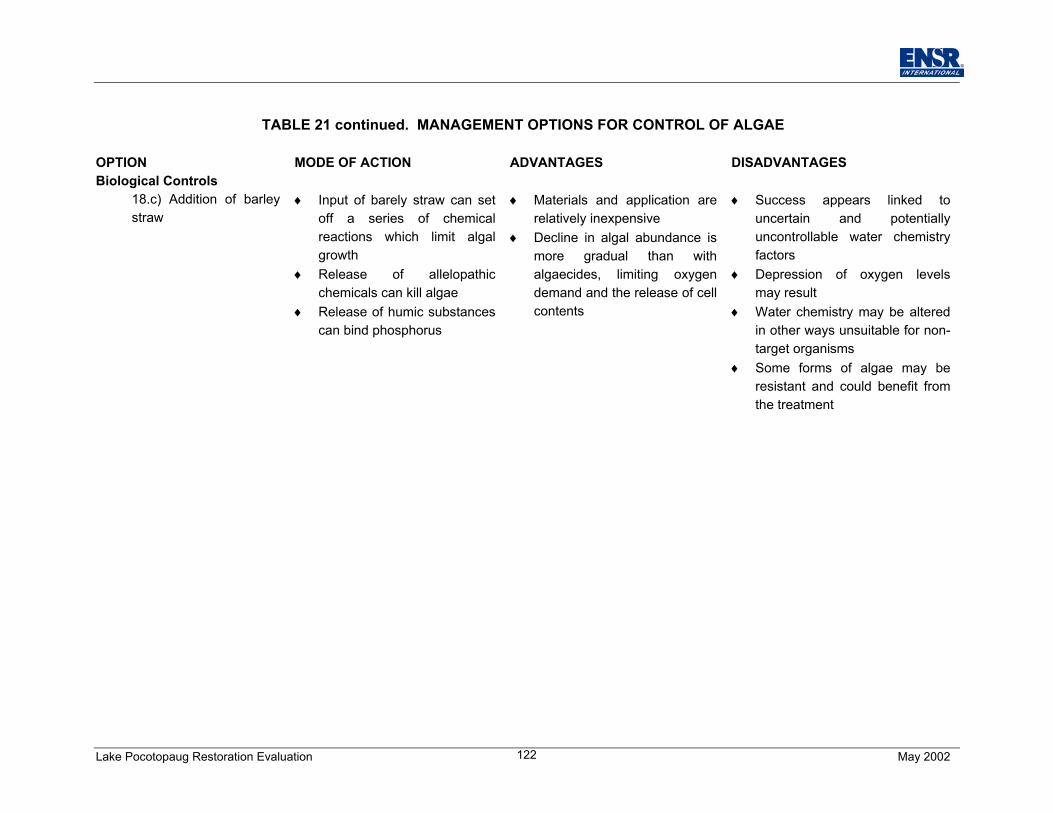
Lake Pocotopaug Restoration Evaluation May 2002122
TABLE 21 continued. MANAGEMENT OPTIONS FOR CONTROL OF ALGAE
OPTION MODE OF ACTION ADVANTAGES DISADVANTAGES Biological Controls
18.c) Addition of barleystraw
♦ Input of barely straw can setoff a series of chemicalreactions which limit algalgrowth
♦ Release of allelopathicchemicals can kill algae
♦ Release of humic substancescan bind phosphorus
♦ Materials and application arerelatively inexpensive
♦ Decline in algal abundance ismore gradual than withalgaecides, limiting oxygendemand and the release of cellcontents
♦ Success appears linked touncertain and potentiallyuncontrollable water chemistryfactors
♦ Depression of oxygen levelsmay result
♦ Water chemistry may be alteredin other ways unsuitable for non-target organisms
♦ Some forms of algae may beresistant and could benefit fromthe treatment
Lake Pocotopaug Restoration Evaluation May 2002123
ecology. Realistically, it may take 3-5 years for an observable effect to become manifest, butthis is an approach that virtually all groups can support.
Treating additional areas of the lake with alum could be considered if further testing suggeststhat such treatment would be beneficial. The 2001 water quality data indicate that hypolimneticrelease of dissolved phosphorus was very low, but only about 177 out of 512 acres have beentreated. The remaining acreage is not hypolimnetic, but may still be contributing significantly tothe phosphorus load. Inactivation may be warranted if that contribution is documented to besufficiently large.
Lake Pocotopaug Restoration Evaluation May 2002124
12.0 ADDITIONAL DATA NEEDS
Management of Lake Pocotopaug and its watershed can proceed based on what we havelearned to date, but certain aspects of this system deserve further study to allow the mosteffective management to be implemented and to answer questions that remain from work doneto date. The following additional data collection tasks are recommended:
12.1 In-Lake Monitoring
Despite the apparent need for more watershed work, continued in-lake monitoring is needed aswell to assess continued success of the alum treatment in curtailing internal recycling and toevaluate both nutrient and algal dynamics in Lake Pocotopaug. One spring sampling (April),two summer samplings (June-September), and one fall sampling (October/November) fornutrients (total and dissolved phosphorus, ammonium, nitrate and total kjeldahl nitrogen) andT/DO profile, pH and SDT are suggested. Nutrients would be sampled near the surface andbottom on each date in two locations, including the current station 2 and a new station in thesouth portion or the lake, where wind mixing and sediment resuspension are potentiallyproblematic. A depth-integrated algal sample would also be collected on each date from eachstation (surface to 2XSDT depth), and a zooplankton sample should also be collected from eachin-lake station.
12.2 Watershed Input Monitoring
More data are needed to better quantify loading from tributaries and storm drains, especially asrelates to any true first flush phenomenon and spring vs. summer inputs. We suggest targetingup to 12 locations during two storms, with sampling to include pre-storm (dry weather)conditions, the first flush, and a post-peak (waning hydrograph) period. Water quality variablesshould include total and dissolved phosphorus, ammonium, nitrate and total kjeldahl nitrogen.Flow data should be acquired if possible for each sampling as well, to allow a temporalbreakdown of loading during each storm. This sampling will allow an assessment of theimportance of early storm inputs vs. later storm and non-storm inputs, and discern any majordifferences among discharges to the lake (only limited differences are currently apparent).Sampling one storm in the spring and one in the summer will help confirm the apparent higherloading during spring. Combined with the past data, this should allow a more definitivedetermination of watershed inputs, upon which more cost-effective management plans can bebased.
12.3 Additional Algal Monitoring
In addition to the seasonal in-lake sampling noted above, algae should be sampled from twolocations in the lake at surface and mid-depth and assessed for composition and relativeabundance during November and December on a biweekly basis. The presence of anypotentially toxic forms must be noted.
Lake Pocotopaug Restoration Evaluation May 2002125
12.4 Additional Investigative Sampling
In addition to the water quality sampling program above, up to 20 samples should be allocatedfor suspected contaminants as warranted by the above investigations. This investigativesampling allowance will enable investigation of any suspicious inputs or events relating to thelake.
12.5 Algal Assays
The occurrence of blooms in Lake Pocotopaug at relatively low phosphorus levels is unusual,and the ability of ambient phytoplankton (especially the assemblage dominated by Anabaenaaphanizomenoides) to grow at successively lowered nutrient levels should be investigated. Labassays using lake water, diluted lake water, and distilled water can be run to determine thegrowth potential of Lake Pocotopaug algae. These algae may still be getting some nutritionfrom the sediments as stored reserves in the resting stages before they germinate each year, ormay just be very effective at using low ambient levels of phosphorus. This effort should be ableto determine the proper target for phosphorus in Lake Pocotopaug to prevent these blooms, andwhether additional nutrient inactivation (in other parts of the lake) is necessary.
12.6 Fish Assays
The apparent stress on fish each winter can be investigated by lab assays using lake water andtest fish under controlled laboratory conditions. Assays should be run using water from the lakeor tributaries to determine if observed effects in the lake can be duplicated in the lab. Assaysshould occur in December and possibly January, at the time of known past stress. Assaysshould include water from near the bottom of the lake and any suspicious input source.
Lake Pocotopaug Restoration Evaluation May 2002126
13.0 RECOMMENDED MANAGEMENT PROGRAM
Watershed management is the crux of controlling incoming sediment and nutrients. This shouldinclude both source controls and transport mitigation techniques, with the objective of reducinginputs to the maximum degree possible. In-lake techniques may be necessary to abate pastinputs, as with the 2001 alum treatment. Additional in-lake measures may aid achievement ofthe desired conditions, including additional alum treatment (if warranted by further investigation)and adjusting the fish community to foster larger and more zooplankton to more effectivelygraze available algae.
13.1 Source Controls
With regard to source controls, education followed by local ordinances is recommended tocurtail practices that result in unnecessary solids and nutrient releases. Paramount amongthese is lawn fertilization, demonstrated in many studies to be the most major contributor ofphosphorus from residential areas. We have a cultural problem in our society today, in thatpeople have attached status and appeal to a very green monoculture of grass around theirdwellings. This is a difficult cultural issue to address, and education about the benefits andbeauty of a more natural landscape is needed before we are likely to see a cultural shift inlandscaping preferences.
Yet even without a major shift in thinking we can make progress, as a mature lawn requiresalmost no phosphorus additions in the form of fertilizer. The use of no phosphate or at least lowphosphate fertilizer is highly desirable, and avoidance of fertilizer use on lawns where a soil testindicates no need represents a savings for both the homeowner and the lake. Additionally,application of fertilizer should be avoided prior to predicted major storms. Minimizing the area oflawn fertilized can also be helpful, leaving a peripheral buffer zone through which fertilizer mustpass with runoff before it can leave the property.
The recommended approach is first to educate town residents (not just those on the lake or inits watershed, although this is the target of this study) to their role in protecting water quality andthe town’s precious water resources, like Lake Pocotopaug. Brochures that can be placedconspicuously in public places and in homes are useful, as are public service advertisementsand programs on the local cable access network. The education effort would be followed by atown ordinance controlling fertilizer use, the key provision of which would be a required soil testto demonstrate the need for fertilizer before any application is made. Enforcement can bedifficult, and it is suggested that this ordinance be approached slowly and with as much publicinput as possible. The education phase can be instrumental in getting residents to understandand accept the desired restriction.
A review of other residential practices should be conducted to determine which of these mightalso be targets for education and regulation. Although much of the watershed is sewered,septic system maintenance is important for those with such systems, and what is good for the
Lake Pocotopaug Restoration Evaluation May 2002127
environment is generally good for the homeowner in that case (a properly functioning systemlimits impact and also reduces long-term cost). It is not clear how much yard waste disposaland vehicle washing might affect the lake in this case, but an assessment is worthwhile.
An intensive educational program for the town would be expected to cost on the order of$25,000 over perhaps two years. The cost of ordinance development and enforcement wouldbe internalized and is not easily estimated, but is not negligible.
13.2 Transport Mitigation
With regard to mitigation of the transport of pollutants to the lake, the installation of deeper andlarger catch basins as roads are re-worked, maintenance of these and existing coarse sedimentand debris traps, expansion of existing detention systems, creation of new detention systems,use of wetland features where practical, and establishment of infiltration chambers whereverpossible are all appropriate actions. Easy and relatively inexpensive practices include theinstallation of silt fences around beach locations during periods of high runoff and increasing thefrequency of street sweeping and catch basin cleaning, with emphasis on early spring cleaning.
Deciding exactly which combination of structural techniques is to be applied in each case is asite-specific matter. Making such determination goes beyond the scope of this project, but thereport filed by WMC in 1995 is an excellent start in this regard. While more emphasis on waterquality management and less focus on flood control would have been better for lakemanagement, the review of drainage systems and suggestions for improvement are largely ontarget. Be cautious of enlarging culverts, however; associated flood control benefits are beingtraded against more rapid delivery of sediment and nutrients to the lake. It would be better tolook for ways to detain the water in the watershed, providing both flood control and water qualitybenefits.
Wherever possible, infiltration should be the preferred management alternative for solids andnutrient control. This will entail some form of detention, both for initial solids settling (to avoidclogging) and to provide holding capacity where soil permeability is not extremely high. Off-linesystems are suggested as most desirable, with the first half inch of runoff as an appropriatedesign capacity. That means that for a 10 acre area, the system would have to process 18,150cubic feet (136,125 gallons) of runoff, possibly in as little as an hour. These systems can beunderground, avoiding the use of valuable or scenic surface area, but this does increase theprice.
The infiltration approach is especially recommended for areas to the east of the lake, wheresubstantial developed land is at a much higher elevation than the lake and soils appear suitablefor this approach. Areas farther from the lake to the north and west are also viable candidates,although these areas have limited development at this time. Costs are difficult to estimate at
Lake Pocotopaug Restoration Evaluation May 2002128
this point, but as a rough guide, an expense of $3000 to $5000 per acre served is offered. If theentire developed area of the watershed was treated in this manner, the cost could be as high as$2.7 million, but a much smaller area is more likely to be addressed by infiltration technologies.
Low areas and places with soils of lower permeability, such as the immediate area around thelake and substantial additional lands just west and north of the lake, will not be appropriatecandidates for infiltration. Where possible, detention and some form of wetland treatment wouldbe most desirable for these areas. This may be possible in conjunction with existing structuresin some areas, but will be limited in already developed areas close to the lake with high groundwater table. There simply is not enough room to work and existing storm water drainagesystems route water away from roads and property for public safety purposes.
Where space is adequate, the detention and wetland treatment area should be about 5% of thearea served. In other words, a 10-acre area will require a 0.5-acre detention/wetland area to betruly effective. Smaller areas will still provide some benefit, and could be enhanced withsuperior design (e.g., filter berm outlets, baffled flow), but the larger the area the better.Excluding any land costs, preparation of a detention area will cost about $100,000 per acre,each of which can handle the runoff from about 20 acres. If all developed land in the watershedwas managed through detention, the cost would be about $2.7 million, identical to the estimatedinfiltration cost.
For those areas where surface and subsurface conditions simply do not allow use of infiltrationor detention systems as described above, consideration should be given to small-scaleengineered solutions. Leaching or deep catch basins (along roads), swales (perpendicular torunoff flow on developed properties), and “artificial infiltration systems” (StormTreat,StormDefender, etc. that handle smaller volumes of runoff in an engineered container sunk intothe ground) should be considered. Again, selection of techniques may be highly site-specific.The cost per unit area served will tend to be higher than that for infiltration or detention systems,although there is room for cost saving creativity and many such systems may be designed tohandle less than the ideal amount of runoff.
13.3 In-Lake Actions
Further alum treatment may be warranted if other areas of the lake as yet untreated turn out tobe significant sources of phosphorus. Such action would not be taken, however, until additionalstudy was completed. Treatment of another 100 to 150 acres of the lake would be expected tocost on the order of $100,000 to $200,000.
Fish community adjustment is currently underway, although the stocking of walleye was notdone explicitly to reduce planktivorous panfish and increase zooplankton populations andgrazing capacity. Approximately 15,000 walleye were stocked in November 2001. It is notknown if this is an appropriate density to control panfish, and it may take a few years beforestocked walleye have any measurable impact, but further monitoring of zooplankton should be
Lake Pocotopaug Restoration Evaluation May 2002129
sufficient to detect relevant changes in zooplankton community structure. Additional stockingmay be warranted, but it seems best to monitor for at least a year before taking further action,unless consultation with CT DEP Inland Fisheries staff indicates otherwise. Cost of stocking willbe proportional to the number and size of fish stocked. The cost of fingerlings is low andgenerally affordable (<$0.50 per fish), but major impacts on biotic structure will take longer thanif larger fish (as much as $3/fish) were stocked).
The recommended additional data collection tasks (Section 12) are expected to collectively cost$50,000, including additional water quality monitoring in the lake and watershed, algal and fishmonitoring and assays, and associated analysis and reporting.
Lake Pocotopaug Restoration Evaluation May 2002130
14.0 REFERENCES
Ad Hoc Lake Advisory Committee, 1995. Land Use and Phosphorus Input to Lake Pocotopaug
Brezonik, P. 1973. Nutrient Sources and Cycling in Natural Waters. EPA 660/3-73-002.
Carlson R. E., 1977. A trophic state index for lakes. LIMNOLOGY AND OCEANOGRAPHY 22: 361-369
Carpenter S., & J. Kitchell (eds), 1993. The Trophic Cascade in Lakes. Cambridge Studies inEcology. Cambridge University Press, Cambridge, Great Britain.
Claytor R.A., & T.R. Scheuler, 1996. Design of Stormwater Filtering Systems. Center forWatershed Protection, Silver Spring, MD.
Connecticut Department of Environmental Management (1994). Landform Names.http://magic.lib.uconn.edu/
Cooke G. D., E. B. Welch, S. A. Peterson, & P. R. Newroth, 1993. Restoration andManagement of Lakes and Reservoirs, 2nd edition. Lewis Publishers, Boca Raton, FL.
Debo T.N., & A.J. Reese, 1995. Municipal Storm Water Management. CRC Press, BocaRaton, FL.
Dillon, P.J. and F.H. Rigler, 1974. The Phosphorus-Chlorophyll Relationship in Lakes.LIMNOLOGY AND OCEANOGRAPHY 19:767-773
Dynia, P.N. “Come On Inn.” Hometown Journal 08:27 (July 1999):http://www.htnp.com/vol08/issue27/0827tr~1.html
ENSR, 2001. Analysis of Phosphorus Inactivation Issues at Lake Pocotopaug, East Hampton,Connecticut.
Frink, C.R., & W.A. Norvell, 1984. Chemical and Physical Properties of Connecticut Lakes.The Connecticut Agricultural Experiment Station.
Fugro-McClelland, 1993, Diagnostic and Management Assessment of Lake Pocotopaug.
Galli J., 1990. Analysis of Urban BMP Performance and Longevity in Prince George’s County,Maryland. MWCOG, Washington, DC.
Galli J., 1992. Thermal Impacts Associated with Urbanization and Stormwater ManagementBest Management Practices. MWCOG, Washington, DC.
Gilinsky E., 1984. The role of fish predation and spatial heterogeneity in determining benthiccommunity structure. ECOLOGY 65: 455-468
Lake Pocotopaug Restoration Evaluation May 2002131
Hansen N.R., H.M. Babcock, & E.H. Clark, 1988. Controlling Nonpoint Source Water Pollution:A Citizen’s Handbook. The Conservation Foundation, Washington, DC.
Hecky R. E., & P. Kilham, 1988. Nutrient limitation of phytoplankton in freshwater and marineenvironments: a review or recent evidence on the effects of enrichment. LIMNOLOGY ANDOCEANOGRAPHY 33: 796-822
Humstone Squires Associates, 1990. Planning for Lake Water Quality Protection. VT Agency of Natural Resources, Waterbury, VT.
Jones, J.R. and R.W. Bachman, 1976. Prediction of Phosphorus and Chlorophyll Levels inLakes. JWPCF 48:2176-2184.
Kadlec R.H., and R.L. Knight, 1996. Treatment Wetlands. CRC Press, Boca Raton, FL.
Lee R. E., 1989. Phycology, 2nd edition. Cambridge University Press, Cambridge, GB.
Loomis, I.F. , 2002. The Town of Chatham. The Connecticut Magazine Vol V, June 1899, No 6,p. 303 - 319 Vol V, August 1899, p. 370 – 381.http://freepages.genealogy.rootsweb.com/~jdevlin/town_hist/chatham_ct_hist.htm
Maine Coalition of Lakes and Ponds, 1991. The Lake Book: Actions You Can Take to ProtectYour Lake. COLA, Yarmouth, ME.
Manny, B.A., W.C. Johnson and R.G. Wetzel. 1994. Nutrient additions by waterfowl to lakes andreservoirs: predicting their effects on productivity and water quality. Hydrobiol.279/280:121-132.
McPeek M. A., 1998. The consequences of changing the top predator in a food web: acomparative experimental approach. ECOLOGICAL MONOGRAPHS 68: 1-23
Mitchell D. F., 2000. Collection and evaluation of ambient nutrient data for lakes, ponds, andreservoirs in New England. Data synthesis report prepared for the NEIWPCC (Lowell,MA). ENSR document #8726-780-600, Acton, MA.
Newton R.B., 1989. The Effects of Stormwater Surface Runoff on Freshwater Wetlands.Environmental Institute, Univ. Massachusetts, Amherst, MA.
Oglesby, R.T. and W.R. Schaffner. 1978. Phosphrous Loadings to Lakes and some of theirResponses. LIMNOLOGY AND OCEANOGRAPHY. 23:135-145.
Rydin E., & E.B. Welch, 1998. Aluminum dose required to inactivate phosphate in lakesediments. WATER RESEARCH 32:2969-2976
Rydin E., & E.B. Welch, 1999. Dosing alum to Wisconsin lake sediments based on in vitroformation of aluminum bound phosphate. LAKE AND RESERVOIR MANAGEMENT 15:324-331.
Scheuler T.R., 1987. Controlling Urban Runoff: A Practical Manual for Planning and DesigningUrban BMP’s. MWCOG, Washington, DC.
Lake Pocotopaug Restoration Evaluation May 2002132
Scheuler T.R., P.A. Kumble, & M.A. Heraty, 1992. A Current Assessment of Urban BestManagement Practices. MWCOG, Washington, DC.
Tilman D., 1982. Resource Competition and Community Structure. Princeton Univ. Press,Princeton, NJ.
Umba, D. “The Secret of Lake Pocotopaug.” Hometown Journal 09:17 (April 2000):http://www.htnp.com/vol09/issue17/loc-debfish.html
United States Department of Agriculture National Resource Conservation Service. Soil Catenasof Connecticut (February 2002): http://www.ct.nrcs.usda.gov/soils/catenas.htm
United States Department of Agriculture National Resource Conservation Service (1995). Soils.http://magic.lib.uconn.edu/
Volunteer Lake Study Group, 2001. Lake Pocotopaug 2000 Sampling Results.
Volunteer Lake Study Group, 2000. Lake Pocotopaug 1999 Sampling Results.
Volunteer Lake Study Group, 1999. Lake Pocotopaug 1998 Sampling Results.
Volunteer Lake Study Group, 1998. Lake Pocotopaug 1997 Sampling Results.
Volunteer Lake Study Group, 1997. Lake Pocotopaug 1996 Sampling Results.
Volunteer Lake Study Group, 1996. Lake Pocotopaug 1995 Sampling Results.
Volunteer Lake Study Group, 1994. Lake Pocotopaug 1994 Sampling Results.
Volunteer Lake Study Group, 1992. Lake Pocotopaug Water Quality Study.
Wagner K. J., 2000. Collection, identification and control of freshwater algae. Manual for thealgal workshop held in New Haven, CT, in February 2000.
Weather Underground (2002). http://www.wunderground.com/
Wetzel R. G., 1983. Limnology, 2nd edition. Saunders College Publishing, Philadelphia, PA.
WMC Consulting Engineers, 1995. Stormwater Renovation and Management Plan for the LakePocotopaug Watershed.
Lake Pocotopaug Restoration Evaluation May 2002
Appendix A:Analysis of Phosphorus Inactivation
Lake Pocotopaug Restoration Evaluation May 2002
Appendix B:Supplemental Tables and Figures
Lake Pocotopaug Restoration Evaluation May 2002
Appendix C:WMC 1995 Stormwater Renovation
and Management Plan(not all inclusive – some appendices and figures omitted)

Lake Pocotopaug Restoration Evaluation May 2002
Appendix D:Educational Materials