bitterroot watershed restoration plan
TRANSCRIPT

0 | P a g e
2020
Bitter Root Water Forum
1/6/2020
Bitterroot Watershed Restoration Plan

1
Acknowledgements
This Watershed Restoration Plan (WRP) was developed through collaboration amongst people invested in
the conservation and restoration of the Bitterroot watershed. Special thanks to those who provided the Bitter
Root Water Forum (BRWF) invaluable input towards producing this document, including the Bitterroot
National Forest (BNF); Clark Fork Coalition (CFC); Montana Fish, Wildlife & Parks (FWP); Missoula Valley
Water Quality District (MVWQD), Missoula County, Lolo Watershed Group, Lolo National Forest (LNF), and
Trout Unlimited (TU). The members of the BRWF’s Projects Committee also deserve recognition for their
assistance in the construction and revision of the WRP. Finally, this WRP could not have been completed
without support from the Montana Department of Environmental Quality (DEQ), especially critical support
provided from Water Quality Specialist Hannah Riedl.

2
Contents
Acknowledgements .............................................................................................................................................. 0
SECTION 1: INTRODUCTION ............................................................................................................................ 4
1.1 WRP Design ................................................................................................................................................. 4
1.2 Collaboration .............................................................................................................................................. 6
1.3 Selection of Priority Streams ................................................................................................................ 6
1.4 Maps ............................................................................................................................................................... 7
SECTION 2: THE BITTERROOT WATERSHED......................................................................................... 12
SECTION 3: PRIORITY STREAMS - IMPAIRMENTS, MANAGEMENT MEASURES, LOAD REDUCTIONS, AND PROJECTS (EPA ELEMENTS #1, #2, and #3) .................................................. 14
3.1 Section Guide ........................................................................................................................................... 14
3.2 Mainstem Bitterroot River.................................................................................................................. 16
3.3 West Fork Bitterroot River ................................................................................................................. 20
3.4 East Fork Bitterroot River .................................................................................................................. 23
3.5 Cameron Creek ........................................................................................................................................ 26
3.6 Rye Creek ................................................................................................................................................... 28
3.7 Sleeping Child Creek ............................................................................................................................. 31
3.8 Skalkaho Creek ........................................................................................................................................ 34
3.9 Willow Creek ............................................................................................................................................ 36
3.10 North Burnt Fork Creek .................................................................................................................... 39
3.11 Threemile Creek ................................................................................................................................... 42
3.12 Miller Creek............................................................................................................................................ 45
3.13 Pattee Creek ........................................................................................................................................... 48
3.14 O’Brien Creek ........................................................................................................................................ 51

3
3.15 Tributaries ............................................................................................................................................. 56
SECTION 4: PROJECTS AT-A-GLANCE (EPA ELEMENTS #6 AND 7) .............................................. 57
4.1 Implementation Schedule For BRWF’s Past and Upcoming Projects ................................ 58
4.2 Projects At-A-Glance: Upcoming Measurable Milestones ...................................................... 59
SECTION 5: IMPLEMENTATION ASSISTANCE (EPA ELEMENT #4) .............................................. 60
5.1 Technical Assistance ............................................................................................................................. 60
5.2 Financial Assistance .............................................................................................................................. 61
SECTION 6: EDUCATION AND OUTREACH (EPA ELEMENT #5) ..................................................... 63
SECTION 7: MONITORING AND EVALUATION (EPA Element #8, #9) .......................................... 65
7.1 Monitoring ................................................................................................................................................ 65
7.2 Criteria For Determining Success .................................................................................................... 69
APPENDIX A: O’BRIEN CREEK DATA ......................................................................................................... 70
APPENDIX B: GLOSSARY OF TERMS AND ABBREVIATIONS ............................................................ 86

4
SECTION 1: INTRODUCTION The Bitterroot watershed covers nearly 3,000 square miles in western Montana’s Rocky Mountains. For the area’s more than 40,000 residents, the economy and the quality of life in the Bitterroot Valley depend on ensuring a healthy watershed that will always provide clean, abundant water and healthy wildlife habitats.1 This, in turn, requires monitoring, protecting, and improving water quality and quantity. The Bitter Root Water Forum (BRWF) was established in 1993 as an educational and discussion forum for all water users in the Bitterroot watershed, from farmers to anglers. We have since evolved into a collaborative watershed group dedicated to ensuring clean water for future generations.
We are working for the day when:
Residents and visitors appreciate how integral the Bitterroot River is to the valley’s social, ecological, and economic well-being and make caring for and protecting the river a top priority.
Urban and rural neighbors work together, using science and local wisdom, to proactively and continually maintain and improve water quality in our watershed.
The Bitterroot River system continues to provide for diverse uses while achieving its potential as a world-class fishery and top-quality aquatic habitat.
BRWF produced this Watershed Restoration Plan (WRP) to coordinate watershed restoration efforts amongst other partners (Section 1.2) and implement the steps necessary to sustain future restoration projects and long-term education. This WRP is based upon the principles established by our founders in 1993 and reflects our continued commitment to restore and protect the Bitterroot watershed through education and restoration projects. We honor our traditional goals of bringing people together to understand our watershed while striving to preserve our aquatic habitats and resources.
1.1 WRP Design
Under the 1987 amendments to the Federal Clean Water Act, Section 319, the U.S. Environmental Protection Agency (EPA) provides funding to states to mitigate nonpoint source (NPS) pollution (i.e., pollution arising from diffuse sources such as land runoff, precipitation, atmospheric deposition, drainage, seepage, or manmade changes to natural water flow). Consistent with BRWF’s founding dedication to a science-based approach, the data in the following documents provided much of the information used to guide the development of this WRP:
● Total Maximum Daily Load (TMDL) documents prepared by the Montana Department of
Environmental Quality (DEQ);
● Bitterroot Subbasin Plan for Fish & Wildlife Conservation (Subbasin Plan);
● 2018 Integrated Report (IR) on Montana impaired waterbodies;
● Other planning and report documents for the Bitterroot watershed.
In 2012 and 2019, BRWF received Section 319 funds from DEQ to produce and update this WRP. EPA lists nine key elements critical for achieving water quality improvements and which must be included in all WRPs supported with Section 319 funding. The elements are listed below and are therefore included in this WRP.
1 Clark Fork Coalition. 2017 Bitterroot Watershed Strategy. Web.

5
NINE MINIMUM ELEMENTS OF AN EPA WATERSHED RESTORATION PLAN2
1. Identification of causes of impairment and pollutant sources or groups of similar sources that need to be controlled to achieve needed load reductions, and any other goals identified in the watershed plan. (Section 3)
2. An estimate of the load reductions expected from management measures. (Section 3)
3. A description of the nonpoint source management measures that will need to be implemented to achieve load reductions in number 2, and a description of the critical areas in which those measures will be needed to implement this plan. (Section 3)
4. Estimate of the amounts of technical and financial assistance needed, associated costs, and/or the sources and authorities that will be relied upon to implement this plan. (Section 5)
5. An information and education component used to enhance public understanding of the project and encourage their early and continued participation in selecting, designing, and implementing the nonpoint source management measures that will be implemented. (Section 6)
6. Schedule for implementing the nonpoint source management measures identified in this plan that is reasonably expeditious. (Section 4)
7. A description of interim measurable milestones for determining whether nonpoint source management measures or other control actions are being implemented. (Section 4)
8. A set of criteria that can be used to determine whether loading reductions are being achieved over time and substantial progress is being made toward attaining water quality standards. (Section 7)
9. A monitoring component to evaluate the effectiveness of the implementation efforts over time, measured against the criteria established under item 8 immediately above. (Section 7)
Figure 1: US EPA’s Nine Minimum Elements of a Watershed Restoration Plan
This WRP provides a broad overview of how BRWF and partners hope to address water quality concerns in the Bitterroot watershed. For each priority subwatershed, the following information is provided:
1. Description of the subwatershed and its need for restoration and education; 2. Stream impairment information per DEQ TMDL reports (Element #1); 3. Necessary pollutant reduction loads per DEQ TMDL reports (Element #2); 4. Potential restoration activities and their associated benefits (Element #3); 5. Descriptions of completed, ongoing, and planned restoration projects.
These sections are followed by descriptions of:
1. Restoration milestones and schedule for the coming years (Element #6 and Element #7); 2. The technical and financial assistance needed to accomplish these goals (Element #4); 3. Education and outreach activities associated with these projects (Element #5); 4. Monitoring and evaluation criteria (Element #8 and Element #9).
The BRWF maintains a five-year work plan to guide project efforts which is reviewed and updated annually. The first edition of the WRP was produced in 2014 and we will continue to update it on a five-year cycle to include new information, completed restoration actions, and future plans. We hope this
2 US Environmental Protection Agency. Introduction to Watershed Planning. Web.
6
structure and format will create a user-friendly guide to restoration efforts in the Bitterroot watershed for years to come.
1.2 Collaboration
While BRWF was a lead organization in drafting the WRP, some of the restoration actions and projects addressed in this plan will be completed by other partners and organizations working in the Bitterroot watershed. In an effort to embrace local knowledge and include priorities beyond those of BRWF, we invited interested parties to assist in developing the WRP. These stakeholders included:
Bitterroot National Forest Clark Fork Coalition Montana Fish, Wildlife & Parks Trout Unlimited Missoula Valley Water Quality District Missoula County Ravalli County Bitterroot Conservation District Missoula Conservation District Lolo Watershed Group Lolo National Forest
Stakeholders offered information regarding current and aspirational projects, restoration opportunities, and plans within the watershed. This WRP is therefore reflective of the priorities of the BRWF as well as our partners working in the basin.
1.3 Selection of Priority Streams
The purpose of the WRP is to develop a strategic and achievable approach to restoration and education efforts. In order to do this, BRWF and stakeholders selected priority areas of focus within the Bitterroot watershed. While the process of choosing priority areas was influenced heavily by TMDL reports and recommendations from the Subbasin Plan, social aspects and historical context were also considered. Key questions included:
Which streams have been most severely impacted by NPS pollutants? Is there currently momentum toward restoration in the subwatershed? Do any partners have connections and relationships with landowners in the area? What conservation efforts have landowners historically engaged in and how can we further educate
about opportunities for restoration?
By collectively discussing organizational priorities and initiatives, we were able to uncover overlapping priorities and streams of interest; In turn, 13 priority streams in the Bitterroot watershed were identified which will be the focus of this plan and of restoration efforts for the next 5 years.3
3 WRPs specific to Lolo Creek and Miller Creek have been produced by partner organizations. While these streams are of priority in
the Bitterroot Watershed, they are not discussed at length in this WRP. Miller Creek is included as a priority stream in this WRP as well because it is a project focus for the co-authors of this WRP, including the Bitter Root Water Forum and Clark Fork Coalition.

7
1.4 Maps
The following maps represent the subbasins encapsulated by the priority streams listed in section 3 of this document. Further, these maps indicate the locations of impaired waters identified by DEQ in the Bitterroot and Bitterroot Headwaters TMDL planning areas.4 5 The four most common probable causes of impairments in the Bitterroot watershed are sedimentation/siltation, nutrients (including phosphorus, nitrogen, chlorophyll-a, nitrate, and nitrite), temperature, and flow regime modification. Accordingly, the geographic reaches that each of these causes affects is explored in the following maps.
Figure 2: Priority subbasins in the Bitterroot watershed as described in this WRP.
4 Montana Department of Environmental Quality. Final 2018 Water Quality Integrated Report Appendix A: Impaired Waters. Helena: Montana. Department of Environmental Quality [2018]. Web. 5 Streams in the Lolo watershed (Lolo Creek and Lolo Headwaters planning area) are not included. Please see the Lolo WRP for further information on these streams.

8
Figure 3: Streams impaired by flow regime modifications.

9
Figure 4: Streams impaired due to nutrient levels.

10
Figure 5: Streams impaired due to temperature.

11
Figure 6: Streams impaired due to sediment levels.

12
SECTION 2: THE BITTERROOT WATERSHED
Located in the Rocky Mountains of western Montana, the Bitterroot watershed encompasses 2,899 square miles. It is bordered by the crest of the Bitterroot Mountains to the west, the crest of the Sapphire Mountains to the east, the headwaters of the Bitterroot River to the south at Lost Trail Pass on the Idaho–Montana border, and the confluence of the Bitterroot River with the Clark Fork River to the north in Missoula County. The watershed is contained within Ravalli County, with just a small portion of its northern boundary falling within southern Missoula County. The Bitterroot watershed is characterized by a wide valley and meandering river channel with riparian forest and floodplain. The watershed includes high, glaciated mountains with alpine ridges at higher elevations and glacial and lake basins at lower elevations. Elevations range from 10,131 feet at Trapper Peak in the Bitterroot Mountain Range to 3,120 feet on the valley floor. 6 The Bitterroot watershed is complex for a number of reasons:
1. Tributaries – While most recreational use occurs on the Bitterroot Mainstem, its many tributaries provide flow and spawning habitat. Because of these many tributaries, the Bitterroot watershed is a complex system with many opportunities for degradation and improvement.
2. Climate – The Bitterroot Valley is arid, receiving 12 inches of rainfall per year, though as much as 100 inches falls in the surrounding mountain ranges. Rivers in the watershed are snowmelt dominated systems that experience large changes in flow rates from season to season.7
3. Irrigation – Established in the late 1800s, the primary irrigation systems of the valley are comprised of several irrigation districts managing large canal systems. These are some of the oldest, largest and most complex irrigation systems in Montana. Due to the dry climate in the valley bottom, this system is crucial to sustaining the economy and lifestyles of Bitterroot Valley residents, as it disperses the high mountain rainfall throughout the valley and the dry summer. However, this system contributes to the dewatering and altered flows of streams in the watershed.8
4. Land Ownership and Land Use – The valley bottom of the Bitterroot is generally privately owned for residential or agricultural use. The irrigation system supported early subdivision of lands into small agricultural parcels, setting the stage for fragmentation of private lands. Conversely, most high-elevation, headwater areas are public land with relatively intact habitat; ownership includes the U.S. Forest Service and state of Montana.9
5. Demographics – High growth rates and corresponding demographic trends have shifted the economics of Ravalli County to less of an emphasis on traditional agriculture and timber industries.10 In addition, a portion of the watershed lies within Missoula County as well as the city of Missoula. Between 2010 and 2018, Ravalli County’s population increased by 7.4% and Missoula County’s at 8.7%, making these two of the fastest-growing counties in Montana.11
6. Recreation – The Bitterroot valley is a highly popular fishing destination, regularly ranking in the Top 5 statewide. In the 2017-2018 license year, the Bitterroot Mainstem supported 102,388 angler days, 41% of which were non-resident;12 this industry is an important piece of the Bitterroot Valley’s economy.
7. Fire - In recent decades the watershed has experienced several extremely large and/or high intensity fires, including in 1996, 2000, 2013, and 2017. While fire is a natural force in the area, it can
6 Clark Fork Coalition. 2017 Bitterroot Watershed Strategy. Web. 7 Montana Department of Natural Resources and Conservation. Habitat Conservation Plan. Web. 8 Clark Fork Coalition. 2017 Bitterroot Watershed Strategy. Web. 9 Oberbillig, Deborah Richie. Taking Care of the Bitterroot Watershed. Bitter Root Resource Conservation and Development Area, Inc. 2005. Print. p .5 10 Oberbillig, Deborah Richie. Taking Care of the Bitterroot Watershed. Bitter Root Resource Conservation and Development Area, Inc. 2005. Print. p .4 11 United States Census Bureau. QuickFacts. Web. 12 Montana Fish Wildlife and Parks (FWP). Angler Pressure Survey Summary [2018] Accessed online at: http://fwp.mt.gov/fwpDoc.html?id=91831

13
contribute large amounts of sediment to water bodies, and the response of the watershed to the fire depends on its health beforehand.13
Figure 7: View of high glaciated mountains with alpine ridges and lower elevation lake basin from above Tin Cup
Lake/Reservoir. Tin Cup Lake is a natural lake that has become much larger in size because it has been dammed
for water storage.14
13 Oberbillig, Deborah Richie. Taking Care of the Bitterroot Watershed. Bitter Root Resource Conservation and Development Area, Inc.
2005. Print. pp. 18-19.
14 Photo courtesy of M. Hoyt, 2011

14
SECTION 3: PRIORITY STREAMS - IMPAIRMENTS, MANAGEMENT MEASURES, LOAD REDUCTIONS, AND PROJECTS (EPA ELEMENTS #1, #2, and #3)
3.1 Section Guide
The following chapters are dedicated to each of the Priority Streams in the Bitterroot; the components below are provided in each Priority Stream chapter.
Description15
A brief background of the Priority Stream is provided, including information such as location, fluvial processes, and significance to human and wildlife populations.
Stream Impairments16
Every 2 years per federal requirements, DEQ compiles the Integrated Report (IR), which includes a list of waterbodies that are failing to meet water quality standards. Known as the 303(d) list, it identifies water bodies throughout Montana whose beneficial uses are impaired. 39 impaired streams in the Bitterroot watershed are included in the 2018 IR. Not all streams in the Bitterroot watershed have been studied by the DEQ and are thus not classified as impaired by definition. However, the restoration needs of these streams are still considered as they may be contributing pollutants to higher-order, officially impaired rivers downstream.17 13 streams (10 of which are included on the 303(d) list), were chosen as priority streams to be the focus of restoration efforts as detailed in this WRP.
The IR includes information on the causes of impairment for a stream, and on the probable sources of pollutants. A TMDL is the maximum amount of a pollutant allowed to enter a waterbody so that it can still meet its water quality standards. Each of the 13 priority streams in this WRP is a stream of concern for one or more of the following pollutants:
Sedimentation/siltation Temperature Alteration in stream-side or littoral vegetative covers Flow regime modification Phosphorus, total Nitrogen, total Nitrate/Nitrite (Nitrite + Nitrate as N) Physical substrate habitat alterations Lead Aluminum Fish passage barrier Chlorophyll-a
The two most common problems among priority streams in the Bitterroot watershed are increased sediment and temperature, followed by alterations in streamside or littoral vegetative cover. The “Stream Impairments” sections of the WRP lists specific problems and contributing factors for each priority subwatershed. Also included is a chart highlighting the pollutant category, affected beneficial uses, and status of the TMDL.
15 Stream description information is derived from: Montana Department of Environmental Quality. Bitterroot Temperature and
Tributary Sediment Total Maximum Daily Loads and Framework Water Quality Improvement Plan. Helena:Montana. Department of Environmental Quality [2011]. Web.
16All stream impairment tables are derived from: Montana Department of Environmental Quality. Final 2018 Water Quality Integrated
Report Appendix A: Impaired Waters. Helena: Montana. Department of Environmental Quality [2018]. Web.
17 Jakober, Michael J. CameronBlue Ecoburn: Biological Assessment and Evaluation. [Sula, MT] U.S. Forest Service, Bitterroot National
Forest [2011].
15
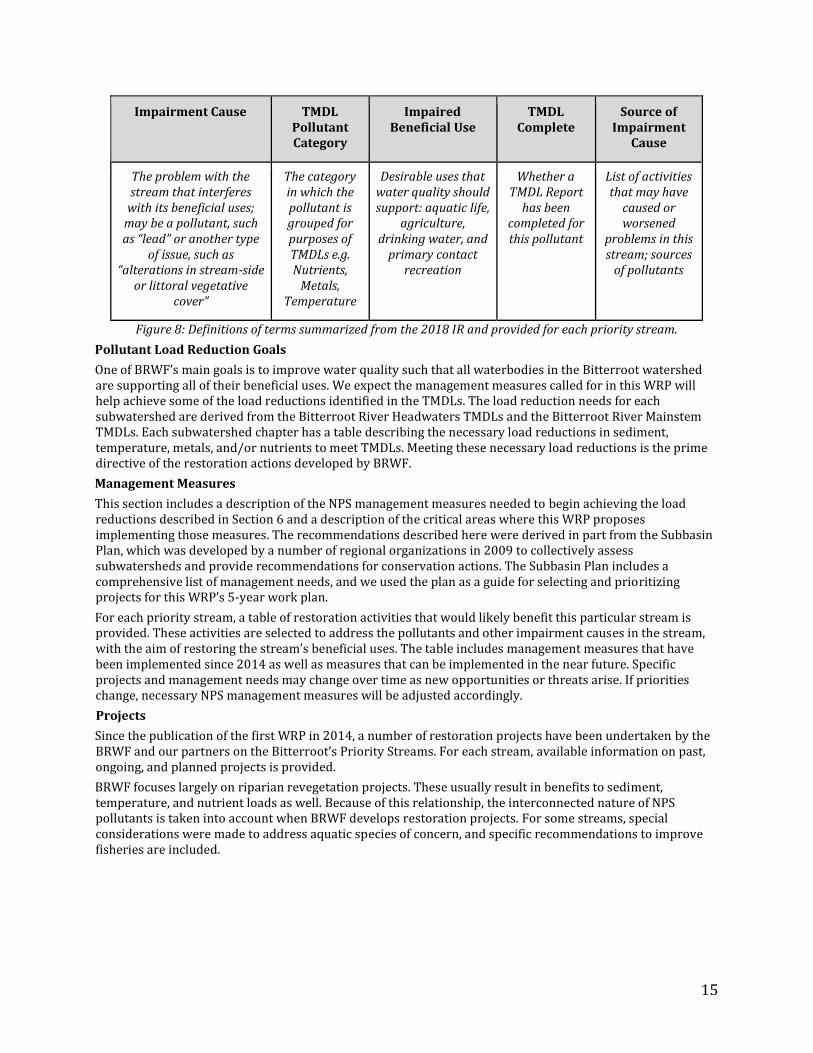
Impairment Cause TMDL Pollutant Category
Impaired Beneficial Use
TMDL Complete
Source of Impairment
Cause
The problem with the stream that interferes
with its beneficial uses; may be a pollutant, such as “lead” or another type
of issue, such as “alterations in stream-side
or littoral vegetative cover”
The category in which the pollutant is grouped for purposes of TMDLs e.g. Nutrients,
Metals, Temperature
Desirable uses that water quality should support: aquatic life,
agriculture, drinking water, and
primary contact recreation
Whether a TMDL Report
has been completed for this pollutant
List of activities that may have
caused or worsened
problems in this stream; sources
of pollutants
Figure 8: Definitions of terms summarized from the 2018 IR and provided for each priority stream.
Pollutant Load Reduction Goals
One of BRWF’s main goals is to improve water quality such that all waterbodies in the Bitterroot watershed are supporting all of their beneficial uses. We expect the management measures called for in this WRP will help achieve some of the load reductions identified in the TMDLs. The load reduction needs for each subwatershed are derived from the Bitterroot River Headwaters TMDLs and the Bitterroot River Mainstem TMDLs. Each subwatershed chapter has a table describing the necessary load reductions in sediment, temperature, metals, and/or nutrients to meet TMDLs. Meeting these necessary load reductions is the prime directive of the restoration actions developed by BRWF.
Management Measures
This section includes a description of the NPS management measures needed to begin achieving the load reductions described in Section 6 and a description of the critical areas where this WRP proposes implementing those measures. The recommendations described here were derived in part from the Subbasin Plan, which was developed by a number of regional organizations in 2009 to collectively assess subwatersheds and provide recommendations for conservation actions. The Subbasin Plan includes a comprehensive list of management needs, and we used the plan as a guide for selecting and prioritizing projects for this WRP’s 5-year work plan.
For each priority stream, a table of restoration activities that would likely benefit this particular stream is provided. These activities are selected to address the pollutants and other impairment causes in the stream, with the aim of restoring the stream’s beneficial uses. The table includes management measures that have been implemented since 2014 as well as measures that can be implemented in the near future. Specific projects and management needs may change over time as new opportunities or threats arise. If priorities change, necessary NPS management measures will be adjusted accordingly.
Projects
Since the publication of the first WRP in 2014, a number of restoration projects have been undertaken by the BRWF and our partners on the Bitterroot’s Priority Streams. For each stream, available information on past, ongoing, and planned projects is provided.
BRWF focuses largely on riparian revegetation projects. These usually result in benefits to sediment, temperature, and nutrient loads as well. Because of this relationship, the interconnected nature of NPS pollutants is taken into account when BRWF develops restoration projects. For some streams, special considerations were made to address aquatic species of concern, and specific recommendations to improve fisheries are included.

16
3.2 Mainstem Bitterroot River
Description
The mainstem Bitterroot River stretches over 80 miles, from the confluence of the East and West Forks near
Darby, northward to Missoula where it enters the Clark Fork River. It is the largest tributary to the Middle
Clark Fork River. While restoration actions generally focus on tributaries rather than the mainstem, the River
carries the cumulative impacts of all Bitterroot watershed streams, both in terms of impairments and
improvements. The mainstem Bitterroot was specifically included because of growing concerns about
nutrient exceedances in the lower reach. The DEQ’s TMDL documents divide the Bitterroot River into the
following reaches:
1. Upper Mainstem Bitterroot River: Stretching from the confluence of the East West Forks near
Darby to the mouth Skalkaho Creek, just south of Hamilton, the upper portion of the Bitterroot River
flows roughly 25 miles through the southern part of the Bitterroot Valley in Ravalli County. The
relative narrowness of valley in this reach leaves less room for agriculture and development. This
upper portion of the river is home to an important stronghold of native Westslope Cutthroat trout as
well as Bull trout, which use the Bitterroot mainstem as valuable summer and over-wintering habitat
and access the tributaries and forks when spawning.
2. Middle Mainstem Bitterroot River: The middle reach of the Bitterroot River flows approximately
27 miles across the broad valley floor from Skalkaho Creek near Hamilton to Eightmile Creek near
Florence. As the valley widens, the river becomes more dynamic with relic channels, oxbows and
regular lateral migration during flood events. The shifting nature of the river is often in conflict with
agricultural and residential use in the valley. This has led to efforts to stabilize banks (often with rip
rap) and straighten the river, greatly altering its natural profile and function. The Middle Mainstem is
also the most severely dewatered section of the Bitterroot, specifically the 17 miles between
Corvallis and Stevensville (before groundwater and irrigation returns begin to increase flows in the
River).18 Although target flows for Painted Rocks Reservoir releases are set for 400 CFS at Bell
Crossing, this location regularly drops to 200 CFS during dry years. The middle section of the
Bitterroot River is still home to native populations of Cutthroat and small numbers of Bull Trout,
while continuing to provide valuable over-wintering habitat. However, non-native trout become
most prevalent in this stretch and further downstream.
3. Lower Mainstem Bitterroot River: Continuing northward, the lower reach of the Bitterroot River
flows from Florence to its mouth at the Clark Fork River in Missoula County, just west of Missoula.
Carrying water that originated above 10,000 feet elevation in the Bitterroot Mountains, the mouth of
the Bitterroot River enters the Clark Fork River at approximately 3,100 feet elevation, with an
average peak runoff of roughly 8,000 CFS and a base flow of roughly 1,000 CFS. The broad lower
section of the river continues to meander through agricultural lands and faces many of the same
alterations to flow, temperature, and riparian vegetation faced farther upstream. The lower river is
dominated by non-native trout species. The lower river additionally faces development-related
impacts as it flows through the Missoula metropolitan area. For example, winter road maintenance
and stormwater runoff contribute sand and chloride ions into the river. Further, heavy streamside
development is of particular concern to channel migration, which is part of the river’s natural
function.
18 Montana Fish Wildlife and Parks. FWP Dewatering Concern Areas, Revised. Montana FWP [2005]. Web.

17
Stream Impairments19
Stream Section
Impairment Cause
TMDL Pollutant Category
Impaired Beneficial
Use
TMDL Complete
Source of Impairment Cause
Upper Bitterroot River (confluence of East and West Forks to Skalkaho Creek)
Alteration in stream-side
or littoral vegetative
covers
N/A; non-pollutant
Aquatic Life
N/A Grazing in Riparian or Shoreline Zones Rangeland grazing Streambank modification/destabilization
Middle Bitterroot River (Skalkaho Creek to Eightmile Creek)
Flow Regime Modification
N/A; non-pollutant
Aquatic Life
N/A Agriculture Crop production (irrigated)
Temperature Temperature Aquatic Life
Yes Agriculture Wet weather discharges (NPS)
Lower
Bitterroot
River
(Eightmile
Creek to
mouth at
Clark Fork
River)20
Alteration in
stream-side
or littoral
vegetative
covers
N/A; non-
pollutant
Aquatic
Life
N/A Rangeland grazing Wet weather discharges (point source, stormwater, SSO, CSO)
Lead Metals Aquatic
Life
Yes Source unknown
Temperature Temperature Aquatic
Life Yes Agriculture
Wet weather discharges (NPS)
19Montana Department of Environmental Quality. Final 2018 Water Quality Integrated Report Appendix A: Impaired Waters. Helena:
Montana. Department of Environmental Quality [2018]. Web.
20 In 2013, the Lower Bitterroot River was delisted for Nitrogen (Nitrate) based on “Applicable WQS [water quality standards] attained; According to new assessment method” (DEQ 2013). However, nutrient levels remain high in this reach and remain a concern for agencies and partners working in the valley.
18
TMDLs and Load Reductions
Temperature21
The temperature TMDL is based off compliance with Montana’s water quality standards. For B-1 waters, the beneficial use type that the Bitterroot is classified as, that standard is defined as “the maximum allowable increase over the naturally occurring temperature is 1*F if the naturally occurring temperature is less than 66*F. Within the naturally occurring temperature range of 66 to 66.5 °F, the allowable increase cannot exceed 67°F. If the naturally occurring temperature is greater than 66.5°F, the maximum allowable increase is 0.5° F”. To achieve the temperature target in the Middle and Lower segments of the Bitterroot River, the TMDL recommends several linkages to temperature be addressed: riparian and stream channel conditions, headwater and tributary thermal influence, wastewater influences, and irrigation withdrawals and return flows. The linkages that this Watershed Restoration Plan will focus on are covered in more detail below.
Riparian and stream channel conditions: The TMDL recommends increasing effective shade in the middle and lower Bitterroot River by 0.5%. It also recommends no increase in channel width.
Tributary temperature: The TMDL recommends a focus on reducing instream temperatures in East Fork and West Fork Bitterroot Rivers, Hayes, Threemile, Kootenai, McClain, and Tin Cup Creeks. See Sections 3.3, 3.4, and 3.11 in this WRP for management measures this WRP recommends implementing in the East Fork, West Fork, and Threemile Creek.
Irrigation water: The TMDL recommends a 15% increase in irrigation withdraw efficiency during mid-June through August, and a reduction in volume of warm water returned by 75%.
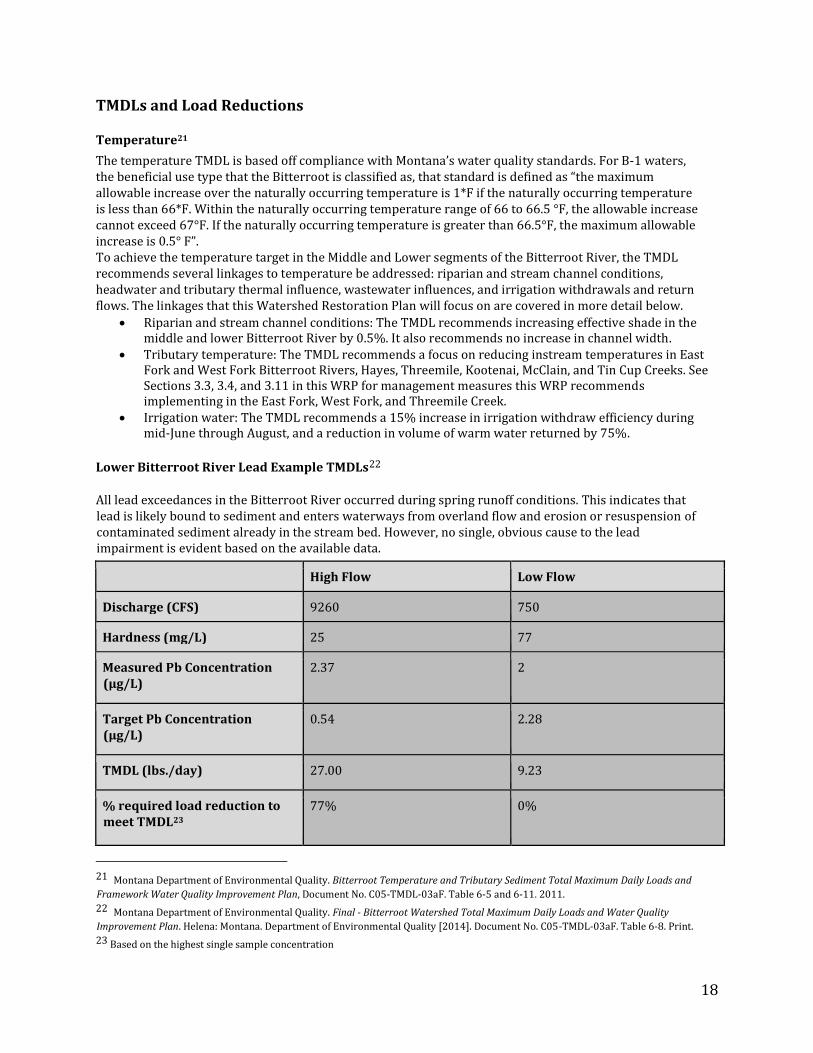
Lower Bitterroot River Lead Example TMDLs22
All lead exceedances in the Bitterroot River occurred during spring runoff conditions. This indicates that lead is likely bound to sediment and enters waterways from overland flow and erosion or resuspension of contaminated sediment already in the stream bed. However, no single, obvious cause to the lead impairment is evident based on the available data.
High Flow Low Flow
Discharge (CFS) 9260 750
Hardness (mg/L) 25 77
Measured Pb Concentration (μg/L)
2.37 2
Target Pb Concentration (μg/L)
0.54 2.28
TMDL (lbs./day) 27.00 9.23
% required load reduction to meet TMDL23
77% 0%
21 Montana Department of Environmental Quality. Bitterroot Temperature and Tributary Sediment Total Maximum Daily Loads and
Framework Water Quality Improvement Plan, Document No. C05-TMDL-03aF. Table 6-5 and 6-11. 2011.
22 Montana Department of Environmental Quality. Final - Bitterroot Watershed Total Maximum Daily Loads and Water Quality
Improvement Plan. Helena: Montana. Department of Environmental Quality [2014]. Document No. C05-TMDL-03aF. Table 6-8. Print. 23 Based on the highest single sample concentration

19
Management Measures
Management measures for temperature will focus on restoring shade and instream flow in temperature-limited tributaries to the Bitterroot River, and within the Bitterroot River corridor itself. This includes targeted riparian fencing and planting, irrigation efficiency projects and potentially instream flow transactions. BRWF and partners do not have immediate plans to address lead exceedances in the Bitterroot River. However, we recognize that with increased development in the Bitterroot Valley and increased monitoring, projects related to either metals or nutrients may become a priority. We will continue to work with the DEQ and other water quality monitoring programs to assess and address impairments in the river as they arise.
Projects
Restoration activities on the Bitterroot River will focus on riparian revegetation and public outreach and
educational opportunities. We will continue primarily focusing on efforts to improve water quality in
tributaries flowing into the River.
In 2019, BRWF and FWP began a streambank revegetation project at the heavily-trafficked Stevensville Fishing Access Site in the Middle Bitterroot River. This project is anticipated to reduce water temperature and benefit aquatic life due to increased riparian shading. DEQ has provided $15,000 in support of this project.
Beginning in 2020, BRWF will complete a streambank stabilization and revegetation project on the Middle Bitterroot River at the new Skalkaho Bend Park in Hamilton. This project is anticipated to reduce water temperature and benefit aquatic life due to increased riparian shading. DEQ has provided $123,000 in support of this project.
Instream flow leases are some of the most challenging, but potentially impactful projects to address water quality. Trout Unlimited and the Clark Fork Coalition are actively perusing instream flow projects in streams with severe flow alterations and/or priority fisheries. Numerous water leasing projects have reduced irrigation withdrawal impacts to Bitterroot tributaries such as Tin Cup Creek, Lost Horse Creek and O’Brien Creek. The Painted Rocks Reservoir water share managed by FWP has also notably improved Bitterroot River temperatures and flows.
BRWF hosts annual irrigation tours to promote public understanding of the Valley’s irrigation system. These tours typically cover reservoirs, irrigation diversions, fish screens, and agricultural applications of irrigation.

20
3.3 West Fork Bitterroot River
Description
The West Fork Bitterroot River is one of the largest waterbodies entering the Bitterroot River, with a
drainage area of over 550 square miles. One of the most notable features of the West Fork Bitterroot River is
Painted Rocks Dam, and its 32,362 acre-foot reservoir, owned by the Department of Natural Resources and
Conservation. 10,000 acre-feet of this stored water is leased for irrigation while 25,000 acre-feet is marketed
to Fish Wildlife and Parks and released to support instream flow in the Bitterroot River. The dam has served
as a barrier to some non-native fish, making the upper West Fork one of the most valuable native fish
resources in the Bitterroot. Roads, bank instability, fish passage, and historic mining are the primary impacts
to the upper watershed, above Painted Rocks, and will be the focus of restoration activities, both on the West
Fork and its tributaries. In the lower West Fork, restoration activities will focus on reducing the impact of the
Nez Perce road to the Nez Perce Fork.
Stream Impairments24 25
Impairment
Cause
TMDL
Pollutant
Category
Impaired
Beneficial
Use
TMDL
Complete
Source of Impairment Cause
Physical
substrate
habitat
alterations
N/A; non-
pollutant
Aquatic
Life
N/A Highway/road/bridge runoff (non-
construction related)
Highways, Roads, Bridges,
Infrastructure (New Construction)
Streambank Modifications/
destabilization
Sedimentation
/ Siltation
Sediment Aquatic
Life
Yes Highways, Roads, Bridges, Infrastructure (New Construction) Streambank Modifications- destabilization
Highway-Road-Bridge Runoff (Non-construction Related)
Temperature Temperature Aquatic
Life
Yes Not identified
24 Montana Department of Environmental Quality. Final 2018 Water Quality Integrated Report Appendix A: Impaired Waters. Helena:
Montana. Department of Environmental Quality [2018]. Web. 25 Several tributaries to the West Fork are also impaired and may be the focus of future restoration work. These include the Nez
Perce Fork (Temperature), Hughes Creek (Alteration in stream-side or littoral vegetative covers; Physical substrate habitat alterations; Sedimentation/Siltation; Temperature), Overwhich Creek (Temperature), Ditch Creek (Sedimentation/Siltation) and Buck Creek (Sedimentation/Siltation).

21
TMDLs and Load Reductions
Sediment
West Fork Bitterroot River sediment loads are largely natural or derive from fires of 2000. Human-caused sediment loading is primarily linked to forest roads and eroding banks. A 57% decrease in sediment from
forest roads is necessary, as is a 75% decrease in loads from human-caused bank erosion.26 Sediment
exceedances also occur in West Fork tributaries such as Ditch Creek (due to forest roads and silvicultural harvest), Hughes Creek (due to mining and channelization), and Buck Creek (no listed source).27
Temperature
The TMDL on the West Fork Bitterroot River used existing and potential shade to establish the water quality temperature goals and target. Therefore, effective shade is used as a “surrogate” measure of the temperature load reduction required to meet water quality standards. On the West Fork Bitterroot River, the majority of shade loss originates from main roads and secondary roads, and the TMDL recommends 45% effective shade to achieve the TMDL.28 Relatively little riparian cover exists on the stretch between Deer and Hughes Creeks, making this area an opportune location for revegetation efforts.29 Temperature exceedances also occur in tributaries, including the Nez Perce Fork (due to forest roads and loss of riparian habitat), Hughes Creek (due to mining and channelization), and Overwhich Creek (due to site clearing).30
Management Measures
Management measures in the West Fork will focus on reducing road-stream interaction, with potential reductions of both temperature and sediment loading. Long-term, historic mining impacts should be addressed through partnership with private landowners.
Projects
Restoration activities will focus on improving the quality and connectivity of habitat for native fish.
Trout Unlimited is working with the Bitterroot National Forest (BNF), FWP and Bitterroot
Conservation District to improve fish passage and reduce fish entrainment in ditches in the upper
West Fork through diversion upgrades and fish screen installations. This effort is based on a 2017
inventory of irrigation diversions in priority Bull Trout streams. Project prioritization was based on
potential benefits to native species, cost and landowner/water user willingness. These projects with
private irrigators may also create opportunities for riparian restoration on private lands.
Trout Unlimited has initiated early conversations with the Forest Service about reducing sediment
and temperature loading along Nez Perce Road.
Bitterroot National Forest actively restored mining impacts on now-public land along Hughes Creek.
Eventually, this restoration should also occur on private lands, but will require buy-in from private
landowners.
26 Montana Department of Environmental Quality. Water Quality Restoration Plan and Total Maximum Daily Loads for the Bitterroot
Headwaters Planning Area. 2005. Table 4-31. 27 Montana Department of Environmental Quality. Final 2018 Water Quality Integrated Report Appendix A: Impaired Waters. Helena: Montana. Department of Environmental Quality [2018]. Web. 28 Montana Department of Environmental Quality. Water Quality Restoration Plan and Total Maximum Daily Loads for the Bitterroot Headwaters Planning Area. 2005. Table 5-14 and 5-15. 29 Montana DEQ Watershed Protection Section. “Riparian Evaluation and Wetland Priorities Results.” June 2019. 30 Montana Department of Environmental Quality. Final 2018 Water Quality Integrated Report Appendix A: Impaired Waters. Helena: Montana. Department of Environmental Quality [2018]. Web.

22
Between 2008 and 2010, the BNF and BRWF compiled a stream crossing inventory with $25,430 in
funding from DEQ. Geum environmental consultants partnered to design three projects that
addressed streambank stabilization and/or temperature impairments.
In 2014-2015, BNF removed three culverts to eliminate fish passage barriers and seeded, fertilized,
mulched, and planted native shrubs on disturbed areas.
In 2018, BNF implemented BMPs on 8.2 miles of road adjacent to Slate Creek, a tributary to the West
Fork.
In 2016-2017, BNF planted riparian shrubs along .4 miles of stream.
In 2016-2017, BNF implemented drainage improvements on 95 acres in the West Fork, East Fork,
and Mainstem drainages. Road maintenance was performed to reduce sediment loads to streams.
In coming years, BNF plans to implement road treatments (including BMPs, storage, and
decommission) below Painted Rocks Lake. In addition, BNF plans to perform a road-to-trail
conversion, including culvert removals and revegetation of disturbed soils, on a road near Overwhich
Creek, a tributary to the West Fork.

23
3.4 East Fork Bitterroot River
Description
The East Fork of the Bitterroot River (East Fork) originates high in glaciated basins of the Sapphire Mountains. Some basins are composed of metasedimentary rocks of the Belt Series and others of granitic bedrock. Thus, glacial and alluvial deposits of mixed origins and sandy materials from granitic bedrock influence substrates of the East Fork. The East Fork flows alternately through low-gradient montane valleys and confined narrow valleys, intermittently transporting sediment and then depositing it in low-gradient reaches that run primarily through private land. The East Fork bends at its midpoint and flows north to meet the West Fork of the Bitterroot River. Below the confluence, the valley narrows, and smaller tributaries flow through moderate- to high-relief landforms, routing runoff and sediments from weathered granitic outcrops to the mainstem of the Bitterroot River. The East Fork is an important migratory corridor for Bull Trout and Westslope Cutthroat Trout coming out of the Bitterroot River to spawn and rear in the upper East Fork.
Stream Impairments31
Impairment
Cause
TMDL
Pollutant
Category
Impaired
Beneficial
Use
TMDL
Completed Source of Impairment Cause
Alteration in
streamside or
littoral cover
N/A; non-
pollutant
Aquatic
Life N/A
Grazing in Riparian or Shoreline
Zones
Highways, Roads, Bridges,
Infrastructure (New Construction),
Channelization
Streambank Modifications -
destabilization
Sedimentation
/ Siltation Sediment
Aquatic
Life Yes
Highways, Roads, Bridges,
Infrastructure (New Construction)
Watershed Runoff following Forest
Fire
Grazing in Riparian or Shoreline
Zones
Temperature Temperature Aquatic
Life Yes
Grazing in Riparian or Shoreline
Zones
Streambank Modifications-
destabilization
Highways, Roads, Bridges,
Infrastructure (New Construction)
Channelization
31 Montana Department of Environmental Quality. Final 2018 Water Quality Integrated Report Appendix A: Impaired Waters. Helena:
Montana. Department of Environmental Quality [2018]. Web.

24
TMDLs and Load Reductions
Sediment32
East Fork Bitterroot River sediment loads are largely natural or derive from fires of 2000. Human-caused sediment loading is primarily linked to forest roads and eroding banks. A 42% decrease in sediment from forest roads is necessary, as is a 75% decrease in loads from human-caused bank erosion.
Temperature33
To achieve the temperature water quality standard, the TMDL is essentially expressed as a percentage of effective shade. For this stream, 55% effective shade should cool stream temperatures sufficiently. Based on partner’s priorities and landowner connections, this WRP prioritizes restoration actions aimed at increasing effective shade near the confluence of Reimel Creek and revegetation on working lands.34
Management Measures
Restoration actions will focus on reducing the negative effects of Highway 93 and associated development to riparian areas. Riparian revegetation will be key to achieving the TMDL’s recommendations. In addition to direct impacts on streamside vegetation, these activities reduce unnatural erosion, lowering sediment rates, and provide shade and cool groundwater infiltration to lower temperatures. This lends itself well to supporting fish populations, who benefit from the improved water quality as well as improved habitat that riparian vegetation provides. Good locations for these activities include the riparian mile above the town of Conner, additional locations alongside Highway 93, and upstream of Sula. Assessing riparian roads and identifying locations where relocation could improve riparian vegetation may help achieve the desired level of shade. Where relocation is not an option, upgrading or maintaining may lower sediment delivery from near-stream roads.
Fish passage in the upper watershed is also a primary focus; additional activities may include removing barriers to fish migration or habitat use. The irrigation infrastructure on the East Fork should be considered for risks of fish entrainment in ditches and opportunities to increase instream flows. Activities on private lands may include conservation easements, improving the efficiency of irrigation systems, encouraging grazing BMPs, implement restoration projects to improve instream habitat, channel form, and riparian zones. Continued education and outreach activities will build on existing traction with private landowners in this basin.
Projects
Between 2011 and 2016, BRWF revegetated one mile of streambank adjacent to Highway 93 to reduce temperature and sediment loads. These activities were funded in part by RAC.
BRWF completed a project at the Lazy J Cross Ranch in Sula, MT in 2014 funded by DEQ 319, Future Fisheries Improvement Program, and Ponderosa Trust. The project included riparian cattle fencing and bank and floodplain revegetation on 5.14 acres of floodplain and 4,200 linear feet of streambank. The project addressed issues of temperature, sediment, and riparian vegetation, and reduced sediment loading by 6.6 tons/year.
32 Montana Department of Environmental Quality. Water Quality Restoration Plan and Total Maximum Daily Loads for the Bitterroot
Headwaters Planning Area. 2005. Table 4-20.
33 Montana Department of Environmental Quality. Water Quality Restoration Plan and Total Maximum Daily Loads for the Bitterroot
Headwaters Planning Area. 2005. Table 5-17. 34 Montana DEQ Watershed Protection Section. “Riparian Evaluation and Wetland Priorities Results.” June 2019.

25
Trout Unlimited is working with the Bitterroot National Forest, FWP and Bitterroot Conservation District to improve fish passage and reduce fish entrainment in ditches in the upper East Fork through diversion upgrades, fish screen installations, and culvert replacements.
In 2013, Trout Unlimited and local contractors decompacted, decommissioned, and seeded 10 miles of roads in the Bertie Lord drainage. This project was supported by DEQ at $35,000, Tiffany and Company Foundation Grant and Bitterroot TU Chapter mini grant at $20,000 combined, and BNF at $18,000. This project achieved a sediment load reduction of 98 tons per year.
In coming years, BRWF and BNF will implement South Valley Floodplain Creation, a plan to store and/or decommission sections of two roads located next to East Fork tributaries. This project is expected to cost $56,000 and will address problems with sediment, temperature, aquatic life, and streamside vegetation.
Between 2014-2019, BNF completed approximately 42 miles of road maintenance, upgrades, storage, and/or decommission on riparian roads in East Fork drainage basin.
In 2016-2017, BNF implemented drainage improvements on 95 acres in the West Fork, East Fork, and Mainstem drainages. Road maintenance was performed to reduce sediment loads to streams.

26
3.5 Cameron Creek
Description
Cameron Creek is located in the upper headwaters of the Bitterroot watershed near Sula and originates in the Sapphire Mountains on the east side of the Bitterroot Valley. It flows south through the Bitterroot National Forest and a mix of public and private land before draining into the East Fork Bitterroot River. Cameron Creek provides spawning and rearing habitat for a widely distributed population of Westslope Cutthroat Trout, which is threatened by poor habitat quality in the lower half of Cameron Creek arising from high sediment loads and elevated water temperatures. While Cameron Creek is not listed on Montana’s 303(d)list of impaired waters, it is a source of elevated sediment loads and unnaturally warm water flowing into the East Fork, which itself is listed for sediment and temperature impairments. No Bull Trout permanently live in the Cameron Creek drainage; however, an incidental Bull Trout has been known to enter the lower mile of Cameron Creek to hold and feed for short periods of time (several weeks) during their upstream spawning migration in the East Fork.35
Stream Concerns36
Concern Cause
TMDL
Pollutant
Category
Beneficial Use
of Concern
TMDL
Completed
Source of Concern Cause
Temperature Temperature Aquatic Life No
Shade loss (removal of
riparian vegetation)
Historical land use
practices, including clearing
and burning for agriculture
Channelization
Grazing in riparian or
shoreline zones
Streambank modifications
and destabilization
TMDLs and Load Reductions
Cameron Creek does not have published TMDLs. Land use practices that remove riparian vegetation (e.g. clearing, burning, grazing, and bank modifications) have contributed to high stream temperatures through shade loss and decreased groundwater infiltration. Accordingly, riparian revegetation has a high potential for reducing temperature loads. The proportion of the stream that is most viable for restoration activities stretches from USFS 311 to its confluence with the East Fork.
35 Jakober, Michael J. Cameron. Blue Ecoburn: Biological Assessment and Evaluation. Sula, MT: U.S. Forest Service, Bitterroot
National Forest. 2011.
36 Because Cameron Creek has not been assessed by DEQ, the term “impairment” does not apply. However, based on monitoring and
assessment efforts completed by the Bitterroot National Forest, BRWF considers it to be a stream of concern in the Bitterroot watershed (Jakober, 2011).

27
Management Measures
As a warm stream that is home to a population of Westslope Cutthroat, management measures recommended for Cameron Creek include:
Removing barriers to fish habitat use and migration, such as culverts Assessing the extent of dewatering in the creek and its tributaries and the associated impacts on fish
and temperature Promote responsible irrigation and land use practices through conservation easements, education
and outreach programs, grazing management plans, incentive programs Establish riparian vegetation to shade the stream, increase cool groundwater recharge, and improve
in-stream habitat. Potential for beavery mimicry exists in the lower drainage in particular. Assess the locations and impacts of streamside roads; upgrade or relocate where necessary
Projects
BRWF planted 2,500 native plants, including willow cuttings and a variety of containerized plants on Cameron Creek in 2013 and 2014. In 2016, 900 feet of coir wattles, three large woody debris structures, and additional willow cuttings were added for bank stabilization and to promote willow propagation. Approximately 10,000 feet of riparian fencing was also constructed. This project was supported by MWCC and RAC at $21,000. These plantings are anticipated to contribute to a reduction in overall stream temperatures, however, this has not been observed at the time of publication as the vegetation requires additional time to grow large enough to provide stream shade.
In 2014, BRWF planted 2,000 plants, particularly willows, along .5 miles of Doran Creek, a tributary to Cameron Creek. These plantings were intended to revegetate barren pasture areas to help cool creek waters before entering Cameron Creek.

28
3.6 Rye Creek
Description
Rye Creek originates on the east side of the valley in the Sapphire Mountains and enters the Bitterroot River 6miles south of the town of Darby. Rye Creek, a 63-square-mile subwatershed, is naturally sensitive because of its geology and weathered granitic soils, which easily erode. Most of the land is public, owned by the Bitterroot National Forest, though private land comprises 15 square miles of the Rye Creek watershed. The privately owned portion has a high road density and high levels of past timber harvest; some areas show evidence of other activities, including farming, livestock grazing, and mining.
Stream Impairments37
Impairment
Cause
TMDL
Pollutant
Category
Impaired
Beneficial Use
TMDL
Completed
Source of Impairment Cause
Alteration in
streamside or
littoral vegetative
covers
N/A; non-
pollutant Aquatic Life N/A
Grazing in riparian or shoreline
zones
Animal feeding operations
(NPS)
Nitrogen, total Nutrients
Aquatic Life
Primary
Contact
Recreation
Yes
Grazing in riparian or shoreline
zones
Animal feeding operations
(NPS)
Phosphorus, total Nutrients
Aquatic Life
Primary
Contact
Recreation
Yes
Grazing in riparian or shoreline
zones
Animal feeding operations
(NPS)
Sedimentation-
Siltation Sediment Aquatic Life Yes
Forest Roads (road
construction and use)
Silviculture activities
TMDLs and Load Reductions
Nutrients
To achieve the total nitrogen water quality standard, human-caused sources of nitrogen should be reduced by 20%. These sources include activities like silviculture, septic systems, and agriculture. 38 To achieve the
37 Montana Department of Environmental Quality. Final 2018 Water Quality Integrated Report Appendix A: Impaired Waters. Helena:
Montana. Department of Environmental Quality [2018]. Web. 38 Montana Department of Environmental Quality. Final - Bitterroot Watershed Total Maximum Daily Loads and Water Quality
Improvement Plan. Document No. C05-TMDL-04aF. 2014. Table 5-41.

29
total phosphorus water quality standard, human-caused sources of phosphorus should be reduced by 60%. The primary source of phosphorus in Rye Creek is agriculture. 39
For this WRP, project partners intend to focus on agricultural lands through practices such as offsite watering, fencing, and establishing riparian management corridors. This source is a priority because of landowner connections, existing momentum with these types of projects, and because nutrient pollution from these sources can be address with traditional best management practices. Septic systems may be addressed through education and outreach opportunities like realtor training and partnerships with counties and cities.
Sediment 40
Sources of sediment in Rye Creek include animal feeding operations, grazing in riparian zones, forest roads, and silviculture. This WRP will focus on addressing sediment loads from anthropogenically influenced eroding banks (aiming for a 13% load reduction) and forest service roads (63% load reduction).
Sediment Sources Current Estimated Load (Tons/Year)
Total Allowable Load (Tons/Year)
Sediment Load Allocation (% Reduction)
Roads 64 24 63%
Eroding Banks
Anthropogenically Influenced
621 379 13%
Natural 1314 1314
Upland Erosion
All land uses 10 7 33%
Stormwater 0 041 0%
Total Sediment Load 2009 1724 14%
Management Measures
Improve fish habitat and populations through activities such as removing passage barriers, particularly at diversion dams at irrigation ditches.
Reduce sediment loads from roads through activities suchs as recontouring, relocating, decommissioning, and upgrading. This is of particular interest on North Rye Creek and the upper drainage.
39 Montana Department of Environmental Quality. Final - Bitterroot Watershed Total Maximum Daily Loads and Water Quality
Improvement Plan, Document No. C05-TMDL-04aF. 2014. Table 5-42.
40 Montana Department of Environmental Quality. Bitterroot Temperature and Tributary Sediment Total Maximum Daily Loads and
Framework Water Quality Improvement Plan, Document No. C05-TMDL-03aF. 2011. Table 5-66.
41 This allocation represents the maximum allowable load under the constraints of the current Stormwater Construction permit.

30
Revegetate riparian areas to reduce sediment loads from eroding banks and improve groundwater infiltration. 12,000 feet of Rye Creek offers potential for revegetation, particularly on agricultural lands and upstream of Highway 93.42
Implement BMPs on agricultural lands such as livestock fencing, offsite watering, irrigation practice conversion, livestock management plans, etc.
Projects
Restoration actions here will complement restoration in the neighboring Skalkaho and Sleeping Child subwatersheds to create a large block of improved habitat for focal fish species on the eastside of the Bitterroot watershed.
Two private landowner projects funded by DEQ were completed in 2015 addressing eroding banks.
As a result of this project a total of 250 feet of streambank was restored with bioengineered soil lifts,
sediment loading to Rye Creek was reduced by 100 tons, nitrogen was reduced by 21.4 pounds, and
phosphorus was reduced by 173 pounds.
BRWF and BNF completed a project in 2015 to restore streamside forest roads to their original
condition, improving the riparian area and reducing sediment input to Rye Creek, Sleeping Child
Creek and several tributaries. Project partners decompacted and recontoured 20 miles of roads,
removed 42 culverts, and reseeded soils after treatments. Across the project area, 173 tons/year of
sediment was reduced. A phase two of this project will be completed in the coming years.
In addition to the projects done in partnership with BRWF, BNF has stored or decommissioned 185
miles of roads in the Rye Creek basin.
42 Montana DEQ Watershed Protection Section. “Riparian Evaluation and Wetland Priorities Results.” June 2019.

31
3.7 Sleeping Child Creek
Description
Sleeping Child Creek is located south of Hamilton near Skalkaho Highway. Originating in the Sapphire Mountains, the creek runs for 24 miles before joining the Bitterroot River. The Creek contains fair Bull Trout and Westslope Cutthroat Trout populations, with an abundance of good spawning and rearing habitat, creating the potential for improving these populations and connecting to other population strongholds in the Bitterroot River.
Stream Impairments43
Impairment Cause
TMDL Pollutant Category
Impaired Beneficial
Use
TMDL
Completed
Source of Impairment Cause
Sedimentation- Siltation
Sediment Aquatic
Life Yes
Highway-road-bridge runoff (non-construction related) Agriculture Silviculture activities
Temperature Temperature Aquatic
Life Yes
Silviculture activities Agriculture
TMDLs and Load Reductions
Sediment44
The TMDL points out elevated fine sediment levels coming from roads, eroding banks due to human activities, and upland erosion. Anthropogenic effects within 100 feet of the stream were noted along 16 river miles (a third of the stream).
43 Montana Department of Environmental Quality. Final 2018 Water Quality Integrated Report Appendix A: Impaired Waters. Helena:
Montana. Department of Environmental Quality [2018]. Web. 44 Montana Department of Environmental Quality. Bitterroot Temperature and Tributary Sediment Total Maximum Daily Loads and
Framework Water Quality Improvement Plan, Document No. C05-TMDL-03aF. Table 5-67: Sleeping Child Creek Sediment TMDL. 2011.

32
Sediment Sources Current Estimated Load (Tons/Year)
Total Allowable Load (Tons/Year)
Sediment Load Allocation (% Reduction)
Roads 31 11 63%
Eroding Banks
Anthropogenically Influenced
885 593 12%
Natural 1502 1502
Upland Erosion
All land uses 243 197 19%
Point Source
Stormwater Construction
0 345 0%
Total Sediment Load 2661 2306 13%
Temperature46
Unnaturally warm temperatures may have developed in Sleeping Child Creek due to irrigation activities and loss of riparian vegetation. Fires of 2000 impacted vegetation along 10 miles in the middle segment of the river, and ranching and farming activities may have reduced vegetation along the lowest 7 miles of the stream. Further, in these lower reaches, irrigation diversions reduce streamflow in the river, allowing it to be heated more easily by the sun. Decreasing Sleeping Child Creek’s high temperatures is important to make the stream more suitable for native trout over Brown Trout. The TMDL recommends the following measures to achieve a 1F decrease in maximum temperature:
Increase shade to cover 2% more of the river; Decrease the channel width: depth ratio from 24.6 to 16 or less; Improve irrigation efficiencies in order to
○ Reduce the amount of water withdrawn for irrigation by 15%, particularly in the summer ○ Reduce the amount of irrigation water that is returned to the stream by 75%
Management Measures
Approaches to reduce temperature and sediment loads and benefit aquatic life include:
Reducing the impacts of streamside roads through redesign, relocation, upgrades, etc. One road that may be a target is located on the north side of the stream.
Remove barriers to Bull Trout and other species’ passage. One diversion dam has been identified as a possible problem.
45 This allocation represents the maximum allowable load under the constraints of the current Stormwater Construction permit. Full compliance with all conditions of the permit should achieve a load less than the amount given in this table. 46 Montana Department of Environmental Quality. Bitterroot Temperature and Tributary Sediment Total Maximum Daily Loads and Framework Water Quality Improvement Plan, Document No. C05-TMDL-03aF. 6.5.5. 2011.

33
Revegetating riparian areas to increase shade and reduce sediment loads. Approximately 9,000 feet of easily-implemented revegetation potential exists, mostly on farming/ranching lands.47 Revegetation is particularly needed in middle and lower reaches of the stream, though subdevelopments and presence of homes will require landowner buy in.
Improving irrigation efficiencies. Activities include encouraging landowners to convert their irrigation practices and implement BMPs, upgrading irrigation infrastructure (e.g. ditch lining, headgate installation), and monitoring and metering flows.
Projects
Restoration activities will focus on improvements that could enhance the populations and migratory capacity of native trout.
BRWF and BNF completed a project in 2015 to restore streamside forest roads to their original
condition, improving the riparian area and reducing sediment input to Rye Creek, Sleeping Child
Creek and several tributaries. Project partners decompacted and recontoured 20 miles of roads,
removed 42 culverts, and reseeded soils after treatments. Across the project area, 173 tons/year of
sediment was reduced. A phase two of this project will be completed in the coming years.
47 Montana DEQ Watershed Protection Section. “Riparian Evaluation and Wetland Priorities Results.” June 2019.

34
3.8 Skalkaho Creek
Description
The Skalkaho Creek drainage is a large subwatershed of approximately 132 square miles. Originating high in the Sapphire Mountains, Skalkaho Creek flows nearly 28 miles west-northwest through agricultural lands and smaller private parcels before reaching the Bitterroot River. On portions of Bitterroot National Forest land, Skalkaho Creek contains healthy populations of Bull Trout and Westslope Cutthroat Trout; indeed, Skalkaho Creek contains some of the highest densities of Bull and Westslope Cutthroat in the BNF. The pure-strain bull trout population and quality habitat make Skalkaho a highly important for population maintenance. However, on downstream private lands, native trout diminish and exotic trout (Brook, Brown, and Rainbow) increase. According to the Subbasin plan, the Upper Skalkaho Creek is “a native fish stronghold and supports the best Bull Trout and Westslope Cutthroat Trout populations on the eastside of the Subbasin.”48 Four miles of Skalkaho Creek are considered chronically dewatered.49
Stream Impairments50
Impairment
Cause
TMDL
Pollutant
Category
Impaired
Beneficial Use
TMDL
Completed
Source of Impairment
Cause
Flow Regime
Modification
N/A; non-
pollutant Aquatic Life N/A Crop production (irrigated)
TMDLs and Load Reductions
TMDLs are not applicable to flow regime modification impairments, and therefore load reductions are not
calculated for Skalkaho Creek. The important native fishery is at risk from dewatering, grazing, passage
barriers, loss of riparian vegetation, and exotic trout.51 The stream is chronically dewatered for four miles and
particularly between the Ward and the Republican irrigation diversions. Additionally, stream channel
sections that have been historically straightened to make way for agriculture or other development can
contribute to dewatering because channel complexity slows water movement over the landscape.
Accordingly, addressing irrigation inefficiencies and improving water storage on the landscape are important
restoration opportunities on Skalkaho Creek.
Management Measures
To address flow regime modification and assist aquatic populations in Skalkaho Creek, management measures should focus on:
48 Bitterroot Subbasin Plan for Fish & Wildlife Conservation p.38
49 (FWP, 2005)
50 Montana Department of Environmental Quality. Final 2018 Water Quality Integrated Report Appendix A: Impaired Waters. Helena: Montana. Department of Environmental Quality [2018]. Web. 51 Montana DEQ. Water Quality Standards Attainment Record. 23 Jan. 2018. Assessment Record: MT76H004_100.

35
Improving fish populations by identifying and removing barriers to migration or habitat use and eliminating fish entrainment in irrigation ditches, particularly with respect to Bull Trout. Ditch crossings upstream of Highway 93 may warrant further exploration.
Improving instream flows by encouraging responsible land use practices. This may include: o Purchasing water rights o Encouraging irrigation system conversion to efficient setups o Conservation easements o Education and outreach
Improving landscape water storage by protecting and enhancing riparian habitats. Strategies to achieve this include:
o Implementing grazing BMPs in riparian areas o Revegetation and floodplain creation activities, including native plant reintroduction, beaver
dam analogue construction, and vegetation-based streambank stabilization. Approximately 10,000 feet of easily-implemented revegetation potential exists, particularly on lower reaches and on grazing or agricultural lands.52
o Recountouring or relocating streamside roads o Channelized areas near Meadowlark Lane may warrant further exploration
Reduce the propensity of other water quality issues (sediment, temperature, etc.) to develop. (Roads adjacent to Daly and Skalkaho Creek, including road 75, contribute large amounts of sediment to the stream and may require redesign or maintenance. Both Upper Skalkaho and Daly Creek have recently been burned at moderate to high severity.)
Projects
Restoration actions will provide potential for expanding habitat for native species strongholds in the upper
reaches of Skalkaho Creek, and improving habitat connectivity in the lower reaches.
In 2016-2017, BNF replaced two culverts to accommodate 100-year flows and aquatic organism
passage.
In 2015, BNF improved 1.1 miles of streambank along Daly Creek, stabilized stream banks along
Railroad Creek, and implemented measures to control recreational access along Railroad, Hog
Trough, and Upper Skalkaho Creeks.
Due to time constraints and capacity limitations, BRWF has not completed any projects on Skalkaho
Creek to date, nor are any specific projects currently planned. Due to the stream’s impairment status
and cultural significance, opportunities for restoration will continue to be sought through
networking and outreach.
52 Montana DEQ Watershed Protection Section. “Riparian Evaluation and Wetland Priorities Results.” June 2019.

36
3.9 Willow Creek
Description
Willow Creek originates in the Sapphire Mountains on the eastern side of the Bitterroot Valley and supports strong native trout populations in its upper reaches. It flows mostly through private lands and stretches for 20 miles. Willow Creek empties into the Bitterroot River near Corvallis.
Stream Impairments
Impairment
Cause
TMDL
Pollutant
Category
Impaired
Beneficial Use
TMDL
Completed
Source of Impairment
Cause
Alteration in
streamside or
littoral
vegetative
covers
N/A; non-
pollutant Aquatic Life N/A
Crop production
(irrigated)
Silviculture activities
Loss of riparian habitat
Sedimentation/
Siltation Sediment Aquatic Life YES
Silviculture activities
Loss of riparian habitat
Temperature Temperature Aquatic Life YES
Water diversions
Crop production
(irrigated)
Loss of riparian habitat
TMDLs and Load Reductions
Sediment53
Roads, anthropogenically influenced streambank erosion, and upland erosion have resulted in elevated sediment loads in Willow Creek. Riparian grazing and agriculture are the biggest causes of bank erosion. Improving riparian conditions using BMPs can reduce this bank erosion and also reduce upland sediment loads. BMPs can also reduce sediment loads from roads.
53 Montana Department of Environmental Quality. Bitterroot Temperature and Tributary Sediment Total Maximum Daily Loads and
Framework Water Quality Improvement Plan, Document No. C05-TMDL-03aF. Table 5-70: Willow Creek Sediment TMDL. 2011.

37
Sediment Sources Current Estimated Load (Tons/Year)
Total Allowable Load (Tons/Year)
Sediment Load Allocation (% Reduction)
Roads 15 5 66%
Eroding Banks
Anthropogenically Influenced
922 461 27%
Natural 783 783
Upland Erosion
All land uses 621 394 37%
Point Source
Stormwater Construction
0 11* 0%
Total Sediment Load 2341 1654 29%
*This allocation represents the maximum allowable load under the constraints of the current Stormwater Construction permit. Full compliance with all conditions of the permit should achieve a load less than this amount.
Temperature54
High temperatures in Willow Creek may have been caused by reduced riparian vegetation (especially on grazing/crop lands on the lower seven miles of the stream; many areas have less than 25% riparian cover55). Water is also diverted for irrigation in the lower half of the watershed, which results in temperature rise of the remaining streamflow. The Republican and Hedge ditches cross and mix with the Creek, which may result in warmed water.
The following practices are recommended to reduce the maximum stream temperature by 2.5F:
Create effective shade on 8% more of the river (8% represents restoring riparian conditions to their natural state)
Study and alter irrigation management practices to produce maximum benefit for the fishery 15% improvement in irrigation efficiency
Management Measures
To increase streamside vegetative cover and reduce sediment and temperature loads in Willow Creek, the following measures are recommended.
54 Montana Department of Environmental Quality. Bitterroot Temperature and Tributary Sediment Total Maximum Daily Loads and
Framework Water Quality Improvement Plan, Document No. C05-TMDL-03aF. Table 6-24. 2011.
55 Montana DEQ Watershed Protection Section. “Riparian Evaluation and Wetland Priorities Results.” June 2019.

38
Outreach and education programs targeting landowners in the Willow Creek drainage that encourage responsible land use and irrigation practices
Riparian revegetation to increase shade and decrease sediment loads, especially on the lower half of the stream. Approximately 90,000 feet of readily-achievable revegetation potential exists on Willow Creek, particularly on crop or grazing lands56
Restoration activities that promote channel complexity (large woody debris, beaver mimicry, bank bioengineering) especially in channelized areas
Implementing upland and riparian agricultural BMPs to reduce sediment delivery Road BMPs (ditch relief at crossings, water bars, vegetative buffers, maintenance, recontouring) on
streamside roads and crossing to reduce sediment loads Studying irrigation practices and infrastructure in the area to determine opportunities for improving
irrigation efficiency and reducing withdrawals
Projects
In coming years, BNF will complete Gold Butterfly Project to reduce fuels and implement BMPs, store,
or decommission roads, particularly in riparian areas. This project will reduce sediment loads in
Willow Creek and Burnt Fork Creeks.
In 2016-2017, BNF improved 3.5 miles of roads in the Willow Creek drainage.
Due to time constraints and capacity limitations, BRWF has not completed any projects on Willow
Creek to date, nor are any specific projects currently planned. Due to the stream’s impairment status
and cultural significance, opportunities for restoration will continue to be sought through targeted
networking and outreach.
56 Montana DEQ Watershed Protection Section. “Riparian Evaluation and Wetland Priorities Results.” June 2019.

39
3.10 North Burnt Fork Creek
Description
This subwatershed is 85.9 square miles, making it one of the largest tributaries on the east side. Its north-facing headwaters maintain cold water that is home to a strong resident Bull Trout and Cutthroat Trout population. The drainage as a whole supports a diversity of migratory birds, waterfowl species, and is a key migration corridor for terrestrial species. After leaving Forest Service property in the headwaters, Burnt Fork Creek runs through active agricultural land. The lower three miles of Burnt Fork Creek meander through the scenic Lee Metcalf Wildlife Refuge, which provides spectacular fishing, hunting, bird-watching, wildlife viewing, and hiking opportunities, drawing both local recreationists and out-of-state visitors to western Montana. The lower 5 miles of the Burnt Fork is considered chronically dewatered and disconnects from the Bitterroot River at low flows most years.57
Stream Impairments58
Impairment
Cause
TMDL
Pollutant
Category
Impaired
Beneficial
Use
TMDL
Completed
Source of Impairment Cause
Nitrogen, total Nutrients
Aquatic
Life
Primary
Contact
Recreation
YES Grazing in riparian or shoreline zones
Crop production (irrigated)
Phosphorus,
total Nutrients
Aquatic
Life
Primary
Contact
Recreation
YES Grazing in riparian or shoreline zones
Crop production (irrigated)
Sedimentation
- Siltation Sediment
Aquatic
Life YES
Grazing in riparian or shoreline zones
Crop production (irrigated)
TMDLs and Load Reductions
Nutrients
To achieve the total nitrogen water quality standard, human-caused sources of nitrogen should be reduced by 40% and phosphorus by 20%. These sources are primarily agriculture.59 For this WRP, project partners intend to focus on agricultural lands through practices such as offsite watering, fencing, and establishing riparian management corridors. This source is a priority because of landowner connections, existing momentum with these types of projects, and because nutrient pollution from these sources can be
57 (FWP, 2005)
58 Montana Department of Environmental Quality. Final 2018 Water Quality Integrated Report Appendix A: Impaired Waters. Helena:
Montana. Department of Environmental Quality [2018]. Web.
59 Montana Department of Environmental Quality. Final - Bitterroot Watershed Total Maximum Daily Loads and Water Quality Improvement Plan. Helena: Montana. Department of Environmental Quality [2014]. Document No. C05-TMDL-03aF. Table 5-34 and 5-35. Print.

40
addressed with traditional best management practices. Septic systems near the creek also contribute nutrients; this source could be addressed through partnerships with cities and counties.
Sediment60
More than 90% of North Burnt Fork Creek is identified in the TMDL as in fair or poor condition. Land use practices are likely the cause of degradation, particularly agricultural activities such as hay production and grazing near the stream.
Sediment Sources Current Estimated Load (Tons/Year)
Total Allowable Load (Tons/Year)
Sediment Load Allocation (% Reduction)
Roads 21 8 62%
Eroding Banks
Anthropogenically Influenced
2070 952 41%
Natural 656 656
Upland Erosion
All land uses 2279 1195 48%
Point Source
Stormwater Construction
0 1961 0%
Total Sediment Load 5026 2830 44%
Management Measures
Riparian revegetation activities are highly recommended. These can reduce sediment loads and benefit aquatic habitat. In turn, levels of nutrients that adsorb to sediments will be reduced. 50,000 feet of easily achievable revegetation potential exists, especially on farming and ranching lands.62 Particular locations include west of the railroad crossing and upstream of the Eastside Highway.
Removing barriers to connectivity (e.g. at Big Ditch Crossing, Lee Metcalf Wildlife Refuge) Implementing channel complexity projects to create habitat for important fish species Building on current traction in the basin with education, outreach, and collaboration between groups Reducing sediment loads from roads by implementing BMPs Exploring opportunities to upgrade or relocate septic systems near the stream
60 Montana Department of Environmental Quality. Bitterroot Temperature and Tributary Sediment Total Maximum Daily Loads and
Framework Water Quality Improvement Plan, Document No. C05-TMDL-03aF. Table 5-65: North Burnt Fork Creek Sediment TMDL. 2011.
61 This allocation represents the maximum allowable load under the constraints of the current Stormwater Construction permit. Full
compliance with all conditions of the permit should achieve a load less than the amount given in this table.
62 Montana DEQ Watershed Protection Section. “Riparian Evaluation and Wetland Priorities Results.” June 2019.

41
Encouraging responsible land use practices and implementation of BMPs, particularly establishing riparian management zones on farms and ranches. This can be achieved for example, through incentive programs or conservation easements.
Improve irrigation efficiencies through encouraging efficient practices and infrastructure upgrades
Projects
Restoration activities include reducing sediment, nutrient and irrigation impacts to the stream and improving fish passage.
In 2011, Trout Unlimited installed 1-mile of fence, 3 cattle crossings and hundreds of riparian plants
on a private cattle ranch approximately 3 miles upstream of the Burnt Fork-Bitterroot confluence.
These efforts have resulted in substantial cottonwood growth, shading the stream and reducing
streambank erosion.
Trout Unlimited is currently working with the Supply Ditch Association and Lee Metcalf Wildlife
Refuge to assess the feasibility of several projects to reduce temperature and nutrient loading in the
lower Burnt Fork, and improve fish passage. This includes leading intensive temperature, flow and
nutrient monitoring, developing conceptual plans and convening stakeholder meetings.
The Bitter Root Land Trust has set up several conservation easements with landowners in the North Burnt Fork drainage basin.
Beginning in 2019, BRWF has been developing riparian fencing, revegetation, and bank stabilization projects with at least one landowner on North Burnt Fork Creek. This work is anticipated to reduce sediment and nutrient loads in the stream and has been provided $57,000 by DEQ and $5,000 by Friends of Lee Metcalf.
BNF improved, stored, or decommissioned 9.5 miles in the Threemile and Lower Burnt Fork basins 2014-2015.
In coming years, BNF will complete the Gold Butterfly Project to reduce fuels and implement BMPs,
store, or decommission roads, particularly in riparian areas. This project will reduce sediment loads
in Willow Creek and Burnt Fork Creeks.

42
3.11 Threemile Creek
Description
Threemile Creek flows in northeast Ravalli County, originating in the Sapphire Mountains and flowing in a general westward direction through a mixture of public and private land for 12 miles before entering the Lee Metcalf Wildlife Refuge and joining the Bitterroot River north of Stevensville. Upper Threemile Creek drains into the Threemile Wildlife Management Area managed by Montana Fish, Wildlife& Parks. In the late 1990s, the Ravalli County Sanitarian’s Office conducted a study of NPS pollution issues within 10 priority subwatersheds of the Bitterroot River and ranked Threemile Creek highest in concentration of nutrients and lowest in aquatic habitat quality and biological integrity.63
Stream Impairments64
Impairment
Cause
TMDL
Pollutant
Category
Impaired Beneficial Use TMDL
Completed
Source of Impairment
Cause
Flow Regime
Modification
N/A; non-
pollutant Aquatic Life N/A
Agriculture
Crop production
(irrigated)
Nitrate-Nitrite Nutrients
Aquatic Life
Primary Contact
Recreation
Yes Agriculture
Nitrogen, total Nutrients
Aquatic Life
Primary Contact
Recreation
Yes Agriculture
Phosphorus,
total Nutrients
Aquatic Life
Primary Contact
Recreation
Yes Agriculture
Sedimentation
- Siltation Sediment Aquatic Life Yes
Agriculture
Rangeland grazing
TMDLs and Load Reductions
Nutrients
To achieve the total nitrogen water quality standard, human-caused sources of nitrogen should be reduced by 68% and phosphorus by 79%. These sources are primarily agriculture.65 For this WRP, project partners intend to focus on agricultural lands through practices such as offsite watering, fencing, and establishing
63 McDowell, Will and Jim Rokosch. Ambrose Threemile Watershed Project: Watershed Assessment and Recommendations for
Stream Improvements. 2005.
64 Montana Department of Environmental Quality. Final 2018 Water Quality Integrated Report Appendix A: Impaired Waters. Helena:
Montana. Department of Environmental Quality [2018]. Web.
65 Montana Department of Environmental Quality. Final - Bitterroot Watershed Total Maximum Daily Loads and Water Quality Improvement Plan. Helena: Montana. Department of Environmental Quality [2014]. Document No. C05-TMDL-03aF. Table 5-28 and 5-29. Print.

43
riparian management corridors. This source is a priority because of landowner connections, existing momentum with these types of projects, and because nutrient pollution from these sources can be addressed with traditional best management practices. Septic systems near the creek also contribute nutrients, particularly nitrogen; this source could be addressed through partnerships with cities and counties.
Sediment66
Anthropogenically-caused eroding banks and upland erosion due to land use are major sources of excessive sediment. Agricultural activities, such as crop production and rangeland grazing, are primary causes; near-stream roads also contribute sediment.
Sediment Sources Current Estimated Load (Tons/Year)
Total Allowable Load (Tons/Year)
Sediment Load Allocation (% Reduction)
Roads 22 7 67%
Eroding Banks
Anthropogenically Influenced
2288 1098 35%
Natural 1082 1082
Upland Erosion
All land uses 1384 836 40%
Point Source
Stormwater Construction
0 1167 0%
Total Sediment Load 4776 3034 36%
Management Measures
Outreach and education programs targeting landowners in the Threemile Creek drainage that encourage responsible land use and irrigation practices
Riparian revegetation to decrease sediment loads, especially on entrenched, exposed banks and bare ground. Approximately 20,000 feet of readily-achievable revegetation potential exists, particularly on crop or grazing lands.68
Restoration activities that promote channel complexity and improve habitat (large woody debris, beaver mimicry, bank bioengineering) especially in channelized areas. This is particularly necessary in Wheelbarrow Creek and lower Ambrose Creek.69
66 Montana Department of Environmental Quality. Bitterroot Temperature and Tributary Sediment Total Maximum Daily Loads and
Framework Water Quality Improvement Plan, Document No. C05-TMDL-03aF. Table 5-69. 2011.
67 This allocation represents the maximum allowable load under the constraints of the current Stormwater Construction permit. Full
compliance with all conditions of the permit should achieve a load less than the amount given in this table.
68 Montana DEQ Watershed Protection Section. “Riparian Evaluation and Wetland Priorities Results.” June 2019.

44
Implementing upland and riparian agricultural BMPs to reduce sediment delivery Road BMPs (ditch relief at crossings, water bars, vegetative buffers, maintenance, recontouring) on
streamside roads and crossing to reduce sediment loads. Culvert replacements may also be necessary, for example, on Ambrose Creek Road.
Studying irrigation practices and infrastructure in the area to determine opportunities for improving irrigation efficiency and reducing withdrawals.
Projects
Restoration activities will focus on measures that reduce sediment delivery to the stream.
In 2012, BRWF completed a $15,000 project which involved road resurfacing and culvert installation with the intention of reducing sediment load to Threemile Creek.
In 2020, BRWF and FWP will complete an infrastructure improvement project on Wheelbarrow Creek, a tributary to Threemile Creek. This project includes the replacement of an undersized perched culvert and implementing 1.7 miles of road BMPs surrounding the stream crossing. Further, log weirs will be constructed to facilitate the passage of Westslope Cutthroat Trout under the new bridge. This project is supported by DEQ at $40,000, FWP at $20,000, and Future Fisheries Improvement Program (FFI) at $20,000. By improving habitat and reducing sediment loads in Wheelbarrow Creek, this project also fulfills priorities outlines in the 2005 Ambrose Threemile Watershed Assessment.70
BNF improved, stored, or decommissioned 9.5 miles in the Threemile and Lower Burnt Fork basins 2014-2015.
In 2020, BNF and FWP will complete a forest habitat improvement project in the Threemile Wildlife Management Area under the Good Neighbor Authority which will include revegetation, fuels reduction, and road BMPs, and will likely reduce sediment loads to Threemile Creek.
Threemile Creek has also been a focus of restoration activities for Clark Fork Coalition.
69 McDowell, Will and Jim Rokosch. Ambrose Threemile Watershed Project: Watershed Assessment and Recommendations for Stream Improvements. 2005.
70 McDowell, Will and Jim Rokosch. Ambrose Threemile Watershed Project: Watershed Assessment and Recommendations for Stream Improvements. 2005.

45
3.12 Miller Creek
Description
Miller Creek is located in the Missoula metropolitan area and drains into the Lower Mainstem Bitterroot
River. For in depth information on Miller Creek, please see the Miller Creek Watershed Restoration Plan.
Stream Impairments71
Impairment
Cause
TMDL
Pollutant
Category
Impaired
Beneficial
Use
TMDL
Completed
Source of Impairment Cause
Alteration in
stream-side or
littoral
vegetative cover
N/A; non-
pollutant
Aquatic
Life N/A
Grazing in riparian or shoreline
zones
Silviculture activities
Loss of riparian habitat
Crop production (crop land or dry
land)
Sedimentation-
Siltation Sediment
Aquatic
Life Yes
Loss of habitat
Grazing in riparian or shoreline
zones
Silviculture activities
Temperature Temperature Aquatic
Life Yes
Loss of habitat
Grazing in riparian or shoreline
zones
Silviculture activities
TMDLs and Load Reductions
Sediment72
Degraded in-stream and riparian habitats as well as elevated sediment loads may have been caused by silviculture, forest roads, agriculture, and suburban developments. Streambank erosion caused by human activity is a major source of elevated sediment.
71 Montana Department of Environmental Quality. Final 2018 Water Quality Integrated Report Appendix A: Impaired Waters. Helena:
Montana. Department of Environmental Quality [2018]. Web. 72 Montana Department of Environmental Quality. Bitterroot Temperature and Tributary Sediment Total Maximum Daily Loads and
Framework Water Quality Improvement Plan, Document No. C05-TMDL-03aF. Table 5-63: Miller Creek Sediment TMDL. 2011.
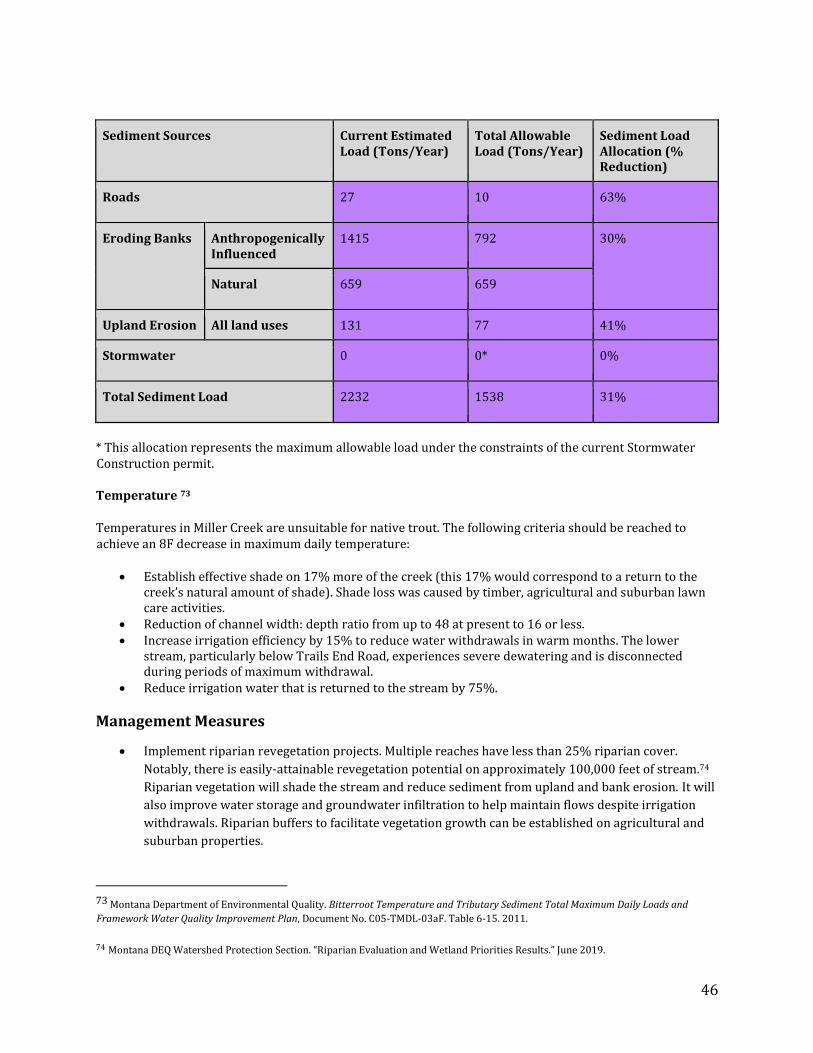
46
Sediment Sources Current Estimated Load (Tons/Year)
Total Allowable Load (Tons/Year)
Sediment Load Allocation (% Reduction)
Roads 27 10 63%
Eroding Banks Anthropogenically Influenced
1415 792 30%
Natural 659 659
Upland Erosion All land uses 131 77 41%
Stormwater 0 0* 0%
Total Sediment Load 2232 1538 31%
* This allocation represents the maximum allowable load under the constraints of the current Stormwater Construction permit.
Temperature 73
Temperatures in Miller Creek are unsuitable for native trout. The following criteria should be reached to achieve an 8F decrease in maximum daily temperature:
Establish effective shade on 17% more of the creek (this 17% would correspond to a return to the creek’s natural amount of shade). Shade loss was caused by timber, agricultural and suburban lawn care activities.
Reduction of channel width: depth ratio from up to 48 at present to 16 or less. Increase irrigation efficiency by 15% to reduce water withdrawals in warm months. The lower
stream, particularly below Trails End Road, experiences severe dewatering and is disconnected during periods of maximum withdrawal.
Reduce irrigation water that is returned to the stream by 75%.
Management Measures
Implement riparian revegetation projects. Multiple reaches have less than 25% riparian cover.
Notably, there is easily-attainable revegetation potential on approximately 100,000 feet of stream.74
Riparian vegetation will shade the stream and reduce sediment from upland and bank erosion. It will
also improve water storage and groundwater infiltration to help maintain flows despite irrigation
withdrawals. Riparian buffers to facilitate vegetation growth can be established on agricultural and
suburban properties.
73 Montana Department of Environmental Quality. Bitterroot Temperature and Tributary Sediment Total Maximum Daily Loads and
Framework Water Quality Improvement Plan, Document No. C05-TMDL-03aF. Table 6-15. 2011.
74 Montana DEQ Watershed Protection Section. “Riparian Evaluation and Wetland Priorities Results.” June 2019.

47
Study the irrigation system to determine where efficiencies can be improved. Encourage responsible
water use practices through education and outreach activities and upgrade irrigation infrastructure.
Implement BMPs at streamside roads and crossings
Encourage land use BMPs on agricultural lands (e.g. offsite watering, fencing, etc.)
Projects
Restoration activities on Miller Creek will focus on revegetating riparian areas to reduce sediment loads to the stream and provide shade.
As of 2018, BRWF is working on a $65,000 riparian fencing and revegetation project on a cattle ranch
on Miller Creek with support from DEQ, MWCC, and TU. The project will protect and restore 0.6 miles
of stream, and is expected to reduce sediment loads by 19 tons/year. As vegetation grows in,
temperature loading will also decrease.
Miller Creek has also been an area of focus for Clark Fork Coalition.

48
3.13 Pattee Creek
Description
Pattee Creek originates in the Pattee Canyon Recreation Area of the Lolo National Forest east of Missoula and southeast of the confluence of the Bitterroot and Clark Fork Rivers. Pattee Creek flows west out of the recreation area, through small agricultural fields used for often intense grazing, past an active gravel pit and through residential neighborhoods. Prior to entering the Missoula Valley, Pattee Creek goes through a stormwater detention pond and then alternates between being piped underground and flowing through ditches before entering the Bitterroot River. Although Pattee Creek is not on the 303(d) list of impaired waters, there is direct year-round discharge to the Bitterroot River. Missoula Valley Water Quality District sampling in March 2019 indicates Pattee Creek contributes to Bitterroot River impairments as Total Suspended Solids measurements at the headwaters site were measured at non-detect while discharge at the mouth measured at 282 mg/L. For reference, the benchmark value for TSS in stormwater permits 100 mg/L.
Figure 10. Pattee Creek Confluence with the Bitterroot River March 2019.

49
Figure 11: Pattee Creek channelized through residential development
Stream Concerns75
Concern
Cause
TMDL
Pollutant
Category
Beneficial
Use of
Concern
TMDL
Completed
Source of Concern Cause
Temperature Temperature Aquatic
Life No
Shade loss (removal of riparian
vegetation)
Channelization
Streambank modifications and
destabilization
Sedimentation-
Siltation Sediment
Aquatic
Life No
Road runoff (non-construction
related)
Alteration in
streamside or
littoral
vegetative
covers
N/A; non-
pollutant
Aquatic
Life N/A
Mowing in riparian zones
Alteration of streamside vegetation
75 Because Pattee Creek has not been assessed by DEQ, the term “impairment” does not apply. However, based on monitoring and
assessment efforts completed by the Missoula Valley Water Quality District, MVWQD considers it to be a stream of concern in the Bitterroot watershed (EQUIS 2019).

50
TMDLs and Load Reductions
Pattee Creek does not have published TMDLs.
Management Measures
Restoration actions will include replacing undersized culverts, increasing riparian revegetation, mitigating agricultural impacts of grazing, decreasing road impacts, and decreasing residential irrigation withdrawals. Long-term, Pattee Creek should be daylighted, removed from pipes underground, and restored to natural function. Continued management of aquatic and streamside invasive species will be important to restoration of riparian vegetation.
Projects
Partner with the City of Missoula Parks and Recreation Department to restore riparian vegetation and create educational examples of a healthy riparian corridor
Decrease impairments caused by road maintenance activities on Pattee Creek through revegetation efforts, increasing culvert size or installing bridges or bottomless culverts and developing management plans with the City Roads Department and the USFS
Work with landowners to decrease impacts associated with agricultural practices, such as grazing management and riparian fencing.
Work with the City of Missoula Stormwater, Development Services, and Public Works Departments to daylight sections of Pattee creek that are currently being treated as stormwater
Promote green instead of gray stormwater treatment
Decrease withdrawals from Pattee Creek in residential areas for watering purposes through education regarding water rights and the lower rates for irrigation water available through Missoula Water
Develop outreach to landowners to improve riparian corridor in residential areas

51
3.14 O’Brien Creek
Description
The O’Brien Creek watershed (Figure 12) encompasses 25.4 square miles and is the last major tributary to the Bitterroot River before its confluence with the Clark Fork River. Flowing east, O’Brien Creek is in the Northern Bitterroots, originating on the east face of the Grave Creek sub-range through low-gradient montane valleys and confined narrow valleys with very few depositional reaches. Primary geology is of the Belt Supergroup.
Figure 13: O’Brien Creek watershed flowing east to confluence with the Lower Bitterroot River
Land ownership in the watershed is a mix of Forest Service, Private and Weyerhaeuser ownership (78%, 20%, and 2%, respectively). The upper watershed is predominately public, USFS, land with the lower watershed occupied by private, small parcels. Several sections of the mid and upper watershed were formally private industrial forest land (i.e. Owens and Hurst, later Champion, then Plum Creek) and within the last 20-30 years have become USFS lands through exchanges aimed to swap like properties and eliminate the higher complexity, checker-board ownership pattern established in the late 1800s. Another quarter-section of private land was donated to the USFS.
O’Brien Creek and watershed have experienced heavy uses since the late 1800s. Unpublished historic records note early homesteading, tick epidemics (i.e. large “tick vat”, excavated pit, carved near the creek as a treatment facility presumably for deer), at least two grain mills (one large mill at the confluence of O’Brien Creek and the Bitterroot River), miles of diversion, channelization, and manipulation (Crawford, 2019). At least historic one rail line, providing logs to Missoula, extended approximately 11-12 miles up the drainage with remnants still existing (Crawford, 2019). In the lower watershed, O’Brien Creek unnaturally went dry for years because of diversion manipulation and withdrawals; however, with recent awareness and senior water right purchase and management by the Clark Fork Coalition, Obrien Creek now flows perennially in all reaches. Current private use is multiple land parcels and varying conditions from heavily grazed and encroached to actively healing riparian vegetation and stream conditions.

52
General stream reconnaissance reveals obvious signs of instability (highly variable channel dimensions, lack of floodplain connection, bank erosion and at least two incision trends with new active channel forming at lower elevation, lack of wood and energy dissipation, lack of pool habitat, lack of riparian vegetation and recruitable wood, etc.)
Approximately 2668 acres (21%) of Forest Service land has been harvested. The watershed has a moderately dense road network (5.17 mi road per mi2). O’Brien Creek has 6.2 miles of riparian road along 10.3 miles of its mainstem with significant lengths with active road fill erosion (i.e. 60% with road within 200 ft. of the stream, with many segments within 50-100 ft). There are at least two segments at the upper end of the mainstem road length where the stream has captured the old road/rail bed. There are a total of 112 road-stream crossings in the watershed; six are on the mainstem. It is presumed that several are total or partial barriers to upstream fish movement.
In the mid-1990s, the Lolo National Forest exercised a substantive road decommissioning effort on acquired private industry roads not necessary for the long-term transportation system and land management plans. This effort recontoured dozens of road miles on the former industry lands where the timber resource had extensively been utilized. This action eliminated several non-point source sediment delivery sources from undersized road-stream crossings and returned many hillslopes to natural recovery and vegetation reproduction. Some remaining roads and deferred maintenance continue to create impacts.
A very cold tributary, O’Brien Creek is one of the most important tributaries in the lower Bitterroot for rainbow and cutthroat trout (MT FWP, 2019). Table 14 highlights 2018 and 2019 data, accompanied by Figure 15, displaying 2019 thermograph readings.76
Temperature (Fahrenheit)
Date Average Maximum Minimum
2018 52 60 41
2019 51 63 33
Table 14. 2019 Late Season Stream Temperature Monitoring Results
76 Clark Fork Coalition, 2019.

53
Figure 15: Late Season Stream Temperatures below Blue Mountain Road
Large portions (39%) of the watershed has experienced relatively recent wildfire. The 2003 Black Mountain fire burned 6222 acres, predominately on Forest Service, but some on private land in the lower watershed. Current wildfire risk remains very high. The Lolo National Forest, Missoula Ranger District, is heavily engaged in planning efforts to conduct prescribed fire and vegetation management aimed to create landscape conditions more similar to natural wildfire regimes where feasible (Wildfire Adapted Missoula, WAM, USFS, 2019).
0
10
20
30
40
50
60
70
2019 June-October Stream Temperatures O'Brien Creek (cfc,2019)
Temp (°F)

54
Stream Concerns
The following stream concerns are based on a compendium of observations and data collected. Please see Appendix A for detailed information.
Concern Cause TMDL Pollutant Category
Beneficial Use of Concern
TMDL Complete
Source of Concern Cause
Sedimentation- Siltation
Sediment Aquatic Life
No
Streambank erosion, road runoff, Channelization/entrenchment; Streambank modifications and destabilization; instream wood removal;
Alteration in streamside or littoral vegetative covers
Non-pollutant
Aquatic Life
N/A Mowing in riparian zones Alteration of streamside vegetation
TMDLs and Load Reductions
Although O’Brien Creek does not have an established TMDL, the 2011 Bitterroot TMDL includes sediment loading data from unpaved road networks, including road crossings and parallel road segments (11.98 tons/year and 10.72 tons/year, respectively). Sediment delivery from road surface sediment, road fill failure, stream bank erosion, and other sources has not been quantified; however it is very likely that non-point source delivery is at least 1-2 orders of magnitude above natural background levels. Further investigation is necessary to quantify. Immediate rehabilitation of O’Brien Creek to arrest sediment sources and establish proper fluvial geomorphic and riparian vegetation conditions is highly warranted to address sediment loading that unequivocally is producing excessive sediment contributions to the Lower Bitterroot River.
Management Measures
The following management measures are recommended to address O’Brien Creek’s sediment loads as well as benefit impaired aquatic life in the stream:
Establishing stable stream and floodplain morphology in unstable, entrenched, and/or erosive reaches
Removing or replacing culverts Relocating roads away from floodplain and riparian zones Returning roads to a natural state Implementing BMPs on roads in floodplain and riparian areas Promoting fish and wildlife habitat protection Implementing measures that encourage natural flood control, erosion control, and groundwater
recharge. Strategies include riparian revegetation, beaver dam analogues, and vegetation-based streambank stabilization
Restoring aquatic habitat diversity Removing barriers to fish migration and habitat use Expanding education and outreach programs

55
Projects
In approximately 1998, Missoula County replaced an undersized culvert at the Blue Mountain Road crossing. This culvert was a fish barrier.
In approximately 1999, FWP and Water Consulting, Inc. completed a stream channel stabilization and habitat enhancement project in the confluence reach of O’Brien Creek.
In 2017, Missoula County and Watershed Consulting planted a streamside area to mitigate for flood impacts.
In 2019, the O’Brien Creek HOA funded remediation at a stream avulsion site and provided temporary base protection at a mass failure site. 11 large trees were donated by Hillsdale Estates.
Please see appendix A for detailed information on restoration projects on O’Brien Creek.

56
3.15 Tributaries
Tributaries directly contribute to the health of priority streams. Because BRWF is focusing on the overall health of each of the subwatersheds listed in this WRP, we will also consider addressing pollutants, implementing restoration projects, and conducting education and outreach on degraded tributaries to priority streams. Beyond addressing existing pollutants and degraded locations, BRWF will also explore opportunities for preventative measures, that is, restoration activities that can reduce the likelihood of impairments from developing in the future. This technique will be applied to priority streams as well as to their tributaries.
Projects
Between 2008 and 2011, Ravalli County Environmental Health updated the City of Hamilton’s Source Water Protection Plan, which included water quality sampling of domestic wells, hosted a hazardous waste disposal event, and distributed 419 $75 coupons to incentivize homeowners to pump their septic system. These project activities supported a multifaceted education and outreach campaign on groundwater protection throughout Ravalli County. This project was funded by DEQ at $87,339.
Between 2013 and 2017, the Clark Fork Coalition completed an irrigation infrastructure improvement project on Lost Horse Creek. Previously, an earthen dam across the creek was excavated yearly to maintain irrigation water conveyance—a practice that resulted in elevated turbidity and a fish passage barrier. CFC and partners replaced the gravel coffer dam with a siphon and developed an agreement with the Ward Irrigation District that ensured a minimum flow of 10 CFS is maintained for the life of the project in Lost Horse Creek. Project activities resulted in cooler water temperatures by increasing the flows in Lost Horse Creek. This project was funded by DEQ at $134,000, FWP at $102,850, DNRC at $100,000, USFWS at $60,000, and Columbia Basin Water Transactions program at $80,000.

57
SECTION 4: PROJECTS AT-A-GLANCE (EPA ELEMENTS #6 AND 7)
The following section summarizes BRWF’s restoration projects in terms of timelines and relevant project statistics. As new projects develop, information will be added to these charts.

58
4.1 Implementation Schedule For BRWF’s Past and Upcoming Projects
‘13 ‘14 ‘15 ‘16 ‘17 ‘18 ‘19 ‘20 ‘21 ‘22 ‘23
EAST FORK: Highway 93 Roadside riparian planting (section 3.4) CAMERON CREEK: Private land Livestock fencing for improved grazing (section 3.5) DORAN CREEK: Private land Riparian planting and shading (section 3.4)
BURNT FORK CREEK: Irrigation areas Inventorying and assessing irrigation diversions (section 3.10) CAMERON CREEK: Private land Riparian planting and shading (section 3.5) RYE CREEK and SLEEPING CHILD CREEK: USFS land Road decommissioning (section 3.6, 3.7) RYE CREEK: Private land Vegetation and bank stabilization (section 3.6) EAST FORK: Private land at Lazy J Cross Riparian planting and livestock fencing (section 3.4) MILLER CREEK: Oxbow Farm Riparian Planting and livestock fencing (section 3.12)
BITTERROOT RIVER: Skalkaho Bend Public Park Bank stabilization and revegetation (section 3.2) BITTERROOT RIVER: Stevensville Fishing Access Site Riparian revegetation (section 3.2) BURNT FORK CREEK: Private land Riparian revegetation and livestock fencing (section 3.10)
THREEMILE CREEK: Wilderness Management Area Fish passage (section 3.11) EAST FORK: USFS land Road decommissioning (section 3.4)
EDUCATION AND OUTREACH Project tours, community presentations, school programs (section 6)

59
4.2 Projects At-A-Glance: Upcoming Measurable Milestones
Location Restoration Strategy
Impairment or Beneficial Use Addressed
Schedule Lead Partners
Approx. Cost
Project Statistics
Bitterroot River at Skalkaho Bend (Section 3.2)
Riparian revegetation and vegetation- based bank stabilization
Temperature, Aquatic Life
2019-2021
BRWF $200,000 Revegetation on 1.8 acres, .3 stream miles improved, heavy public education activities
Bitterroot River at Stevensville FAS (Section 3.2)
Riparian revegetation
Temperature, Aquatic Life
2019-2020
BRWF, FWP
$49,500 Revegetation on .25 acres, heavy public education activities, .05 stream miles improved
Threemile WMA (Section 3.11)
Road upgrade; culvert replacement; fish passage
Sediment Aquatic Life
2019-2020
BRWF, FWP
$83,400 1 culvert upgraded, 1 bridge constructed, 1.7 miles road BMPs implemented, 2.5 miles Westslope Cutthroat habitat reconnected
North Burnt Fork Ranches (Section 3.10)
Riparian revegetation
Sediment Nutrients Aquatic Life Primary Contact Recreation
2019-2020
BRWF $61,025 .6 miles riparian fencing installed, 4.7 acres revegetated, .3 stream miles improved
South Valley Floodplain Creation in Bitterroot National Forest (section 3.4)
Road restoration
Sediment, Temperature, Aquatic Life, Alteration in Streamside or Littoral Vegetative Cover
2020 onward
BNF, BRWF
$56,480 Miles of road decommissioned TBD

60
SECTION 5: IMPLEMENTATION ASSISTANCE (EPA ELEMENT #4)
5.1 Technical Assistance
While BRWF does not have staff scientists or an official technical advisory committee, we do have an active Projects Committee and a network of local partners who provide technical assistance and guidance as needed during project selection, development, implementation, and monitoring. We will continue to routinely request technical assistance from the appropriate federal and state agencies and regional scientists.
Field Name Affiliation Role
Fisheries Biology Jason Lindstrom, Chris Clancy
FWP Project selection, development, implementation, and monitoring
Hydrology Andy Efta, Marilyn Wildey, Ed Snook
BNF Project selection and development
Natural Resource Conservation
Stacy Welling NRCS Project development
Natural Resource Conservation
Julie Ralston, Howard Eldredge, Kent Myers
BCD Project development and implementation
Soil Science Cole Mayn BNF Project selection and development
Water Quality Hannah Riedl DEQ Project selection, development, implementation, and monitoring
Restoration Project Design
Marisa Sowles and Tom Parker
Geum Environmental Consulting
Education and outreach, project design and implementation
Irrigation Al Pernichele Bitterroot Water Commissioner
Project selection and development
Agriculture and Ranching
Patrick Mangan MSU Extension Project selection and design

61
5.2 Financial Assistance
Because each management measure or restoration project will generally call for a different funding approach, we expect to use a wide range of funding sources to implement this WRP. Table 6.2 includes a partial list of potential funding sources.
Funding Source Types of Projects Funded
Applicable BRWF Projects Timeline
MT DEQ Section 319 Grants
Addressing NPS pollution and meeting TMDLs
Bitterroot River at Skalkaho Bend Stevensville FAS Burnt Fork Private Lands Restoration
App due in Fall, funding available in August
MT Soil and Water Conservation Districts Mini Grants
Education and outreach Small restoration efforts with educational component; Field trips
Spring
MT FWP Future Fisheries Improvement Program Grants
Benefiting fish Threemile WMA Road Restoration
Dec 1, June 1
USFS Partnership Grant Benefitting USFS resources
Ongoing
USFS RAC Protecting/enhancing water resources; education, trails, and roads projects
Projects in partnership with BNF; road and culvert work with Ravalli County; projects on private land that have a public benefit
Annually
NFWF 5 Star and Urban Waters Restoration Program
Developing community capacity to sustain local natural resources for future generations
February
MT DNRC Watershed Planning Assistance Grants
Watershed planning for conservation districts
Developing projects that bring neighbors together to complete work within a subwatershed
February, August, November
MT DNRC Renewable Resource Grant and Loan Program
Development, management, conservation, and preservation of renewable resources
Irrigation infrastructure projects in partnership with irrigation districts and/or Conservation District, County, or City
May 15 2020, 2022
BoR Cooperative Watershed Management Program Grants
Project planning and development, research, implementation of restoration projects
Outyear project planning; project development; irrigation and infrastructure working group
Nov 15 2019, every two years
Friends of Lee Metcalf Match for projects that improve habitat or water
Creekside Fencing on Burnt Fork Ranches
As requested

62
quality in the vicinity of Lee Metcalf National Wildlife Refuge
Bitterroot Audubon Society
Match for projects that improve avian habitats or populations
Riparian Revegetation at Skalkaho Bend Park
As requested
Volunteers In-kind match towards project implementation, monitoring, and maintenance
Volunteers have been key contributors
As requested

63
SECTION 6: EDUCATION AND OUTREACH (EPA ELEMENT #5)
An informed and involved watershed community is imperative for the success of watershed restoration
efforts. Projects and progress cannot be achieved without the support of local landowners; earning this trust
depends on understanding and trust in the restoration organization. This notion extends beyond the owners
of waterfront properties on which potential projects exist, and requires support from local community
members via volunteerism and financial contributions. The BRWF focuses on educating youth, providing
opportunities for young people to partake in educational activities and restoration projects as a way to
engage and inspire future stewards of our water resources.
Tool Education or Outreach Activity Timeline Approximate Cost
Approximate number of People Reached
Website + Social Media
Conveys watershed information to
the public. Includes all watershed
group information and current
activities.
Ongoing $400 per
month
Ranging from
500-800
sessions
quarterly
Newsletter Sent to landowners and donors to
inform them about current activities
and proposed projects, and includes
interesting news relevant to the
restoration efforts.
Twice per year
$4/recipient 700 biannually
Watershed Trailer
Set up at community events to showcase projects
When opportunities arise
$1000 per showing
Varies greatly
Bitterroot Conservation District Updates
Updates on current projects; request future projects
Monthly $200 per month
10 bimonthly
Tours Showcase completed projects and
highlight areas where work still
needs to be done to improve the
overall health of the watershed; to
educate about water in the region
Annually $1,500 per tour
20-50 people
Community Presentations
Draw attention to BRWF’s efforts in the watershed; Showcase completed projects to the public
When opportunities arise
$150 per presentation
Varies from 20-200 people
Field Trips Educate local students about water usage and management needs
One to two per year
$1,500 per trip
Varies from 30-200 students
Annual River Clean Up Event
Draw attention to BRWF’s efforts in the watershed; community unification
Annually $5,000 per year
Ranges from 125 - 200 community members

64
Earth Stewardship Program
Partner with several Bitterroot schools; connect students with natural resource professionals; encourage youth to explore local resource issues
Each school year
$7500 per year
Ranges from 150 - 225 students
Realtor Training
Partner with local Realtor Association to hold Continuing Education Credits focused on watershed and water issues
Annually $1750 per class
Ranges from 50-150 Realtors

65
SECTION 7: MONITORING AND EVALUATION (EPA Element #8, #9) Monitoring and evaluation plans will measure progress, assess maintenance needs, and track project
successes and failures.
7.1 Monitoring
The following table lists the monitoring methods restoration actors in the Bitterroot Watershed have used
in the past as well as methods that may expand monitoring capacities in the future. BRWF’s Projects
Committee develops project-specific monitoring plans and addresses data gaps in individual projects.
Monitoring activities include both baseline monitoring to evaluate current conditions, and effectiveness
monitoring to evaluate project impacts. All entities conducting monitoring should follow standardized
protocols so that results can be compared and progress towards goals tracked over time. Monitoring plans,
including coordinating with responsible entities, will be completed for each project during the planning
phase. Adaptive management—being aware of changing conditions and addressing them as better
information becomes available—will allow us to improve the process, prioritize projects, and revise the
WRP over time.
Parameter Monitoring Method Responsible Party Or Technical Lead
Primary Application
Temperature USGS Gaging Stations USGS Long-term trend monitoring
Temperature Loggers FWP, BNF, TU Long-term trend monitoring and project effectiveness evaluations
University of Montana graduate student temperature collection data
BRWF, students Long-term trend Monitoring and project effectiveness evaluations
Riparian cover analysis
(remote, using aerial
imagery)
DEQ Long-term trend monitoring
Streamside or Littoral Vegetative Cover
Photopoint monitoring77 BRWF, TU Project effectiveness evaluations
Plant community composition
BRWF Project effectiveness evaluations
Qualitative or semi-
quantitative monitoring of
weed species abundance and
USFS Project effectiveness evaluations
77 Representative photos will be used to show changes at a project site resulting from a specific habitat restoration activity, such as
riparian planting and/or fencing. A combination of photos from different vantage points will be taken to highlight overall conditions. These photos will be updated periodically to demonstrate changes at the site and gauge the effectiveness of restoration methods overtime. Photos will also be used as needed to document events or incidents that may require action (e.g., damage to a site caused by high water events or fire) or to highlight a specific sample point within a project area.

66
Parameter Monitoring Method Responsible Party Or Technical Lead
Primary Application
distribution
Greenline Assessments DEQ Project effectiveness evaluations and long-term trend monitoring
Sediment PIBO78 USFS Project effectiveness evaluations
Pebble counts DEQ, FWP, BNF Project effectiveness evaluations
WEPP: Roads Modeling79
BRWF Project effectiveness evaluations
Metals Water Quality Sampling DEQ, MBMG Project effectiveness evaluations and long-term trend monitoring
Nutrients Water Quality Sampling
DEQ, TU, BRPA Project effectiveness evaluations and long-term trend monitoring
Macroinvertebrate
assessments
FWP, BNF Project effectiveness evaluations and long-term trend monitoring
Flow Regime Gaging stations
USGS Long-term trend monitoring
Instantaneous discharge
measurements
DNRC, DEQ, FWP, TU
Project effectiveness evaluations
Groundwater-surface water
interaction
Montana Bureau of Mines and Geology
Long-term trend monitoring
78 PACFISH/INFISH Biological Opinion Effectiveness Monitoring Program (PIBO) Method: PIBO monitoring is an effectiveness
monitoring program with varied types of monitoring, including vegetation analysis, aquatic invasive inventorying, and instream monitoring, to determine changing aquatic conditions. 79 The Water Erosion Prediction Project (WEPP) model for roads is designed to predict runoff and sediment yield from roads,
compacted landing and skid trails, and compacted foot, cattle, or off-road vehicle trails. WEPP: Road modeling allows the user to specify the characteristics of the road by climate, addition of soil or gravel, road design and surface condition, ditch condition, and local topography. Roads modeling is used to calculate erosion and deposition to estimate the annual amount of sediment leaving the road.
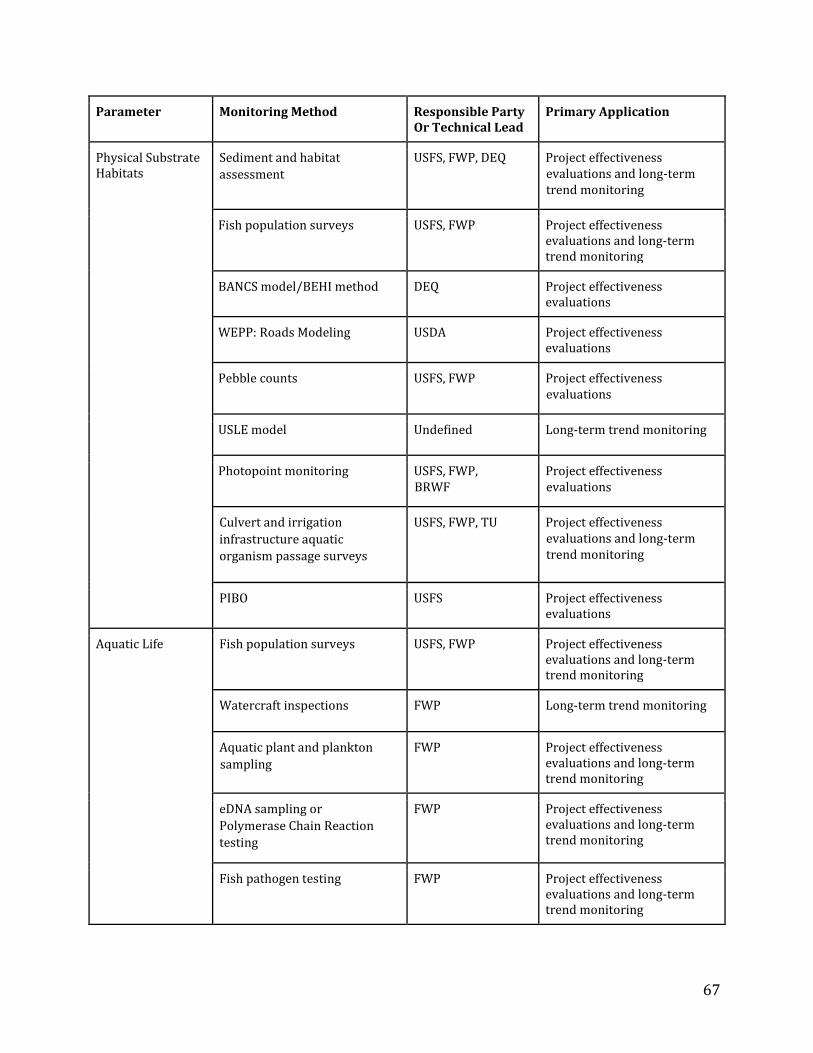
67
Parameter Monitoring Method Responsible Party Or Technical Lead
Primary Application
Physical Substrate Habitats
Sediment and habitat
assessment
USFS, FWP, DEQ Project effectiveness evaluations and long-term trend monitoring
Fish population surveys USFS, FWP Project effectiveness evaluations and long-term trend monitoring
BANCS model/BEHI method DEQ Project effectiveness evaluations
WEPP: Roads Modeling USDA Project effectiveness evaluations
Pebble counts USFS, FWP Project effectiveness evaluations
USLE model Undefined Long-term trend monitoring
Photopoint monitoring USFS, FWP, BRWF
Project effectiveness evaluations
Culvert and irrigation
infrastructure aquatic
organism passage surveys
USFS, FWP, TU
Project effectiveness evaluations and long-term trend monitoring
PIBO USFS Project effectiveness evaluations
Aquatic Life Fish population surveys USFS, FWP Project effectiveness evaluations and long-term trend monitoring
Watercraft inspections FWP Long-term trend monitoring
Aquatic plant and plankton
sampling
FWP Project effectiveness evaluations and long-term trend monitoring
eDNA sampling or
Polymerase Chain Reaction
testing
FWP Project effectiveness evaluations and long-term trend monitoring
Fish pathogen testing FWP Project effectiveness evaluations and long-term trend monitoring

68
Parameter Monitoring Method Responsible Party Or Technical Lead
Primary Application
Education Metrics tracking number of people reached at events, forums, presentations, etc.
BRWF Project effectiveness evaluations
Metrics tracking number of publications distributed
BRWF Project effectiveness evaluations

69
7.2 Criteria for Determining Success
This WRP will be updated every five years. In 2025 and during subsequent revision cycles, WRP priorities will be reviewed. Project data will be compiled and evaluated against these criteria to determine the success of these strategies and identify where changes in objectives are required. Goals and progress are provided for BRWF endeavors only.
Objective Criteria (Goal) Progress 2014-2019
Increase local access to watershed education through outreach at events and retention of contact information
Increased number of people participating in events, school education programs, tours (50%)
Increased number of people receiving newsletter and e-news (100%)
98% increase in participants
193% increase in recipients
Increase local participation and engagement in restoration activities
Increased number of participants in local restoration activities including revegetation projects, and River Clean Up (25%)
19% increase in project participants
34% increase in Clean Up participants
Trend of decreased stream temperature
Increased effective shade along priority streams (proxy for temperature) (1%)
Aggregate data not available80
Increased streamside vegetative cover
Native plants planted in riparian areas (15,000)
Survival rate of native plantings (75%)
7,779 plants
70%
Reduced sediment loading to sediment impaired streams
Sediment load reduction estimates (300 tons /year)
Miles of road improved (25 miles)
Road crossings improved (50 crossings)
Miles of streambanks improved (10 miles)
198.6 tons/year
20 miles
42 crossings
4.1 miles
Improved riparian habitat Miles of riparian fencing installed (10 miles)
Number of landowners participating in grazing management strategies (8 landowners)
4.8 miles
5 landowners
80 See DEQ’s Water Quality Standards Attainment Records and Riparian Evaluation and Wetland Priorities Results for stream-specific information.

70
APPENDIX A: O’BRIEN CREEK DATA
Reference Datum
To fundamentally assess O’Brien Creek, regionally based bankfull stream dimensions and local staff gage data provide important insight on basic healthy geomorphic and hydraulic functions for which stream surveys can be compared. Figure A.1 displays local relationships for stable channel conditions for a 25 sq. mi. Drainage area as well as discharge information at the current staff gage site at Blue Mountain road (USGS, 2004; Lolo National Forest, 1999; CFC, 2019). As displayed by bankfull discharge and measurements at the relatively stable staff gage site, O’Brien Creek fits local relationships; therefore measured stream dimensions and/or dimensionless ratios should be similar for stable conditions in equilibrium.
Bankfull Channel With (ft.)
Mean Bankfull Channel Depth (ft.)
Mean Bankfull Cross-sectional Area (sq. ft)
Bankfull Discharge
(CFS)
Western Montana (Mean annual basin precip. < 30 in.)
16.5 1.2 19.9 71.0
Lolo National Forest (mean annual
basin precip. 21”-31”)
No data No data No data 90
O’Brien Creek @ Blue Mtn. Rd staff gage
~12.5 ~1.5 18.8 74.2
Figure A.1: Relationships for bankfull channel dimensions for a 25 sq. mile watershed. O’Brien Creek fits local relationships; therefore, stable stream dimensions should be similar.

71
.
Figure A.2: 2019 June-October Stream Discharge; Staff gage at Blue Mtn. Rd.
Figure A.3: 2019 Discharge-stage rating curve on O’Brien Creek at Blue Mtn Rd.
1
2
3
4
5
6
7
81
8-J
un
22
-Ju
n
26
-Ju
n
30
-Ju
n
4-J
ul
8-J
ul
12
-Ju
l
16
-Ju
l
20
-Ju
l
24
-Ju
l
28
-Ju
l
1-A
ug
5-A
ug
9-A
ug
13
-Au
g
17
-Au
g
21
-Au
g
25
-Au
g
29
-Au
g
2-S
ep
6-S
ep
10
-Se
p
14
-Se
p
18
-Se
p
22
-Se
p
26
-Se
p
30
-Se
p
4-O
ct
8-O
ct
12
-Oct
16
-Oct
Ave
rage
Dai
ly D
isch
arge
(cf
s)
Date
O'Brien Creek at Blue Mountain Road 2019 Hydrograph
Average Daily Discharge Measured Discharge
y = 21.254x3.0823 R² = 0.9906
0
1
2
3
4
5
6
7
8
0 0.1 0.2 0.3 0.4 0.5 0.6 0.7 0.8
Dis
char
ge (
CFS
)
Stage Height (UNITS)
O'Brien Creek at Blue Mountain Road 2019 Rating Curve

72
In 2019, a general inventory of stream conditions and surveys were conducted on landowner-supported-private, county, and USFS land throughout the watershed (USFS, 2019). Stream reaches on the mainstem were delineated into the nine sections identified in Figure A.4, below (segments are labeled 1-9 from east to west - downstream to upstream).
Figure A.4. O’Brien Creek Stream Reach Delineations – 2019 Stream Data (USFS, 2019)
Based on the 2019 surveys and as displayed in reach descriptions, Figure A.5 provides a ranking by reach for highest non-point source sediment delivery, including ranking of active downcutting segments. Figure A.6 provides a map of the Contributing Sediment Source Survey for non-point source sediment pollution.
Highest to Lowest Sediment Delivery Risk
3 1 8 2 6 5 7 4 9
Highest to Lowest Incision Rates and Risk
2 1 3 8 6 5 7 4 9
Figure A.5: Reach Ranking for Highest Sediment Delivery and Incision Rates (USFS, 2019)
Figure A.6: Non-point source contribution sediment source map (USFS, 2019)

73
Reach 1 (R1) – Bitterroot Confluence to Blue Mountain Road
Reach 1 is characterized by high to very high bank erosion (Bank Erodibility Hazard Index, BEHI, estimates, USFS, 2019) and is approximately 400-600 feet in length (Bitterroot Confluence to Blue Mountain crossing). Previous stream rehabilitation structures (early 2000s era) are present with many failed or failing. This reach has very little pool habitat and appears to be in rapid state of degradation, incision, and bank erosion. The active stream channel is entrenched (bank height ratios are approximately 3 times mean bankfull depth) and there is little to floodplain connection in the lower reach – the majority of flood flows are forced within the active channel causing very high near-bank stress during high flow events. As importantly, the land loss associated with stream bank failure is high within this stretch of private land.
Reach 1 is in immediate need of remediation and undoubtedly is contributing excessive sediment loads to the Lower Bitterroot River. Equally of focus is the lack of opportunity for cold-water fisheries refugia from warm summer Bitterroot stream temperatures that could be afforded by the relatively cold stream temperature of O’Brien Creek, if this section provided appropriate deep pool habitat, healthy streambanks, and dense streamside vegetation. With progressive rehabilitation design and implementation, this reach could substantively contribute to fisheries habitat within the reach and provide much improved connectivity for fish movement to the upper watershed.
Figure A.7: Reach 1 – Typical stream condition in reach immediately upstream of Bitterroot River

74
Figure A.8 displays channel measurements with several that vary substantively from desired stable conditions (Avg. width is 13 ft. with variation of 7.1 feet between minimum and maximum; Cross-sectional area available for normal high runoff averages 21.7 sq. ft. and varies up to 43% (highlighted red text represent undesired deviation from stable conditions). Thirty-five pieces of LWD and one aggregate log jam was counted, indicating that previous rehabilitation activities utilized wood and/or the Blue Mountain road-stream crossing is facilitating wood transport.
Active Channel
Width (ft)
Max Active Channel
Depth (ft)
Approx. Cross-
Sectional Area (sq. ft)
Est. Bank Height Ratio (Bank Ht/Channel
Depth- photo scaled, no meas.)
Entrenchment Ratio (Floodprone Area
Width/Channel Width)
13.1 1.9 24.9 ~3 2.0
16.4 1.9 31.1 ~3 2.3
10.2 1.3 13.2 ~3 2.1
9.6 2.2 21.1 ~2 >3.0
16.7 1.1 18.4 ~2 3.1
Stable Regional
Average 16.5
Stable Regional
Average 1.2
Stable Regional
Average 19.9
Rosgen B<1.5 typ. Rosgen C <1.5 typ.
(Rosgen, 1999)
Rosgen B (1.4-2.2) Rosgen C (>2.2) (Rosgen, 1996)
Figure A.8: Reach 1 - Active channel measurements and comparison to stable channel averages
Reach 1 Summary: Significant departure from stable bankfull conditions (values in red, Figure A.8 above), high bank erosion and land loss, channel incision, active head-cutting, loss of floodplain connectivity, lack of dense riparian vegetation, lack of pool habitat.
Reach 2 (R2)– Blue Mountain Road to O’Brien Meadow Subdivision Crossing
Reach 2 consists of the segment between Blue Mountain Road and the road crossing accessing O’Brien Meadow Subdivision. The crossing at the lower end of the reach at Blue Mountain Road is a 20’ wide concrete structure (Figure A.9). Stream substrates exist continuously throughout the structure, indicating that fish passage is likely possible at most flows. Additional morphologic assessment is necessary to determine an appropriate bankfull width; however, a reasonable estimate is 12-14 ft. As such, the road crossing span is likely meeting typical stream-simulation design criteria to accommodate at least the bankfull width. Flooding freeboard to accommodate large debris and bedload during large floods may be compromised. (Figure A.10).

75
Figure A.9. Road crossing of O’Brien Creek at Blue Mountain Road and bank failure immediately upstream.
Reach 2 is actively incising upstream of the Blue Mountain Road with significantly undersized channel capacity. Because of the low stream widths, stream depths are deeper and holding some fish.
Figure A.10. Road crossing to O’Brien Creek Meadow Subdivision and critically undersized and actively downcutting segment downstream of the subdivision crossing and upstream of Blue Mtn. Rd.
Stream dimensions were surveyed and displayed in Figure A.11. below. Dimensions are indicative of unstable stream conditions (red highlight), as indicated by variability and departure from regional stable averages.
Active Channel
Width (ft)
Max Active Channel
Depth (ft)
Approx. Cross-
Sectional Area (sq. ft)
Est. Bank Height Ratio (Bank Ht/Channel
Depth- photo scaled, no meas.)
Entrenchment Ratio (Floodprone Area
Width/Channel Width)
13.6 1.4 19.0 ~1 3.3

76
8.5 1.6 15.7 ~2 1.8
7.5 1.5 13.2 ~2 1.8
7.7 1.6 20.8 ~2 2.7
Stable Regional
Average 16.5
Stable Regional
Average 1.2
Stable Regional
Average 19.9
Rosgen B<1.5 typ. Rosgen C <1.5 typ.
(Rosgen, 1999)
Rosgen B (1.4-2.2) Rosgen C (>2.2) (Rosgen, 1996)
Figure A.11: Reach 2 - Active channel measurements and comparison to stable channel averages.
Reach 2 Summary: Significant departure from stable bankfull conditions (values in red, Table X above), high bank erosion and land loss, channel incision, active head-cutting, loss of floodplain connectivity, lack of dense riparian vegetation, lack of pool habitat.
Reach 3 (R3) – O’Brien Meadow Subdivision Crossing to Next Upstream Road Crossing
This reach starts at the road crossing accessing O’Brien Creek Meadow Subdivision. The culvert here is a 9.6’ round culvert. Stream substrates exist throughout the culvert and fish passage is likely achieved at most flows, but should be verified. Discharge from an irrigation ditch enters through a culvert immediately downstream of the crossing.
This reach is characterized by variability, substantive instability, and like Reach 1 and 2, recently accelerated downward trend in channel condition. Immediately upstream of the O’Brien Meadow crossing, one segment is critically undersized where cottonwood trees encroach the channel, leaving widths as narrow as 5-6 ft. with active incision. Within 200 ft. of the undersized channel segment, a massive bank failure site exits (Figure A.13). In 2019 alone, estimates of sediment loads were 12-15 dump truck loads, causing large-scale channel deposition and avulsion. Bank failure has occurred previous to 2019.
After the massive bank failure in 2019, the O’Brien Creek Meadow HOA was granted a two-phased 310 permit by Missoula Conservation District to conduct emergency actions to remove the substrate deposition without disturbing streambanks and returning wood to the channel (completed in 2019), then perform follow-up channel rehabilitation to restore adequately configured channel and floodplain dimension to reduce or eliminate the need for future maintenance. The second phase rehabilitation effort is awaiting funding for design and rehabilitation.
The upper segments of Reach 3 have 15-20 ft. channel widths. Head-cutting and incision is active in some segments, although others have floodplain connectivity. While the majority of this segment appears overly straight (needs assessment and verification), several high curvature bends exist. Another mass failure site and approximately 240 feet of bank erosion exists at the upper end of this reach. Old beaver chews were noted.
Active Channel
Width (ft)
Max Active Channel
Depth (ft)
Approx. Cross-
Sectional Area (sq. ft)
Est. Bank Height Ratio (Bank Ht/Channel
Depth- photo scaled, no meas.)
Entrenchment Ratio (Floodprone Area
Width/Channel Width)
12.1 1.9 23.0 1-1.2 >8.3
14 1.2 16.8 1.2 2.8
6** 1.5** 9.0** -- --
12 1.5 18.0 2 1.4 entrenched
11.9 1.7 20.2 2 1.1 entrenched
10.6 1.4 14.8 2 1.1 entrenched

77
Stable Regional
Average 16.5
Stable Regional
Average 1.2
Stable Regional
Average 19.9
Rosgen B<1.5 typ. Rosgen C <1.5 typ.
(Rosgen, 1999)
Rosgen B (1.4-2.2) Rosgen C (>2.2) (Rosgen, 1996)
*double line indicates boundary starting entrenched stretch **Measured separately from reconnaissance survey. This is the critically constricted channel section approximately 200 ft. downstream of the massive bank failure site (photo below).
Figure A.12: Reach 3 - Active channel measurements and comparison to stable channel averages.
Figure A.13. Reach 3 - undersized segment, incision, bank erosion/land loss, and massive bank failure.
Reach 3 Summary: Significant departure from stable bankfull conditions. Massive bank failure, land loss, and
sediment loading. 2019 Short-term remediated avulsion; channel incision, active head-cutting, loss of
floodplain connectivity, instream wood loss, variable riparian vegetation density, lack of pool habitat.
Reach 4 (R4) – O’Brien Ck Road Crossing No. 3 to Road Crossing No. 4
Reach 4 is all private property along O’Brien Creek Road. Above the crossing at the upstream end, the stream transitions from the right to the left valley wall. From the road, the stream appears moderately entrenched with little instream wood or pool habitat. A lawn exists on both banks in one section with a footbridge. Before the road turns to gravel, no marked aggradation or erosion could be seen. More reconnaissance is needed to verify conditions.

78
Figure A.14: Reach 4 - Pasture and maintained lawn section.
Reach 4 Summary: Riparian vegetation, instream wood, and pool habitat appear lacking. Land loss and sediment delivery does not appear substantive, but assessment is needed to verify.
Reach 5 (R5) – O’Brien Creek Road Crossing No. 2 to Lower Forest Service Boundary
Reach 5 extends above private property along the gravel portion of O’Brien Creek Road until the first boundary with Forest Service land. At the downstream end, two culvert crossings can be observed from the road and appear undersized. About 400 ft. is located adjacent to the road fill. The stream is well shaded with some large instream wood and pools. Near the Forest Service boundary, the stream runs along the right valley wall in an old road bed. There is little to no riparian vegetation in one pasture segment and the left bank was eroding with slumping banks, land loss, and over-widened and shallow stream channel.
Figure A.15. Reach 5 – Private Land to Forest Service, public land boundary.
Reach 5 Summary: Lack of riparian vegetation in some segments with bank erosion and land loss present. One segment is substantively over-wide and shallow.
Reach 6 (R6) - USFS Section above Private Land
Reach 6 is an approximately 640 foot beginning just upstream of the boundary between private and USFS. Evidence of beaver was noted, but there were no dams. Approximately 75 feet of the left bank is adjacent to the road. The creek area near the trailhead is heavily used by recreationists with a user created trail and bridge over the creek. Pool habitat is limited. Erosive banks are prevalent with heights up to 4 t. At least
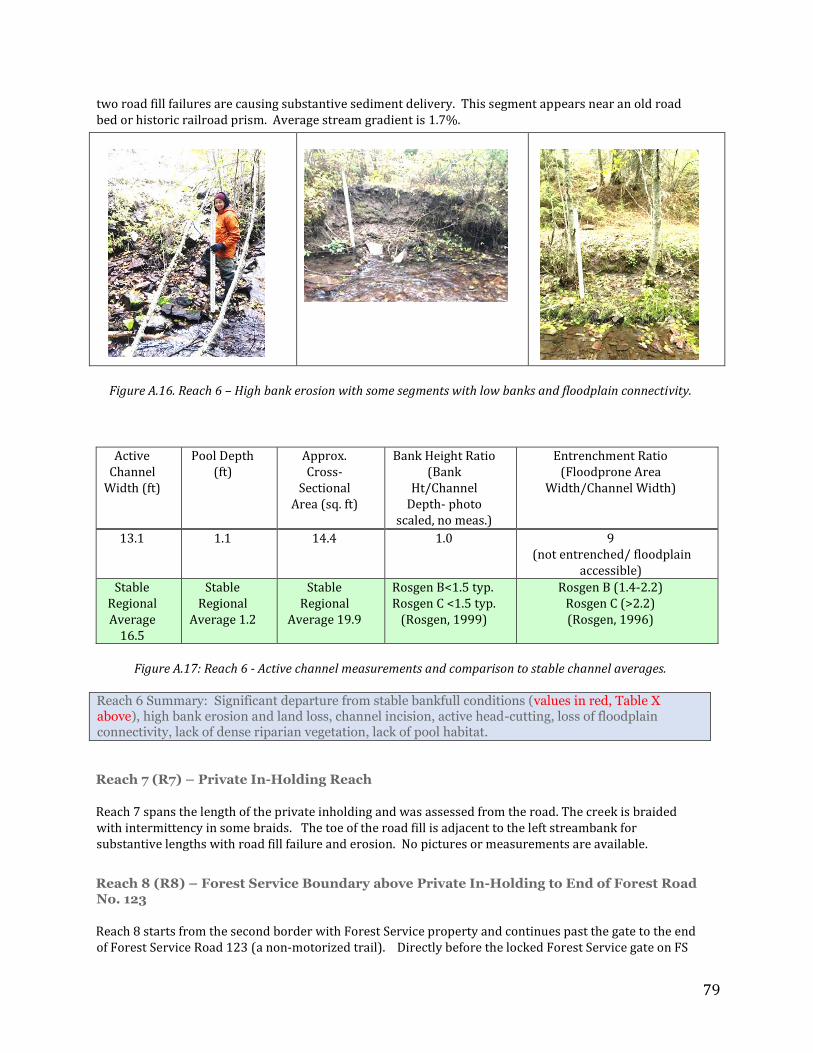
79
two road fill failures are causing substantive sediment delivery. This segment appears near an old road bed or historic railroad prism. Average stream gradient is 1.7%.
Figure A.16. Reach 6 – High bank erosion with some segments with low banks and floodplain connectivity.
Active Channel
Width (ft)
Pool Depth (ft)
Approx. Cross-
Sectional Area (sq. ft)
Bank Height Ratio (Bank
Ht/Channel Depth- photo
scaled, no meas.)
Entrenchment Ratio (Floodprone Area
Width/Channel Width)
13.1 1.1 14.4 1.0 9 (not entrenched/ floodplain
accessible)
Stable Regional Average
16.5
Stable Regional
Average 1.2
Stable Regional
Average 19.9
Rosgen B<1.5 typ. Rosgen C <1.5 typ.
(Rosgen, 1999)
Rosgen B (1.4-2.2) Rosgen C (>2.2) (Rosgen, 1996)
Figure A.17: Reach 6 - Active channel measurements and comparison to stable channel averages.
Reach 6 Summary: Significant departure from stable bankfull conditions (values in red, Table X above), high bank erosion and land loss, channel incision, active head-cutting, loss of floodplain connectivity, lack of dense riparian vegetation, lack of pool habitat.
Reach 7 (R7) – Private In-Holding Reach
Reach 7 spans the length of the private inholding and was assessed from the road. The creek is braided with intermittency in some braids. The toe of the road fill is adjacent to the left streambank for substantive lengths with road fill failure and erosion. No pictures or measurements are available.
Reach 8 (R8) – Forest Service Boundary above Private In-Holding to End of Forest Road No. 123
Reach 8 starts from the second border with Forest Service property and continues past the gate to the end of Forest Service Road 123 (a non-motorized trail). Directly before the locked Forest Service gate on FS

80
Road No. 123, a large road failure is actively slumping into O’Brien Creek. As of early October 2019, the dimensions of the sediment contribution from the slump were measured to be 54 x 6 x 6.2 ft (approximately 2,678 ft3). A newly fallen tree and road sign was in the stream. Parking is limited to one car, with 12 ft. road width and user-created turnaround off.
Figure A.18: Reach 8 – significant bank erosion section along streamside Forest Road. No. 123.
Above the upper Forest Service gate, Road No. 123, an old bridge crosses O’Brien Creek to decommissioned Road No. 19244. The bankfull width here is 10.2 feet. The bridge appears unsound with over widening at the inlet. Negative road and stream interactions continue upstream for several hundred feet with many road fill failures, bank erosion, and high sediment deliveries.

81
Figure A.19: Road 123 (non-motorized trail) – Reach 8 – High erosive banks caused from likely historic channel manipulation and recovering stream adjustments.
Reach 8 Summary: Significant departure from stable bankfull conditions, high bank erosion and land loss, channel incision, active head-cutting, loss of floodplain connectivity, lack of dense riparian vegetation, lack of pool habitat.
Reach 9 (R6) – End of Road Reach to Major Scree Slope on North Side of Valley
Reach 9 is a 600 ft. reach beginning at the end of Road No. 123 and ending just downstream of the major scree-slope and spring on the north valley wall. The stream goes dry for a section above this reach where the valley narrows. Erosive, high banks are typical of the reach. Some meander bends exist, resulting in deep pools. A short portion of the stream in this reach runs in an old road bed (perhaps old rail line). The slope of the entire reach was 2.7%.
This section is the first section of relatively good fish habitat formed by small diameter wood and many more pools than lower reaches. Large fish have been observed. Within approximately one mile upstream of the scree slope, previous stream reconnaissance discovered what appears to be the upper extent of historic channel manipulation evidenced by forested, canal-like structure adjacent to the stream.
More reconnaissance is needed, but it is currently thought that this section is the upper most historic channel disturbance with all channel stability beginning at the old canal-like structure and extending to the confluence with the Bitterroot River. Channel aggradation also occurs in this reach with high sediment sources originating from bank erosion.

82
Active Channel Width (ft)
Pool Depth (ft)
Approx. Cross-Sectional Area (sq. ft)
Bank Height Ratio (Bank Ht/Channel Depth- photo scaled, no meas.)
Entrenchment Ratio (Floodprone Area Width/Channel Width)
14.8 1.2 17.8 ~2 No meas.
Stable Regional Average
16.5
Stable Regional
Average 1.2
Stable Regional
Average 19.9
Rosgen B<1.5 typ. Rosgen C <1.5 typ.
(Rosgen, 1999)
Rosgen B (1.4-2.2) Rosgen C (>2.2) (Rosgen, 1996)
Figure A.20: Reach 9 - Active channel measurements and comparison to stable channel averages.
Figure A.21: Reach 9 – Bank erosion and aggradation present. Pool habitat and stream dimensions are more
representative of stable channel conditions.
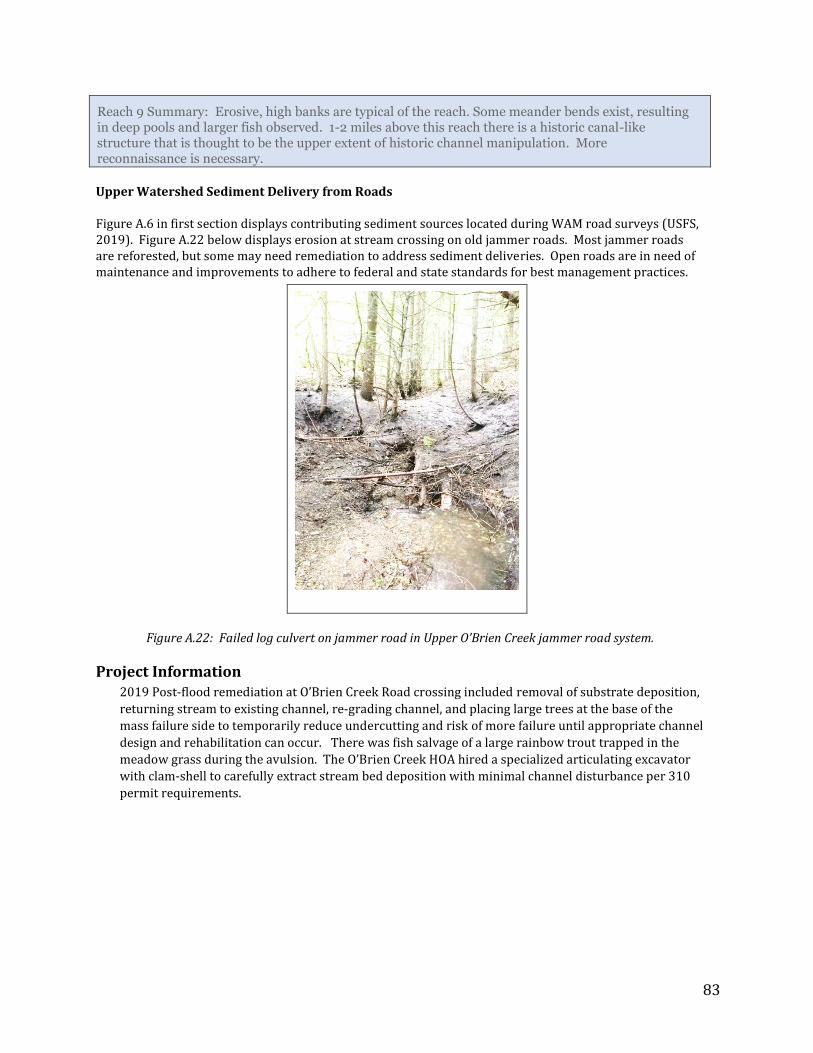
83
Reach 9 Summary: Erosive, high banks are typical of the reach. Some meander bends exist, resulting in deep pools and larger fish observed. 1-2 miles above this reach there is a historic canal-like structure that is thought to be the upper extent of historic channel manipulation. More reconnaissance is necessary.
Upper Watershed Sediment Delivery from Roads
Figure A.6 in first section displays contributing sediment sources located during WAM road surveys (USFS, 2019). Figure A.22 below displays erosion at stream crossing on old jammer roads. Most jammer roads are reforested, but some may need remediation to address sediment deliveries. Open roads are in need of maintenance and improvements to adhere to federal and state standards for best management practices.
Figure A.22: Failed log culvert on jammer road in Upper O’Brien Creek jammer road system.
Project Information 2019 Post-flood remediation at O’Brien Creek Road crossing included removal of substrate deposition,
returning stream to existing channel, re-grading channel, and placing large trees at the base of the
mass failure side to temporarily reduce undercutting and risk of more failure until appropriate channel
design and rehabilitation can occur. There was fish salvage of a large rainbow trout trapped in the
meadow grass during the avulsion. The O’Brien Creek HOA hired a specialized articulating excavator
with clam-shell to carefully extract stream bed deposition with minimal channel disturbance per 310
permit requirements.
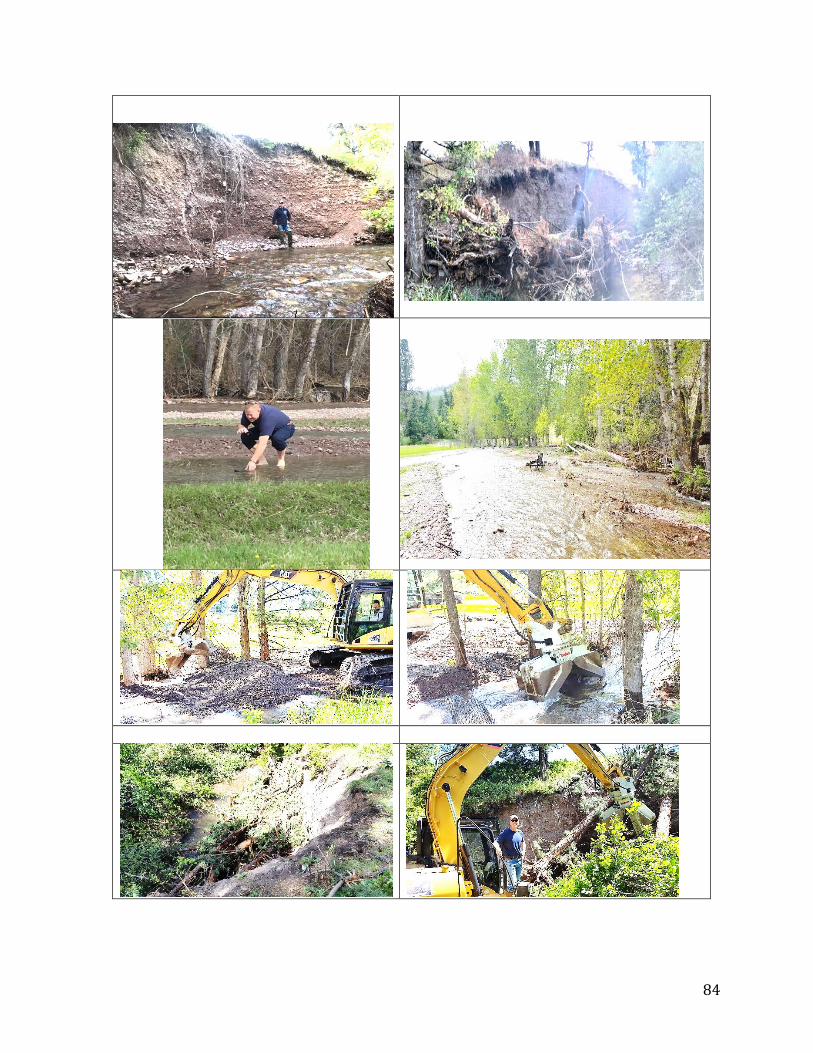
84

85
Figure A.23. Reach 3 - 2019 Emergency Channel Remediation conducted by O’Brien Creek HOA with tree
donation from Hillsdale Estates. Mass failure and temporary remediation with large tree toe protection;
salvage of large rainbow trout and macroinvertebrates.
Appendix A References
1. Crawford, C. Personnel communication. O’Brien Creek para-historian research in preparation for
publication. Missoula, MT.
2. MT FWP. Personnel communication with Ladd Knotek on O’Brien Creek importance to fishery. Montana
Fish, Wildlife, and Parks, Region 2, Missoula, MT [2019]
3. O’Brien Creek Meadow HOA. Personal communication and stream remediation photos. O’Brien Creek
Meadow Subdivision, Missoula, MT. [2019]
4. Rosgen, D. Applied Fluvial Geomorphology. Wildland Hydrology. Pagosa Springs, CO. [1996]
5. USFS. Unpublished bankfull discharge curves. Lolo National Forest, Missoula, MT. [1999]
6. USFS. Unpublished O’Brien Creek Reconnaissance and Stream Survey. Missoula Ranger District, Lolo
National Forest, Missoula, MT. [2019]
7. USFS WAM. Wildfire Adapted Missoula, Planning and Public Engagement. Missoula Ranger District, Lolo
National Forest, Missoula, MT. [2019]
8. USGS. Determination of Channel-Morphology Characteristics, Bankfull Discharge, and Various Design-Peak
Discharges of Western Montana. Scientific Investigations Report 2004-5263 [2004]

86
APPENDIX B: GLOSSARY OF TERMS AND ABBREVIATIONS
Alluvial: relating to, composed of or found in alluvium.
Alluvium: clay, silt, sand, or gravel deposited by running water
Anthropogenic: caused or produced by humans
Belt Series: major division of late Precambrian rocks in North America
BoR: Bureau of Reclamation
BMP: “Best Management Practices” are measures taken to reduce water pollution. For example, installing a silt fence during construction is a BMP to reduce sediment transported to a water body (river, lake, stream, ocean).
BNF: Bitterroot National Forest
BRWF: Bitter Root Water Forum
Confluence: The meeting of two or more bodies of water.
CFC: Clark Fork Coalition, a nonprofit that works to protect and restore water quality throughout the Clark Fork River basin.
DEQ: the “Montana Department of Environmental Quality” is a government agency in the executive branch state of Montana with a mission to protect, sustain, and improve a clean and healthful environment to benefit present and future generations.
DNRC: The “Montana Department of Natural Resources and Conservation” provides leadership in the management of state’s natural resources and promotes stewardship of Montana's water, soil, forest, and rangeland resources.
EPA: The “United States Environmental Protection Agency” is an agency of the U.S. government created for the purpose of protecting human health and the environment.
FWP: Montana “Fish, Wildlife & Parks” is a government agency in the wildlife, and state-owned park resources in Montana for the purpose of providing recreational activities.
Glaciated: an area that is or has been covered in glaciers or ice sheets.
HOA: Homeowners Association
Load reductions: A decrease in the amount of pollution released.
Metamorphosis: rocks formed by heat and pressure causing physical or chemical change.
Metasedimentary: sedimentary rock altered by metamorphosis.
Nitrogen: is a common chemical element required by living organisms. Too much nitrogen in streams can cause excessive algal growth.
Nonpoint Source Pollution (NPS): pollution from diffuse sources, as opposed to “Point Source Pollution” that comes from a single, identifiable source.
87
Nutrient: A nutrient is a substance that an organism needs to live and grow. Common nutrients considered in stream ecosystems include nitrogen, phosphorous, and carbon.
NRCS: the “Natural Resource Conservation Service” formerly known as the Soil Conservation Service (SCS), is an agency of the United States Department of Agriculture (USDA) that provides technical assistance to farmers and other private landowners and managers.
Phosphorous: is a common chemical element required by living organisms. Too much phosphorous in streams can cause excessive algal growth.
RAC: a “Resource Advisory Committee” is a committee developed as part of the Secure Rural Schools Act, which decides on local community collaboration with federal land managers in recommending Title II projects on federal lands or that will benefit resources on federal lands.
Restoration: the return of a landscape, ecosystem, or other ecological entity to a predefined historical state.
Riparian: is the interface between land and a river or stream.
Sediment loading: sediment transported by a water body.
Silviculture: the growing and cultivation of trees
TMDL: A “Total Maximum Daily Load” is a regulatory term in the U.S. Clean Water Act, describing the maximum amount of a pollutant that a body of water can receive while still meeting water quality standards.
TU: Trout Unlimited, a nonprofit that works to protect critical habitat, to reconnect degraded waterways, and restore populations to coldwater fisheries.
Subbasin Plan: Bitterroot Subbasin Plan for Fish and Wildlife Conservation, a basin-wide plan identifying biological objectives and strategies to protect, mitigate, and enhance fish and wildlife populations within the Bitterroot watershed.
Substrate: Earthly material that exists on the bottom of a riverbed, often dirt, rocks, sand, or gravel.
Tributaries: a stream or river that flows into a larger water body (river, lake, stream, ocean).
USGS: The “United States Geological Survey” is a scientific agency of the United States government. The scientists of the USGS study the landscape of the United States, its natural resources, and the natural hazards that threaten it.
Watershed: All of the land which drains precipitation in the form of rain or snow to a specific point.
Wetlands: A wetland is an area of the landscape that is inundated or saturated by surface or groundwater and supports vegetation adapted for life in saturated soil conditions. Wetlands generally include swamps, marshes, bogs and similar areas.