addressing lakes in watershed restoration and … · wraps watershed restoration and protection...
TRANSCRIPT
Addressing Lakes in Watershed Restoration and Protection Strategies
Lakes in WRAPS Guidance
April 2014
Minnesota Pollution Control Agency 520 Lafayette Road North | Saint Paul, MN 55155-4194 | www.pca.state.mn.us | 651-296-6300
Toll free 800-657-3864 | TTY 651-282-5332
This report is available in alternative formats upon request, and online at www.pca.state.mn.us
Document number: wq-iw1-48
The MPCA is reducing printing and mailing costs by using the Internet to distribute reports and information to wider audience. Visit our website for more information.
MPCA reports are printed on 100% post- consumer recycled content paper manufactured without chlorine or chlorine derivatives.
This document is a product of the MPCA Lakes Lateral Team. The team membership as of October 2013 is listed below.
MPCA Lakes Lateral Team Patrick Carey [email protected]
John Erdmann [email protected]
Karen Evens [email protected]
Steven Heiskary [email protected]
John Hensel* [email protected]
Tim James [email protected]
Scott MacLean** [email protected]
Chuck Regan [email protected]
Dereck Richter [email protected]
Greg VanEeckhout [email protected]
* Team Lead 2012-2013 ** Current Team Lead
Valuable input and review were provided by MPCA staff in the Environmental Analysis and Outcomes Division and Regional Division. The Minnesota Department of Agriculture and several Minnesota Department of Natural Resources staff provided valuable comments.
Table of contents MPCA Lakes Lateral Team ................................................................................................................ 2
Acronyms .................................................................................................................................... 2
Introduction ................................................................................................................................ 1
MPCA watershed approach: Restore and protect waters in Minnesota ................................... 2
Addressing lakes in WRAPS .............................................................................................................. 4
Importance of protection in watershed projects ............................................................................ 4
Technical approach for lakes ...................................................................................................... 5
Introduction to Technical Approach ................................................................................................ 5
Using HSPF watershed model results. ............................................................................................. 6
Lake water quality modeling. ........................................................................................................... 7
End goal – Best management practice implementation ................................................................. 8
Summary and conclusion ................................................................................................................. 8
Appendix A .................................................................................................................................. 9
Technical Details for Developing WRAPS Reports ........................................................................... 9
Notes on HSPF calibration. .............................................................................................................. 9
Data needed for lake studies in WRAPS. ....................................................................................... 10
Use of Areal Loading Data. ............................................................................................................. 11
Value of pour point monitoring. .................................................................................................... 13
Lake data tables. ............................................................................................................................ 13
Appendix B ................................................................................................................................ 15
Resources for Lake Restoration and Protection Efforts in Minnesota .......................................... 15
References ................................................................................................................................ 19
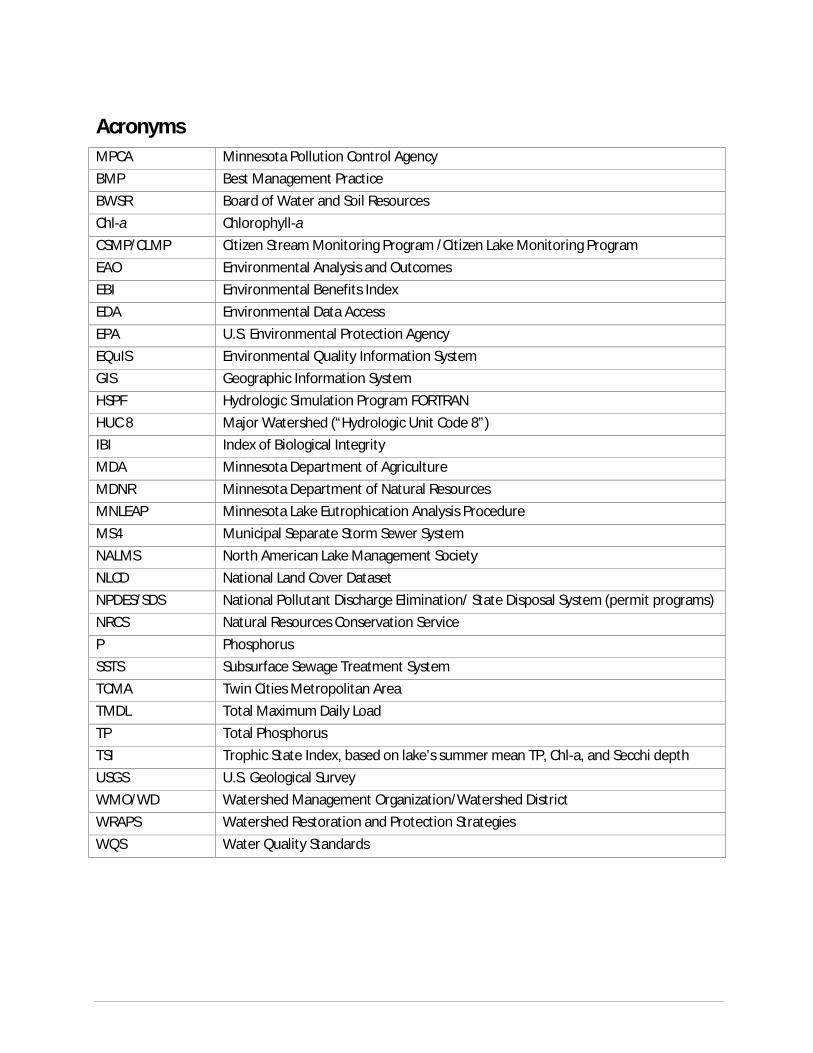
Acronyms MPCA Minnesota Pollution Control Agency BMP Best Management Practice BWSR Board of Water and Soil Resources Chl-a Chlorophyll-a CSMP/CLMP Citizen Stream Monitoring Program /Citizen Lake Monitoring Program EAO Environmental Analysis and Outcomes EBI Environmental Benefits Index EDA Environmental Data Access EPA U.S. Environmental Protection Agency EQuIS Environmental Quality Information System GIS Geographic Information System HSPF Hydrologic Simulation Program FORTRAN HUC 8 Major Watershed (“Hydrologic Unit Code 8”) IBI Index of Biological Integrity MDA Minnesota Department of Agriculture MDNR Minnesota Department of Natural Resources MNLEAP Minnesota Lake Eutrophication Analysis Procedure MS4 Municipal Separate Storm Sewer System NALMS North American Lake Management Society NLCD National Land Cover Dataset NPDES/SDS National Pollutant Discharge Elimination/ State Disposal System (permit programs) NRCS Natural Resources Conservation Service P Phosphorus SSTS Subsurface Sewage Treatment System TCMA Twin Cities Metropolitan Area TMDL Total Maximum Daily Load TP Total Phosphorus TSI Trophic State Index, based on lake’s summer mean TP, Chl-a, and Secchi depth USGS U.S. Geological Survey WMO/WD Watershed Management Organization/Watershed District WRAPS Watershed Restoration and Protection Strategies WQS Water Quality Standards
Addressing Lakes in Watershed Restoration and Protection Strategies • April 2014 Minnesota Pollution Control Agency
1
Introduction The purpose of this document is to provide process guidance and structure for lakes in the Minnesota Pollution Control Agency (MPCA) Watershed Approach. Whereas the technical framework has been developed for streams in fair detail, the framework for lakes has not. This document aims to develop an approach for integrating lakes into major watershed projects. As such, this document serves as a supplement to the 2007 lake protocol document (MPCA, 2007). The guidance document was completed in consultation with the other state agencies that are collaborating in the Water Quality Framework.
Knowledgeable watershed experts, project managers, local resource leaders and master contractors should find the information helpful. The document is structured into four major sections: a general discussion about the watershed approach and a discussion of lakes within that approach, a technical discussion to define the various data requirements and lake modeling approaches, brief comments on usefulness in implementation plan and Best Management Practices (BMP) development, and finally, two very extensive appendices that provide more detail on lake data and modeling and a list of tools to benefit BMP implementation.
Addressing Lakes in Watershed Restoration and Protection Strategies • April 2014 Minnesota Pollution Control Agency
2
MPCA watershed approach: Restore and protect waters in Minnesota The MPCA is actively implementing a watershed approach for the restoration and protection of Minnesota’s waters. This approach incorporates monitoring and assessing Minnesota’s waters on a 10-year cycle and integrates MPCA water resource management efforts in cooperation with state and local governments and stakeholders. This allows for coordinated development and implementation of water quality restoration and improvement projects, with the goal being restoration and protection of Minnesota’s waters. An important goal of the MPCA watershed approach is integrating protection and restoration needs into a single management plan. Such plans are specifically identified as a funding priority for the Board of Water and Soil Resources (BWSR). BWSR will fund projects that are consistent with an approved Total Maximum Daily Load (TMDL) implementation plan or current watershed management plan that is state approved and locally adopted. Furthermore, the Clean Water Partnership appropriation language for the state 2010-2011 biennium and for the Clean Water Fund established in 2009, further guides the MPCA that “priority shall be given for those projects preventing impairments and degradation of Minnesota waters in accordance with Minnesota Statues 114D.20 subd.2, Clause (4)”.
In areas of Minnesota outside of the Seven County Metropolitan Area (TCMA), Minnesota’s watershed approach is scaled to major watersheds, designated by Hydrologic Unit Code 8, or “HUC-8” for short. The state encompasses all or parts of 81 HUC-8s. Each of these will have a Watershed Restoration and Protection Strategies (WRAPS) process with a 10-year updating schedule. Within the TCMA, the MPCA WRAPS process follows the approach used by BWSR and scales the watershed approach to the size of the Watershed Management Organization/Watershed District (WMO/WD), currently 33 in the TCMA, and incorporates this information into its watershed management plan (Minnesota Rules Chapter 8410). However, actual water quality sampling remains on the HUC-8 schedule.
This approach has four main steps: Step 1: Monitor and gather data and information
The MPCA will perform extensive watershed monitoring on a 10 year cycle. This schedule allows for intensive monitoring of streams and lakes within each major watershed to determine overall health of the water resources, identify impaired waters, and identify and prioritize those waters in need of additional protection to prevent future impairments. In the year prior to starting major watershed monitoring, Environmental Analysis and Outcomes (EAO) staff work with watershed project managers to define the list of lakes to be monitored. A preliminary list is reviewed in early summer and finalized by September. Current and previous monitoring data and ancillary data such as land use, topography, soils, and assessment of pollution sources is included in this analysis. The monitoring plan should allow for comprehensive assessment of all priority water bodies and determine priority protection needs. In this step, most of the water quality data collection is the responsibility of the MPCA EAO staff and local partners – i.e., soil and water conservation districts, municipalities, watershed districts, local units of government, state and federal agencies, citizen organizations and private landowners. Whenever possible, CSMP/CLMP volunteers should be sought to collect weekly transparency readings during the assessment cycle and into the future.
Step 2: Assess the data
Based on the results of intensive watershed monitoring, MPCA staff and partners conduct a rigorous process to determine whether or not water resources meet water quality standards (WQS) and designated uses. Waters that do not meet water quality standards are listed as impaired waters. The MPCA staff and partners will also evaluate the results of the intensive watershed monitoring to determine if particular lakes or streams require additional protection to prevent future impairments. The assessment step is primarily the responsibility of EAO staff, with assistance from local partners. In future lake assessments, an Index of Biological Integrity (IBI) specifically designed for lakes will also be
Addressing Lakes in Watershed Restoration and Protection Strategies • April 2014 Minnesota Pollution Control Agency
3
applied. The Minnesota Department of Natural Resources (MDNR) is developing the lake IBI in collaboration with the MPCA.
Step 3: Establish WRAPS
Based on the watershed assessment, a WRAPS report will be developed, which includes a TMDL study, TMDL implementation strategies for impaired waters, and protection study and implementation strategies for waters needing additional protection to prevent future water quality impairments. This overall watershed strategy will be developed in close cooperation with local partners and stakeholders and incorporate existing local water plans and water body studies. The purpose of this strategy is to prioritize implementation activities necessary to return currently impaired water bodies to compliance with water quality standards and prevent future impairments to those lakes and streams identified as requiring additional protection. Watershed Division staff, with support from local partners, are primarily responsible for this step.
Step 4: Implement water quality activities
Implementation of recommendations in the watershed protection and restoration strategy will be completed in partnership with a wide variety of local partners. The WRAPS provides prioritized implementation strategies, identified through a rigorous scientific and public participation process. The scope of this work includes both lakes and streams. The goal of these recommendations is to inform and help prioritize actions to both restore and protect the watershed.
Addressing Lakes in Watershed Restoration and Protection Strategies • April 2014 Minnesota Pollution Control Agency
4
Addressing lakes in WRAPS As of the end of 2012, 540 lakes were identified as impaired (not meeting water quality standards) for eutrophication. The impaired lakes represent 27% of the roughly 2,000 Minnesota lakes that have sufficient monitoring data for assessment. The hallmarks of eutrophication are algal blooms and associated poor water clarity, and the cause is excessive levels of nutrients. The nutrient in least relative abundance – the limiting nutrient – is phosphorus (element P) in lakes throughout Minnesota and other temperate regions. The three standard measures of eutrophication are total phosphorus (TP) concentration, chlorophyll-a concentration, and Secchi depth, as reflected in Minnesota’s lake water quality standards (Minnesota Rules 7050.20). The lake WQS apply to the June-September averages in a lake’s surface layer of water.
An important aspect of current and future lake TMDLs and protection strategies in Minnesota is the reliance on empirical relationships between lake TP concentration and the “response variables” chlorophyll-a and Secchi depth that MPCA staff developed in the course of formulating the state’s lake WQS. Environmental Analysis and Outcomes staff developed these relationships based on a substantial body of Minnesota lake data sorted by ecoregion and (for some ecoregions) by lake depth. These relationships determined the response-variable standards that correspond to the each ecoregion/depth class TP standard. Consequently, lake water quality models employed for TMDLs in Minnesota are not used to predict the response variables, but to predict lake TP only. The MPCA relies on the above empirical relationships to assure that the response variable standards will be met when the TP standard is met.
Many Minnesota lakes have water quality that is substantially better than their applicable standards, especially in the north-central and northeastern parts of the state. Many other lakes meet the standards but may exhibit declining water quality. The high-quality lakes and other lakes that meet WQS require protection from future degradation.
The WRAPS process aims to address all lakes and streams in a major watershed, providing TMDL studies for impaired waters and protection strategies for non-impaired waters. The initial 10-year cycle of WRAPS, which is currently in progress, will address the great majority of impaired waters and a substantial number of non-impaired ones. But some major watersheds in Minnesota contain hundreds of lakes, not to mention streams. In these cases additional 10-year WRAPS cycles will be required to address all waters. Be that as it may, clearly, the WRAPS process must be efficient.
The level of technical rigor of the science and professional judgment for WRAPS studies must be balanced with the need to cover a large geographical area. The larger watershed approach has the benefits of addressing both restoration and protection needs for the entire watershed to allow for more comprehensive watershed-wide planning, and allowing the MPCA to implement the watershed approach on a statewide basis. The approach can achieve efficiencies in estimating watershed inputs by recognizing and making use of regional patterns in climatology, runoff depth, and runoff pollutant concentrations and areal export.
Importance of protection in watershed projects – Protecting the quality of lakes and rivers that meet WQS is an important consideration in watershed restoration and protection projects being carried out through Minnesota’s Clean Water Land and Legacy Amendment. It is widely recognized that protection of current high quality and threatened waters is as important as restoring impaired waters. Protecting current water quality is essential to avoid further degradation and impairment of Minnesota’s waters.
Healthy watersheds provide a variety of ecological services that have high value and may be impossible to recreate once compromised. Research continually demonstrates that protecting healthy watersheds can reduce capital costs for water treatment plants and reduce damage to property and infrastructure
Addressing Lakes in Watershed Restoration and Protection Strategies • April 2014 Minnesota Pollution Control Agency
5
due to flooding, thereby avoiding future costs. Additionally, protecting healthy watersheds can generate revenue through property value premiums, recreation, and tourism.
The Minnesota Department of Natural Resources (MDNR) will assume a leading role in guiding and planning for lake protection in the WRAPS process. The MDNR has a long history of protection activities throughout the state and has many on-going programs that develop ecological data and planning methods suited to advancing lake protection. Recent discussions between MPCA and MDNR staff have laid the groundwork for interagency collaboration in this area. Going forward, the MPCA intends to work more closely with the MDNR in pursuing MDNR’s ideas for prioritizing lakes for protection.
All lakes that currently meet WQS should be protected from future degradation. These lakes vary in their degree of sensitivity to change and this should be considered in protection strategies. Protection for lakes that meet WQS can be prioritized considering the following attributes:
· waters meeting WQS but with downward trends in water quality · waters having known or anticipated future water quality threats · waters with suspected but not confirmed impairments · shallow lakes, which are especially sensitive to nutrient loading or watershed activities · high quality or unique waters deserving special attention Minnesota Department of Natural Resources staff will provide key input regarding the identification of lakes deserving special attention because of having very high quality or unique ecological or other characteristics.
Technical approach for lakes Introduction to Technical Approach. – Outlined below is an approach for systematically acquiring and using the information needed to conduct lake studies. The studies may range from basic lake protection to formally-approved TMDLs. The approach is intended to be applied to a large number of lakes, such as a HUC-8 grouping of lakes, and treats impaired lakes and non-impaired lakes in the same manner, except as distinguished below:
· Lake meets WQS – protection needed. Detailed loading estimates are not needed for many of these lakes, although certain lakes – such as those having very high quality or unique ecological features – may need extra care in their analysis and modeling. However, for all lakes meeting WQS, accurate watershed delineation (immediate and total) and basic land use characterization are required. More detailed land use and shoreland characteristics may be of additional value to specific local projects and should be acquired, as needed, by the local lakes managers. Environmental Analysis and Outcomes provides Minnesota Lake Eutrophication Analysis Procedure (MNLEAP) output as a part of the basic data that is assembled in the watershed assessment report. Additional modeling that may include Reckhow-Simpson and/or BATHTUB can be conducted as needed in the context of a specific project. (MNLEAP is a screening-level lake water quality model; the Reckhow-Simpson spreadsheet provides literature-based watershed P load data; and BATHTUB (Walker, 1999) is a lake water quality model used extensively for TMDL studies in Minnesota.)
· Lake does not meet WQS – TMDL is needed. When a TMDL is required, greater rigor in data collection and load estimation is required than for most protection projects. However, rigor and requirements may vary among TMDLs dependent on sources of excess P in the watershed. If the sources of excess P are from un-regulated sources (e.g. row crop agriculture, pasture, wetlands, etc.) there is less ability to accurately measure these loads and if they fall within the “load allocation” portion of the TMDL, less rigor may be needed in data collection and modeling. When regulated sources are present in the watershed, e.g. wastewater treatment facilities, stormsewers, feedlots,
Addressing Lakes in Watershed Restoration and Protection Strategies • April 2014 Minnesota Pollution Control Agency
6
etc., reasonably accurate wasteload calculations are required. In these instances, greater rigor will be needed in data gathering and modeling to ensure that reasonably accurate and defensible TMDLs are developed. While development of these TMDLs in a watershed context is desirable, greater rigor is needed and some of these may resemble the lake-by-lake efforts that have been typically done in recent years.
Lake TMDLs have three fundamental technical requirements:
1. Existing water and P budgets: water and P budgets, based on measured or estimated loadings, for existing conditions – generally defined as averages for the most recent 10-year period, subject to data availability
2. Water Quality Model: a model (set of mathematical equations that predict lake TP from P and water inputs, together with the requisite input data) that is consistent with both existing lake TP and the existing budgets
3. TMDL: P loading (and adjusted water loading in some cases) that is required for the lake to meet WQS and that is consistent with the water quality model. This modeled P loading is the lake’s P loading capacity based on the applicable WQS; it is the same as the TMDL when expressed on an average daily basis (a formality that the TMDL requires, although daily loads have little relevance for lakes).
While not required, lake protection strategies can also benefit by considering or incorporating the above TMDL elements. In protection projects, long-term mean TP, plus or minus year to year variability (based on standard error of the mean), provides a good basis for goal setting and evaluating progress. With this goal in mind, basic BMPs can be evaluated and appropriate projects can be implemented. As a part of the overall protection strategy, a monitoring schedule will be established so trends in water quality can be documented and progress toward the goal can be assessed.
A recent article by Cross and Jacobson (2013) provides an interesting perspective that may be of use in lake protection projects. In their review of landscape factors (e.g. landuse composition) as they affect Minnesota lakes, they found that as “anthropogenic disturbance” exceeded 40% in lake watersheds there was a significant change in lake TP and fish populations. While 40% is a very high value in the Northern Lakes and Forests ecoregion, where a typical value is < 10% (Heiskary and Wilson 1994), it is relatively low in the North Central Hardwood Forest where values of 50% or more are typical or in the Western Corn Belt Plains or Northern Glaciated Plains ecoregions where values are typically >80 %. While we cannot provide precise anthropogenic thresholds for management at this point, this concept does bear consideration and may be particularly useful in lake watersheds where protection is a primary focus.
Using HSPF watershed model results. – The watershed hydrology and pollutant transport model known as Hydrologic Simulation Program FORTRAN (HSPF) can provide complete existing water and P budgets and other detailed data for lakes throughout a modeled area. The MPCA watershed program currently applies HSPF throughout much of the state and has already completed models for many HUC-8s. Watershed Restoration and Protection developed within HUC-8s that have completed HSPF models should make full use of the HSPF results. In the Twin Cities Metro Area, where WRAPS are generally developed on the smaller scale of watershed districts and watershed management organizations, rather than the HUC-8 scale, models other than HSPF are employed. Commonly used models include P8, XPSWMM, and EPA’s Simple Method.
Hydrologic Simulation Program FORTRAN uses drainage area delineations, land use data; slope, soil, and crop data; channel morphology; and other information to generate hourly-time-step simulations of hydrology and pollutant loading and transport for a period of typically a decade or more. Precipitation, temperature, and other climatological data are the primary inputs that “drive” HSPF simulations. The most critical of the “driver” inputs is precipitation data; each HUC-8’s simulation uses typically a dozen
Addressing Lakes in Watershed Restoration and Protection Strategies • April 2014 Minnesota Pollution Control Agency
7
precipitation gages. Wastewater effluent monitoring records provide flows and P loads that are also part of the “driver” inputs.
Calibration of Minnesota’s HUC-8 HSPF models makes use of extensive stream flow, lake level and water quality data. See “Notes on HSPF Calibration” in Appendix A for details. At the MDNR’s suggestion, the MPCA will work closely with the MDNR’s lake level monitoring program to target lakes for level monitoring that will be important for imminent WRAPS efforts.
HSPF produces regular outputs for typically 40 to 70 locations that are pre-selected along the HUC-8 drainage network. These points define the so-called model “segmentation”, each “segment” encompassing the drainage area and water bodies upstream from a given segmentation point but excluding any and all upstream segments (those having no upstream segmentation points are “headwater segments”). The outputs include annual flow and pollutant load summaries. When a lake outlet is a segment boundary, the HSPF outputs include flow and load summaries for the lake outlet site, as well as for (1) explicitly modeled streams that feed the lake, (2) explicitly modeled upstream lakes, (3) the remaining “local” or “direct” drainage area and (4) groundwater inflows and loads from the surficial aquifer.
Watershed restoration and protection project managers should get involved in HSPF applications for their HUC-8s at the start of modeling work and provide input to HSPF model setup, particularly drainage boundaries and model segmentation. Watershed restoration and protection project managers, HSPF modelers, and EAO staff should agree on which Geographic Information System (GIS) shapefile will define drainage boundaries for and within the HUC-8 (usually MDNR catchments). Ideally, outlets of all lakes considered in the WRAPS should be among the segmentation points. Model limitations might mandate cutting down the list to known and suspected impaired lakes plus high-priority protection lakes. MDNR staff will provide key input regarding the identification of this subset of protection lakes. Project managers should prepare two lake lists (e.g., “essential” and “desirable”), for early HSPF discussions.
The MPCA expects to update the HSPF model for each HUC-8 at least every 10 years. The updates will incorporate significant changes in land use, wastewater discharges, and surface water withdrawals; as well as any other significant hydrologic changes. The HSPF calibration will also be checked and perhaps adjusted, based on newly available monitoring data.
For WRAPS developed in HUC-8’s lacking a completed HSPF model, the data needed for existing water and P budgets and other purposes must be obtained from other sources, as described in Appendix A.
Lake water quality modeling. – HSPF has a built-in, time-varying lake water quality model, but it has not yet been used for developing lake TMDLs or lake protection strategies in Minnesota. The MPCA may investigate the HSPF lake model for future use. For now, however, the primary use of HSPF for lake studies is to provide the water budget and P loading data required for steady-state model applications. Steady-state water quality models have generally been preferred for lake studies because of their simplicity, modest data requirements, and compatibility with modeling multiple-year average conditions. Well-tested lake models such as the Canfield-Bachmann model can easily be incorporated into Excel tables that contain the required model input data. The Canfield-Bachmann model is one of nine options for modeling lake TP included in the widely used BATHTUB program. Some of the other BATHTUB model options may also be amenable to incorporation into Excel spreadsheets.
Many lakes are subject to internal P loading, the result of excessive, usually long-term, external loading. Lake models need to incorporate good estimates of the internal loading in order to guide restoration and protection activities. Direct, independent estimates of internal load are possible through laboratory studies on sediment samples or by means of separate models, such as those of Nürnberg (1995, 2009). Independent estimates of internal load are preferable to indirect estimates based on apparent “missing load” resulting from first trials of BATHTUB or other models. Where internal load is estimated indirectly,
Addressing Lakes in Watershed Restoration and Protection Strategies • April 2014 Minnesota Pollution Control Agency
8
the external loads must be measured or estimated with special care since indirect internal load estimates incorporate all other loads’ errors.
The Minnesota Lake Eutrophication Analysis Procedure (MNLEAP) model (Wilson and Walker, 1989) can be used as a simple screening tool to help identify which lakes in a HUC-8 are in need of protection or restoration. MNLEAP predicts in-lake P, chlorophyll-a, and transparency based on ecoregion runoff and runoff TP concentration norms.
For brevity and efficiency, the lake modeling results for all the lakes considered in the WRAPS should be tabulated together in one place rather than in separate tables for individual lakes. See Appendix A, Table 2.
End goal – Best management practice implementation The eventual goal of watershed assessment and the WRAPS process is to engage landowners in corrective or protective practices that benefit the lakes. Priority work should be established, practices and products should be documented, and the final BMP efforts should show a clear linkage between all steps of the watershed science as defined in this short document. Once lakes have been evaluated and prioritized as to needs, and included in an overall strategy for improvement, restoration or protection, a variety of resources are available to move forward with best management practices. A brief list of tools and websites is listed in Appendix B, Resources for Lake Restoration and Protection Efforts in Minnesota.
Summary and conclusion The MPCA has provided updated guidance for addressing lakes in watershed restoration and protection projects. This guidance updates previous guidance on this topic and reflects the latest thinking on the watershed approach in Minnesota. Our approach incorporates all available data, notably HSPF watershed model results as well as all available lakes studies and available data to provide the capability to evaluate as many as 50-100 or more lakes in a WRAPS project. It provides guidance for determining and prioritizing lakes with protection needs, provides resources (Appendix B) for further planning and implementation of lake restoration and protection efforts, and provides tools to identify high priority geographical locations within the study area to implement restoration and protection efforts through use of the Environmental Benefits Index (EBI).
Because of the rapid evolution of the watershed approach in Minnesota, our approach for addressing lakes in watershed restoration and protection projects will continue to evolve to reflect knowledge gained from completed projects and ongoing program development. We welcome suggestions on how to improve this document and how to improve collaboration on lake restoration and protection. Please contact any member of the MPCA Lakes Lateral Team with questions, comments or suggestions.
Addressing Lakes in Watershed Restoration and Protection Strategies • April 2014 Minnesota Pollution Control Agency
9
Appendix A
Technical Details for Developing WRAPS Reports This appendix presents information on several technical aspects of WRAPS development:
· background on calibrating HSPF models · general data needs for WRAPS · using areal loading data · usefulness of pour point (HUC-8 outlet) monitoring data · formatting suggestions for lake data tables in WRAPS reports
Notes on HSPF calibration. – HSPF is being calibrated to long term river and stream data collected at three scales: 1) Basin (Mississippi, Minnesota, Rainy, Red and St. Croix); 2) Major Watershed (HUC-8); and 3) HUC-8 subwatersheds, typically 300 to 500 mi2 in area. Basin and HUC-8 (pour point) monitoring sites for calibration have been established since 2009. Major watersheds will typically have one to three additional long-term, sub-watershed monitoring sites. Such sites have been selected for northeast and northwest Minnesota; additional sites for the remainder of the state will be selected in 2013 and 2014. The pour point and sub-watershed sites have continuous flow records and are sampled for nutrients (also other pollutants); MPCA staff calculate P (and other pollutant) loadings from these data. Illustrating the variation in the number of such long-term stations, the lake-rich Crow Wing River HUC-8 has four, including the pour point and three sub-watershed stations, whereas the especially well-studied Le Sueur River HUC-8 has a total of nine.
HSPF calibration also relies on lake level records, which are readily available on the MDNR website. As part of the data preparation for each HSPF application, rating curves (relationships between lake level and the lake’s surface area and volume) are developed for each modeled lake, based on the lake’s bathymetry and surrounding topography. The rating curves enable HSPF to keep track of changes in water volume storage throughout the watershed. Measured lake level records provide key calibration points for HSPF. The HSPF model in development for the Crow Wing River HUC-8 uses level records for 15 lakes; the Le Sueur River HSPF model uses three extensive long-term lake level records, plus a few intermittent records.
Several other types of data are also available for calibration. The two-year intensive monitoring in each HUC-8 that is part of the MPCA’s 10-year watershed cycle provides additional water quality data from sites throughout the watershed. This typically includes a dozen samples from a dozen sites. In many HUC-8s, local partners involved in past TMDL, Clean Water Partnership, and Section 319-funded studies have stream flow and load monitoring records from these studies for sites other than those mentioned above.
HSPF does not use default export values to calculate loadings. To model the export of P and other pollutants, HSPF relies first on runoff volumes from the hydrology calibration, which are broken down by land use category (forest, wetland, urban, row-cropland under several tillages, etc.). Runoff concentrations of P and other pollutants – allowed to vary monthly – are then input for each land use category. The concentrations are drawn from the literature but are subject to calibration. HSPF simulates lake and stream P as three fractions: dissolved inorganic, particle-bound inorganic, and particulate organic. Calibration considers available monitoring data that can support this fractionation. For example, concentrations of ortho-phosphate-P, where reported, are equated to dissolved inorganic P for calibration. Because a substantial fraction of P is in the two particle-associated fractions, soil loss and sediment transport are calibrated prior to calibrating P and other parameters (some of which also have particle-associated fractions).
Addressing Lakes in Watershed Restoration and Protection Strategies • April 2014 Minnesota Pollution Control Agency
10
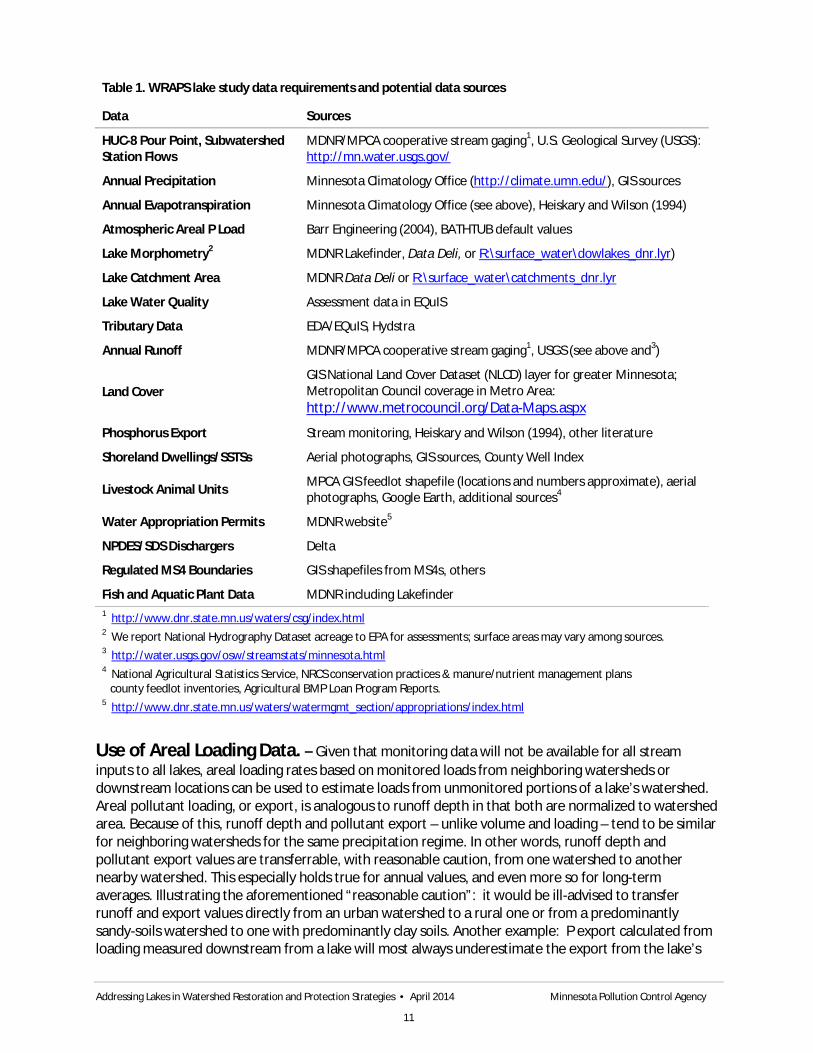
Data needed for lake studies in WRAPS. – Watershed area, land use data, and lake volume are the most essential data needed for a lake study. For WRAPS purposes, lake watershed always means the totality of areas draining to the lake, including upstream lakes and their watersheds, the watersheds of significant streams that enter the lake, and the remaining “local” or “direct” drainage area. GIS shapefiles can provide watershed boundary maps and lake bathymetric (depth) maps. Mean depth information is available on MDNR’s Data Deli (Lake Basin Morphology layer) and MPCA’s R-drive (see Table 1). In the case of lakes that are not mapped, mean depth estimates can often be provided by EAO or local partners familiar with the lake. Land use data are also available in GIS formats. EAO assembles much of this information, with assistance from MDNR, as a part of the Watershed Assessment Reports process. Intended for a professional audience, these reports summarize impairment assessments and encapsulate key lake and watershed information at a broad scale.
Lake water quality records are necessary for assessment and development of TMDLs and protection strategies. EAO assembles lake data on an annual basis in support of these efforts and these datasets are available on request from Water Quality Monitoring Unit staff of the EAO Division. The first dataset provides the existing (or “current”) lake water quality for the most recent 10-year period (as available) by averaging all TP, chlorophyll-a, and Secchi depth data collected from June through September (“summer”). [Note – all assessed lakes have a minimum of two summers of data.] The second dataset provides yearly summer means for each of the Trophic State Index (TSI) variables (TP, chlorophyll-a, and Secchi depth). Statistics such as standard error (or coefficient of variation), number of observations, and minima and maxima are provided as well. These statistics provide a basis for determining variability of the mean, strength of the dataset, and can be used in the models and for assessing trends and year-to-year variability.
Most lake TMDLs use flow and P load data monitored at stream or storm sewer stations. At a much larger scale, every HUC-8 has a multiple-year record of flow and P load monitoring for its outlet, or pour point. As discussed below, lake TMDLs in a HUC-8 can make good use of the pour point data. Records from other stations within the HUC-8 are usually available, too. Table 1 summarizes basic information that is needed to assess lakes, populate models, and develop TMDLs, as well as suggesting sources for each type of data.
Addressing Lakes in Watershed Restoration and Protection Strategies • April 2014 Minnesota Pollution Control Agency
11
Table 1. WRAPS lake study data requirements and potential data sources
Data Sources
HUC-8 Pour Point, Subwatershed Station Flows
MDNR/MPCA cooperative stream gaging1, U.S. Geological Survey (USGS): http://mn.water.usgs.gov/
Annual Precipitation Minnesota Climatology Office (http://climate.umn.edu/), GIS sources
Annual Evapotranspiration Minnesota Climatology Office (see above), Heiskary and Wilson (1994)
Atmospheric Areal P Load Barr Engineering (2004), BATHTUB default values
Lake Morphometry2 MDNR Lakefinder, Data Deli, or R:\surface_water\dowlakes_dnr.lyr)
Lake Catchment Area MDNR Data Deli or R:\surface_water\catchments_dnr.lyr
Lake Water Quality Assessment data in EQuIS
Tributary Data EDA/EQuIS, Hydstra
Annual Runoff MDNR/MPCA cooperative stream gaging1, USGS (see above and3)
Land Cover GIS National Land Cover Dataset (NLCD) layer for greater Minnesota; Metropolitan Council coverage in Metro Area: http://www.metrocouncil.org/Data-Maps.aspx
Phosphorus Export Stream monitoring, Heiskary and Wilson (1994), other literature
Shoreland Dwellings/SSTSs Aerial photographs, GIS sources, County Well Index
Livestock Animal Units MPCA GIS feedlot shapefile (locations and numbers approximate), aerial photographs, Google Earth, additional sources4
Water Appropriation Permits MDNR website5
NPDES/SDS Dischargers Delta
Regulated MS4 Boundaries GIS shapefiles from MS4s, others
Fish and Aquatic Plant Data MDNR including Lakefinder 1 http://www.dnr.state.mn.us/waters/csg/index.html 2 We report National Hydrography Dataset acreage to EPA for assessments; surface areas may vary among sources. 3 http://water.usgs.gov/osw/streamstats/minnesota.html 4 National Agricultural Statistics Service, NRCS conservation practices & manure/nutrient management plans county feedlot inventories, Agricultural BMP Loan Program Reports. 5 http://www.dnr.state.mn.us/waters/watermgmt_section/appropriations/index.html
Use of Areal Loading Data. – Given that monitoring data will not be available for all stream inputs to all lakes, areal loading rates based on monitored loads from neighboring watersheds or downstream locations can be used to estimate loads from unmonitored portions of a lake’s watershed. Areal pollutant loading, or export, is analogous to runoff depth in that both are normalized to watershed area. Because of this, runoff depth and pollutant export – unlike volume and loading – tend to be similar for neighboring watersheds for the same precipitation regime. In other words, runoff depth and pollutant export values are transferrable, with reasonable caution, from one watershed to another nearby watershed. This especially holds true for annual values, and even more so for long-term averages. Illustrating the aforementioned “reasonable caution”: it would be ill-advised to transfer runoff and export values directly from an urban watershed to a rural one or from a predominantly sandy-soils watershed to one with predominantly clay soils. Another example: P export calculated from loading measured downstream from a lake will most always underestimate the export from the lake’s
Addressing Lakes in Watershed Restoration and Protection Strategies • April 2014 Minnesota Pollution Control Agency
12
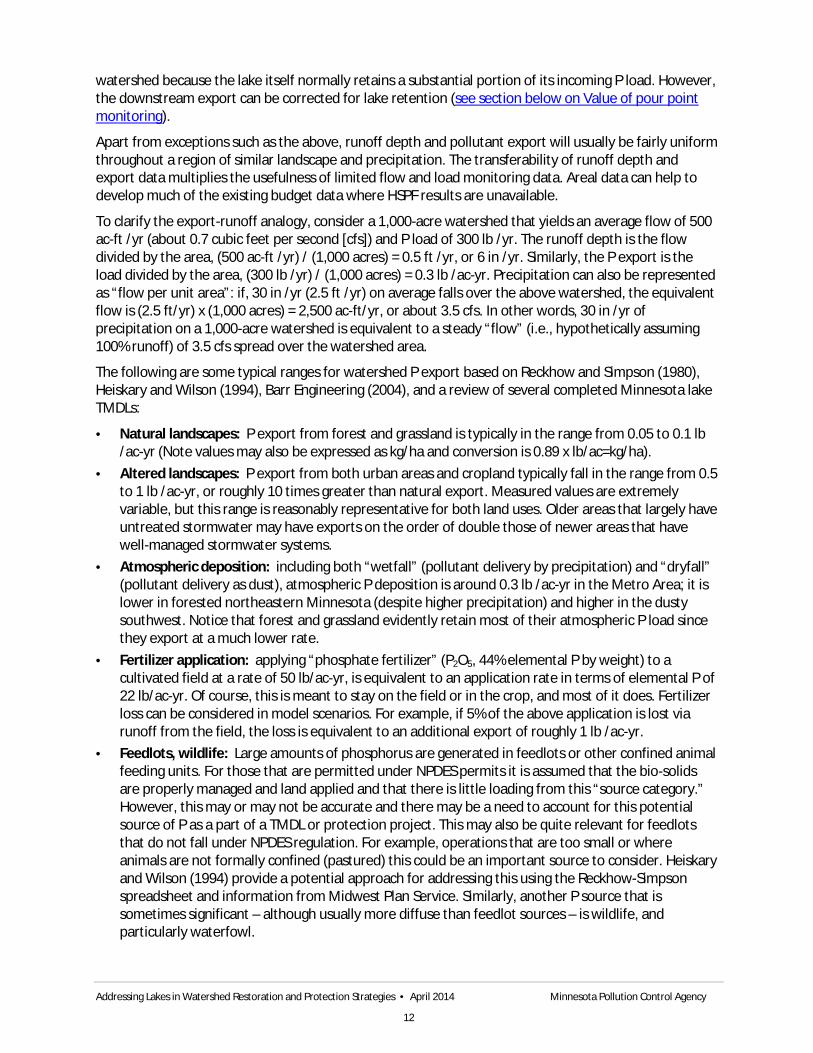
watershed because the lake itself normally retains a substantial portion of its incoming P load. However, the downstream export can be corrected for lake retention (see section below on Value of pour point monitoring).
Apart from exceptions such as the above, runoff depth and pollutant export will usually be fairly uniform throughout a region of similar landscape and precipitation. The transferability of runoff depth and export data multiplies the usefulness of limited flow and load monitoring data. Areal data can help to develop much of the existing budget data where HSPF results are unavailable.
To clarify the export-runoff analogy, consider a 1,000-acre watershed that yields an average flow of 500 ac-ft /yr (about 0.7 cubic feet per second [cfs]) and P load of 300 lb /yr. The runoff depth is the flow divided by the area, (500 ac-ft /yr) / (1,000 acres) = 0.5 ft /yr, or 6 in /yr. Similarly, the P export is the load divided by the area, (300 lb /yr) / (1,000 acres) = 0.3 lb /ac-yr. Precipitation can also be represented as “flow per unit area”: if, 30 in /yr (2.5 ft /yr) on average falls over the above watershed, the equivalent flow is (2.5 ft/yr) x (1,000 acres) = 2,500 ac-ft/yr, or about 3.5 cfs. In other words, 30 in /yr of precipitation on a 1,000-acre watershed is equivalent to a steady “flow” (i.e., hypothetically assuming 100% runoff) of 3.5 cfs spread over the watershed area.
The following are some typical ranges for watershed P export based on Reckhow and Simpson (1980), Heiskary and Wilson (1994), Barr Engineering (2004), and a review of several completed Minnesota lake TMDLs:
· Natural landscapes: P export from forest and grassland is typically in the range from 0.05 to 0.1 lb /ac-yr (Note values may also be expressed as kg/ha and conversion is 0.89 x lb/ac=kg/ha).
· Altered landscapes: P export from both urban areas and cropland typically fall in the range from 0.5 to 1 lb /ac-yr, or roughly 10 times greater than natural export. Measured values are extremely variable, but this range is reasonably representative for both land uses. Older areas that largely have untreated stormwater may have exports on the order of double those of newer areas that have well-managed stormwater systems.
· Atmospheric deposition: including both “wetfall” (pollutant delivery by precipitation) and “dryfall” (pollutant delivery as dust), atmospheric P deposition is around 0.3 lb /ac-yr in the Metro Area; it is lower in forested northeastern Minnesota (despite higher precipitation) and higher in the dusty southwest. Notice that forest and grassland evidently retain most of their atmospheric P load since they export at a much lower rate.
· Fertilizer application: applying “phosphate fertilizer” (P2O5, 44% elemental P by weight) to a cultivated field at a rate of 50 lb/ac-yr, is equivalent to an application rate in terms of elemental P of 22 lb/ac-yr. Of course, this is meant to stay on the field or in the crop, and most of it does. Fertilizer loss can be considered in model scenarios. For example, if 5% of the above application is lost via runoff from the field, the loss is equivalent to an additional export of roughly 1 lb /ac-yr.
· Feedlots, wildlife: Large amounts of phosphorus are generated in feedlots or other confined animal feeding units. For those that are permitted under NPDES permits it is assumed that the bio-solids are properly managed and land applied and that there is little loading from this “source category.” However, this may or may not be accurate and there may be a need to account for this potential source of P as a part of a TMDL or protection project. This may also be quite relevant for feedlots that do not fall under NPDES regulation. For example, operations that are too small or where animals are not formally confined (pastured) this could be an important source to consider. Heiskary and Wilson (1994) provide a potential approach for addressing this using the Reckhow-Simpson spreadsheet and information from Midwest Plan Service. Similarly, another P source that is sometimes significant – although usually more diffuse than feedlot sources – is wildlife, and particularly waterfowl.
Addressing Lakes in Watershed Restoration and Protection Strategies • April 2014 Minnesota Pollution Control Agency
13
· Scale effect: when measured at different geographic scales, export is usually found to be higher in small drainage areas than in large ones. For example, a stream draining a few square miles of predominantly cropland might have an average P export of 0.5 lb/ac-yr, even though edge-of-field export might be typically 1 lb/ac-yr. P-export decrease from field to stream outlet is due to P deposition in wetlands / low areas and other processes. Prairie and Kalff (1986) address this in their work and suggested estimates are provided in their paper and in the Reckhow – Simpson spreadsheet application.
· Areal loading to lakes: when a lake’s external loading is divided by the area of the lake itself, the resulting areal load is often in the range of 2 to 6 lb /ac-yr. Internal loads are comparable to external loads for many lakes in the Metro Area and in southern and western Minnesota. (Numbers here are from a sampling of Metro and out-state lakes.) Outliers occur – for example, Little Rock Lake (Benton County) has a lake-areal loading from external sources of 12 lb/ac-yr, equivalent to P2O5 applied to the lake area at 28 lb/ac-yr.
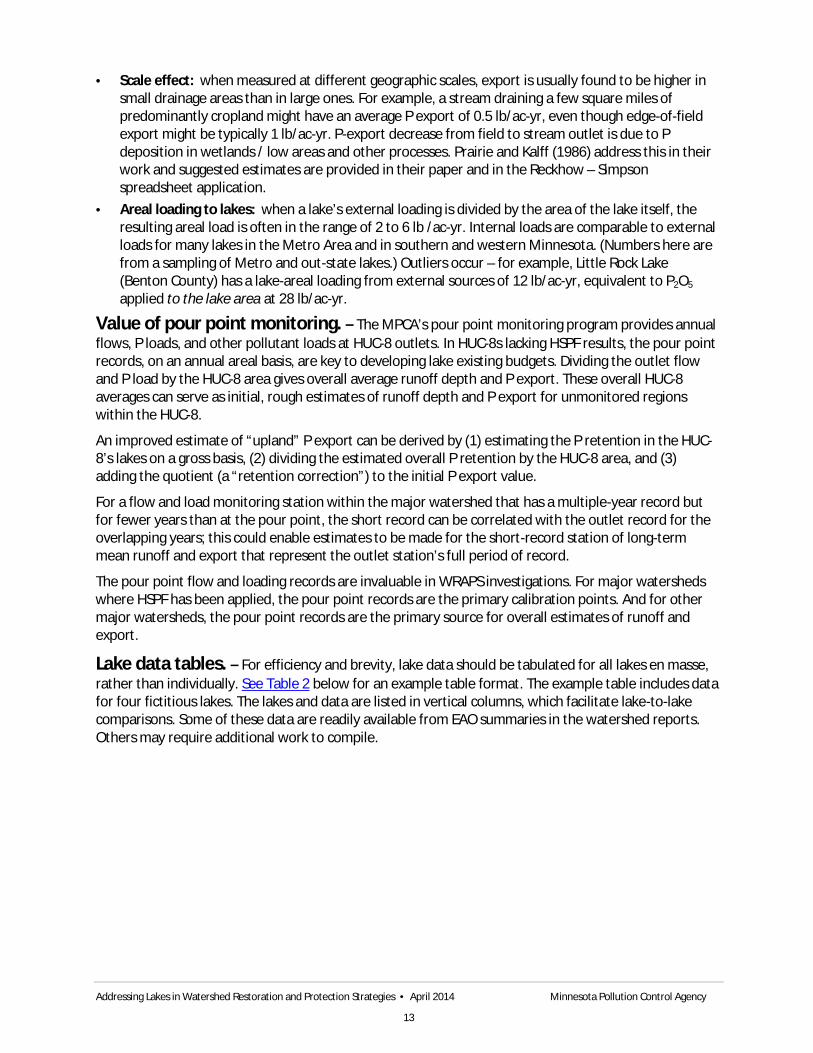
Value of pour point monitoring. – The MPCA’s pour point monitoring program provides annual flows, P loads, and other pollutant loads at HUC-8 outlets. In HUC-8s lacking HSPF results, the pour point records, on an annual areal basis, are key to developing lake existing budgets. Dividing the outlet flow and P load by the HUC-8 area gives overall average runoff depth and P export. These overall HUC-8 averages can serve as initial, rough estimates of runoff depth and P export for unmonitored regions within the HUC-8.
An improved estimate of “upland” P export can be derived by (1) estimating the P retention in the HUC-8’s lakes on a gross basis, (2) dividing the estimated overall P retention by the HUC-8 area, and (3) adding the quotient (a “retention correction”) to the initial P export value.
For a flow and load monitoring station within the major watershed that has a multiple-year record but for fewer years than at the pour point, the short record can be correlated with the outlet record for the overlapping years; this could enable estimates to be made for the short-record station of long-term mean runoff and export that represent the outlet station’s full period of record.
The pour point flow and loading records are invaluable in WRAPS investigations. For major watersheds where HSPF has been applied, the pour point records are the primary calibration points. And for other major watersheds, the pour point records are the primary source for overall estimates of runoff and export.
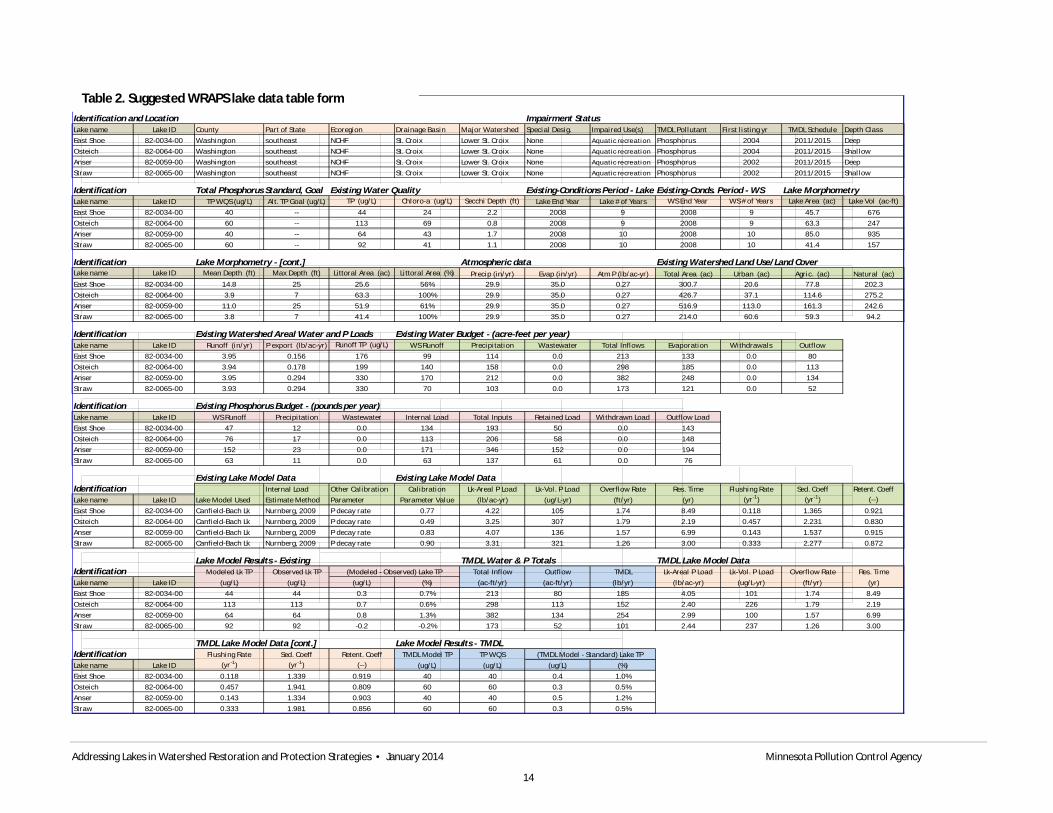
Lake data tables. – For efficiency and brevity, lake data should be tabulated for all lakes en masse, rather than individually. See Table 2 below for an example table format. The example table includes data for four fictitious lakes. The lakes and data are listed in vertical columns, which facilitate lake-to-lake comparisons. Some of these data are readily available from EAO summaries in the watershed reports. Others may require additional work to compile.
Addressing Lakes in Watershed Restoration and Protection Strategies • January 2014 Minnesota Pollution Control Agency
14
Table 2. Suggested WRAPS lake data table format.
Identification and Location Impairment StatusLake name Lake ID County Part of State Ecoregion Drainage Basin Major Watershed Special Desig. Impaired Use(s) TMDL Pollutant First l isting yr TMDL Schedule Depth ClassEast Shoe 82-0034-00 Washington southeast NCHF St. Croix Lower St. Croix None Aquatic recreation Phosphorus 2004 2011/2015 DeepOsteich 82-0064-00 Washington southeast NCHF St. Croix Lower St. Croix None Aquatic recreation Phosphorus 2004 2011/2015 ShallowAnser 82-0059-00 Washington southeast NCHF St. Croix Lower St. Croix None Aquatic recreation Phosphorus 2002 2011/2015 DeepStraw 82-0065-00 Washington southeast NCHF St. Croix Lower St. Croix None Aquatic recreation Phosphorus 2002 2011/2015 Shallow
Identification Total Phosphorus Standard, Goal Existing Water Quality Existing-Conditions Period - Lake Existing-Conds. Period - WS Lake MorphometryLake name Lake ID TP WQS (ug/L) Alt. TP Goal (ug/L) TP (ug/L) Chloro-a (ug/L) Secchi Depth (ft) Lake End Year Lake # of Years WS End Year WS # of Years Lake Area (ac) Lake Vol (ac-ft)
East Shoe 82-0034-00 40 -- 44 24 2.2 2008 9 2008 9 45.7 676Osteich 82-0064-00 60 -- 113 69 0.8 2008 9 2008 9 63.3 247Anser 82-0059-00 40 -- 64 43 1.7 2008 10 2008 10 85.0 935Straw 82-0065-00 60 -- 92 41 1.1 2008 10 2008 10 41.4 157
Identification Lake Morphometry - [cont.] Atmospheric data Existing Watershed Land Use/Land CoverLake name Lake ID Mean Depth (ft) Max Depth (ft) Littoral Area (ac) Littoral Area (%) Precip (in/yr) Evap (in/yr) Atm P (lb/ac-yr) Total Area (ac) Urban (ac) Agric. (ac) Natural (ac)East Shoe 82-0034-00 14.8 25 25.6 56% 29.9 35.0 0.27 300.7 20.6 77.8 202.3Osteich 82-0064-00 3.9 7 63.3 100% 29.9 35.0 0.27 426.7 37.1 114.6 275.2Anser 82-0059-00 11.0 25 51.9 61% 29.9 35.0 0.27 516.9 113.0 161.3 242.6Straw 82-0065-00 3.8 7 41.4 100% 29.9 35.0 0.27 214.0 60.6 59.3 94.2
Identification Existing Watershed Areal Water and P Loads Existing Water Budget - (acre-feet per year)Lake name Lake ID Runoff (in/yr) P export (lb/ac-yr) Runoff TP (ug/L) WS Runoff Precipitation Wastewater Total Inflows Evaporation Withdrawals OutflowEast Shoe 82-0034-00 3.95 0.156 176 99 114 0.0 213 133 0.0 80Osteich 82-0064-00 3.94 0.178 199 140 158 0.0 298 185 0.0 113Anser 82-0059-00 3.95 0.294 330 170 212 0.0 382 248 0.0 134Straw 82-0065-00 3.93 0.294 330 70 103 0.0 173 121 0.0 52
Identification Existing Phosphorus Budget - (pounds per year)Lake name Lake ID WS Runoff Precipitation Wastewater Internal Load Total Inputs Retained Load Withdrawn Load Outflow LoadEast Shoe 82-0034-00 47 12 0.0 134 193 50 0.0 143Osteich 82-0064-00 76 17 0.0 113 206 58 0.0 148Anser 82-0059-00 152 23 0.0 171 346 152 0.0 194Straw 82-0065-00 63 11 0.0 63 137 61 0.0 76
Existing Lake Model Data Existing Lake Model DataIdentification Internal Load Other Calibration Calibration Lk-Areal P Load Lk-Vol. P Load Overflow Rate Res. Time Flushing Rate Sed. Coeff Retent. CoeffLake name Lake ID Lake Model Used Estimate Method Parameter Parameter Value (lb/ac-yr) (ug/L-yr) (ft/yr) (yr) (yr-1) (yr-1) (--)
East Shoe 82-0034-00 Canfield-Bach Lk Nurnberg, 2009 P decay rate 0.77 4.22 105 1.74 8.49 0.118 1.365 0.921Osteich 82-0064-00 Canfield-Bach Lk Nurnberg, 2009 P decay rate 0.49 3.25 307 1.79 2.19 0.457 2.231 0.830Anser 82-0059-00 Canfield-Bach Lk Nurnberg, 2009 P decay rate 0.83 4.07 136 1.57 6.99 0.143 1.537 0.915Straw 82-0065-00 Canfield-Bach Lk Nurnberg, 2009 P decay rate 0.90 3.31 321 1.26 3.00 0.333 2.277 0.872
Lake Model Results - Existing TMDL Water & P Totals TMDL Lake Model DataIdentification Modeled Lk TP Observed Lk TP Total Inflow Outflow TMDL Lk-Areal P Load Lk-Vol. P Load Overflow Rate Res. TimeLake name Lake ID (ug/L) (ug/L) (ug/L) (%) (ac-ft/yr) (ac-ft/yr) (lb/yr) (lb/ac-yr) (ug/L-yr) (ft/yr) (yr)East Shoe 82-0034-00 44 44 0.3 0.7% 213 80 185 4.05 101 1.74 8.49Osteich 82-0064-00 113 113 0.7 0.6% 298 113 152 2.40 226 1.79 2.19Anser 82-0059-00 64 64 0.8 1.3% 382 134 254 2.99 100 1.57 6.99Straw 82-0065-00 92 92 -0.2 -0.2% 173 52 101 2.44 237 1.26 3.00
TMDL Lake Model Data [cont.] Lake Model Results - TMDLIdentification Flushing Rate Sed. Coeff Retent. Coeff TMDL Model TP TP WQSLake name Lake ID (yr-1) (yr-1) (--) (ug/L) (ug/L) (ug/L) (%)East Shoe 82-0034-00 0.118 1.339 0.919 40 40 0.4 1.0%Osteich 82-0064-00 0.457 1.941 0.809 60 60 0.3 0.5%Anser 82-0059-00 0.143 1.334 0.903 40 40 0.5 1.2%Straw 82-0065-00 0.333 1.981 0.856 60 60 0.3 0.5%
(Modeled - Observed) Lake TP
(TMDL Model - Standard) Lake TP
Table 2. Suggested WRAPS lake data table form
Addressing Lakes in Watershed Restoration and Protection Strategies • January 2014 Minnesota Pollution Control Agency
15
Appendix B
Resources for Lake Restoration and Protection Efforts in Minnesota 1. Environmental Benefits Index. The Board of Water and Soil Resources and the University of
Minnesota recently devised an Environmental Benefits Index (EBI) and associated GIS tool. The EBI was designed to identify ecologically important land parcels, with the objective of more effectively targeting conservation programs to critical lands. The EBI bases the conservation value of a parcel of land on three factors: · soil erosion risk · water quality risk · habitat quality and threat The soil erosion risk is based on soil type, slope, and climate characteristics. The water quality risk is based on the Stream Power Index and proximity to surface water. The habitat quality and threat score combines both positive information on resources (such as rare species occurrences, significant biodiversity, and high game species abundance) and negative information on threats to resources (such as road density and urban and agricultural land use). The EBI is the sum of three scores, one score for each factor on a 0-100 scale, resulting in an overall 0-300 EBI scale. High EBI translates into high risk (e.g. water erosion) or high quality (e.g. habitat). Therefore, a high EBI score implies the site has a high value for conservation. The report, Statewide Ranking of Ecological Value of CRP and Other Critical Lands (Mulla et al., July 6, 2011), documents the EBI and is accessible here: http://www.bwsr.state.mn.us/ecological_ranking/Ecological_Ranking_Final_Report_06July2011.pdf A link to the associated GIS tool is on the following website: www.nrri.umn.edu/EcolRank
2. Minnesota Shoreland Management Resources Guide Website http://shorelandmanagement.org/depth/index.html This is a very useful website with several documents that can aid lake protection and rehabilitation efforts. Resources include more than just shoreland focused documents and several incorporate a watershed wide approach to management of a lake. Included among the publications are several developed by MPCA staff or have contributions by MPCA staff. Some documents may include outdated contact information and web links. Please refer to the agencies that provided the information in the documents if further contact or information is needed. Also, most of these documents were compiled prior to promulgation of Minnesota’s lake eutrophication WQS in 2008 and the advent of MPCA’s watershed approach and thus there will be no direct reference to them. Some examples of useful resources from the website are listed below:
“Lake Prioritization for Protecting Swimmable Use” – Using ecoregion, use support assessments, and lake size are all parts of creating a lake prioritization for protection swimmable use. The prioritization scheme is based on P data and if lakes are lacking any P data then those lakes are placed in a monitor category. “Monitor” lakes are revisited later and the Secchi and chlorophyll-a (Chl-a) data are used to determine prioritization of lakes. Because of the high price of restoration, protection of lakes should be used whenever possible. This prioritization of lakes can be used at many different levels such as state, watershed, or a smaller data set. This document could be used a stepping stone for more advanced protection and monitoring and must be paired with current eutrophication standard (as the document predates the promulgation of the
Addressing Lakes in Watershed Restoration and Protection Strategies • January 2014 Minnesota Pollution Control Agency
16
standard). (Note: This document should be viewed in the context of lake eutrophication WQS and the HUC-8 watershed strategy.)
“Minnesota Lake and Watershed Data Collection Manual and Appendix” – This document provides guidance for local officials, organizations, and individuals on the collection of lake, watershed, socioeconomic and historical data that can be useful for assessment and planning purposes.
“Developing a Lake Management Plan” – This document provides useful ideas on how to develop a lake management plan and the types of information that should be included. This document was a collaborative effort and included input from lake associations that had developed such plans.
“Protecting Our Waters: Shoreland Best Management Practices” – This is a series of fact sheets developed by the University of Minnesota Extension Service that detail shoreland BMPs for protecting and improving lake water quality. Specific BMPs covered in the series include septic system maintenance, shoreline stabilization, minimizing runoff and preventing introduction of invasive species as well as other BMPs.
“User's Guide to Shoreland Property” – This is a primer for understanding lake water quality. It was developed by the Aitkin County Water Plan Task Force but much of the information should be applicable statewide. The document provides basic information on physical and biological processes in lakes and suggestions for lakeshore property owners both in terms of landscape projects and use of common household products
“Sustainable Lakes Workbook” – Planning document to help any lake group create a sustainable management plan. The workbook includes a thorough discussion with appendices that cover watershed survey templates, sample lake plans, and land use impacts to water quality.
“Shoreland Volunteer Guidebook” – A short guide (24 pages) for setting up a volunteer organization and event.
“A Primer on Limnology” (web or pdf version) – Lake Science 101. Covers all aspects of physical, chemical, and biological attributes of lake science/lake health. The primer provides thorough coverage of concepts and vocabulary.
3. EPA Websites: Include a variety of tools and BMP practices to improve and protect water quality. “Handbook for Developing Watershed Plans to Restore and Protect Our Waters” http://water.epa.gov/polwaste/nps/handbook_index.cfm. A very comprehensive handbook with extensive sections pertaining to all watershed plan elements. The user can select those sections most appropriate to their planning and management needs including implementation of practices. Provides a framework to develop a scientifically defensible plan that will lead to measurable results. Extensive resources appendix/ worksheets appendix provide additional tools for watershed plan development. Various other publications, websites, and examples are given to help the user envision or develop end products.
· EPA Healthy Watersheds-www.epa.gov/healthy watersheds/-explore this website, many fact sheets and links to tools.
· EPA Septic System Tools – http://water.epa.gov/infrastructure/septic/septicsmart.cfm – all about septic systems.
Addressing Lakes in Watershed Restoration and Protection Strategies • January 2014 Minnesota Pollution Control Agency
17
4. Minnesota Lakes and Rivers Advocates/Minnesota Waters/North American Lake Management Society (NALMS) website tools. The Minnesota websites http://mnlakesandrivers.org/ and http://www.minnesotawaters.org/ include pre-built lake management plan templates to create management documents. Several fact sheets/worksheets are published as pdf documents to assist in selecting appropriate BMP practices or use as handouts at meetings etc. The NALMS website also provides useful information for lake management planning efforts. See the document “Developing a Lake Management Plan” http://www.nalms.org/home/lake-management/lake-management-plans/lake-management-plans-home.cmsx. It contains a model framework advising an individual where to start in the process, how to develop a group of citizens who will gather information about the lake, land use, and demographics to use in the development of a workplan. Factors that influence lake health are explained along with the main areas of focus of where the lake management should be.
5. MPCA/MDNR/BWSR/MDA resources. Various documents under state agency websites can help resource staff and stakeholders discuss and design the next steps for restoration in impaired waters or protection in healthy watersheds. See MDNR Healthy Watersheds web page and MPCA major watershed pages links for more information in specific watershed implementation reports. BWSR website provides the details for a broad array of funding sources and tools like the Environmental Benefits Index Tool. Minnesota Department of Natural Resources website also includes the “Score your Shore” tool to evaluate lakeshore health.
“A Citizen's Guide to Lake Protection” – MPCA/Freshwater Society publication. 2nd Edition (2004) is an update of the earlier edition. Provides a detailed description of a lake and how it works. Descriptions of what can happen to your lake over time such as sedimentation and eutrophication are given along with lake management and restoration techniques and explanations. Watershed management techniques are important to improving or sustaining lake water quality. Good introduction in compact package. The updated guide can be found on the MCPA website: http://www.pca.state.mn.us/hqzq141b.
“Citizen Lake Monitoring Program Handbook” - Monitoring water quality is important and by connecting with local volunteers the MPCA can build a large dataset that will help with the assessments of water quality. The handbook provides a complete guide to what is involved with the Citizen Lake Monitoring Program (CLMP): how to take data readings, how the data is stored and used, and how the data is beneficial to the MPCA. Note: Some outdated information in this document (i.e. data stored into STORET). The following link is to the most recent document. http://www.pca.state.mn.us/index.php/view-document.html?gid=6198.
Another guidebook, “The Volunteer Surface Water Monitoring Guide” can be found at http://www.pca.state.mn.us/yhiz8f0
MPCA Watershed Pages – Find information about the 81 HUC 8s here: http://www.pca.state.mn.us/index.php/water/water-types-and-programs/watersheds/watershed-overview-map.html
MPCA Watershed Approach Fact Sheet: http://www.pca.state.mn.us/index.php/view-document.html?gid=3887
MPCA Watershed Approach webpage: http://www.pca.state.mn.us/index.php/water/water-types-and-programs/surface-water/watershed-approach/index.html
MPCA Assessment and Listing Fact Sheet: http://www.pca.state.mn.us/index.php/view-document.html?gid=7940
MPCA Assessment and Listing webpage: http://www.pca.state.mn.us/index.php/water/water-types-and-programs/minnesotas-impaired-waters-and-tmdls/assessment-and-listing/water-quality-assessment-and-listing.html?dosef=1&betterpreview=1
Addressing Lakes in Watershed Restoration and Protection Strategies • January 2014 Minnesota Pollution Control Agency
18
Minnesota Stormwater Manual – the MPCA Municipal Stormwater Program has transformed its stormwater manual into Wiki format and is also updating the technical content. Information is provided on Best Management Practices, Minimal Impact Design Standards (MIDS), modeling, credit calculations, and more. Current link for the Manual: http://stormwater.pca.state.mn.us/index.php/Main_Page Stormwater Program Lakes Page: http://stormwater.pca.state.mn.us/index.php/Stormwater_management_for_lake_protection_and_restoration
The Minnesota Department of Agriculture (MDA) published The Agricultural BMP Handbook for Minnesota in 2012. This handbook is a literature review of empirical research on the effectiveness of 30 conservation practices. It includes a definition for each practice, along with estimates of effectiveness and costs. Current link for the Handbook: http://www.mda.state.mn.us/protecting/cleanwaterfund/research/agbmphandbook.aspx
Addressing Lakes in Watershed Restoration and Protection Strategies • January 2014 Minnesota Pollution Control Agency
19
References Barr Engineering. 2004. Detailed assessment of phosphorus sources to Minnesota watersheds, 2004,
prepared by Barr Engineering for MPCA.
Cross, T. and P. Jacobson. 2013 Landscape factors influencing lake phosphorus concentrations across Minnesota. Lake and Reservoir Management. 29(1): 1-12.
Farnsworth, D.K., Thompson, E.S., and Peck, E.L., 1982, Annual free water surface (FWS) evaporation for shallow lakes (1956–1970 map 3 in pocket) and evaporation atlas for the contiguous 48 United States: National Oceanic and Atmospheric Administration Technical Report NWS 33, scale 1:4,800,000.
Heiskary, S., and Wilson, B. 1994.Phosphorus export coefficients and the Reckhow-Simpson Spreadsheet: Use and application in routine assessments of Minnesota lakes (Working paper).
Minnesota Department of Agriculture, September 2012, The Agricultural BMP Handbook for Minnesota. Prepared by Tom Miller (Emmons & Olivier Resources, Inc.) et al. for MDA, St. Paul.
MPCA. 2007. Lake nutrient TMDL protocols and submittal requirements. Located at: http://www.pca.state.mn.us/index.php/view-document.html?gid=8527
Nürnberg, G.K. 1995. Quantifying anoxia in lakes. Limnol. Oceanogr., 40(6), 1995, 1100-1111.
Nürnberg, G.K. 2009. Assessing internal phosphorus load – Problems to be solved. Lake and Reservoir Management, 25: 4, 419-432.
Prairie, Y. and J. Kalff. 1986. Effect of catchment size on phosphorus export. Wat. Resour. Bull. 22(3): 465-470
Reckhow, K. and J. Simpson. 1980. A procedure using modeling and error analysis for the prediction of lake phosphorus concentration from land use information. Can. J. Fish. Aquat. Sci. 37:1439-1448.
Wilson, C.B. and W. Walker. 1989. Development of lake assessment methods based upon the aquatic ecoregion concept. Lake and Reservoir Management. 5(2): 11-22.
Walker, W. W., 1999. Simplified Procedures for Eutrophication Assessment and Prediction: User Manual. Prepared for U.S. Army Corps of Engineers, U.S. Army Engineer Waterways Experiment Station. Instruction Report W-96-2, September 1996 (Updated April 1999).