u . j 6'-- f ,ctb . civil engineering studies 3 · grain boundaries present a plane of...
TRANSCRIPT
/U I;2'111 f ,ctB
. J 1\ 6'--Rn'b~t ,,1 ~! OSrnn"g
. CIVIL ENGINEERING STUDIES f' 3 STRUCTURAL RESEARCH SERIES NO. 198 .... "
THE EFFECT F ( LING RATE AND RESTRAINT
ON ELD (RACKING Metz Reference Room Civil Engineering Department BI06 C. E. Building University of Illinois Ur'bana 9 " Illinoie 61801
By W. l. JOHNSON
and
J. E. STAllMEYER
A TECHNICAL REPORT
OF A RESEARCH PROGRAM
Sponsored by the
CHICAGO BRIDGE & IRON COMPANY
UNIVERSITY OF ILLINOIS
URBANA, ILLINOIS
JUNE 1961

TEE EFFECT OF COOLING BATE AND
RESTRAINT ON WELD CRACKING
by
W. L. Johnson and J. E. stallmeyer
A Technical Report
Of a Research Program
Sponsored by the
CHICAGO BRIDGE &: mON COMPANY
Uni versi ty of Illinois
Urbana, Illino'is
June 1961

PART A
III ..
IV ..
TABLE OF CONTENTS
INTRODUCTION .. .. .. .. .. .. .. .. .. .. .. .. .. .. ..
10 Object and Scope of Investigation 2.. Discussion of Problem 3 .. Acknowledgment .. .. .. .. .. ..
EQUIPMENT
I. Test Specimen ...... .. 2. Thermocouples ............. .. 3 .. Welding Equipment .. . .. . .. .. 4 .. ' Recording Oscillograph ..
CRACK INVESTIGATION
DETEEOO:NATION' OF COOLING RATES ..
CORREIATION OF TBEOBETICAL DATA AND CRACKING ..
REIATIONSHIP OF COOLING BATE TO SPECIFICATIONS ....
VII.. INVESTIGATION OF MICROSTRUCTURE
VIII" SUMMARY AND CONCLUSIONS
PART B
X.
XI.
XII.
INTRODUCTION .. .. .. • • .. .. ..
1.. Introductory Statement .. 20 Object and Scope . 0
MATERIAL AND EQUIPMENT ••
1.. Mat'erial.. .. 0 •
2 .. 30
Test Specimen Equipment
TEST PROCEDURE ..
CRACK INVESTIGATION
XIII.. ANALYSIS AND EXPERIMENTAL RESULTS
1 .. Analysi s .. 0 0 0 .. .. •
2 .. Experimental Results ..
XIV • GONCLUSIONS
BIBLIOGRAPHY
TABLES . . .' . FIGURES
1
1 2 3
4
4 5 6 6
8
II
16
22
24
26
30
30 30
32
32 32 33
34
37
39
39 45
52
54
55

Table Number
1
2
3
4
5
6
7
8
9
LIST OF TABLES
Surrrrnary of SB,ecimens Tested in Part Aj::;.Ene~gy Inputs ,.cooling Rates at ·750--:F: and.Degree ·~f . Cracking
Travel Speeds Required to Deposit Given Fillet Size.
AWS Specification Requirements for Fillet Sizes and Corresponding Calculated Cooling Rates.
AWS Specifications for Fillet Sizes and those Recommended in this Report.
Cooling Rates at 5720 F (3000 C) and Degree of Cracking.
Physical Properties of Material Testedo
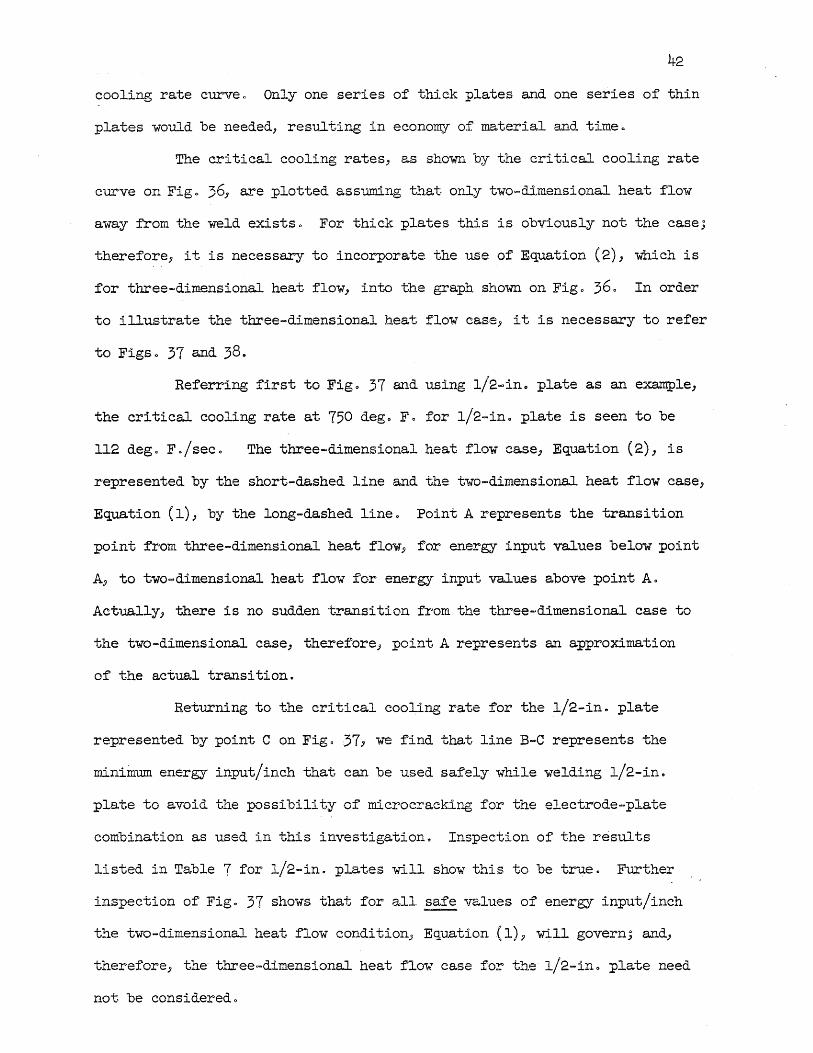
Summary of Specimens Tested i.n Part B, Energy Inputs, Cooling Rates, and Degree of Cracking.. (Efficiency of rate of heat flow from source = 80%)
Summary of Specimens Tested in Part B, Energy Inputs, Cooling Rates, and Degree of Crackingc (Efficiency of rate of heat flow from source = 70%)
Summary of Specimens Reported in Part A, Energy Inputs, Cooling Rates, and Degree of Cracking ~.' (Efficiency of rate of heat flow from source changed from 80% in previous report to 90% in this table)

Figure Number
1
2
3
4
5
6
7
8
9
10
11
12
13
14
15
16
l7
18
19
20
21
22
LIST OF FIGURES
Details of Fillet Weld Specimen
General View of Instrumentation
Specimen Assembled for Welding
Portable Magnaf'lux Prods
Iron Powder Showing Crack in Magnetized Specimen
Typical Oscillogram for Determination of Cooling Curves and Energyo
Macrograph Showing Typical Polished and Etched Specimen
Location of Hardness Survey
Specimen D-12-1" Weld No 0 1 Quenched After Welding
Specimen C-12-1" Weld NOe 2 Cooling Rate at 750°F = 2250F!sec.
Specimen B-1-2" Weld Noo 1 a Cooling Rate at 7500F = 168 F/seco
Specimen B-12-1" Weld Noo 2 Cooling Rate at 750°F = 94Q4°F/seco
Specimen D-12-1, Weld Nco 2 Cooling Rate at 7500F = 7504°F/seco
Hardness Surveys of Specimens Shown in Figs 0 9 through 13
Relationship Between Energy Input Per Inch and Fillet Leg Length 0
RelationshipOBetween Energy Input Per Inch and Cooling Rates at 750 Fo
Relationsr,j.POBetweeg. Energy Input Per II:tch and Cooling Rates at 572 F (300 q) '. -
Typical Weld Metal Crack Specimen C-12-1, Weld No. 2
Typical Weld Metal Crack Specimen C-12-1" Weld Noo 2
Typical Weld Metal Crack Specimen C-12-1) Weld Noo 1
Underbead Crack Specimen B-1-2, Weld Noo 1
Crack That Propagated Into Heat Affected Zone Specimen B-1-2, Weld No 0 1 .

Figure Number
23
24
25
26
27
28
29
30
3l
32
33
35
36
37
LIST OF FIGURES
Plot of Plate Thickness vSo Cooling Rates Showing the Transition from Cracked to Uncracked Specimens"
Test Specimen and Section of Weld Examined for Cracking.
Photograph Showing Semi-Automatic Welding Setup.
Crack in Weld Metal of Specimen p-3/8-3 Calculated Cooling Rate at 750oF. = 187°F./seco
Crack in Weld Metal of Specimen P-l/2-4 Calculated Cooling Rate at 750oFo = 161oFo/seco
Crack That Propagated into Heat-Affected Zone, Specimen P-3/4-1 Calculated Cooling Rate at 750oFo = 118°Fo/seco
Crack in Weld Metal of Specimen P-l l/4-1 Calculated Cooling Rate at 750oFo = 9905°F./sec.
Crack in Weld Metal of Specimen P-l 1/2-4 Calculated Cooling Rate at 750oFo = 113.8<7 .. /sec.
Crack in Weld Metal of Specimen P-l 1/2-6 Calculated Coaling Rate at 750oF. = 9602 F./sec.
Crack in Weld Metal of Specimen P-l 1/2-2 Calculated Cooling Rate at 750oF. = 67 .3oF o/sec.
Crack in Weld Metal of Specimen P-l 1/2~1 Calculated Cooling Rate at 750oFo = 5806°Fo/sec.
Microstructure in Heat-Affected Zone of Specimen P-l/2-3 a . 0 Calculated Cooling Rate at 750 Fo = 110 Fo/sec.
Photomicrograph Showing the Relative Size of Inclusions in Base Metal for Comparison wi thoMicrocrack8, Specimen P-ll/2-4 Calculated Cooling Rate at 750 F.. = 11308 F" / sec .,
Critical Cooilng Rates at 750oFo for All Plate Thicknesses
Tested ..
Re~tionship Between Energy Input and Cooling Rates at 750 F. for l/2-ino Plate.
RelationShip Between Energy Input and Cooling Rates at 750oF. for 1 l/4-ino Plate ..
Figure Number
39
40
4l
LIST OF FIGURES (Continued)
Relationship Between Energy Input and Cooling Rates at 750oF. for All~Plate Thicknesses Tested Using q = 80%0 Relationship Between Energy Input and Cooling Rate at 750oF. for All Plate Thicknesses Tested Using q = 80%. Relationship Between Energy Input and Cooling Rates at 750o
Fo for All Plate Thicknesses Tested using q = 70%.

PART A: A STUDY OF WELD CRACKING AS A FUNCTION OF COOLING RATES
I . INTRODUCTION
10 Object and Scope of Investigation
It is well known that peak. tem.peratures and cooling rates that occur
during welding have a definite effect on the metallurgical structure and
properties of the weld metal and material being welded. Peak tem.peratures will
determine the constituents that will be formed as a result of heating, while
the transformation products formed during cooling are dependent upon the cool-
ing rate.. Both are important in welding, but in Part A of this paper the
cooling rate is given major considerationo
The cooling rate is kno'W. to be a function of the energy input, joint
geometry, and to some extent, the ambient teIlIJ?erature 0 In an atteIlIJ?t to keep
the number of variables at minimum, only one type of steel and one type of
electrode will be considered 0 The most common structural steel is ASTM desig-
nation A-7 steel and a widely used all-position electrode is the E~6010
electrode; therefore, this electrode-steel combination was chosen for the
investigation.
Joint geometry is an important factor not only from the viewpoint
of cooling rate" but also because of the degree of restraint that it imposes
upon the weld metal during and after weldingo According to a report published
by C. Lo Mo cottre~,(l) restraint is not necessary for the initiation of
cracking but tends to amplify cracks ini tiated by other means 0 On this premise;
fillet welds were investigated under Part A of this programo The fact that
minimum fillet size requirements in the AWS specifications are based wholly
on past e~rience and not on experimental data gives additional purpose to
this investigation.
(1) Refers to reference listed in bibliographyo
2
2.. Discussion of Problem
Weld cracking can generally be of two major types: (a) high
temperature or hot cracks that occur almost immediately upon or during
solidification of the 'Weld metal, and (b) low temperature or cold cracks
that can occur either soon or possibly a day or two after welding. These
two classifications of weld cracking are further discussed below.
(a) Hot cracks generally occur in root passes of fillet welds
and are formed during solidification of the weld metal due to multiaxial
tensile stresses induced by shrinkage due to cooling 0 Most hot cracks
are of considerable magnitude and once initiated can propagate the entire
length of the weld.. A second type of hot crack, but somewhat less common,
is cracking that im tiates at and propagates along grain boundaries. The
grain boundaries present a plane of weakness to the multiaxial tensile
stresses that occur during solidification.. It has been suggested (5) that
hydrogen is a factor that contributes to hot cracking, however, the exact
role of hydrogen is not understood but is believed to be instrumental.(2)(3)
(b) Cold cracks are generally thought of as microcracks or under
bead. cracks.. According to Flanigan, ( 3 ) the effect of' hydrogen on microcracking
is significant at low-temperature cooling rates but its effect is not clearly
understood. The theory suggested by some investigators(4) (5) of the role of
hydrogen is as follows~ During welding; quantities of hydrogen are dissolved
into the weld ~etal and thereby can diffuse into the parent metal.. Hydrogen
is very soluble in austenite at all temperatures but is practically insoluble
in cold ferrite or martensiteo As a result, hydrogen is rejected upon
cooling from all areas as the austenite transforms 0 The hydrogen can gather
at aY.Ly discontinuity in the form of molecular hydrogen and thereby build up
pressures that may exceed the strength of the parent material and cause
cracking 0

The rate of cooling, as affected by joint geometry. and energy
input) is believed to -:be the most important factor associated with cold
cracking while restraint is believed to be one of the most important
:factors associated with hot cracking 0 The high temperature cooling rate
can be important since, when the cooling rate is at a low value, there
will be sufficient time for hydrogen or other entrapped gases to diffuse
to the surface, thus avoiding possible cracking due to these gases. The
cooling rate .at lower temperatures is significant as the transformation
products are dependent upon the cooling rateo The role of restraint is
somewhat debatable as can be seen from reports by various investigators
who have used the cruciform ( 6) (7) type test and those who have used the
controlled thermal severity(l) testo
3 D Acknowledgment
3
This investigation is a part of the structural research program
conducted in the Civil Engineering Department at the University of Illinois
under the direction of Dr.. N .. Mo Ne-wmark, Head. of the Civil Engineering
Department., Funds for this program have been provided by the Chicago Bridge
and Iron Foundation, and the investigation was conducted by Wayne L. Johnson,
the Chicago Bridge and Iron Research Assistant in Civil Engineering working
under the direction of J. Eo stallmeyer" Professor of Civil Engineering 0 A
considerable amount of the preliminary work was completed by Mr 0 R 0 S.
Wozniak, and this preliminary study is acknowledged.
The author would like to eXJ?ress his appreciation to the Chicago
Bridge and Iron Foundation for their support of his assistantship and the
personnel of the Civil Engineering Department shop for their assistanceo
Considerable adv~ce was given the author concerning the metallurgy of welding
by Professor W 0 Ho Bruckner of the Department of Metallurgy and this advice is
very MQch appreciatedo

4
II. EQUIPMENT
10 Test Specimen
In order to reduce the number of variables involved in welding;
only one type of electrode and one type of steel was used 0 The electrode
was theE-60m all-position) D .. C e reversed polarity electrode and the steel
was an ASTM designation A-7 steel.
Cottrell, etal, (1) found that the volume of the test specimen could
be considered a variable that affects the cooling rate of a weldo Small
specimens can become completely heated above the ambient temperature and
thereby reduce the cooling rate of the weld. This phenomenon is termed
heat satura.tion from lack of an adequate heat sink.. In order to preclude
the possibility of heat saturation, a relatively large specimen should be
used 0 The specimens used in this investigation exceed the minimum require-
ment for volume as prescribed by Cottrell.
Plate thickness is also an important variable up to the thickness
at which the heat flow changes from two-dimensional flow to three-dimensional
flow 0 Once three-dimensional heat flow exists for the given welding condi-
tions, the cooling rate becomes independent of plate thickness and de~ends
on energy input only; thus when three-dimensional heat flow exists, the
cooling ra.te is approximately the same as it would be for an infinitely thick
plate 0
The specimen used for this study is made up of two plates of equal
thickness, the bottom plate being 9 x 9-ino and the top 3 x 9-ino (see Figo 1)0
Specimens ~th different thicknesses were used so that the effect of plate
thickness on cooling ra.te could be studiedo In order to measure the cooling
rates in the heat-affected zone, thermocouples were inserted into holes of

5
predetermined depth drilled from the under side of the .plate into the heat
affected zone.
20 Thermocouples
Chromel-alumel thermocouples for the measurement of heat-affected
zone temperatures were fused together with a resistance welder which was
modified for this purpose. The junction to be fused was hammered flat
before welding 0 The thermocouples were then coated wi th ~Jskuereisen n,.. a
commercial ceramic which acted as an insulator against stray currents during
welding; however:; thi s was found to be unnecessary and perhaps better values
could have been recorded had the thermocouple junction been fused to the
specimen itself.
The required hole depth for locating the thermocouple in the heat
affected zones had been determined by depositing preliminary welds which
were sectioned and the depths of the heat-affected zones measuredo The
thermocouples were then located at the expected location of the heat-affected
zone; however, variations in the depth of penetration proved to be greater
than predicted. As a result" many of the thermocouple junctions were either
consumed by the molten metal of the weld or were located at a distance too
far from the fusion line to gi ve results that could be considered reliable 0
Satisfactory results were obtained only from thermocouples that were located
exactly at the fusion line. The number of measured cooling rates listed in
Table I is indicative of the problem encounteredo The measured cooling rates
are to be used only as an indication of the validity of theoretically cal
culated cooling rates as will be shown later; therefore, extreme accuracy was
not essentialo

6
30 Welding Equipment
Welding was done manually and every effort made to duplicate
typical sbpp welding procedures 0 If automatic welding equipment had. been
used utilizing high travel speed and high energy input, special consideration
would have to be given to these effectso(8)(9)
The welding current was supplied by a 200 amp capacity Westinghouse
D. C ., type RA, welding machine.. The electrodes were kept in a drying oven
at a temperature of 300 deg .. F" for several weeks prior to use in order to
insure removal of moisture which might have been detrimental ..
All specimens (See Fig. 3) were welded at room temperature (70 deg.-
80 deg. Fo); the second weld was not deposited until the specimen had returned
to room temperature. During welding a recording oscillograph "Was used to
record the voltage and amperage and the thermal history of the heat-affected
zone" Calibration of the voltage and amperage traces had been made by apply-
ing the welding machine current to a salt-brine solution. The voltage vas
measured between the. electrode holder and the ground clamp.. The voltage and
amperage were not constant during welding because of the changing arc length;
therefore, the traces recorded on the oscillograph deviated by as much as 10
percent. An average value was taken in order to eValuate the energy input ..
(See Fig. 6)
4.. Recording Oscillograph
The recording oscillograph was a Heiland MagnetiC Oscillograph (Type
SE-303R-12) modified for this application (See Fig. 2)" This unit has 12
recording channels, five of which were used in the tests; two were held irl
reserve and the remaining .channels were blocked out" The galvanometers were
type A units (DoC 0 sensitivity, Boo MM/MA undamped) 0
The oscillograph and thermocouple galvanometers were calibrated with
a standard millivolt source which simulated temperatures up to 2000 deg" F.. A
7
study of the calibration curves showed a maximum error from average at
2000 deg. F. of 300
or 2: 1 1/2'/0) an error "Which decreased linearly as the
temperature decreased.
The motor speed driving the recording paper of the oscillograph
~s not constant; therefore) it was necessary to record the welding time
for each test.

8
III. CRACK INVESTIGATION
Some longitudinal cracks could be observed by visual inspection;
however, to determine positively whether or not a weld had cracked a mag
netic particle inS]?ection was utilized. A set . .of portable magnaflux pr,ods
(See Fig. 4) ~ used with a Lincoln, 600 amp, motor generator unit,
utilizing a current of 100 amps/inch of distance between prods. A crack
detected by this method is shown in Fig. 5.
The longitudinal type cracking encountered always occurred in the
second fillet weld deposited and initiated at the terminal end of the weld.
In general, the cooling rates measured at this location were higher than
those measured at the center of the length of the weld. This is to be
expected, however, as steady state conditions do not exist at either end
of a weld. The terminal end of the weld also exhibited the characteristic
crater caused by removal of the electrode with a resulting depression in
the weld metal.
A decrease in weld metal area) the high cooling rate and restraint
imposed by weld No. 1 can all be factors causing initiation of longitudinal
weld metal cracking 0 The exact cause is unknown, but restraint seems to be
the most important variable as only weld No 0 2 exhi bi ted thi s type of cracking.
Building up of weld· metal at the terminal end by crater filling is
recommended for two reasons. One, the cooling rate will be reduced as a result
of the added energy input, and two, the added weld metal will add to the
resistance to stresses due to shrinkage and thereby help prevent cracking.
It will be shown below that the elimination of microcracking
encountered also tends to eliminate longitudinal type cracking.

9
Investigations conducted ,by Flanigan(3)(11)(12) using an E~6010
electrode and mild steel combination show the existence of microcracks in
the weld metal. It was} therefore} assumed that this type of cracking
would be encountered in this investigation. Also there is a report pub
lished by Co M. Ada.ms(8) which makes it possible to calculate peak temp-
eratures and cooling rates that occur during welding. The measured cooling
rates were determined by constructing the slope of the time-temperature
curve (See Fig .. 6) at the temperature for which the cooling rate is desired.
The cooling rates as measured by thermocouple Noo 7, which is. the thermo-
couple located at the center of the length of the weld, are shown in Table 1
and these values are also plotted on Fig. 160 The cooling rate for each
specimen was calculated by use of Adams' equations and then, using these
cooling rates as a basis for the order of examination, the welds in the
order of decreasing cooling rates were examined for microcracks. (See
Table 1.)
At mid-length of the weld, a section was removed which 'Was approxi
mately one inch long. This section was then cut at a 45 deg. angle through
the throat of the weld. (See Fig. 7 for the polished specimeno) The section
was then polished and etched using a 5 percent nitric acid, 95 percent ethyl
alcohol etchant. Prior to etching, the specimen was examined under the
microscope for cracking. This was done to preclude the possibility that
any cracking found could have been caused by the etchant itself.. After
etching, the' specimen was re-examined. If cracking was fo~ to exist in
the specimen, it was always found before etching, and if there was any
additional,·cracking caused by etching, it was ·not discernible ..

10
When cracking was found in one specimen, the specimen with the next
lower calculated cooling rate was cut, polished, etched, and examined. This
procedure was continued until specimens were found that had absolutely no
cracking. In addition to the specimens that were welded and allowed to cool
in still air at room temperatur~} one additional specimen (D-12-1) was welded
and treated as follows. The first weld was laid and quenched in water at
70 deg. F. immediately after welding. The second weld was laid and then
allowed to cool in still air with an ambient temperature of' 20 deg. F 0 This
was done to provide specimens with cooling rates other than would ordinarily
occur.
-From the specimens that were examined, five were selected on the
basis of' cooling rate and degree of cracking to be photomicrographed. These
photomicrographs are shown in E::gs... 9 through 130 Hardness surveys of each
specimen were taken and the results are shown on Fig. 14.

II
IV 0 DETERMINATION OF COOLING RATES
During the IJt"e1iminary phase of this investigationJ many welds
'Were laid during which the voltage and amperage was re'corded 0 The fillet
welds laid were sectioned and the leg lengths of the fillets were measured 0
A plot of leg lengths versus energy input in Joules per inch revealed that
the relationship was approximately linear" The following equation was
derived from this relationship~ (See Figo 15)
where Eoro = energy input per inch (Joules per inch)
L = fillet leg length (inches)
This equation is very similar t.o one found by Cottrell (1) his equation
being;
(2)
This tends to bear out the fact that fillet welds deposited by AoCo currentJ
which Cottrell used" and those deposited using DoC 0 reversed polarity are a
linear function of the energy used to deposit the welds and are likewise
quite independent of electrode coating,,(l) Observation of the graph of
Fig .. 15 shows that Equation (1) (DoC 0 Reversed Polarity) will require higher
energy inputs for larger welds} but approaches tJ:le Aoe 0 values for smaller
welds.
Generally} the values of energy input calculated by use of either
Equation (1) or (2) would be adequate because there is considerable scatter
of the ~lotted valueso There is some question regarding the merits of
inferred accuracy of Equation (1); however J Fig 0 15 indicates that Equation
(2) falls somewhat below the plotted data particulaJ:"ly at high energy inputs"

12
For 1/8-ino fillet welds either equation would give values that are too low 0
Better values can be obtained by using a curve as shown in Fig. 15 for values
of energy input less than 20,000 Joules per inch.. This 5i tuation occurs
because the curve must pass through the origin 0 The equation used at higher
energy inputs should be selected according to the current and pola:ri ty being
used 0 (The relationship for DoCo straight polarity is not known at this time.)
Using either Equation (1) or (2), it is possible to determine the
approximate energy input required to deposit a given size filleto Knowing
the fillet size desired and electrode to be used, we can then utilize the
electrode manufacturersurecommended voltage and amperage to calculate the
travel speed that will be necessary to deposit the desired size filleto
Example:
Joules = inch
Travel Speed =
or Travel Speed =
5/16 fl fillet desired
From Fig. 15, 47,000 Joules/inch required.
USing A 0 00 Smith electrode chart ~
Electrode 3/16" Recommended current 170-190 (Flat position) Recommended voltage 27-29
Vlt (I~. ) Voltage x Amperage 60 . L or Travel Speed = Min. Joules/inch x
(\~o ) = v= {170H27}~ 60) = 5086 In./Mino Minimum Min 0 (47,,000
(~o ) (190) (29) ~ 60) 7.04 Ino/Min" Maximum = v= = Min .. (47,000
See Table 2 for minimum and maximum travel speeds to be used with the
designated electrode size and fillet sizeo Similar relationships can be
established for other electrode-fillet sizes or welding positions other
than flato
Once the required travel speed has been calculated, it becomes
possible to calculate peak temperatures and cooling rates by the use of

13
equations developed by CoMo Adams. (8) Consideration must be 'given to the
fact that a condition in which three-dimensional heat flow might exist could
be changed, to two-dimensional heat flow by varying travel speed and greatly
increasing energy input. As a result of this possibility} peak. temperatures
and cooling rates must be calculated for both two- and three-dimensional heat
flow. In the case of peak temperature, the highest value 'Would be the more
nearly correct whiie for cooling rate~ the lower value would be the more
correct. (8)
where:
Peak temperatures:
2-dimensional heat flow
1 =
vr 'tpC' ,'J2lre p'
T - T p 0
3-dimensional heat flow
1 T - T P 0
Cooling Rates:
= 2:n:IC~
qv
2-dimensional heat flow
3-dimensional heat flow
T = peak temperature (oF 0 )
P
T = plate temperature (oF 0 )
°
q 1
+ T - T m 0
(4)
( 6)

K ~ thermal conductivity of plate (Btu/fto-hroOFo)
v = velocity of source (In./Min.)
p = ~~nsity of plate (Lbso/fto3)
C = specific heat of plate (0155 Btu/lbu-oF.) p
t = plate thickness in inches
rf = distance from fusion line in inches
q = rate of heat flow from source (BtU/hr.)
T = melting temperature of metal ,( OF 0 ) m
T' = temperature at which cooling rate desired
0; K = pCp
14
The value of K varies co~siderably but average values give fair results.
For calculating peak. teIl1J?eratures K = 20 Btu/ ft" -hr .. - OF 0 For calculati ng
cooling rates
at 10000F. '"", 0 K= 22 Btu/ft.-hr.- F.
at 750°F 0 K,~ 24 Btu/fto-hro-oFo
at 572oF .. K ~ 26 Btu!fto-hro-oFo
The rate of heat flow for fillet welds for trithermal conditions is taken
at 2/3 q and generally at 80 percent efficiencyo(8)
In the previous discussion a method for calculating peak tempera-
tures and cooling rates has been presented) this method can be used providing
the thickness of the material to be welded is known. The plate thickness as
used for fillet welds assumes that the top plate and bottom plates are of the
same thickness.. Should the top plate thickness vaxy from the bottom plate,
consideration must be given to this variation if the conditions, are such that
two-dimensional heat flow governs 0 When the top plate thickness is relatively
thin as compared to the bottom plate, then the rate of heat flow should be

15
taken at some value larger than 2/3 q. When the top plate is relatively
thick as compared to the bottom plate] then the rate of heat flow should
be taken somewhat less than 2/3 q. If three-dimensional heat flow g·overnsJ
then the plate thickness has a negligible effect unless the top plate is
relatively thin (1/2" or less) 0 When this occurs the rate of heat flow
should be increased somewhat above the 2/3 q value assumed. .An alternate
approach would be to adjust the heat flow .efficiency accordingly.

16
V" CORREIATION OF THEORETICAL DATA AND CRACKING
In order to make use of any theoretically calculated cooling
rates) it is necessary to establish a relationship between cooling rate
and cracking.. This has been done in the experimental phase of this
investigation. Table 1 of this report shows the specimens that were
welded, the energy inputs, the calculated cooling rates, and the measured
cooling rates. The cooling rates are those occurring at 750 deg 0 F 0 sInce"
this is approximately the M temperature for mild st~el and was calculated . s
by using the M formula as presented in the Metals Handbook 0 ( 10) s
Study of Table 1 shows that in all cases except when welding the
1/2-in. plate, the three-dimensional heat flow governed (lo~st values).
This would tend to indicate that under ordinary manual welding procedures,
the h~at flow will ordinarily be three-dimensional unless welding 1/2-ino
or thinner plates. It is possible, however, to have .. two-dimensional heat
flow govern whenever large energy inputs are used even on thicker plates.
A plot of energy input versus cooling rate is shown in Figo 16.
Micro-inspection of the specimens that were" etched and polished
shows that by using the cooling rate as a parameter, a cooling rate of
llO deg. F 0/ sec" at 750 deg" F 0 can be taken as the di vi ding line between
specimens that showed cracking and those that showed no . cracking " Inspection
of Table 1 shows that possibly a range of cooling rates should be considered
as a range in ~ich cracking might or might not occur. This is shown by
specimen B-12-1, weld Noo 1, in which no cracking occurred but for which
the calculated cooling rate vas ll7 deg. F./sec. "While specimen B-l-l, weld
No.2, which had a calcuiated cooling rate of 112 deg. F" I sec 0, showed crack-
ing. This difference might be attributed to the change in restraint introduced

17
because of variation in plate thickness. However) the cracks that existed
were relatively minute as compared to the cracking shown in Fig. 18" The
specimens inspected with cooling rates less than 110 deg. F./sec. showed no
cracking; therefore, 110 deg. F./sec. is the approximate upper limit at which
no cracking will occur. This becomes the critical cooling rate for the
electrode plate combination investigated using the test configuration shown
in Fig. 10
It is also interesting to note that the smallest longitudinal
crack (Fig. 5) occurred at the corresponding cooling rate of ~ deg. F./sec.
and in the same weld in which the smallest (Fig. 18) type crack was found
(See Table 1). With reduced cooling rates Fig. 5 type cracking was no
longer encountered. It is possible that the two types of cracking are
dependent upon cooling rate) although the role of restraint would have to
be investigated further by varying the test specimen configuration and
noting the effect on the longi tudinal type cracking. It must be remembered,
however, that the longitudinal crack was initiated at the terminal end of
the weld where different thermal conditions exist and a cooling rate greater
than 112 deg. Fe/sec existed.
Another observation from Table 1 shows that the specimen D-12-1,
weld No.1 which ~s quenched, exhibited only 1 crack/inch and this was
relatively small. The cooling rate was definitely the most severe and the
only explanation available for the lack of cracking is as explained in a
paper by Flanigan and Saperstein (12) which states that a brief period of
immunization to cracking prevails after welding" If quenched during this
period the welds will show little, if any, microcracking 0
18
The solid curve of Fig. 16 was plotted using only the value s
for cooling rates as determined by Equation (6) which is for three
dimensional heat flow 0 Superimposed. upon Fig 0 16 are the cooling rates as
calculated by use of Equation (5) for two-dimensional heat flow. Although
there was insufficient measured data available to plot completely the two
dimensional heat flow curves, additional data vas calculated USing
Equation (1) and the recommended voltages and amperages.
The significance of plotting both two- and three-dimensional
heat flow cooling rate curves is as follows 0 The intercept of a two
dimensional heat flow curve with the three-dimensional curve is the transi
tion point. ' Above the intercept two-dimensional heat flow governs (Equation
5). Below the intercept three-dimensional heat flow governs (Equation 6) 0
Calculating the energy input/inch by use of Equation (1) allows one to enter
Fig. 16 directly and the cooling rate can readily be determined providing
the plate thickness is knO'Wll. (T'op and bottom plate thicknesses are equal
for curves on Figo 16) 0
For example, suppose it is necessary to deposit a 5!16-ino fillet
weld on 3/4-ino plate (top and bottom plates 3/4-in. thick). From. Fig. 15
it is noted that this fillet requires approximately 47,000 Joules/inch
energy input. Entering Fig. 16 at 47,000 Joules/inch, one finds that for
the 3/4-ino plate t'Wo-dP-mensional heat flow gives the lowest cooling rate
value and, therefore, governs. (Note that we are above the intercept of the
two- and three-dimensional heat flow curves for 3/4-in .. plate.) The corre
sponding cooling rate is approximately 50 deg. F ./sec .. and considerably below
the critical cooling rate of 110 deg. F. Therefore, no cracking will be en
c01ll1teredo Now assume that it is necessary to lay a 3/l6-ino fillet weld on
the same plate 0 This requires approximately 20,000 Joules/inch (Fig. 15).

19
Entering Fig. 16 again at 20,000 Joules/inch one finds that this point is
below the intercept of the two- and three-dimensional heat flow curves and,
therefore, the three-dimensional heat flow governs. The corresponding
cooling rate 'Would be approximately 160 dego F ./sec., -which is above the
critical cooling rate of 1I0 deg. Fa/sec. and consequently a 3!16-in. 'Weld
should not be deposited on 3/4-in. plate. However, preheat could be used to
reduce the cooling rate so that the 3/16-in. weld could be used. The amount
of preheat can be determined from Eq,uations (5) and (6) by substituting
110 deg. F. / sec G for the cooling rate and solving for T J the plate temperao
tureo Tests using preheat have not been run to date -so this method. of
determining the amount of preheat should be used with caution.
Also plotted on Fig.. 16 are the cooling rates which were measured
at 750 deg. Fo by the thermocouples which were inserted into the heat-affected
zone at mid-length of the weld. The locations of the points indicate that
the calculated cooling rates are somewhat lower than the measured values ..
This is true more so at low energy input values than for high values 0 The
calcula.ted v-alues are for coolir...g rates that occur at the center of the
weld bead while those measured occur at a point in the heat-affected zoneo
Theoretically the cooling rates in the weld bead should be greater than
those in the heat-affected zoneo The discrepancy could be due to the selec-
tion of the value of K (thermal conductivity) which varies for different
temperatures or to the assumed efficiency of heat flow. Additional testing
might result in a better selection of K or efficiency of heat flow in order
to adjust the theoretical curve to fit the measured values. The measured
values for cooling rates should be taken in the weld bead itself for maximum
agreement between theory and testso

20
Inspection of Table 1 shows that only a small number of the measured
cooling rate values are shown.. It was found that" in a number of instances)
the distance from the therm.6cou:ple junction to the fusion line \t18.S so great
that relatively low peak temperatures were recorded. The cooling rate at
750 deg. F. occurred near the peak of the time-temperature curve (See'Fig. 6);
therefore) the values were of doubt:ful value and not included.
In addition to calculating the cooling rates at 750 deg. F.) the
cooling rates at 572 deg. F .. (300 deg .. Co) using K = 26 Etu/:ft.-br .. -oF,. were
calculated.. These values are sho'WIl in Table 5 and are plotted on Fig 0 17 e
The same general characteristics occur in both cases; however) a greater
number of measured cooling rates are available at the lower temperature" It
can be seen from Fig. 17 that the discrepancy between calculated and measured
cooling rates is greater at 572 deg. F. than at 750 dego F. This is partially
due to the fact that the additional measured cooling rates plotted have a
larger error because of a greater distance from t..."1e fusion line to the thermo-
couple location which resulted in lower peak temperatures being recorded.
The peak temperature can be used as an indication of the weight 'Which should
be given to the measured cooling rates "When they are compared with the cal-
culated cooling rates. This is due to the :fact that the calculated cooling
rates are those that occur at the center line of the weld metal and this
automatically assumes a peak: temperature equal to that o:f the molten metal 0
On the other hand) any measured cooling rate outside the molten pool actually
~ll have a peak temperature somewhat less than the temperature o:f the molten
metal. The peak temperature will depend on the distance from the :fusion line 0
Inspection o:f Fig. 16 and Fig. 17 shows that, in general, there is
:fair agreement between calculated cooling rates and measured values. I:f

21
Table 5 is used to determine the critical cooling rate, it is found to be
ap]?roximately 65 deg. F./sec. at 572 deg. Fe However, it seems that the
relationship between cooling rate and cracking is much better at 750 dego Fo
than at 572 deg. Fo; also, there is a rational basis for choosing a cooling
rate at 750 deg. F. as it is the approximate M temperature for mild steel. s
Therefore; the critical cooling rate of 110 deg. F./sec. at 750 deg. F.
shall be used throughout Part A of this report.

22
VI 0 REIATIONSHIP OF COOLING RATE TO SPECIFICATIONS
The AWS welding specifications for fillet welds are based on
experience only; therefore} it is desirable to determine whether or not
the specifications are safe} unsafe} or too conservative 0 This can be
done, at least for the electrode-plate combination as used in this reporto
Table 3 lists the minimum fillet size that is to be used with the given
plate thicknesses according to specifications. Table 2 shows the energy
input (Joules/inch) that would be required to deposit the given size
fillet. This energy input 'W8.S calculated by use of Equation (1) 0 Table 2
also shows the minimum and maximum welding speeds that could be used to
lay the designated fillet size with the electrode shown 0 This was cal-,
culated using
~volts2(!J1s)(60) = v inches/min. Joules inch
Table 3 shows the plate thicknesses and minimum fillet sizes as
designated by the ~ecifications and the corresponding cooling rates cal-
culated by use of Equations (5) and (6) 0 By inspection of Table 3 it can
be seen that all of the governing calculated cooling rates are somewhat
less than the critical cooling rate of 110 dego Fo/sec. except the cooling
rate for a 3/l6-ino fillet on 1/2-in. plate. This indicates that cracking
might possibly occur in the 3/l6-in" fillet. Therefore, a larger weld
requiring a larger energy i~ut/inch should be used on 1/2-in. plates 0
Equation (1) indicates that a 1/4-ino fillet requires 33}500 Joules/inch.
Entering Fig. 16 one finds that the corresponding cooling rate for 3/~-in.
plate is 92 d'eg • F./sec. and for thicker plates in which three-dimensional
heat flow governs, 95 deg" Fa/sec. Therefore, a 1/4-in. fillet weld could
be the minimum size fillet required for any plate thicknessesi'or this
electrode-plate combination.

23
Table" 4 shows the comparison o~ the specified fillet sizes and
those recommended in thls report and tends to show that the specifications
are conservative for thick plates but are possibly unsafe for the 1/2-ino
plate for this electrode-plate combination.

24
VII 0 INVESTIGATION OF MICROSTRUCTUBE
Investigations conducted by Flanigan(3) (11) using the &-6010
electrode and mild steel combination for welding have indicated the
influence of hydrogen on crackingo Flanigan has also shown· that reducing
the cooling rate by use of preheat will reduce and possibly eliminate
cracking. The results of the investigation reported herein also tend
to show that a reduction in cooling rate ~ll reduce or eliminate crackingG
It is well known that the transformation products" martensite,
baim te, and pear Ii te, are dependent upon the cooling ra.te, and it seems
that the diffusion rate of hydrogen is also dependent upon cooling rateo
It would be desirable to know -whether or not the transforma.tion products
can be related to the cracking encountered 0
In an attempt to clarify the role' of the transformation products}
a series of specimens was examined at a magnification of 5000 The severity
and type of cracking" as well as the calculated cooling rates/- of this
series is shown in Table 1.. Examination of Table 1 shows that generally
the severity of cracking d~creases with decreasing cooling rate~ The micro
examination showed that the acicular martensitic type structure existed in
varying degrees in specimens that had cooling rates below the critical
cooling rate and in which no cracking was encountered.
The existence of the acicular type structure is also fairly evi
dent in the series of photomicrographs Figs 0 9 through 130 The magnitude and
characteristics of the general type of cracking are shown in Figso 18 through
20. The type of cracking shown in Fig 0 21 (underbead crack)" as well as
that shown in Figo 22, in Which the crack propagated into the heat-affected
zone occurred in only one specimen) and this is one that showed extreme
hardness in the heat affected zone as will be shown by the hardness survey 0

25
A hardness survey was taken of the specimens sho'WIl in Figs.. 9 to
13 using a Tukon Hardness Tester (Model FB) wi th a 1360 diamond pyramid and
a 500 gram load.. The results of the hardness survey are sho"W!l in Fig. 14 ..
Study of Fig. 14 shows that a high degree of hardness occurred in the weld
metal.. Specimens 1" 2, and 3 had cracking in the weld metal while 4 and 5
did not.. It is interesting to note that 4 had. higher hardness than 3 in
the weld,. metal but did not develop cracking. It is also interesting to
note that the cracking shown in Figs. 21 and 22 occurred only in specimen 3
w.hich exhibits extreme hardness in the heat-affected zone close to the
fusion line. A comparison of hardness and cooling rate shows that the
degree of microhardness does not necessarily decrease ~th decreasing cooling
ratee
From the results obtained from the microhardness surveys it has
been concluded that no suitable relationship between microhardness and micro
cracking can readily be established. Nor does it seem feasible to relate
the transformation products to microcracking unless extensive tests are
carried out to determine the existence of martensite" tempered martensite,
or bainite, as the acicular-type microstructure common to these constituents
was found to exist at cooling rates below the critical cooling rate.

26
VIII. SUMMARY AND CONCLUSIONS
The number of specimens that have been tested in this investigation
are someWhat limited} but the follo~ng conclusions seem to be justified.
1. Results of plotting energy input (Joules/inch) versus fillet
leg length show an approximate linear relationship exists for DoCo reversed
polarity as well as for AoC. welds deposited manually using relatively low
travel s:peeds and nominal voltage and amperage.
2. The travel speed required to lay a desired size fillet can be
computed by using Equation (1) and the voltage and amperage recommended by
the electrode manufacturer.
3 · Peak temperatures and cooling rates can be calculated by use
of equations developed 'by CoM. Adams 0 (8) Fair agreement between actual
cooling rates and those calculated at 750 deg. F 0 can be shown 0 Whether two-
or three-dimensional heat flow exists depends on plate thickness, energy
in:put" and ini tia.l plate temperature.; therefore} it is necessary to calculate
(8' cooling rates for both cases, the lower cooling rate being the more correct. )
4. The results of this investigation using the test configuration
shown in Fig. 1 tend to show that a critical cooling rate was determined to
be 110 deg.. F _/ sec. at 750 deg 0 Fe from the micro-inspection of all specimens c>
A further look at Table 1 will dis.close that by separating the specimens into
groups containing only specimens of the same thickness, a critical cooling
rate for each thickness might be established. For example, Specimen B-12-1,
Weld No 0 :1) with a cooling rate of 117 deg 0 F 0/ sec 0 had no cracking while the
-specimen with the lowest cooling rate that had cracking (B-l-l, Weld No 0 2)
is twice as thick. This indicates that possibly a critical cooling rate
exists for each plate thickness due to the variation in the stress conditions

27
imposed by the different plate thicknesses. Additional testing must be
carried out to evaluate this possibility; however, use of the results as
presented in this report would be conservative.
A critical cooling rate at temperatures other than at 750 deg. F 0
can also be determined as is shown by the critical cooling rate determined
at 572 deg. F 0' (300 deg 0 C.) and shown on Fig. 17 0 However, the best
correlation between cracking and cooling ra.tes seems to occur at 750 deg. F 0,
which is' approximately the M temperature for mild steele s
5. The electrode-plate combination as used in this investigation
showed considerable susceptibility to both microcracking in the weld metal
and longitudinal crackingo From the calculated cooling rates as shown in
Table 3, it can be seen that a 3/16-ino weld on 1/2-in. plate exceeds the
critical cooling rate of 110 dego Fa/seco and, therefore, could possibly
possess microcracks and/or longitudinal cracking. -
The AWS specifications allow 3/16-in. fillet welds to be placed
on 1/2-in. plates and are, therefore, possibly unsafe 0 For other minimum
size fillet welds on thicker pla.tes the AWS specifications are conservative.
60 Investigation of the microstructure seems to indicate that
cracking is not necessarily associated with the transformation products as
the acicular-type microstructure persisted in the heat-affected zone even
after cracking had been eliminated. The specimen 'With the most severe
cracking in the weld metal had the lowest hardness in the heat-affected
zone 0 (See Fig. 140) It ~uldJ therefore, seem that the transformation
products cannot readily be used as a,parameter for dete~ning a critical
cooling condition; however, it must be noted that extreme hardness in the

28
heat-affected zone can very well be detrimental, for it was found that cracks
initiated in the weld metal can propagate into the base metal (See Figo 14
and Fig 0 22) and become more serious than would be the case if cracking were
confined to the weld metal itself.,
70 Observation of Figo 5 and Figo 18 through Fig., 20 shows the
general ty:pe and magnitude of cracks encountered in this investigation. There
is a poss.ibil~ty that r.estraint may~~fect the magnitude of the cracks, as
well as the critical cooling rate as was noted ,under conclusion No.4. How-
ever, this possi bili ty remains to be investigated. Restraint definitely
seems to be a factor that affects longitudinal cracking (Figo 5) as longitudi-
nal cracking occurred only in Weld No 0 2 where additional lateral restraint
is imposed by Weld No .. 1. Under highly restrained conditions, it would be
desirable to deposit an oversize fillet rather than one that would just meet
cri tical cooling rate requirements 0 This :would be desir:able for the follo'W-
ing reasons: all of the longitudinal cracks which were encountered had
originated at the terminal end of the weld Where a crater exists and the
cooling rate is somewhat higher than that along the length of the weldo
The crater has a reduction in weld metal area and, therefore, a reduction
in resistance to weld metal cracking while the increased cooling rate might
conceivably exceed the critical rate and, therefore, help to initiate cracking 0
Backstepping or any other method of crater filling ~ll help to preclude the
possibility of longitudinal cracking.
8., Quenching upon completi.on of a weld seems to eliminate or at
least decrease the severity of cracking. Only one specimen was quenched in
this :i.nvestigation, but the results are in accord with resul.ts found by
Flanigan 0 ( 12) The limiting time in which the weld must be quenched.? however J

29
is unknown; therefore" this procedure cannot be recommendedo The possibility
that martensite will be formed is greatly increased by quenching 0 Should
quenching be used to prevent microcracking" thermal treatment should be used
to produce tempered martensite if service conditions demand a more ductile,
impact-resistant producto
90 If welds must be laid under conditions in 'Which the critical
cooling rate might be exceeded, then preheat should be used.. The use of
preneat has been fonnd to be more e.ffecti ve at r'edu.eing. low j;emperature cooling
rates than has pos'theat 0 (~l) The amount of preheat required can be found by
using the critical cooling rate in Equations (5) and (6) and solving for the
required initial plate temperature T .. o
10.. The method as used in this investigation for determining
critical cooling rates, as well as the method used for calculating cooling
rates} can be used for any other electrode-plate combination as long as
nominal values of voltage, amperage" and travel. speed are used such as would
be expected in manual -weldingo The possibility that restraint might a:rfect
the critical cooling rate indicates that at present this type of analysis
should be limited to conditions of nominal restraint Only 0
PART B: A STUDY OF, THE EFFECT OF PIATE THICKNESS ON THE CRITICAL COOLING RATE OF 'WELDS
IX 0 INTRODUCTION
10 Introductory Statement
30
In the first phase of this pr'ogram, repo+,ted in Part A of this,
report, it ~s determined that a critical cooling rate for welds does exist
for an ASTM d~signation A-7 steel and the E-6010 electrode combination. A
correlation was ob~ained between the cooling rate at 750 deg. F. and the
presence of weld cracks 0 At 750 deg" F. a cri ti'cal cooling rate -was
determined; above 'Which microcracking in the -Weld metal occurred and below
which ~ cracking occu:r:"~edo The critical cooling rate for 'Welds -was
determined from a series of test specimens on Which fillet welds were
deposited manually and then sectioned, polished, etched} and examined
microscopically for cracks. The fillet welds were deposited on plates
of different thicknesses, ~d one critical cooling rate was determined
for the entire series 0 No attempt ~s made to determine the effect of
restraint caused by geometry or plate thickness upon the critical cooling
rate 0
2.. Object and Sco;pe
From the results of the series of tests reported herein, an
attempt is mBde to determine the effect of restraint upon the critical
cooling rate; the restraint being taken as a function of plate thicknesso
The effect of restraint has been evaluated by determining a critical
cooling rate for each plate thickness tested. It was necessary to deposit
only bead-on-plate welds in order to study the ,role of restraint. In this
way the effect of joint geometry has been eliminated and the study of

31
restraint simplified Q The degree of restraint im,posed upon a bead-on-plate
weld is to a certain degree a furlction of the thickness of the plate being
welded. This is readily understood when one considers the fact that 'Welds
on thin plates produce maximum distortion andJ as a result, minimum residual
stress, while thick plates produce minimum distortion and, as a result,
maxlmum residual stresso
From the 'Work reported in Part A it was noted that a different
critical cooling rate might exist for each plate thickness testedo This
possible difference in critical cooling rates was thought to be a :function
of the restraint imposed on the weld due to plate thicknesso As a result,
the series of tests reported herein is an attempt to clarify the role of
restraint upon the critical cooling rate of welds. Restraint is taken as
a function of the plate thickness) and no attempt is made to distinguish
between thermal stresses, stresses due to specimen geometry, or stresses
which result from volumetric changes due to phase transformationso

32
x 0 MATERIAL AND EQUIPMENT
10 Material
The material used in this investigation is similar to the material
used in the study reported in Part AJ namely} an ASTM designation A-7 steel
in the as-rolled condition in combination ~th an E-6010 electrodeo
Several tension tests were carried out using standard tensile speci-
mens made from the 3/4-ino and 1 1/4-ino thick plateso A chemical analysis
of representative samples from various :plate thicknesses was also performedo
These tests were conducted in order to further classify the material investi-
gated 0 The results of these tests, as well as properties (manufactureris
values) of the electrodes used, are listed in Table 60
20 Test Specimen
The specimens used in this investigation were 4 1/2 x 9...,ino plates
and varied in thickness from 3/8-ino to 1 1/2-ino (See Figo 24) The size
of the specimen was such that heat saturation did not occur during weldingo
Accordir~ to Cottrell} the vol~me of an ideal weldability test assembly
should be greater than 36-1/2 t cubic inches in order to avoid heat satura
tiono(l) This condition is satisfied by the test specimens used in this
investigation. A 3/32-ino diameter hole was drilled through the test specimen
and a steel plug of a predetermined thickness was inserted into the hole from
the side to be weldedo This was done only for the 3/8...,inoJ 3/4-inoJ and
1 1/4-ino thick plates and was done to insure that the depth to the thermo
couple 'Would be known 0 For the 1/2-ino and 1 1/2-ino plates the thermocouple
was inserted manually into the molten weld pool; therefore, no holes were
required in these test specimens 0 After welding, a section approximately
l-ino long was removed from the mid-length of the weld (See Fig. 24) for
polishing and subsequent microinspection for cracks 0

33
3. Equipment
Welding was done using a Lincoln Ideal arc electric welding machine.
A modified procedure using a semi=automatic .welding method was utilized in
place of manual welding 0 An Airco Radiograph machine with a travel speed
control mechanism was adapted for this purpose. The manual electrode holder
was mounted on a vertical movable shaft, allowing the electrode to be fed
manually while the travel speed could be preset on the Airco Radiograph
machine 0 (See Fig. 25 for a general view of the welding equipment 0 )
By controlling the travel speed and presetting the voltage and
amperage of the welding machine, an approximate predetermined energy input
per inch could be obtained. The cooling rate is a function of the energy
input, therefore, it is a simple matter to obtain specimens with different
COOling rates merely by v~ying the travel speed and holding the voltage,
ampe::r;age, and plate thickness constant 0
The cooling rates that occurred in the weld were measured by,using
chromel-alumel thermocouples encased in a 3/32-ino diameter ceramic thermo
couple tubeo The junction was coated with fllsauereisenUt, a cormnercial
ceramic paste which hardens upon drying and acts as an insul~tor. Recording
of the cooling rates that occurred in the weld was accomplished. initially
by photographing on 35 mm film the beam of a Model 512 Tekt~onix oscilloscopeo
However, this method did not prove to be entirely satisfactory, therefore,
an alternate method of recording the cooling rates was adopted 0 In place
of the oscilloscopeg a Leeds and Northrup Type G Speedomax recorder, 3/4
second, full deflectionj was used. This recorder proved to have adequate
sensitivity, was much simpler to operate, and did not involve development
or enlargement of film.
XI ~ TE3T PROCEDURE
In order to simplify the ~estraintJ and therefore the role of stress}
as much as possible, only bead-on~plate welds are considered in this series
of testso Stresses due to restraint: thermal stresses, and stresses due to
volumetric changes are all considered using plate thickness as the parameter 0
The use of plate thickness as the parameter eliminates the necessity of
measuring actual strains that do occur as a result of welding. However}
measurement of residual strains would help to relate different test specimen
configurations to one anothero It was anticipated from the results of tests
rePorted in Part A that stresses due to restraint would affect the critical
cooling rate 0 The results of this investigation tend to bear out this con
clusion and this effect can readily be seen from the plot of plate thickness
VSo critical COOling rateo (See Figo 230)
Initially in this investigation only 1/2=ino and 1 1/2-ino thick
plate specimens were weldedo This was done primarily to determine whether
or not a different critical cooling rate did exist for plates of different
thicknesses 0 This was found to be the case as can be seen from Figo 23 or
Table 7; therefore} the additional plate thicknesses were investigatedo
The procedure used to measure and record the cooling rates for the
1/2-ino and 1 1/2-ino plates was somewhat different from the procedure used
for the 3/8-ina) 3/4-inQ} and 1 1/4-ino plates andJ therefore, shall be
described firsto
The welds were deposited in the flat position using the sernd
automatic procedure described previously (See Figo 25) a The welding arc was
ignited by using a small amount of steel woolo At the desired location along
the length of the weld, the thermocouple} encased in the ceramic tube, was

35
inserted manually into the molten pool that exists just behind the welding
arcc This method of injecting the thermocouple into the weld metal worked
fairly well, and peak 'temperatures that were below that of the melting
temperature of the thermocouple (2400 deg ~ F 0 +) could, be recorded .7' ,However, in
the majority of the tests the melting temperature of the thermocouple was
exceeded and, as a result, no cooling rate could be measuredo
In an attempt to overcome the difficulty encountered in recording
the cooling rates for the welds laid on the 1/2-ino and 1 1/2-ino plates,
the following al t.ernate procedure was adopted 0 From preliminary welds that
had. been deposited and for which the energy input was known, a plot of
energy input vs 0 depth of penetration was constructed. From this graph the
penetration for each weld could be estimated. Holes were then drilled
through each specimen at mid-length of the proposed weldo Into each hole
was inserted a steel plug the length of which was the estimated depth of
penetration. The thermocouples which were encased in a 3/32-ino diameter
thermocouple tube and which had the junction coated with nsauereisen t1 were
then inserted into the holes in the test specimenso Using this procedure
the loca.tion of the thermocouple was knO'WD. and was presumed to be in the
hea.t-affected zone close to the fusion line after the weld was deposited.
This procedure ~oduced somew.nat lower recorded peak temperatures than the
previously mentioned method, but the probability that the thermocouple would
be consumed by the molten metal was reduced and the number of successfully
recorded cooling rates was increased 0
The cooling rates for the welds deposited on the 3/8-ino, 3/4-in.,
and 1 1/4-ino plates were measured using the alternate method described

above and were recorded using a Leeds and Northru~ Type G S~eedomax Recorder.
The measured cooling rates were calculated by constructing the slo~e of the
time-temperature curve at 750dego F.
Although the alternate method of measuring and recording cooling
rates ~roved to be somewhat more efficient than the initial ~rocedure, the
method left much to be desiredo The major difficulty encountered was in
locating the thermocou~le so that maximum ~eak temperatures could be recorded
without consuming the thermocouple junction in the molten weld metal. The
voltage and am~erage could not be controlled accurately enough with the
equi~ment available to insure that the weld penetration "WOuld be the same
as ~redicted. As a result, not all of the measured cooling rates were
considered to be of valueo
During ~elding the voltage across the electrode holder and ground
clamp was read at several intervals and an average value recorded 0 The
current was also recorded at several time intervals and average values of
current and voltage were used to compute the energy in~ut 0 The welding
s~eed was recorded by timing the duration of welding and measuring the
length of the weld.

37
XII 0 CRACK INVESTIGATION
In order to insure that all possible cracking of the welded speci
mens had taken place) the specimens were stored ~or several days at room
temperature before the crack investigation "Was begun 0 The following procedure
was used for the detection of the cracking.
A section approximately l-ino long was removed from the center
portion of the weld 0 This vre.s accomplished by using a high speed cut off
wheel utilizing a coolant in order to keep the temperature below the
recrystallization temperature 0 (See Fig. 24)
The specimens were then prepared for microinspection of the weld
metal and heat-affected zone by mechanical poli shing and etching 0 • The
etchant used was a solution of 95% ethyl alcoho~ and 5% nitric aCido. The
specimens were then subjected to a microscopic examination at a magnification
of 5000 Typical cracking which was encountered was generally confined to
the weld metal but was found to vary in magnitude and crack density 0 In no
instance was cracking found to extend to the weld surface. (See Figs. 26
through 33)
It is interesting to note the magnitu4e of cracking as it varied
'With plate thickness as well as with cooling rate. A greater number of
photomicrographs are included from the 1 1/2~ino thick plate series than
from the other series (Figs 0 30 through 33)) because the P-l 1/2 series
was found to have the greatest variation in type of cracking encountered.
The reasons for this variation cannot be readily explained 0
Inspection of Fig. 28 shows a crack that has propagated into the
heat-affected zone of the base metal 0 Specimen P=3/4-1 was the only specimen
found that contained this type of crackingo This specimen also had the
greatest number of cracks per inch; however} only one other crack in this
specimen propagated into the heat-affected zoneo An acicular martensitic
type structure was found to exist in the heat-affected zone, but whether it
was martensite, tempered martensite, or bainite 'WaS not determined.'
In addition to the photomicrographs sho~ng the cracking encountered:
two additional photomicrographs; Fig. 34 and Fig 0 35j were taken 0 These are
included to show the general characteristics of the microstructure of the
base metal in the heat-affected zoneo The acicular martensitic-type structure
is fairly evident in both figures 0 Figure 35 is included to show the magni
tude of some of the inclusions encountered in the base metalo It becomes
apparent upon comparison of Fig. 35 and Figo 31 that base metal inclusions
could very well be as detrimental to a structure as could some of the
microcracks encountered as a result of weldingo
The results of the micro examination of all of the welded specimens
are listed in Table 70 Also listed in Table 7 are the corresponding cooling
rates for each ~ecimeno It can easily be seen that as the cooling rate at
750 dego F. decreased} the microcracking encountered was reduced and even
tually eliminated. This result 'Was found to be true for all plate thicknesses
tested except the P-l 1/2 series for Which. ~owe~ cooling rate specimens were
not availableo However" from the results of the other series it would be
expected that at a cooling rate of approximately 55 deg 0 F 0/ sec. no further
cracking would be encountered.

39
XIII 0 ANALYSIS AND EXPERIMENTAL RESULTS
10 Analysi s
A definite relationship seems to exist between the critical cooling
rate at 750 degoF I) "and microcracking. This rela.tionship is found ,to va:ry
depending on the degree of restraint imposed upon the weld metal. The follow-
ing section is devoted to clarifying this relationship~ and simultaneously,
presenting the information in simple graphical form. An attempt is also made
to relate the results of the bead-on-plate tests to the fillet weld tests
conducted previously.
The measured cooling rates are to be used as an experimental check
on the va.lidi ty of the theoretical equations developed by C. Mo Adams 0 ( 8)
These are the same equations that were used to calculate the cooling rates
for the previous investigation on fillet welds except for the following
change. The rate of heat flow from the source (100 percent) was taken as
2/3q for fillet-type welds in which there exists three avenues of heat flow
away from the weld 0 This is known as a tri thermaJ. condition, (1) while for
bead-on-plate welds used in this investigation the rate of heat flow from
the source (100 percent) is taken as q and the two avenues of heat flow
away from the weld constitute a bithermal condition.
For both fillet welds and bead-on-plate welds the efficiency of
the rate of heat flow from the source (q) has been taken at 80 percent. It
seems logical that the efficiency of energy input for the fillet weld should
be higher than that for a bead-on-plate type weld due to the :proximity of
the material around the arc I) The arc would tend to heat more material in
the case of the fillet weld than it would for the bead-on-plate weld. Some
discrepancy can be seen to exist between the results obtained from the fillet

40
weld tests and those obtained from the bead~on~plate testsQ This discrepancy
would seem to be due to the percent efficiency o~ heat flow from the source
used to evaluate the cooling rates in each case 0 An attempt will be made to
clarify this point after a discussion of the present test results has been
made 0
During ~lding the voltage, amperage, and welding speed were
recorded and are used in the follOwing equations(8) to compute the cooling
rates that exist in the weld at 750 deg 0 F ..
'Where
Two~dimensional heat flow~
Three-dimensional heat flow~
T = Initial plate temperature (oFo) o
Ti = Temperature at which cooling rate desired (oFo)
K = T'nermal conductivity of plate (Btu/ ft ... hr 0 _ of .. )
v = VelOCity of source (in./min.)
p = Density of plate (lbs./fto3)
C = Specific heat of plate (0155 Btu/lbo-oFo) p
t = Plate thickness (inches)
q = Rate of heat flow from source (Btu/hr~)
The value of K varies considerably'~ but an average value of K = 24 Btu/
ft o ... hr 0 _oF Q at 750' deg of.' seems to give fair' results 0
The possibility that two or three=dimensional heat flow might
(1)
(2)
exist depending on energy input, travel speed} and plate thickness makes
41
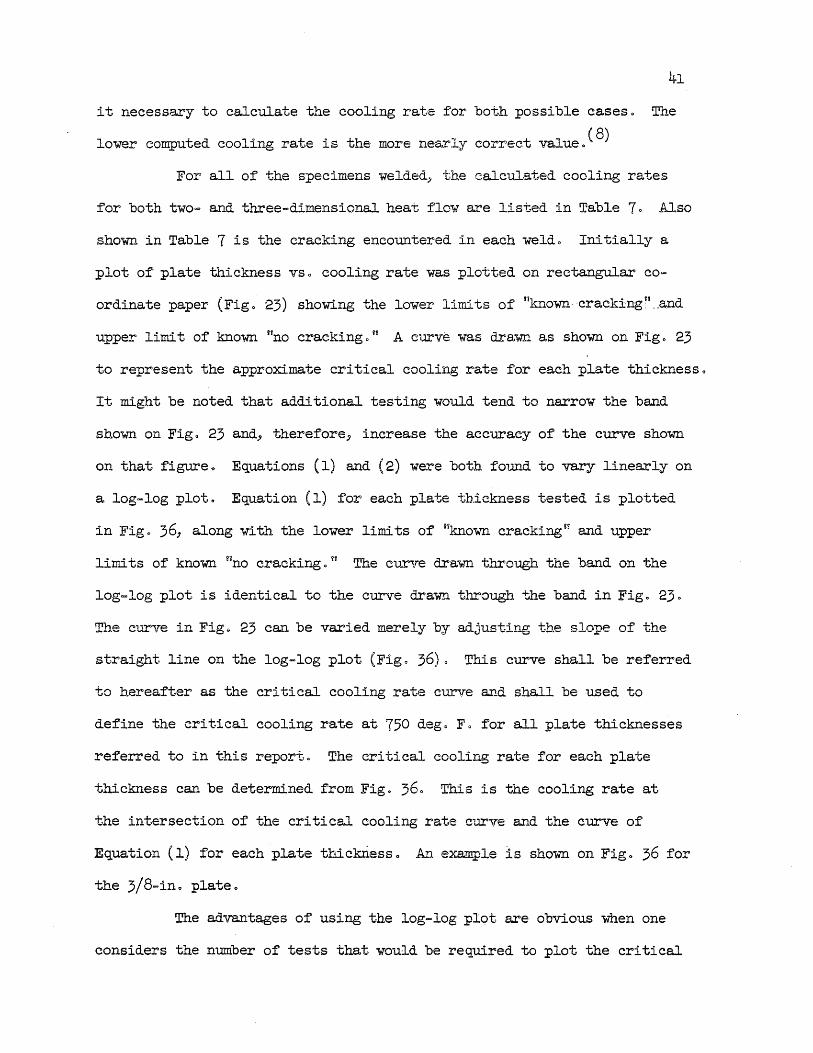
it necessary to calculate the cooling rate for both possible cases. The
lower computed cooling rate is the more neaTly correct valueo(8)
For all of the specimens welded) th.e calculated cooling rates
for both two= and three-dimensional heat flow are listed in Table 70 Also
shown in Table 7 is the cracking encountered in each weldo Initially a
plot of plate thickness vSo cooling rate was plotted on rectangular co
ordinate paper (Fig 0 23) showing the lower limits of "known -cracking n __ and
upper limit of known uno cracking 0 n A curve was dra'WIl as shown on Fig 0 23
to represent the approximate critical cooling rate for each plate thicknesso
It might be noted that additional testing would tend to narrow the band
shown on Figo 23 and, thereforeJ increase the accuracy of the curve shown
on that figure <> Equations (1) and (2) were both. found to vary linearly on
a log-log ploto Equation (1) for each plate thickness tested is plotted
in Fig. 36) along with the lower limits of iiknOw.n cracking n and upper
limi ts of known ~ino cracking. if The curve drawn through the band on the
log-log plot is identical to the curve drawn through the band in Figo 230
The curve in Figo 23 can be varied merely by adjusting the slope of the
straight line on the log-log plot (Fig. 36) 0 This curve shall be referred
to hereafter as the critical cooling rate curve and shall be used to
define the critical cooling rate at 750 dego Fo for all plate thicknesses
referred to in this report. The critical cooling rate for each plate
thickness can be determined from Figo 360 This is the cooling rate at
the intersection of the critical cooling rate curve and the curve of
Equation (1) for each plate thickrless 0 An example is shown on Fig 0 36 for
the 3/8-ino plate 0
The advantages of using the log-log plot are obvious When one
considers the number of tests that would be required to plot the critical
42
cooling rate curve. Only one series of tr~ck plates and one series of thin
plates 'Would be needed, resulting in economy of material and timeo
The critical cooling rates, as shown by the critical cooling rate
curve on Figo 36) are plotted assuming that only two-dimensional heat flow
away from the weld exists 0 For thick plates this is obviously not the case;
therefore, it is necessary to incorporate the use of Equation (2), which is
for three-dimensional heat flow, into the graph shown on Figo 360 In order
to illustrate the three-dimensional heat flow case, it is necessary to refer
to Figso 37 and 38.
Referring first to Fig" 37 and using l/2~ino plate as an example,
the critical cooling rate at 750 dego Fa for 1/2-in. plate is seen to be
112 deg. Fo/sec. The three-dimensional heat flow case, Equation (2), is
represented by the short-dashed line and the two-dimensional heat flow case,
Equation (1), by the long-dashed linea Point A represents the transition
point ~rom three-dimensional heat flow, for energy input values below point
A, to two-dimensional heat flow for energy input values above point A.
Actually, there is no sudden transition from the three-,dimensional case to
the two-dimensional case, therefore, point A represents an approximation
of the actual transition.
Returning to the critical cooling rate for the 1!2-ino plate
represented by point C on Fig. 37, we find that line B-C represents the
minimum energy input/inch that can be used safely while welding 1/2-ino
plate to avoid the possibility of microcracking for the electrode-plate
combination as used in this investigatione Inspection of the results
listed in Table 7 for 1/2-in. plates will show this to be true 0 Further
inspection of Fig. 37 shows that for all. safe values of energy input/inch
the two-dimensional heat flow condition) Equation (l)J will govern; and,
therefore, the' three~dimensional heat flow case for the 1/2-ino plate need
not be considered.

If a thicker plate is considered for which three-Qimensional heat
flow might govern, the previously stated proc'edure must be modified slightly 0
Referring to Figo 38 and using I 1/4-in. plate as an example, it is found
that point D represents the critical cooling rate, and this value is found
to be 62 deg 0 F 0/ sec 0 at 750 deg 0 F g Ref'erring again to point A we see that
below point A the three-dimensional heat flow case governs; as a result,
point D must be projected down to point C and again line B-C represents the
minimum energy input/inch tha.t can be used saf'ely while "Welding I 1/4-ino
plate and still avoid microcracking for the electrode-plate combination as
used in this investigation 0 Ins~ection of Table 7 for 1 1/4-ino plate will
again show this to be generally true. However; for this case, Table 7 shows
that specimen P-1 1/4-4 had an energy input of 31jl 800 Joules/inch, no
cracking; and a calculated cooling rate at 750 dego Fa of 66.5 which is
greater than the presumed critical cooling rate of 62 dego F./sec. Inspec
tion of Fig 0 36 shows 'Why this ha.s happened 0 The cri'tical cooling rate
curve on Fig 0 36 "WaS dra'WD. at random and could have been drawn wi thin the
band for the I 1/4coin. plate 0 As the r:!I"i tical cooling rate curve is drawn
in Figo 36J it is believed to be toward the conservative sideo This fact
is illustrated in the preceding example but still some doubt exists as to
the exact critical. cooling rate for the 3/4-ino plate due to the width of
the band as shown on Fig 0 36 for these specimens 0 Additional testing would
be re~uired to narrow the band for the 3/4~ino plate 0
The two preceding examples illustrate the use of the log-log plots
of energy input VSo cooling rate at 750 dego Fa for both thick and thin
plates. A more complete picture is presented by plotting on log-log paper
Equation (1) for all plate thicknesses testedJ and Equation (2) J along with

44
the critical cooling rate curve from Fig. 360 This has been done on Fig. 39
with the illustrations from Figs 0 37 and 38 repeated.
In order to utilize the preceding dataJ a simple manner of cal-
culating the required energy input per inch or a required electrode travel
speed is
Using
presented.
Electrode - E-60l0 3/l6-ino diameter
Position <= Flat
Recommended
Voltage 27-29
Current 170-190
Plate to be welded (assuming a bead-on-plate weld) 3/4-ino,
ASTM-A7 designation steelo
60 x Volts x s Joules/inch = ~--~~~--~-Speed in ino min 0
or v = 60 x Volts x Apps Energy input
Examination of Fig 0 39 shows that the minimum energy input that
can safely be used 'With 3/4-ino plate is 23.9000 Joules/inch.
Therefore
v. = 60 x 27 x 179 = 12 ino/mino Max 0 23,000
vMaxo = 60 x 29 x 190 23;1000 = 1404 ino/mino
The above calculation assumes that the 'Voltage is arc voltage and
current is arc current 0 A similar calculation can be made for any size
electrode and ~~y plate thickness. There is a slight effect on the cooling
rate due to electrode size(13) (14) ; however, the effect is small and can be
(13){14) . considered to be of a secondary nature 0 Hess" ~. found that increasing

electrode size resulted in a decrease in cooling rate for the same energy
input values. The values of critical cooling rates as determined in the
investigation reported herein were determined by using a IIB-ino diameter
electrode which would result in maximum cooling rates as far as electrode
size is concerned 0 The results, therefore, tend toward the conservative
side. It is also shown in reference(13)(14) that the cooling rate is
quite independent of electrode type; therefore, it can be assumed that the
preceding method used to calculate ~mum travel speeds would be equally
applicable for any type electrode. This implies also that the type of
current used would also have a secondary effect on the cooling rates;
however, this has not been verifiedo
20 Experimental Results
up to this point no reference has been made to the measured
cooling rates nor has the validity of the theoretical cooling rate
Equations (1) and (2) for bead-on-plate welds been shown. However, a
method has been ~resented using the cooling rates and ~late thicknesses
as parameters, that can be used to avoid the possibility of weld metal
microcracking for this electrode-plate combination 0 This would tend to
indicate that the errors involved, if any, are more or less constant
whether they be in the assumptions regarding efficiency of energy input,
thermal properties of the base material, or effect of restraint.
It is believed that the calculated cooling rates are a reasonable
approximation of the actual cooling rates that occur. In an attempt to
show this, the measured cooling rates shown in Table 7 are plotted on a
log-log scale in Fig. 39 and in Figo 40 on a rectangular coordinate scale.
Plotting of the measured cooling rates on the log-log scale (Fig. 39)

46
tends to distort relationships which otherwise can be seen much clearer on
a rectangular coordinate ploto Inspection o~ either Figo 39 or Fig. 40
shows that fair agreement exists between theoretical cooling rates and
measured cooling rates. However, for the thinner plates, the error seems
to increase. This could be the result of a number of factors, but one
important factor seems to be that thinner plates tend to lose more heat
by radiation and convection than the thicker plates.(l3) It can also be
seen (See Fig. 40) that a small error in measuring the energy input/inch
at low values 'Would produce a larger error than it would for large values
of energy inputo Even though the number of" measured cooling rates is
rather limited, the theory as presented previously is still valid. That
is, a definite relationship seems to exist for energy input} cooling rate,
microcracking, and restraint. This relationship can be used to determine
minimum energy input requirements in order to lay sound welds using the
electrode-plate combination as used in this investigation. The possibility
that simdlar relationships for other electrodes exist is indicated by
results of investigations conducted by others.
Tests conducted at Battelle Memorial Institute by Voldrich(l5)
show that the follo~ng electrodes are susceptible to cold cracking: E-60l0,
6oll, 6ol3" 6020} 60300 In connection with the cracking found, Voldrich
states that there is a critical cooling rate which, if exceeded, results in
a full degree of' cold cracking. The investigation, as reported herein,
tends to bear out this fact, at least for the E-60l0 electrode. It, therefore,
seems reasonable that the method of analysis as presented in this report
would be applicable to other electrode-plate combinationso
As mentioned previously in this report a discrepancy seems to
exist between the results obtained from the fillet weld tests and those

47
obtained from the bead-on-plate tests. The discrepancy exists in the dif
ference in the critical cooling rates obtained for the different type tests.
For the fillet welds a critical cooling rate of 110 deg. Fo/sec. at 750 deg. F.
was found to exist for all welds) while a range of critical cooling rates
from 55 deg~ F./sec. for 1 1/2-ino ~late to 137 deg~ Fe/seco for 3/8-in.
plate was found to exist for the bead-an-plate welds.
Restraint has been shown to be an important factor in determining
the critical cooling rate of welds 0 This has been sho'WD. by the bead-on
plate series of welds as reported in this investigation. Residual stresses
due to welding are a" function of restraint and the degree of restraint is
a function of plate thickness as 'Well as joint geometry 0 The fillet weld
specimens as used in Part A have a greater degree of restraint due to
geometry than the bead-en-plate specimens as used in the present investiga-
.tion. It, therefore, seems logical that the fillet weld specimens ~uld
also have a greater residual stress due to welding 0 It follows that the
fillet weld ~ecimens should have the lower critical cooling rates.
This has not been the case} however, and an attempt is made to
explain this discrepancy by changing the efficiency of the rate of heat
flow from source (cD which has been used to calculate the cooling rates
as sho'WD. in Table 1 of Part A and Table 7 of Part B 0 It seems logical
that the efficiency of the rate of heat flow from the source for fillet
welds should be higher than for bead-on-plate welds due to the proximity
of the material with respect to the arc during welding. The result is
that a greater amount of material will be heated for the fillet weld than
for the bead-on-plate weld.
In the initial computations of the cooling rates for both fillet
welds and bead-on-plate welds an efficiency of 80 percent for the rate of

48
heat flow from source was used. The efficiencies are now to be modified
so that for fillet welds the energy input is 90 percent efficient, while
for bead-on-plate welds 70 percent efficiency will be used. The results
obtained when 70 percent efficiency is used for bead-on-plate tests in
computing cooling rates are sho'W11 in Table 8. Plotted on Fig 0 41 are the
energy input values vs. cooling rates along with the measured cooling
rate values. Table 8 and Fig. 41 are identical to Table 7 and Fig. 39
except for the change in calculated cooling rates due to the change in
efficiency. The critical cooling rate curve shown on Fig. 41 was derived
in the same manner as the critical cooling rate curves of Figs ~ 23 and 36.
Inspection of Fig. 41 shows that for all plate thicknesses the
critical cooling rate has been increased due to the decrease in efficiency
", of the rate of heat flow from the source. Also} the overall agreement
between measured cooling rates and calculated cooling rates has been
improved somewhat.
The change in e.fficiency "of the rate of heat flow from the source
from 80 to 90 percent for fillet welds resulted in a general decrease in all
cooling rates and thereby reduced the critical cooling rate from 110 deg.
F • / sec. to approximately 90 deg 0 F 0/ sec. Listed in Table 9 are the re
calculated cooling rates and the measured cooling rates. In general,
increasing the efficiency of energy input for the fillet welds tended to
increase the discrepancy between measured cooling rates and calculated
cooling rates rather than improve the relationship. This would indicate
that the efficiency should probably have been reduced rather than increased
in order to give better agreement between measured and calculated cooling
rates.

To sum up the relationship between the fillet weld tests and the
bean-on-plate tests the follo~ng comparison can be made~
The critical cooling rates for the bead-en-plate welds using an
efficiency of 80 percent ranged from 55 dego F./sec. for 1 1/2-in. plate
to 137 deg. F./sec. for 3/8-in. plateo Changing the efficiency to 70 percent
resulted in a change in the range of critical cooling rates to 63 deg. F./sec.
for 1 1/2-in. plate to 183 deg. Fa/sec. for 3/8-ino plate. The critical
cooling rate for all plate thicknesses for the fillet welds using an effi-
ciency of 80 percent v.as found to be 110 dego Fa/sec. Increasing the
efficiency to 90 percent resulted in a decrease of the critical cooling
rate to approximately 96 deg 0 F. / sec Q (See Table 9) e The apparent di s-
crepancy still exists} as the critical cooling rate for the bead-on-plate
welds for 1 1/2-in. plates is 63 dego Fa/sec. (at 70 percent efficiency)
while the critical cooling rate found for the fillet weld tests, which
included 1 1/2-in. thick plates, is approximately 96 deg. Fe/sec. (at
90 percent efficiency).
The preceding results are contrary to what was anticipated as
the fillet weld test was assumed to have a greater degree of restraint
(due to geometry) and) therefore, should have had the lower critical
cooling rate. It is fairly obvious that the discrepancy is not entirely
due to the choice of efficiency of energy input used in calculating the
cooling rateso The exact reasons for the discrepancy are not readily
determined, and a considerable amount of additional testing would be
required to resolve the problem. More accurate methods are needed to
measure cooling rates encountered in order to determine the exact effi-/
ciency of the rate of heat flow from the source for various types of

50
welds. Measurement of residual strains would also help to relate different
types of test specimens to one another 0 An a.ttempt to measure residual
strains -was undertaken during this investigation; however, the results were
found to be very inconsistent and, therefore, considered to be of little
value and were discarded.
Even though a relationship between the bead-on-plate tests and
the fillet weld tests has not been established, the results of the individual
investigations are still consistent within themselves. It, therefore,
appears that each type of test is still valid and can be used successfully
to predict results of welds under similar conditions 'Wi thin a welded
structure. However, at the present time no attempt should be made to
relate results of one weldability test to another unless geometrical con-
figurations and restraint condi tions are very similar 0 This implies that
weldabili ty tests should duplicate actual service requirements as closely
as possible.
Service conditions rarely, if ever, would require depositing a
bead-on-plate type of weld, but numerous butt welds might be required. It
would, therefore, be desirable to relate the theory as reported in this
investigation to butt welds and cracking encountered in butt weldso Hess,
etal,(13)(14) developed a series of equations that could be used to predict
cooling rates encountered in the heat-affected zone for butt and fillet
welds. The equations are apprOximately linear on a log-log scale) and
fair agreement can be shown to exist between the theoretical equations as
used in this report and the equations developed by Hess. Hess' equations
for various plate thicknesses do not plot parallel to one another on a
log-log plot; therefore, the critical cooling rate curve as shown on

51
Fig. 36 cannot be utilized, thus complicating the problem somewhat. The
experimental results of references (13) and (14) could very well be applied
to the theory as reported herein indicating that the theory presented in
this report could easily be applied to butt welds.
Severe cracking is occasionally encountered in butt welds. The
possibility exists that the cracking encountered could be related to cooling
rates and restraint; therefore, a method of interpreting results similar to
that used in this report would prove to be a valuable tool. Not only butt
welds but other types of test specimens could very well be analyzed in a
similar manner; however, in order to establish relationships between tests,
a considerable amount of additional testing would be required.
The possibility of weld cracking should not be the only factor
considered in weldability tests. Tests that determine physical properties,
such as ductility, impact resistance, hardness, and fatigue strength must
also be included in order to assure that welded structures will perform
satisfactorily under service conditionso

52
XIV 0 CONCLUSIONS
A sufficient number of specimens of each plate thickness) except
1 1/2-in. thick plate) were tested so that a transition was found from
microcracking in the weld metal to nno microcracking n in the weld metalo
These results permitted the band sho'WIl on Fig. 23 to be plotted. Addi tional
testing would undoubtedly decrease the width of the band and thereby
establish a more exact critical cooling rate for each plate thickness.
Only mechanical polishing methods have been used, it) therefore) remains
possible that electro-polishing methods might change the critical cooling
rate somewhat by disclosing additional cracking, However, the follo~ng
general conclusions seem justified from the results of the investigation
conducted using the E-6010 electrode and A-7 steel combination.
I. It is not necessary to have a highly restrained condition to
induce microcracking in the weld metal of an E-60l0 electrode
weld deposited on ASTM designation A-7 steel.
20 The critical cooling rate was found to decrease with increasing
plate thickness 0 This is believed to be a function of increased
restraint due to the increased plate thickness, however)
inspection of Figs. 23 and 40 shows that as plate thickness
increases, the critical cooling rate approaches a minimum
value very rapidly. For all practical purposes) a minimum
critical cooling rate of 50 dego Fo/sec. at 750 deg. Fo for
plate thicknesses greater than I 1/2-ino could be used.
3. Plotting the theoretical cooling rate equations on a log-log
scale and superimposing a critical cooling rate curve (from
Fig. 23) presents a rapid and simple means of determining

53
minimum energy input requirements tha.t are necessary to avoid
the possibility o~ microcracking in the weld metal for the
electrode-plate combination as used in this investigation.
40 It is believed that the method of calculating cooling rates
and presenting the results in graphical form such as Fig 0 39
can be expanded to most types of weld cracking "Where restraint
and coolir.Lg rate are import&'"lt va.r'iables Q
5. It is difficult to establish relationships between different
types of test specimen configurations; however; the results
of individual tests should be directly applicable to similar
type geometrical conditions encountered under service
condi tions 0

· 54
BIBLIOGRAPHY
1. Cottrell) Co L. Mo) "Controlled Thermal Severity Cracking Test Simulates Practical Welded JOints, fY Welding Journal, June, 1953.
2 . Berry, JoT 0 and Allen, R. C.) 'riA Study of Cracking in Low Alloy Steel Welded JOints, " Welding Journal) March, 1960 0
30 Flanigan, A. E. and Kauf1nan, M., uMicrocracks and the Low Temperature Cooling Rate Embrittlement of Welds" ft Welding Journal; December, 1951.
4. Hoyt, S. L., Sim" Co Eo) and Banta) H .. Mo} "Metallurgical Factors of Underbead Cracking, f1 Transactions A. I .. M.E., Vol. 162) 1945 ..
50 Christensen) N a" UMetallurgical Aspects of Welding Mild Steel, n Welding Journal, Vol. 28) part 2, 1949.
6. Winterton, R. and Nolan, M. J., ~actors Affecting Severity of Cruciform Test :for Hardened Zone Cracking, n 'Welding Journal) February) 1960.
7. Poteat, L. E. and Warner, 'W. L., uThe Cruciform Test for Plate Cracking Suscepti bili ty, ff Welding Journal) February, 1960.
80 Adams, C. Mo" nCooling Rates and Peak Tenrperatures in Fusion Welding" It
Welding Journal" May" 1958.
9" stout, R. D. and Doty, W. D." "We ldabi Ii ty of Steels) n Welding Research Council" New York City, 1953" pp. 90-950
100 Payson" P. and Grange, R. A." "The Temperature Range of Martensite Formation in Steel, " Metals Handbook, 1948, pp .. 611-6120
110 Flanigan, Ao E. and Micheu} To, r~elation of Preheating to Embrittlement and Microcracking in Mild Steel Welds" t1 Welding Journal, February, 1953. .
12 0 Flanigan, A 0 Eo and Saperstein, Z 0 P OJ "Isothermal Studies on the Weld Metal Microcracking of Arc Welds in Mild Steel, n Welding Journal" November) 19560
13. Hess, W. Fa) etal, t~e Measurement of Cooling Rates Associated With Arc Welding and Their Application to the Selection of Optimum Welding Condi tions, n Welding Journal, Part II 22, 1943.
14 a Hess, WaF. ) etal) "Determination of Cooling Rates of Butt and Fillet Welds as a Result of Arc Welding with Various Types of Electrodes on Plain Carbon Steel, if Welding Journal 23" .1944, ppo 376s-391s.
150 Voldrich, CoB 0) !fCold Cracking in the. Heat-a.:rf'ected Zone} U Welding Journal, Part I 26, 1947, ppo l53s-l69so

TABLE 1
SUMMARY OF SPECIMENS TES6ED IN pART 'A, ENERGY INPUTS, COOLING RATES AT 750F. 'AND~.DmREE:~OF CRACKING
=~-~-~-
Travel Energy Speed Input Cooling Rates at 750oF. {oF.Lseco2 Cracks
S:pecimen Plate Thickness Electrode Weld (in./ (Jomes/ Calculated Measured Fig. 18 Fig. 5 Top Bottom Size No. min.) inch) 2-Dimensional 3-Dimensional Ty:pe Type
:0-12-1 1/2" 1/2" liB" 1 9·23 21,100 Quenched l/inch C-l~-l 1/2 1/2 l/B 2 13·35 14,240 22B.o 225·0 16/inch C-12-1 1/2 1/2 l/B 1 B.74 16,200 (*Y 171.0 197·0 249 4/inch B-34-1 3/4 3/4 l/B 1 10.44 IB,750 296.0 171.0 175 3/inch C-34-1 3/4. 3/4 1/8 1 10.00 1B,970 2B9.0 168.0 200 B-1-2 1 1· l/B 1 10.00 18,950 514.0 168.0 225 2/inch C-34-1 3/4 3/4 l/B 2 9.60 19,900 263.0 160.0 194 4/inch B-1-2 1 1 1/8 2 9.24 20,000 46200 160.0 9a{o B-34-1 3/4 3/4 1/8 2 9.24 20,700 242.0 154.0 6rYfo B-12-1 1/2 1/2 l/B 1 9·60 19,800 (*) 117·0 161.0 None B-l-1 1 1 1/8 1 6.77 28,500 229·0 112·5 None B-l-1 1 1 1/8 2 6.67 2B,500 237·0 112.0 2 Very 2CY{o
Minute B-15-1 1-1/2 1-1/2 3/16 2 9,,23 29,650 475 .. 0 107.B None B-15-1 1-1/2 1-1/2 3/16 1 8.58 31,900 41000 100.0 None C-15-1 1-~f,2 1-1/2 3/16 2 B.oO 33,500 371.0 95.4 B-12-1 1/2 1/2 1/8 2 8·5B 22,000 ( *) 94.4 144aO None C-1-1 1 1 3/16 2 7·75 36,300 140.0 88.0 88 None C-15-1 1-1/2 1-1/2 3/16 1 6·58 40,800 251.0 78.6 D-12-1 1/2 1/2 1/8 2 7.06 27,600 ( *) 75·4 134.0 None C-l-1 1 1 3/16 1 5·34 51,500 69·8 62.2 71 None
Indicates insufficient data. ( *) 2-Dimensional heat flow governed.
Indicates - not examined. \..n
Note ,~ SpeCimens listed in descending order of governing cooling rates. \..n

TABLE 2
TRA.vEL SPEEDS REQUIRED TO DEPOSIT GIVEN FILLET SIZE
Energy Input Travel Speed Electrode Recommended Selected Fillet Required Re~uired ~InLMin. 2
Size Volts Amps Size (Joules/inch) Minimum Maximum
1/8ft 25-27 110-130 1/8u 10,500 15·7 20.0
1/8 25-27 110-130 3/16 20}00O 8..25 10·50
5/32 27-29 140-160 1/4 33,500 6.75 8·30
3/16 27-29 170-190 5/16 47,500 5.86 7·04
7/32 28-30 220-250 3/8 60,000 6.16 7·50
1/4 28-32 240-300 1/2 87,200 4.62 6.60
1/4 28-32 240-300 5/8 114,000 3.54 5·06
Table 2 is for use with A.0.,SmithE-Go10 electrodes used in the flat position only.
\Jl 0\

TABLE 3
AWS SPECIFICATION REQUIREMENTS FOR FILL'EJ: SIZES & CORBESPONDING-CALCUI.ATED COOLING RATES
57
Plate Thickness Minimum Minimum Calculated Cooling Rates @750oF Top Bottom Fillet Size Tra.vel Speed 3-Dimensional 2-Dimensional
(*) 1/4 fT 1/4" 3/16n 8.25 in/min. 160°F./sec. * 28090F o/sec 0
1/2 1/2 3/16 8.25 160 * 115
3/4 3/4 1/4 6.75 95 * 92
1-1/2 1-1/2 5/16 5 .. 86 * 67.3 185
2-1/4 2-1/4 3/8 6.16 * 53·3 261
6 6 1/2 4.62 * 36.8 878
(*) Not listed in speci~icationso Cooling rates were computed ~or minimum travel speeds utilizing minimum recommended voltage and amperage for computing rate o~ heat flow.
* Governing calculated cooling rates.
TABLE 4
AWS SPECIFICATIONS FOR FILLET SIZES AND THOSE RECOMMENDED IN THIS REPORT
Speci~ications Recommended
Plate Thickness
To 1/2 ft
1/2 - 3/4
3/4 - 1-1/2
1-1/2 - 2-1/4
2-1/4 - 6
Over 6
Minimum Fillet Size
3/16 11
1/4
5/16
3/8
1/2
5/8
Plate Thickness
To 1/4 ft
Over 1/4
Minimum Fillet Size
3/16~
1/4

Specimen Weld Noo
D-12-1 1 B-34-1 1 B-1-2 1 C-34-1 1 C-12-l 2 C-34-1 2 B-1-2 2 B-34-1 2 C-12-1 1 B-l-l 1 B-1-1 2
B-15-1 2 B-15-1 1 C-15-1 2 C-l-l 2 B-12-1 1 C-15-1 1 B-12-1 2 D-12-1 2 C-l-l 1
TABLE 5
COOLING RATES AT 572°F (300°C) AND DEGREE OF CRACKING
~==r-en=
Calculated Measured Cooling Rate at 572oF. (oFo/sec.) Cooling Rate Cracks 00/ Fig. 18 Type 2-Dimensional 3-Dimensional Governing at 572 F. F sec 0 Fig. 5 Type
Quenched l!inch 128.2 100.6 100.6 152.0 3!inch 223·0 99.6 99.6 145.5 3!inch 125·0 99.5 99·5 137.0 99 .. 2 133·0 99.2 116.0 16!inch
113·5 94.6 94.6 121·5 4!inch 200 .. 5 94.4 94.4 138.0 9010 of weld 105·0 9101 91 .. 1 138.0 - 6ocfo of weld
76.3 116.5 76.5 131.0 4/inch 99.6 66.5 66.5 None 98 .. 7 66.1 66.1 7500 (2/inch - very 20% of weld
minute) 205·0 63.6 63.6 None 177·5 59·2 59·2 None 161.0 56.4 56.4 60.5
61.0 '52.0 52 .. 0 69·7 None 50·9 95·0 50·9 None
109·2 46.4 46.4 40.8 85·0 40.8 72.8 None 34·9 82·5 34·9 None 30·3 36.6 30·3 47.7 None
\J1 OJ

59
TABLE 6
PHYSICAL PROPERTIES OF MATERIAL TESTED
Chemical Analysis - Base Material
Specimen C Mn Si P S Ni Cu
1 1/4 It plate .17 090 014 ,,012 .032 .03 .07
3/4" pla.te .18 076 .01 0012 .030 .. 02 .01
3/8ft plate .17 .67 .02 .014 .038
Electrode (*) .08 .47 .21 0022 0026
Tensile Tests
Specimen Lower Yield Stress Ultimate Stress Elongation
1 1/4n plate 30.2 ksi 5707 ksi
1 114ft plate 3401 6002
314ft pla.te 38.8 59·3
3/4u plate 3307 59.8
Electrode (*) 59 .. 2 71 .. 15
(*) Manufacturer f s listed value"
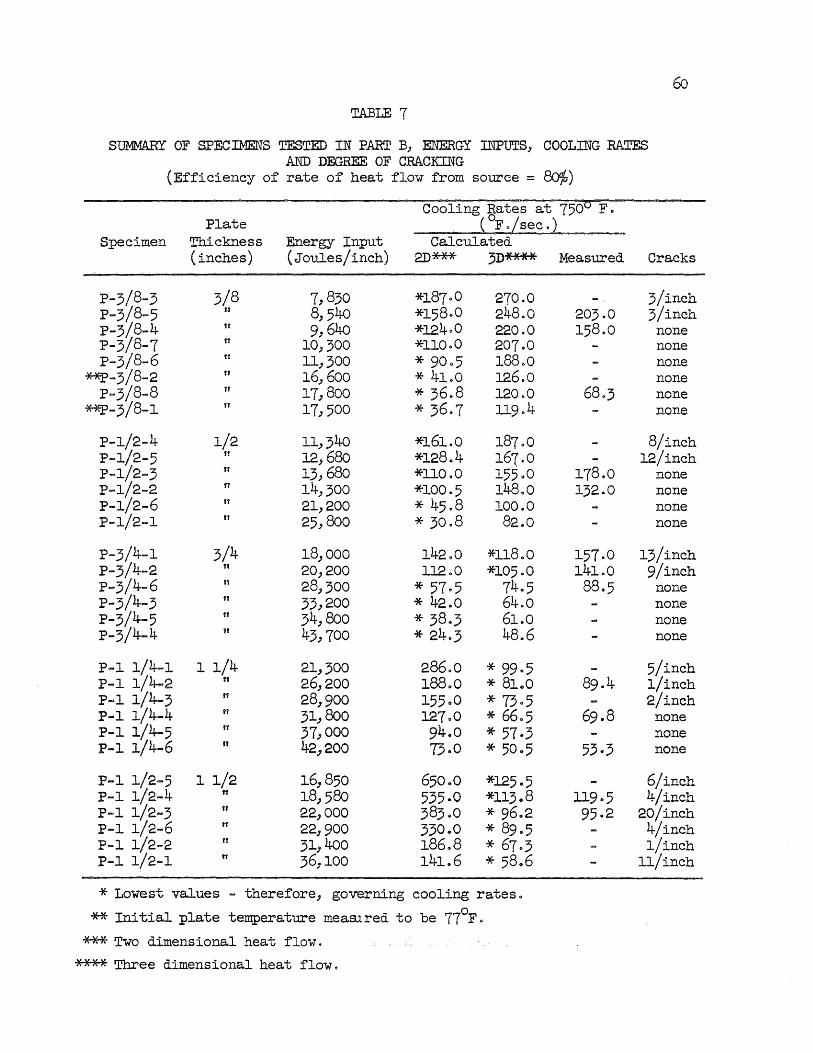
60
TABLE 7
SUMMARY OF SPECIMENS TESTED IN PART B, ENERGY INPUTS, COOLmG RATES AND DEGREE OF CRACKING
(Efficiency of rate of heat flow from source = 80%)
Cooling Rates at 7500 F. Plate (oF o[sec.)
Specimen Thickness Energy Input Calculated (inches) (Joules/inch) 2D*** 3D****" Measured Cracks
p-3/8-3 3/B 7,830 *lB700 270.0 3/inch p-3/8-5 n 8,540 *15800 248.0 203·0 3!inch p-3/8- 4 n 9,640 *124.0 220.0 158.0 none p-3!8-7 n 10,,300 *11000 20700 none p-3/8-6 11 1l,,300 * 9005 18800 none
**P-3!8-2 it 16)600 * 41.0 126.0 none p-3!B-B if 17,800 * 36.8 12000 6803 none
*'*P-3!8-1 n 17}500 * 36.7 119·4 none
P-l/2-4 1/2 11}340 *161.0 18700 8/inch P-1!2-5 n 12,680 *12804 167~0 12!inch P-l!2-3 n 13,680 *1l0.0 155·0 178.0 none P-1!2-2 fl 14J300 *100·5 14800 132.0 none P-l!2-6 n 21,200 * 45.8 100.0 none P-1/2-1 tl 25J800 * 30.B 82.0 none
p-3/4-1 3/4 18,000 142.0 *11800 157·0 13/inch p-3/4-2 t1 20J200 112.0 *105·0 141.0 9!inch p-3!4-6 n 28,300 * 57·5 74.5 88.5 none p-3/4-3 ft 33J200 * 42.0 64.0 none p-3!4-5 ff 34,800 * 38.3 61.0 none p-3/4-4 " 43,700 * 24.3 48.6 none
P-l 1/4-1 1 1/4 21,300 28600 * 99·5 5/inch P-1 1/4-2 u 26,200 18800 * 81.0 89·4 l/inch P-l 1/4-3 tf 28,900 15500 * 73·5 2!inch P-l 1/4-4 ti 31,800 12700 * 66 .. 5 69.8 none P-l 1/4-5 n 37,000 94.0 * 57·3 none P-l 1/4-6 It 42,200 73 .. 0 * 50·5 53 .. 3 none
P ... l 1/2-5 1 1/2 16,850 650 .. 0 *125·5 6jinch P-l 1/2-4 tf 18,580 535 .. 0 *11308 119 .. 5 4/inch P-l 1/2-3 n 22,000 38300 * 9602 9502 20!inch P-l 1/2-6 It 22,900 330.0 * 89.5 4!inch P-l 1/2-2 tt 31,400 186.B * 67.3 l!inch P-l 1/2-1 tf 36,100 141.6 * 58 .. 6 11/inch
* Lowest values - therefore} governing cooling rates.
** Initial plate temperature mearured to be 77°F.
*** Two dimensional heat flow.
**** Three dimensional heat flow.

61
TABLE 8
SUMMARY OF SPECIMENS TESTED IN PART B, ENERGY INPUTS, COOLING RATES AND DEGREE OF CRACIaNG
(Efficiency of rate of heat flow from source = 70%)
Cooling Rates at 750OF. Plate ~oF oLsec. 2
Specimen Thickness Energy Input Calculated (inches) (Joules/inch) 2D*** 3D**** Measured Cracks
p-3/8-3 3/8 7,830 *24500 30800 3/inch P-3/8-5 tf 8,540 *20700 283.0 203·0 3/inch p-3/8-4 n 9,640 *16205 251 .. 0 158 .. 0 none p-3/8-7 n 10,300 *14400 236.0 none p-3/8-6 tt 11,300 *1l805 22404 none
**P-3/8-2 " 16,600 * 53 .. 7 14308 none p-3/8- 8 " 17,800 * 4802 137 .. 0 68 .. 3 none
**P-3/8-1 It 17,500 * 48.1 13600 none
P-1/2-4 1/2 11,340 *2ll00 213·0 8/inch P-1/2-5 " 12,680 *16800 19005 12/inch P-1/2-3 n 13,680 *14400 17700 17800 none P-1/2-2 " 14,300 *13106 16808 132 .. 0 none P-l/2-6 " 21,200 * 6000 11400 none P-1/2-1 " 25,800 * 4004 9305 none
P-3/4-1 3/4 18,000 186.0 *13406 15700 13/inch P-3/4-2 tr 20,200 146,,8 *119.8 14100 9/inch p-3/4-6 It 28,300 * 7504 85·0 8805 none p-3/4-3 " 33,200 * 5500 73·0 none P-3!~-? " 34,800 * 50 .. 2 6906 none P-3/4-4 if 43,700 * 3108 56.6 none
P-1 1/4-1 1 1/4 21,300 375 .. 0 *11305 5/inch P-1 1/4-2 u 26,200 246.0 * 9204 89.4 l!inch P-1 11,~-? " 28,900 20300 * 8308 2/inch P-1 1/4-4 Jf 31,800 l6605 * 7508 6908 none P-1 1/4-5 " 37,000 12300 * 6504 none P-1 1/4-6 " 42,200 95·6 * 57·5 53·3 none
P-1 1/2-5 1 1/2 16,850 85200 *143.0 6/inch P-l 1/2-4 u 18,580 701 .. 0 *l2908 119 .. 5 4/inch P-l 1/2-3 u 22)000 502 .. 0 *109 .. 8 95·2 2b/inch P-1 1/2-6 u 22,900 432 .. 0 * 9801 4jinch P-l 1/2-2 If 31,400 245.0 * 7308 l!inch P-l 1/2-1 u 36,100 18505 * 64.3 II/inch
* Lowest values ... therefore, governing cooling rates.
** Initial Plate Temperature Measured to be 77°Fo
*** Two· dimensional heat flow 0
**** Three dimensional heat flow.

62
TABLE 9
SUMMARY OF SPECIMENS TESTED IN PART A, ENERGY JM'UTS, COOLING BATES AND DEGREE OF CRACKING
(Efficiency of rate of heat flow from source changed from &Jofo in Part A to 90'f0 in this table)
Cooling Rates at 750°F. ~ of o[sec. 2
Specimen Weld Energy Input Calculated Noo ( Joules/inch) 2D** 3D***" Measured Cracks
D-12-1 1 21,,100 Quenched l/inch
C-12-1 2 14,240 *180.0 20000 16/inch
B-34-1 1 18,750 234.0 *152.0 175·0 3/inch
C-34-1 1 18,970 229·0 *149 .. 5 20000
B-1-2 1 18,950 406.0 *149·5 22500 2/inch ..
C-34-1 2 19,900 208.0 *142.0 194.0 4/inch
B-1-2 2 20,000 36500 *142.0
B-34-1 2 20,700 19105. *137 GO
C-12-1 1 16,200 *13500 17500 . 249·0 4/inch
B-l-1 1 28" 500 18100 *100,,0 none
B-1-1 2 28,500 18705 * 99·7 2/inch
B ... ·15-1 2 29,650 376.0 * 95 .. 8 none
B-12-1 1 19,,800 * 92·5 143.0 none
B'!"15-1 1 31,900 32400 * 88.9 none
C-15-1 2 33,500 293·0 * 84 .. 7
C-1-1 2 36,300 110.,5 * 78 .. 2 88.0 none
B-12-1 2 22,000 * 74 .. 6 128.0 none
C-15-1 1 40,800 198 .. 5 * 69 .. 8 D-12-1 2 27, WO * 59 .. 6 ll9.0 none
C-l-1 1 51,500 * ?5. 2 55.3 71 .. 0 none
* Governing calculated cooling rate 0
** Two dimensional heat flow.
*** Three dimensional heat flow.

, ~ -1. -r--\ l- I In CD -0 ::I: N
"0 U
Q) ." .-: - - en 3: . "
~ I --&-
= <.D ~ ~
1"1. It .~ --'" r~ r
I I 3" ~I I
I~ r- gil ~I
1 r, ,..,
I~ I I I I
, I I I
DETAILS OF FILLET WELD SPECIMEN
Fig. I

Fig. 2 General View of Instrumentation
Fig. 3 Specimen Assembled for Welding

Fig. 4 Portable Magnaflux Prods
Fig. 5 Iron Powder Showing Crack in
Magnetized Speci men

,. '.\"
',; .:.... ,I·' :.' . • 'j'
, I
Temperature Trace (I).
. ....................... , .~;,:~.'
d~
I
(8)
FIG. 6 TYPICAL OSCILLOGRAM FOR DETERMINATION OF COOLING CURVES a ENERGY
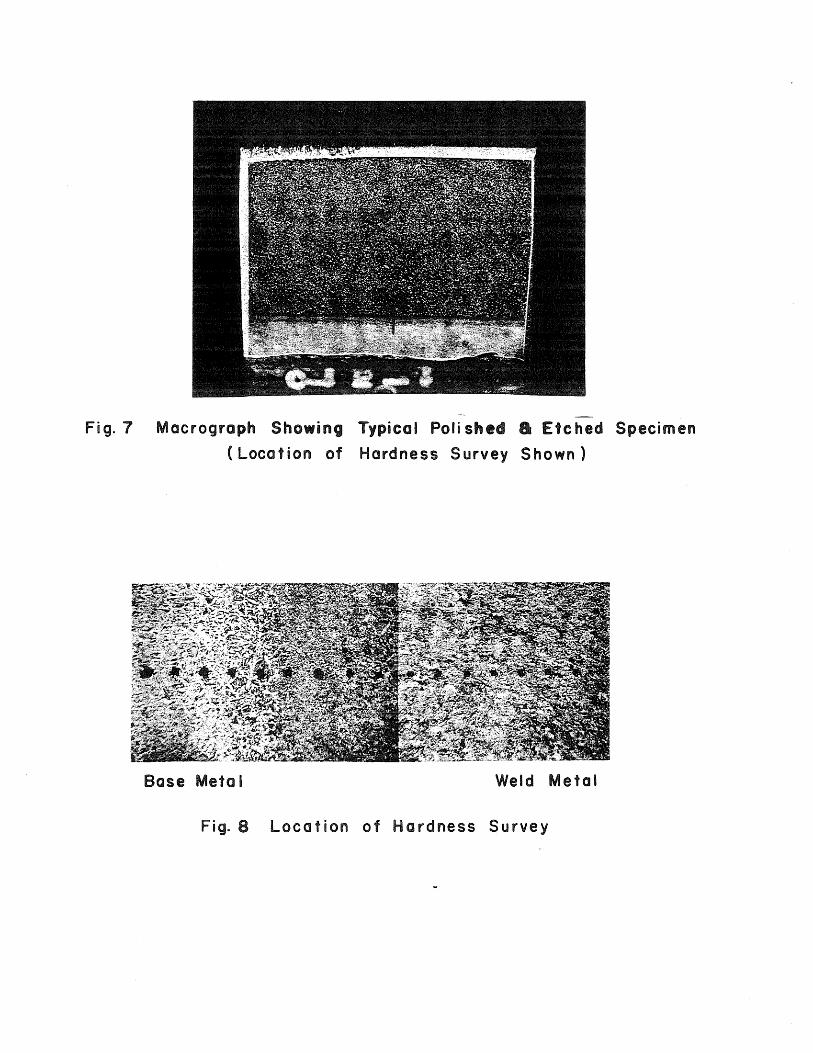
Fig.7 Macrograph Showing Typical pori shed a Etched Specimen
(Location of Hardness Survey Shown)
Base Metal Weld Metal
Fig. 8 Loca t ion of Hardness Survey

Base Heat Affected Zone
t
I T A Fusion Li ne Weld Metal
(This Specimen Had Slight Cracking)
Fig.9 Specimen 0-12-1 Weld No.1 11 Quenched After Welding
(x 200)
I A

Base Me'ta I Heat Atfec ted Zone Fusion Line-.-J
I A Weld Metal
(This Specimen Had Severe Cracking)
Fig. 10 Specimen C -12-1 Wei d No.2, Cooli ng Rate at 750~F:: 22 5Cit;/sec.
()( 200)
I A

Bas e Metal ". .'./~:,
A I
Heat Affected Zone
I A Wald Metal
(This Specimen Had Slight C,racking)
Fusion Line.J
Fig.11 Specimen 8-1-2 Weld No.l, Cooling Rate at 750°F=16S°,/sec.
(x 200)
I A

Base Metal
I A
Heat Affected Zone
A I
I A
I ,~Weld Meta I Fusion line
( T his S pe c i men Had No era c kin 9 )
Fig. 12 Specimen 8-12-1 Weld No.2, Cooling Rate at 750°F;: 94.4 of/sec.
(x 200)

Base Meta I to Fusion Lin e
Weld Metal
(This Specimen Had No Cracking)
Fig.13 Specimen D-12-1 Weld No.2, Cooling Rate at 750°F= 75.4°Vsec.
Ambient Temperature = 20 of
(x 200)

1 Calculated Cool ing R a 1 e sat 7 50°F
I 0-12-1 Weld No. I Quenched
0 0 ID
Z a...
2 C-12-1 Weld No.2 225.0 of/sec.
v·M 3 8- 1-2 Weld No. I 168.0 4 8-12-1 Weld No.2 94.4 5 0-12-1 Weld NO.2 75.~
0
0 en 0 2 CVI . I '1 \ ~ t. / 1_,
I ~', '- ~ Q) \
.:Jt! 0
> (/) 0 (/) 0 Q) 1'0 C
"'0 '-a :r:
0 0 N
~ ~' .. \ .'.'. I···· .. ~ '\ ." . ". ~~.
ci)-~: ..... , /-t __ _ -1 /', '. / I' ", r , ". / "'-------f-------./ /.... ,,~- '. J ® /" - , '>. ~
" "---- -/.. '- "" <..® " / '-
"-. - --./
"., ~--·--I ~~t··-·---:-~~',-l \_--..: '~
'---.. . - - --- I ---" .~~ i@
8 .... 1 ---------+-
WELD METAL BASE METAL
O.~----------~ __________ ~ __________ ~ __________ ~ ________ ~~ ________ ~~ ________ ~ __________ _J
.06 .04 .02 o .02 .. 04 .06 .08
Distance from fusion line (Inches)
Fig.14 Hardness Surveys of Specimens Shown in Fig.9 Through 13

..".
1-
ii-
..l:: 0 60
70
~ If E.I. = 2. 43 )( I O~ ( L - .094) .. -. Eq (I)~
o x 105
( L-E.I. = 2 . .09 ) - ... Eq (2)-
c::
~ +-CJ)
Q) + :::J 0
-:> 50
"'0 C 0 (I)
:::J 0
~ f ...
.I::.
~ 40 :~~
1-
-::;) c.. c::
~ 30 t)') ~
Q)
c w
20
10
o
1-
• ,. + 1> +
1-1- ~
f' .. 1--. 1-
j v~
-.; ~
I
I /
/ /
I /
/ ,I
/ ./
./ ./
~ ~6 ~ ~6 % ~6 ~2 ./ ./ .8 .8 • .. ..
o .10 .20 .30 .40 .50
Fillet leg lengfh (Inches)
Fig. 15 Relationship Between Energy Input Per Inch and
Fillet Leg Length

70
~ 60 c
"'0 c: C fh :l o
.r:.
.... 40
20
10
\ Equation (5~ Governs \0
\ ~ Equation (6 Governs
\ \
i!-2" PI \ $ pte
\ 0 III 81
3 " II 0 ~ \ ~ .6.. Y2." II
\ \ \
\ \ \
\
~~ \ , \
\
\ \ \ "-
\ \ " \ "-\ "-
\\~ , "-
\ \ "-\ ..........
\ " . , ,
"- , .... Ik." \ "- r-o. ZPI , -!!.t~
\ " ........ -" ..........
\ "'-........
I .........
\ I "'- .........
~ ...... ...........
.... , """'- -... I II
.......... r- '=.!pte ., .~. ........ ---I ........ II .. .......
!"-- -- 3 " : ,,, ~
-- -~ !
- -P19J...e ----- I If
i .......-.. --- 1.t2 PI a It.:!
! --- --~ Crdica I fooling
Rate :
Cooling rate - OF/sec.
Fig. 16 Relationshi p Between Energy Input Per Inch and
Coo lin g R Q t e sat 750 of

70
.s:::. g 60
~ fJ)
Q)
:::s o
""")
"'C C o fJ)
:s o
..s::::.
50
~ 40 I
20
10
o o
\ Equotion (5) Govern s \0
\ \
\- Equotion (6) Gove r lis
1 \
~ X" Fla1e \ I 2
\ 0 III II
\ 3 II
\I 0 ~ \ L:::. Y'211 ..
\ \
\ \ \ \\ 0 \ \
. \' \
\ \, \
" " \ \ \ \ " "-\ \ ~. '" \ \ ." ""-..........
\ \ "- , ..... I '1
\ '\f\. "- ~ \ "-
.....f:.!ate \
1~ ""'"" \ " 1\ , \ '-....
:A " """ \ --" 1 "" ..... II --- /" 0
'~ ....
~~ -- :...!:!...!e
""" ..... II --
I '-.. A ~"""-- '::{-" -
- ---- ~ ' .. I"-.... A ...!L Plate -- -.....;;--I -- ~ I .. I -- J.2 Plate I ---I -
Critical Cooling I
( Rate
50 100 150 200 250
Coo lin g rat e - OF / sec.
Fig.17 Relationship Between Energy Input Per Inch and o
Coo lin 9 Rat e sat 572 F

Fig.18 Typical Weld Metal Micro-crack
Specimen C-12-1 Weld No.2
( x 500)
Fig.19 Typical Weld Metal Micro-cracks
Specimen C-12-1 We Id No.2
( x 500)

Fig. 20 Typical Weld Metal Micro-cracks
Specimen C-12-1 Weld No. I
(x 500)
Fig. 21 Under bead Crack
Specimen B- 1- 2 Weld No. I
(x 500)

Fig.22 Crack That Propagated Into Heat Affected Zone
Specimen 9-1- 2 Weld No. I
( x 5 00)

V)
Q) .s:::. (J
c .........
U)
U)
Q)
c ~
0
..c. f-
.Ci) .... 0
0...
1.501 I \ • ...1---(;.1
1.25
Limit of Known
1.010
.7!3
.50 I I Upper "No
.2~; I ' I
O'~--~----------~------~--~--b---~--~~--~--~--~--~--~--~ o 20 40 60' 80 100 120 140 160
Coo lin 9 Rat eat 7 5 00
F. ( 0 F /s e c. )
Fig. 23 P lot 0 f P I ate T h i c k n e s s v s. Coo lin 9 Rat e s S how i n 9 the Transition From Cracked to Uncracked Specimens

E o )I(
UJ
c:: o
c:: cv E· (.)
Q)
0-(f)
oX (.)
o '"'" u

RI.25 Photograph Showing Semiautomatic Welding Equipment

j FIt- 26 Crack in Weld Metal of Specimen P - ;g- 3
Calculated Cooling Rate at 750 of = 187 °0ec.
(x 500)
Fig. 27, C rack in We Id Me ta I of Spe ci men P - Yz - 4
Calculated Cooling Rate at 750°F = 161 0 F sec.
(x 500)

A I
, A
Heat Affected Zone Weld Metal
Fusion Li ne
Fig.28 Crack That Propagated into H eat Affected Zone t Specimen P- ~-I
Calculated Cooling Rate at 750 of = 1184) 'Vsec.
(x 500)

Fi .. 29 Crack in Weld Metal of Specimen P-I~-I Calculated Cooling Rat·e at 750 o F:: 99.5°Vsec.
(x 500)
Fil- 30 Crack in Weld Metal of Specimen P-I~--4
Calcu iated Cooli ng Rate at 750 ° F :: 113.8 0 F/sec.
(x 500)

Fig. 3 I C rae kin Wei d Met a lot S p e c i men P - I Y 2 - :3
C a I cui ate d Co 0 Ii n g, Rat eat 7 50 0 F = 9 6 . 2 0 F / sec.
(x 500)
Fio. 32 Crock in Weld Metal of Specimen P- I Y2 - 2
Calculated Cooling Rate at 750 of:; 67.:3 of/sec.
(x 500)

F i 9. 3 3 C r (] c kin Wei d Met a lot S p e c i men P - I Y2 - I
Calculated Cooling Rate at 750 0 F = 58.6 of/sec. (x 500)

Fig. 34 Micro'structure in Heat Affected Zone of Specimen P-Y2 - 3
Calculated Cooling Rate at 750 OF = 110 of/sec.
(x 500)
Fie.. 35 Photomi crograph Showing the R ela ti ve Si z e of Inc lusions
in Base Metal For Comparison With Microcracks.
S p e c i men P - I Y2 - 4 (x 500)

::s 0
J
.... ::s Q. c
>-Cl "-(i)
c::: W
9xl 8xl
7)( I
4)(1
9)(1 axJ
7xl
6xl
- CD
·~I'~ !;:Q.. .... u=
~cj "-en 0
LL LL,
o. Q)
f'-ro 0 _Il:
10~----~--~--~--~~~~~----~----~----~--~~--J
20 30 40 50 100 200 '300 400 500
, Cool ing Rate - of / sec.
Fig.36 Critical Cooling 'Rates at 750 of For All
Plate Thicknesses Tested

..... :::l c. c
;>. c:::J) .... Q)
c: w
9><1 8xl
7xl
6)(1
5xl
Fig. 37
30 40 50 100 200 300 400 500
Coo I j n 9 Rat e - OF / sec .
. Relationship Between Energy Input and Cooling
Rat e sat 750" F For Yi' 81 PI.

5 I~ ,
..c o c:
9xl 8xl
7xl
6xl
5xl
4x:1
3xl
- 2xl
" (,J) .
Q)
:::3 0
-:>
+-:l Q. 9xl c:
8xl
>- 7xl CJ)
'- 6xl OJ c: w 5x I
4)(1
3xl
2xl
~ "'0.. ~4 '" - , 0 ""-0 6
6 B Min,:. E
4 . 3450 0
6
6 q ~ 0 <5 :3
0
:3 0
:3 0
3 0
I
:3
\ \ \
~ ", ~ '\ , .
~ergy ~ --:l Jou les/il
. ,
\ -
\ "' ~, 1'1..
, " \ ......
i'-... ~f~ , ~C ~ .- 0"
~ch , 101'), .
,\ ~ ,
~ I ~/~ " ~
\ i\.. ~ ~/n .. \ , -'~ , , ,"'
\'~~o" ....
• "r. ~ . " ~
\ " .. \ ,~
\~ ", ~ ~ ,
" 1.11
~ '\
" t .<\: ,.. ~-
,~ o~, 8..- '''I "( ( ~ G ~~ l. ~ .~~ C a: £?, ~
'~ () ( ,"" ~ I~ ~\ ~
-,c ( , Li
c
~~ ,
I 0
(I~ (j~ I
I
I 10
20 30 40 50 lOO 200 300 400 500
Coo lin g Rat e - OF / sec,
Fig.38 Re I at I on sh ip Be tween Ene rgy I nput and C'~oli n g o I II
Rates at 750, F For I ~ PI.

6 Equa t ion (I) Governs ..6. Equation (2) Governs
1:::& 3/8 " Plate • '1211
1\
0 3A \I " 4" 0 1'1/4 II
~ t 1/211 II
5
9><1 8xl
7><1
6'><1
5xl
4)(1
3xl
..c <.,)
c: - 2xl ~.
(Jl
C1>
:3 0
-:>
-:3. 0. c
>-C)')
"-Q)
c.: w
9><1 8xl
7>-.·1
6xl
5)(1
4'<.1
3xl
I
3 I IO~----~--~--~~~~~~~------~----~----~~
20
Fig.39
30 40 50 100 200 300 400 500
Coo lin 9 Rat e - OF / sec.
Rei at ion s hip Bet we e n Ene r 9 yin pu tan d Coo I i tl 9
Rates at 750°F For All Plate Thicknesses
T est e d Us i n 9 q = 80 %

A Equa t ion ( I ) Governs .. Equation (2 ) Gover'ns
"A 3/8" Plate 0 1/2.01 .. 0 3/481 II!
t1 1'/4" .. "
qx 1'/2" PI
~ 60~~--~~~------~---------+---------+--------~--------~ c::
~ U)
Q,)
:l o
J 50~-4----~~--~--~---------+---------+--------~--------~
"C c:: o en :l o .c ~ 40~~------~~~~~--~-----+---------+--------~--------~
~ 30~+-~----~~~--~--------~~------~~------~--------~ C' 'Q,)
c W
50 100 150 200 250
Cooling Rate'" of/sec.
Fig.40 Relationship Between Energy Input and Cooling Rate" at, 750 of For All Plate Thicknesses
T A etA It I lei n n n = oR n 0/ ....

9xl 8xl
7><1
6><1
5><1
5
~ ~ 0
04
04
04
"" ,
""-", .... ,,! \ ....... ~ i, \
~ .. .....~ , "" ~ " ' t' ! ~ ............. ~
.........
"........ !''Ii ~~
A Equation (I) Governs .. Equat ion (2) Governs
A 3A .. Plate cp ,8 ..
/2 .. 0 3/4" .. 0 1.1/4" II
tp ~ 1\ I 2 " ..
, ......
r......... .. .. '\ ~'-d I ............... ! III ..
11" " \ ~ ............... 4x:1
.J:: (,)
c:
3xl
- 2xl ~
(J)
Q)
:::s o
J
..... :::s a. 9><1 c
8><1
> 7><1 C\
~ 6><1 c:
W 5><1
4)(1
3xl
2xl
4 ,,~ I 0
~"""""""'i . ~ ~" 1'--. 6 ~A
~
6
~ _3 0
a :3
0 ....----f----.--. f,-----
'3 0
'3 ,
0
'3 0
:3
" ..............
.......... -~, \
-.....J T~'l.l "t ~
.............
" • ..............
........... ' ...... b, ......
............... '. ............ r-...
-_ .... _-f--- f--- - .. -
~ ........ ~~9./ . .~ "', ~ ~"
\~ ............... ........... ,01
........ 1 ~" , ~ el
;'\., ;-............. " ............... " '~ "~ ~ r..... , ~
,01 " . ~,
~ .........
..~ , .......... r--.....~' '\ b. .... " ~ ,01 1'--..:.
~ " " ~ " --
\c;. ~ ~ ~ ",,'
... _._--_._----
---!~ -----r---~
VA~ ~ ~ ~ ,
\
\ 10
20 30 40 50 100 200 300 400 500
Cool ing Rate - OF / sec.
Fig.41 Re lat i onshi p Between Energy Input and Cooli ng
Rates at 750 0 F For All Plate Thicknesses Tested Usi ng q::: 70 0/0