ress-multiaxial fatigue reliability
TRANSCRIPT
8/6/2019 RESS-Multiaxial Fatigue Reliability
http://slidepdf.com/reader/full/ress-multiaxial-fatigue-reliability 1/12
Reliability Engineering and System Safety 93 (2008) 456–467
Multiaxial fatigue reliability analysis of railroad wheels
Yongming Liu, Liming Liu, Brant Stratman, Sankaran MahadevanÃ
Department of Civil and Environmental Engineering, Vanderbilt University, Box 6077-B, 306 Jacobs Hall, Nashville TN 37235, USA
Accepted 11 December 2006
Available online 24 January 2007
Abstract
A general methodology for fatigue reliability degradation of railroad wheels is proposed in this paper. Both fatigue crack initiation and
crack propagation life are included in the proposed methodology using previously developed multiaxial fatigue models by the sameauthors. A response surface method in conjunction with design of experiments is used to develop a closed form approximation of the
fatigue damage accumulation with respect to the input random variables. The total fatigue life of railroad wheels under stochastic
loading is simulated, accounting for the spatial and temporal randomness of the fatigue damage. The field observations of railroad wheel
fatigue failures are compared with the numerical predictions using the proposed methodology.
r 2007 Published by Elsevier Ltd.
Keywords: Stochastic; Rolling contact fatigue; Multiaxial fatigue; Reliability
1. Introduction
Damage accumulation due to fatigue, plastic deforma-
tion and wear significantly reduces the service life of
railroad wheels. In recent years, higher train speeds and
increased axle loads have led to larger wheel/rail contact
forces. Also, efforts have been made to optimize wheel and
rail design. This evolution tends to change the major
wheel rim damage from wear to fatigue [1]. Unlike the
slow deterioration process of wear, fatigue causes abrupt
fractures in wheels or tread surface material loss. These
failures may cause damage to rails, damage to train
suspensions and, in some cases, serious derailment of
the train.
Railroad wheels may fail in different ways correspondingto different failure mechanisms [2–4]. Ekberg and Marais
[5] divide the wheel fatigue failure modes into three
different failure types corresponding to different initiation
locations: surface initiated, subsurface initiated and deep
surface initiated fatigue failures. Surface-initiated failures
usually break off a piece of the wheel tread, while
subsurface-initiated failure can destroy the wheel’s integrity
and thus is more dangerous. Subsurface-initiated failure,
also known as shattered rim, is the type of failure studied in
this paper. Studies on surface-initiated fatigue have been
developed elsewhere [6–8].
Shattered rim failures are the results of large fatigue
cracks that propagate roughly parallel to the wheel tread
surface [9,10]. They can grow up to a length of several
hundred millimeters. Ekberg et al. [11] reported that a
shattered rim can initiate from both inclusions and non-
inclusion locations, which indicate that both crack initia-
tion life and propagation life need to be included to predict
the failure life of railroad wheels.
Historically, the methods for the fatigue life prediction
of mechanical/structural components can be divided intoseveral groups. Among others, the fatigue crack initiation
prediction models based on the S–N or e–N curve
approach, and the fatigue crack propagation prediction
models based on fracture mechanics are predominantly
used. The fatigue crack initiation models are appropriate
for the analysis of components with non-crack-like
geometries or without large initial defects. The fatigue
crack propagation models are appropriate for the analysis
of components with crack-like geometries or with large
initial defects. If neither stage (initiation or propagation)
ARTICLE IN PRESS
www.elsevier.com/locate/ress
0951-8320/$ - see front matterr 2007 Published by Elsevier Ltd.
doi:10.1016/j.ress.2006.12.021
ÃCorresponding author. Tel.: +1 615322 3040; fax: +1 615322 3365.
E-mail address: [email protected]
(S. Mahadevan).
8/6/2019 RESS-Multiaxial Fatigue Reliability
http://slidepdf.com/reader/full/ress-multiaxial-fatigue-reliability 2/12
dominates during the entire life of the mechanical
components, a total life methodology is required to
accurately predict the component fatigue reliability.
There are two major difficulties in deterministic railroad
wheel fatigue modeling. One is that the wheels are usually
under rolling contact condition, which leads to a non-
proportional multiaxial stress state within the wheels.Proper multiaxial fatigue models are required to handle
this type of fatigue life prediction, which should be
applicable to non-proportional loading conditions. The
other difficulty is how to accurately describe the stress state
in contact analysis. Analytical solutions and simplified 2D
finite element models are not appropriate for the rolling
contact analysis of mechanical components with complex
geometries, such as railroad wheels [12].
A large amount of scatter has been observed in the
fatigue life distribution of railroad wheels, ranging from
several months to several decades. A probabilistic fatigue
analysis is more appropriate in order to consider the large
observed randomness, including various uncertainties in
material properties, structural geometries and applied
loadings. Due to the complex mechanism involved in the
rolling contact fatigue analysis and large number of
random variables affecting the final reliability, a direct
analytical reliability calculation is impractical.
This paper proposes a general methodology for rolling
contact fatigue life prediction under a stochastic loading
process. The fatigue damage within railroad wheels is
treated as a spatial-temporal random field in this study.
A response surface method (RSM) in conjunction with
design of experiments is used to develop a closed form
approximation of the fatigue damage accumulation withrespect to the input random variables. Then Monte Carlo
simulation with the response surface is used for probabil-
istic fatigue life prediction. The numerical predictions are
compared with field observations of wheel failure data. The
proposed methodology is also very valuable for fatigue
damage tolerance design, and maintenance scheduling of
mechanical and structural components.
2. Rolling contact fatigue modeling of railroad wheels
The total fatigue life of railroad wheels in the proposed
methodology is separated into two parts. One is crack
initiation life and the other is crack propagation life.
Mathematically, it can be expressed as
N total ¼ N initiation þ N propogation, (1)
where N total, N initiation and N propogation are the total fatigue
life, the fatigue crack initiation life and the fatigue crack
propagation life, respectively. The details about the
calculation of each part of the fatigue life and the transition
between the fatigue initiation life and the fatigue propaga-
tion life are described below.
2.1. Fatigue crack initiation life model
Liu et al. [12] have developed a fatigue crack initiation
life prediction model for railroad wheels. It combines a
critical plane-based multiaxial fatigue theory [13] with a 3D
finite element model. A detailed derivation and explanation
of the model can be found in the referred paper. Only a
brief illustration is shown here.
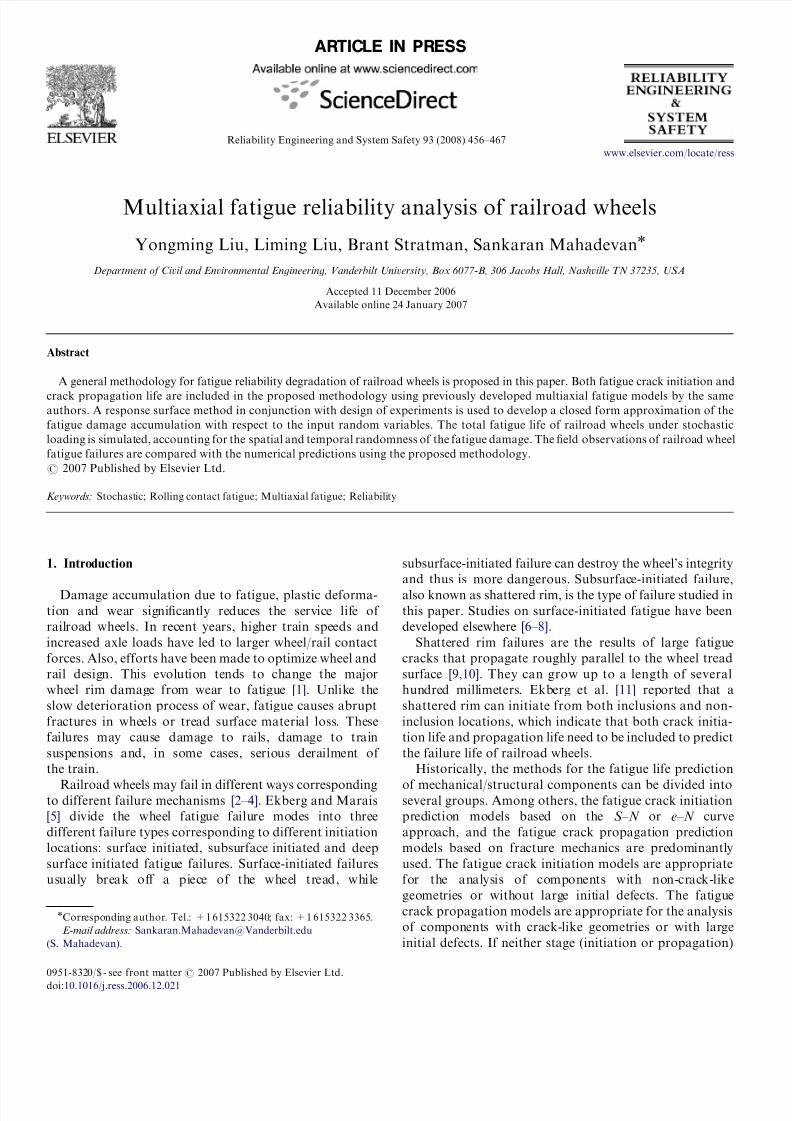
First, use the available profiles to build the geometry
model of one wheel and a piece of rail. This model is called
the full model. At the wheel center, a pilot node is
connected to the wheel using rigid link elements. All the
external loading and boundary conditions of the wheel are
applied on the pilot point. On the possible contact areas of
the railhead and the wheel tread, area contact elements are
used corresponding to the geometry mesh of the wheel. The
full model analysis is first performed and the geometrymodel of the contact region is cut out to be a sub-model
with a very fine mesh near the contact surface. The results
of the full model are interpolated on the cut boundaries of
the sub-model and applied as boundary conditions to the
sub-model. The finite element model is shown in Fig. 1.
The stress response from the finely meshed sub-model is
used for fatigue life prediction. As an illustration, the stress
ARTICLE IN PRESS
Cutting Edge
Rail
WheelPilot Node
Contact Element
Z
XY
a
b
Fig. 1. Finite element modeling of wheel/rail contact. (a) Full model; (b) sub model.
Y. Liu et al. / Reliability Engineering and System Safety 93 (2008) 456–467 457
8/6/2019 RESS-Multiaxial Fatigue Reliability
http://slidepdf.com/reader/full/ress-multiaxial-fatigue-reliability 3/12
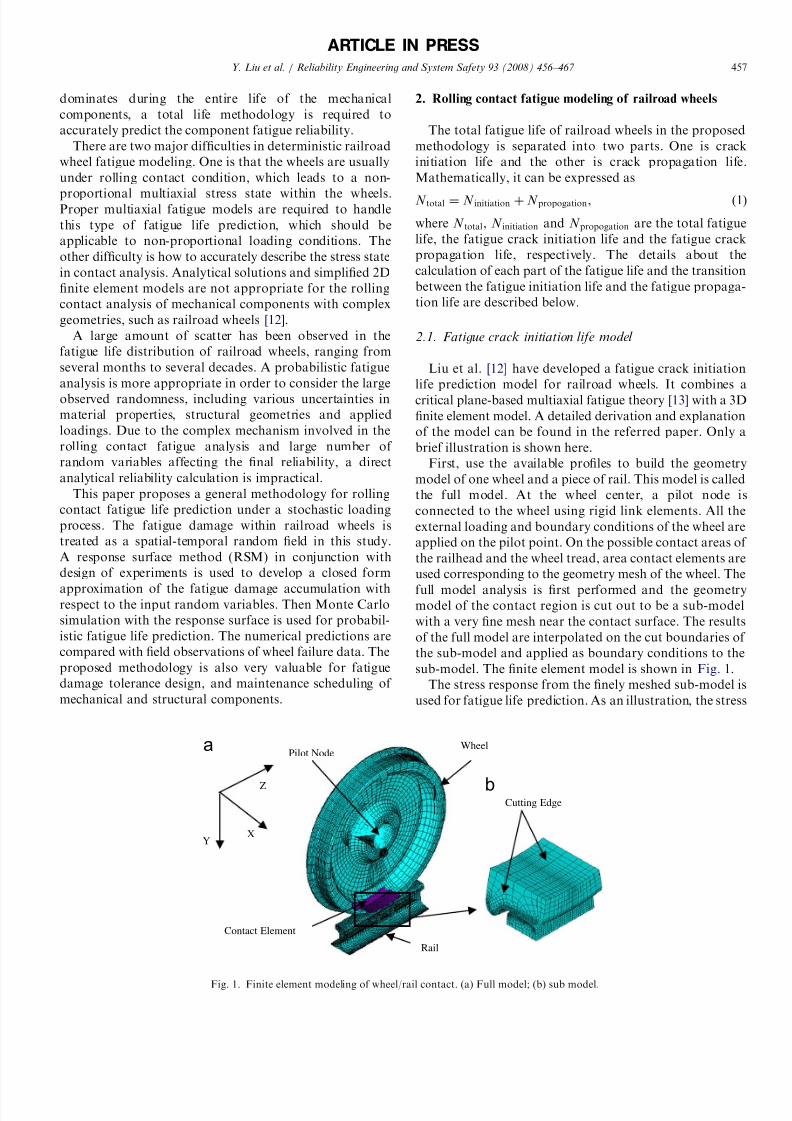
histories of two points (one is 3 mm below the tread
surface, the other is 10 mm below the tread surface) during
half a revolution of the wheel rotation are plotted in Fig. 2
[12]. Fig. 2 shows that the stress history in the wheel under
rolling contact condition is not proportional, which
indicates that the maximum normal stress and maximum
shear stress do not occur simultaneously.
After obtaining the stress history of the wheel, a
previously developed multiaxial fatigue model [13] is used
to calculate the fatigue initiation life and initial crack plane
orientation. An equivalent stress amplitude (S eq) for
fatigue crack initiation life prediction is calculated as [13]
S eq ¼ 1
B
ffiffiffiffiffiffiffiffiffiffiffiffiffiffiffiffiffiffiffiffiffiffiffiffiffiffiffiffiffiffiffiffiffiffiffiffiffiffiffiffiffiffiffiffiffiffiffiffiffiffiffiffiffiffiffiffiffiffiffiffiffiffiffiffiffiffiffiffiffiðs1Þ2 þ t2
s
2
þ t3
s
2
þ AsH
s
2s
, (2)
where S eq is the equivalent stress under multiaxial loading.
s1, t2, and t3 are the normal and shear stress amplitudeapplied on the critical plane. The subscripts 1, 2, 3 indicate
the directions of the stress amplitude. The superscript H in
sH indicates the hydrostatic stress amplitude. s is the ratio
of shear and normal stress amplitudes under a specific
fatigue crack initiation life (N initiation). A and B are material
parameters and can be found in our previously developed
multiaxial fatigue model [12]. The equivalent stress ampli-
tude and experimental S–N curve data is used to calculate
the life of wheels under a specific applied vertical loading.
Because the critical location is not available, all of the
possible nodes on the radial section of the wheel are
explored. The fatigue crack orientation and location can be
calculated and have been validated with field observations.It has been found [12] that fatigue cracks usually initiate at
some depth below the wheel tread surface and have a
shallow angle with the wheel tread surface. The informa-
tion about the crack location and orientation will be used
for fatigue crack propagation analysis in Section 2.3.
2.2. Transition between fatigue crack initiation life and
propagation life
The concept of fatigue limit is traditionally used in the
fatigue resistance design, which defines a loading criterion
under which no macroscopic crack will form. The concept
of fatigue crack threshold is often used within the damage-
tolerant design approach, which defines a loading criterion
under which the cracks will not grow significantly [14].
A link between the fatigue limit and the fatigue crack
threshold was proposed by Kitagawa and Takahashi [15].
According to the well-known El Haddad model [16], the
fatigue limit can be expressed using the fatigue threshold
and a fictional crack length a. The crack length a represents
the intersection of the smooth specimen fatigue limit and
the linear elastic fracture mechanics (LEFM) fatigue
threshold, i.e.
f À1 ¼K th ffiffiffiffiffiffipa
p , (3)
where f À1 is the fatigue limit of the material and K th is the
fatigue crack threshold for Mode I loading. Eq. (3) is
originally proposed by El Haddad et al. [16] for Mode I
loading. Liu and Mahadevan [17] showed that this idea canbe also used under mixed-mode loadings using their
developed mixed-mode fatigue crack propagation model.
The fictional crack length a can be used to bridge the
gap between the fatigue crack initiation and propagation.
Eq. (3) can be rewritten as
a ¼ 1
p
K th
f À1
2
. (4)
In the proposed method, if the fatigue damage accumula-
tion according to the fatigue crack initiation analysis
reaches a critical value (usually unity), an initial crack is
assumed to be formed with the size determined by Eq. (4).
Then the fatigue crack propagation analysis based on
fracture mechanics can be performed as shown in the next
section.
2.3. Fatigue crack propagation life model
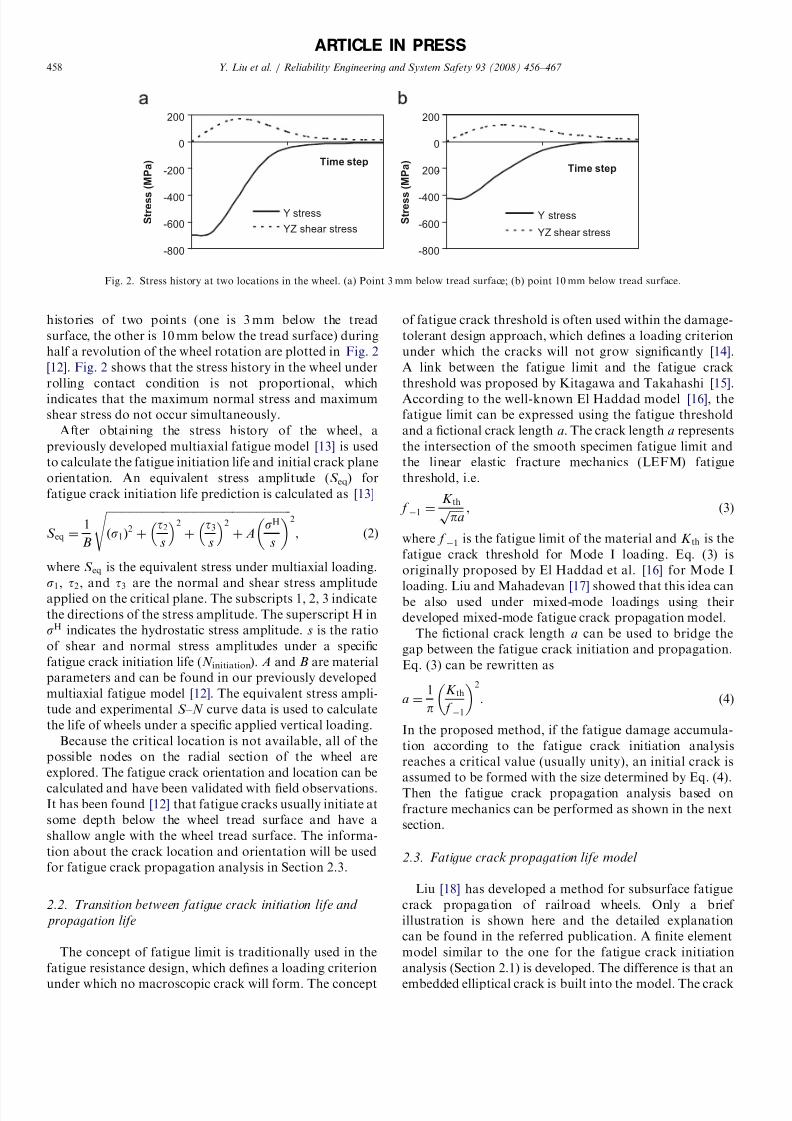
Liu [18] has developed a method for subsurface fatigue
crack propagation of railroad wheels. Only a brief
illustration is shown here and the detailed explanation
can be found in the referred publication. A finite element
model similar to the one for the fatigue crack initiation
analysis (Section 2.1) is developed. The difference is that an
embedded elliptical crack is built into the model. The crack
ARTICLE IN PRESS
-800
-600
-400
-200
0
200
Time step
S t r e s s
( M P a )
Y stress
YZ shear stress
-800
-600
-400
-200
0
200
Time step
S t r e s s
( M P a )
Y stress
YZ shear stress
Fig. 2. Stress history at two locations in the wheel. (a) Point 3 mm below tread surface; (b) point 10 mm below tread surface.
Y. Liu et al. / Reliability Engineering and System Safety 93 (2008) 456–467 458
8/6/2019 RESS-Multiaxial Fatigue Reliability
http://slidepdf.com/reader/full/ress-multiaxial-fatigue-reliability 4/12
8/6/2019 RESS-Multiaxial Fatigue Reliability
http://slidepdf.com/reader/full/ress-multiaxial-fatigue-reliability 5/12
3. Stochastic fatigue damage modeling
The above discussions are for deterministic fatigue
damage modeling. Due to the large uncertainties involved
in fatigue analysis and field observations, a stochastic
fatigue life prediction approach is proposed here, which
includes various uncertainties in material properties and
applied loadings.First consider the stress response at a specific location
and time instant. The equivalent stress amplitude S eq is
calculated using the method described in Section 2.1. At
any fixed location, S eq is a random variable with
probability density function (PDF) of f S eqðS eqÞ. The fatigue
damage caused by the stress amplitude is usually expressed
as a fraction of the total number of cycles to failure:
D ¼ 1
N , (6)
where N is the fatigue life estimation from the S – N curve
under constant stress amplitude S eq. N represents the
material resistance to fatigue loading. It is also a random
variable at a specific stress amplitude. The conditional
PDF of N can be found from experimental data and is
expressed as f N S eqj ðN Þ. The single cycle damage which
considers both the randomness in material resistance and
applied stress amplitude is a random variable whose joint
PDF can be expressed as
f DðDÞ ¼ f D S eqj ðDÞ f S eqðS eqÞ ¼ 1
D2f N S eqj
1
D
f S eq
ðS eqÞ. (7)
For the fatigue damage accumulation process, a damage
accumulation rule is required. In the current study, a linear
damage accumulation rule, known as the Miner’s rule, is
used for its simplicity. Eq. (8) is the general expression for
the Miner’s rule.
Dinitiation ¼XK
i ¼1
Di ¼XK
i ¼1
ni
N i , (8)
where K is the number of loading blocks, ni is the i th
applied loading cycle. For stochastic loading during a
certain time period, not only is the stress amplitude S eq a
random variable, but also the number of cycles ni at the
stress amplitude S eq. Nagode and Fajdiga [19] proved that
the conditional PDF ( f ni S eqj ðni Þ) of number of cycles ni at
the stress amplitude level S eq can be modeled by a normal
distribution based on the DeMoivre–Laplace principle,
with the mean and standard deviation expressed as
m ¼ 1 þ ðT À 1Þð1 À F ðS eqÞÞ,s ¼
ffiffiffiffiffiffiffiffiffiffiffiffiffiffiffiffiffiffiffiffiffiffiffiffiffiffiffiffiffiffiffiffiffiffiffiffiffiffiffiffiffiffiffiffiffiffiffiffiffiffiffiffiffi ffiðT À 1Þð1 À F ðS eqÞÞF ðS eqÞ
p , ð9Þ
where T is the total number of load cycles during each
block, F
ðS eq
Þis the cumulative density function (CDF) of
the stress amplitude which can be obtained from cycle
counting techniques such as the rain-flow counting method
[18]. The joint PDF of the total damage at a specific
location can be expressed as
f DtinitiationðDtinitiationÞ ¼ 1
D2f N i S eqj
1
D
f ni S eqj ðni Þ f S eq
ðS eqÞ.
(10)
When the fatigue damage equals or exceeds unity, we
assume that the initial fatigue crack is formed. We check
the damage accumulation at different locations. If fatigue
damage exceeds unity at one location, the number of
loading blocks is the fatigue crack initiation life of the
ARTICLE IN PRESS
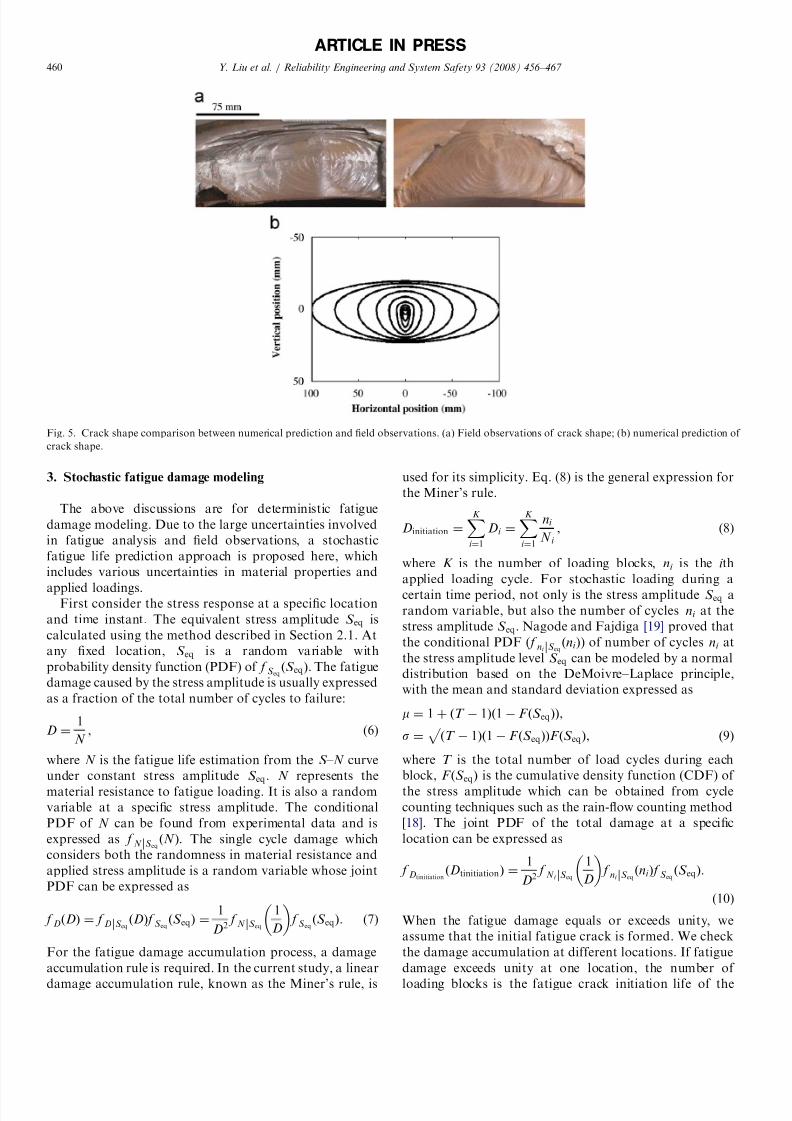
Fig. 5. Crack shape comparison between numerical prediction and field observations. (a) Field observations of crack shape; (b) numerical prediction of
crack shape.
Y. Liu et al. / Reliability Engineering and System Safety 93 (2008) 456–467 460
8/6/2019 RESS-Multiaxial Fatigue Reliability
http://slidepdf.com/reader/full/ress-multiaxial-fatigue-reliability 6/12
structure. Eq. (11) is a general expression for the structural
fatigue crack initiation criterion
Dstructure ¼ maxðDtotal;x j Þ ¼ G ðx j ; N initiation; R1 ; . . . ; RP Þ ¼ 1,
(11)
where x j is the coordinate at different locations, N initiation is
the number of loading cycles to fatigue crack initiation, R1
through Rp, are random variables which affect the fatigue
damage in the structure. Solving Eq. (11) for N initiation, we
obtain
N initiation ¼ f i x j ; R1 ; . . . ; RP
À Á. (12)
Eq. (12) shows that the fatigue crack initiation life is a
function of geometric locations and input random vari-
ables. The analytical solution for N initiation using Eq. (12) is
rather complicated and sometimes impractical. We use
Monte Carlo simulations to calculate the probabilistic
fatigue crack initiation life.
Once the fatigue crack is initiated, we use the fatigue
crack propagation model described in Section 2.3 to
calculate the fatigue crack propagation life. The equivalent
stress intensity amplitude K eq is calculated using the
described method. At a specific point at the crack tip, K eq
is a random variable with the PDF of f K eqðK eqÞ. The crack
growth rate at a specific SIF amplitude is also a random
variable with the conditional PDF of f dadN
K eqj ðda=dN Þ.Following a similar procedure as the stochastic fatigue
crack initiation life prediction, the single cycle fatigue crack
length increment Da is a random variable and its joint PDF
can be expressed as
f DðDaÞ ¼ f dadN K eqj
da
dN
f K eq ðK eqÞ. (13)
During the entire loading history, the crack propagation
length is added to the initial crack length. When the crack
reaches the critical length, the mechanical component is
assumed to fail. The failure criterion is expressed as
atotal ¼ ai þXR
m¼1
DamXac, (14)
where R is the number of loading cycles, Dam is the crack
length increment during each loading cycle. In Eq. (14), ai ,
Dam and ac are random variables. ai is calculated using
Eq. (4) and is related to material properties. ac is obtainedusing field observations of failed components (failed
railroad wheels in the current study). am is calculated using
Eq. (13) and is related to the applied stochastic loading and
material properties. am is an implicit function of crack
propagation life N propagation and other random variables and
can be expressed as
am ¼ f ðN propogation; R1 ; . . . ; R pÞ. (15)
Substitute Eq. (15) into Eq. (14) and solve for N propagation,we obtain
N propagation ¼ f pðai ; ac; R1 ; . . . ; R pÞ. (16)
Eq. (16) shows that the fatigue crack propagation life is a
function of several random variables. Again, the analytical
solution for N propagation using Eq. (16) is rather complicated
and sometimes impractical. We use Monte Carlo simula-
tions to calculate the probabilistic fatigue crack propaga-
tion life.
Substituting Eqs. (12) and (16) into Eq. (1), we can
obtain the total fatigue life of the mechanical components.
4. Response surface approximation
Due to the expensive computational effort involved in
the rolling contact finite element modeling, the RSM is
used here to approximate the relationship between the
input variables and the output variables using a few sample
points. Based on the parametric studies of the fatigue crack
initiation and the fatigue crack propagation analysis [18],
several important factors are chosen as the input variables.
The output variables are the equivalent stress amplitude for
the fatigue crack initiation analysis and the equivalent SIF
for the fatigue crack propagation analysis. A full factorial
design is used to design the numerical experiments. Thelower, middle and upper design values for five variables are
listed in Table 1. In Table 1, the applied loading is
normalized with the maximum design loading specified by
the Association of American Railroads [20]. A finite
element analysis corresponding to the design of experi-
ments in Table 1 is performed. The equivalent stress
amplitude and the equivalent SIF are used to build the
response surface by regression analysis.
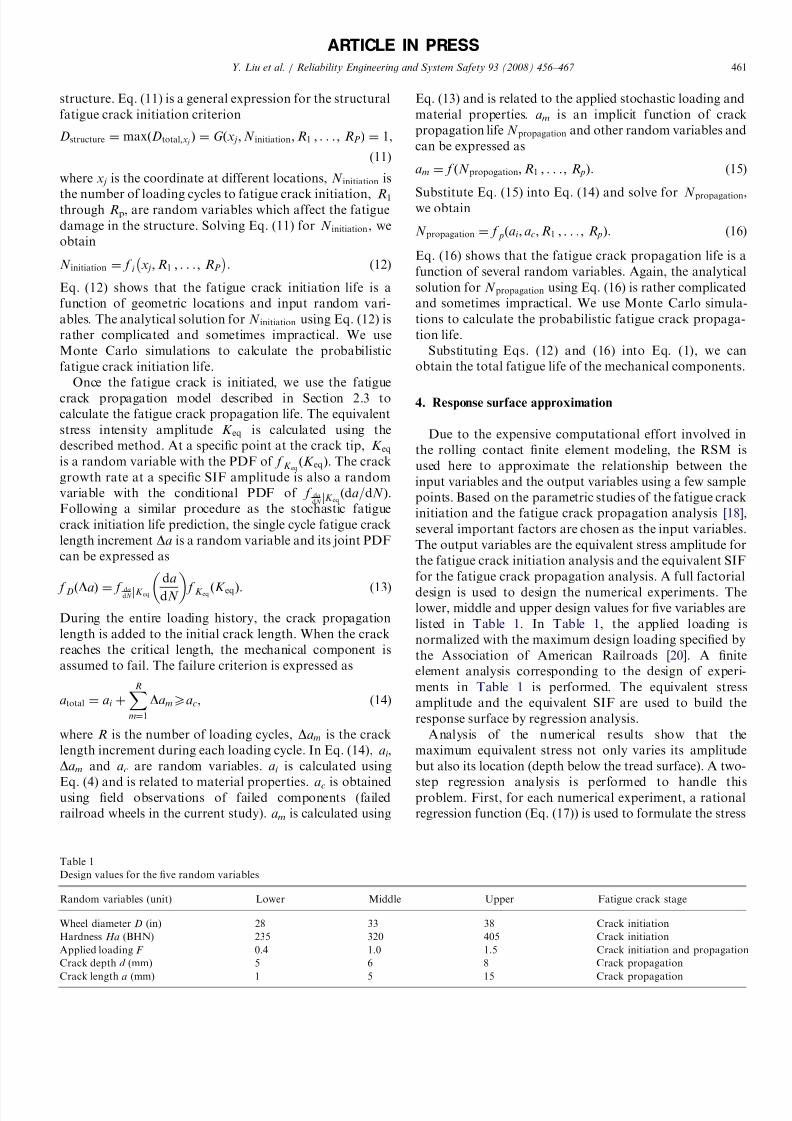
Analysis of the numerical results show that the
maximum equivalent stress not only varies its amplitude
but also its location (depth below the tread surface). A two-
step regression analysis is performed to handle thisproblem. First, for each numerical experiment, a rational
regression function (Eq. (17)) is used to formulate the stress
ARTICLE IN PRESS
Table 1
Design values for the five random variables
Random variables (unit) Lower Middle Upper Fatigue crack stage
Wheel diameter D (in) 28 33 38 Crack initiation
Hardness Ha (BHN) 235 320 405 Crack initiation
Applied loading F 0.4 1.0 1.5 Crack initiation and propagation
Crack depth d (mm) 5 6 8 Crack propagation
Crack length a (mm) 1 5 15 Crack propagation
Y. Liu et al. / Reliability Engineering and System Safety 93 (2008) 456–467 461
8/6/2019 RESS-Multiaxial Fatigue Reliability
http://slidepdf.com/reader/full/ress-multiaxial-fatigue-reliability 7/12
variation corresponding to the depth.
S eq ¼ 1
P 1
þP 2x
þP 3x2
, (17)
where S eq is the equivalent stress, P 1, P 2 and P 3 are
functions of input random variables (i.e., wheel diameter
D, hardness Ha and applied loading F ), x is the depth
below the tread surface (Fig. 6).
The regression results using Eq. (17) for two specific
numerical examples are plotted in Fig. 6(a). The regression
results for all the numerical examples are plotted in
Fig. 6(b). One point to note is that Eq. (17) is a random
function, which represents the stress variation correspond-
ing to spatial domain. The regression result of Eq. (17) is
used for the fatigue crack initiation life prediction.
The above discussion of stress range approximation
(Eq. (17)) is for fatigue crack initiation life prediction.After a fatigue crack initiates, it continues to propagate to
the final failure. SIF amplitude approximation is required
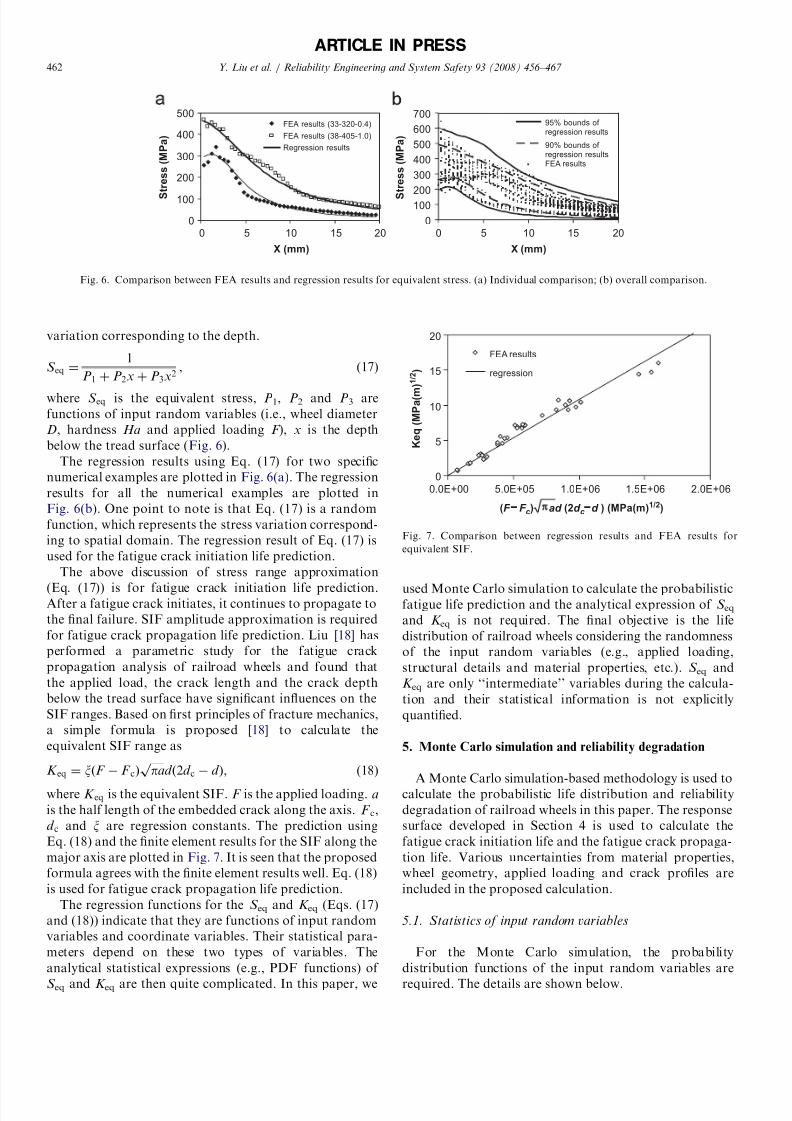
for fatigue crack propagation life prediction. Liu [18] has
performed a parametric study for the fatigue crack
propagation analysis of railroad wheels and found that
the applied load, the crack length and the crack depth
below the tread surface have significant influences on the
SIF ranges. Based on first principles of fracture mechanics,
a simple formula is proposed [18] to calculate the
equivalent SIF range as
K eq
¼x
ðF
ÀF c
Þ ffiffiffiffiffiffipa
p d
ð2d c
Àd
Þ, (18)
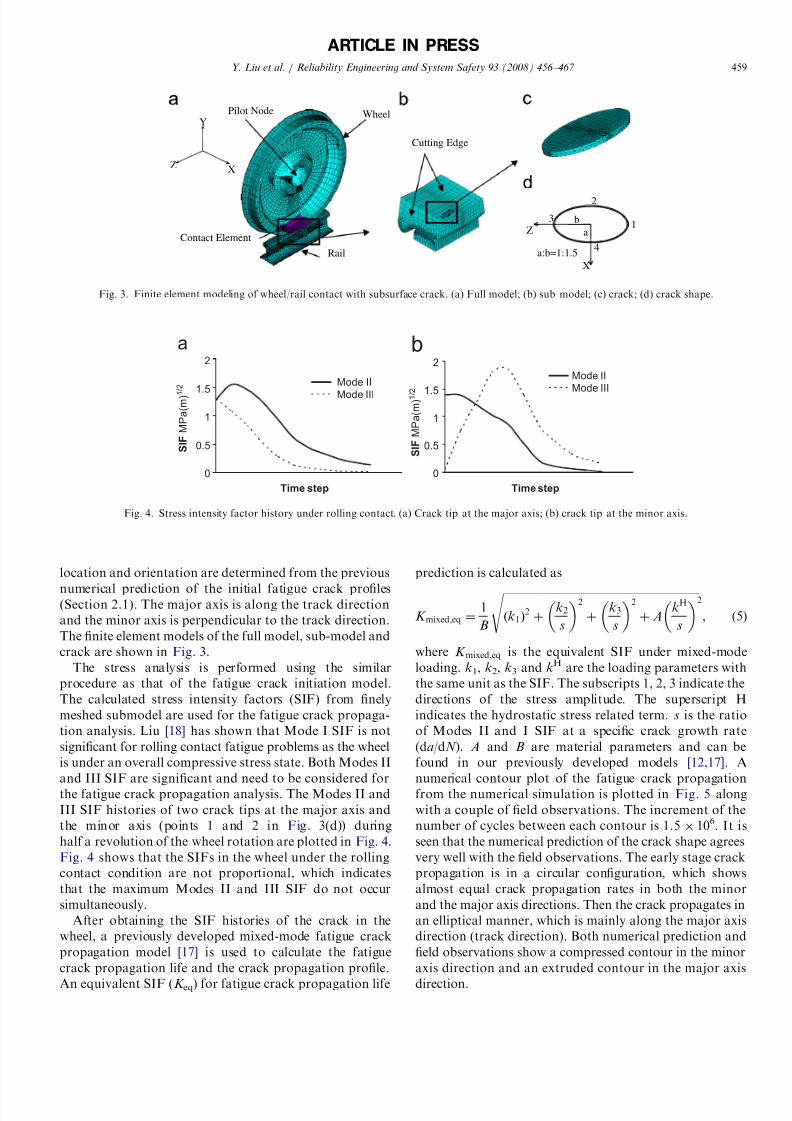
where K eq is the equivalent SIF. F is the applied loading. a
is the half length of the embedded crack along the axis. F c,
d c and x are regression constants. The prediction using
Eq. (18) and the finite element results for the SIF along the
major axis are plotted in Fig. 7. It is seen that the proposed
formula agrees with the finite element results well. Eq. (18)
is used for fatigue crack propagation life prediction.
The regression functions for the S eq and K eq (Eqs. (17)
and (18)) indicate that they are functions of input random
variables and coordinate variables. Their statistical para-
meters depend on these two types of variables. The
analytical statistical expressions (e.g., PDF functions) of
S eq and K eq are then quite complicated. In this paper, we
used Monte Carlo simulation to calculate the probabilisticfatigue life prediction and the analytical expression of S eqand K eq is not required. The final objective is the life
distribution of railroad wheels considering the randomness
of the input random variables (e.g., applied loading,
structural details and material properties, etc.). S eq and
K eq are only ‘‘intermediate’’ variables during the calcula-
tion and their statistical information is not explicitly
quantified.
5. Monte Carlo simulation and reliability degradation
A Monte Carlo simulation-based methodology is used to
calculate the probabilistic life distribution and reliability
degradation of railroad wheels in this paper. The response
surface developed in Section 4 is used to calculate the
fatigue crack initiation life and the fatigue crack propaga-
tion life. Various uncertainties from material properties,
wheel geometry, applied loading and crack profiles are
included in the proposed calculation.
5.1. Statistics of input random variables
For the Monte Carlo simulation, the probability
distribution functions of the input random variables are
required. The details are shown below.
ARTICLE IN PRESS
0
100
200
300
400
500
0 5 10 15 20
X (mm)
S
t r e s s ( M P a )
FEA results (33-320-0.4)
FEA results (38-405-1.0)
Regression results
0
100
200
300
400
500
600
700
0 5 10 15 20
X (mm)
S
t r e s s ( M P a )
95% bounds of regression results
90% bounds of regression resultsFEA results
Fig. 6. Comparison between FEA results and regression results for equivalent stress. (a) Individual comparison; (b) overall comparison.
0
5
10
15
20
0.0E+00 5.0E+05 1.0E+06 1.5E+06 2.0E+06
FEA results
regression
K e q ( M P a ( m
) 1 / 2 )
(F − F c) πad (2d c −d ) (MPa(m)1/2)
Fig. 7. Comparison between regression results and FEA results for
equivalent SIF.
Y. Liu et al. / Reliability Engineering and System Safety 93 (2008) 456–467 462
8/6/2019 RESS-Multiaxial Fatigue Reliability
http://slidepdf.com/reader/full/ress-multiaxial-fatigue-reliability 8/12
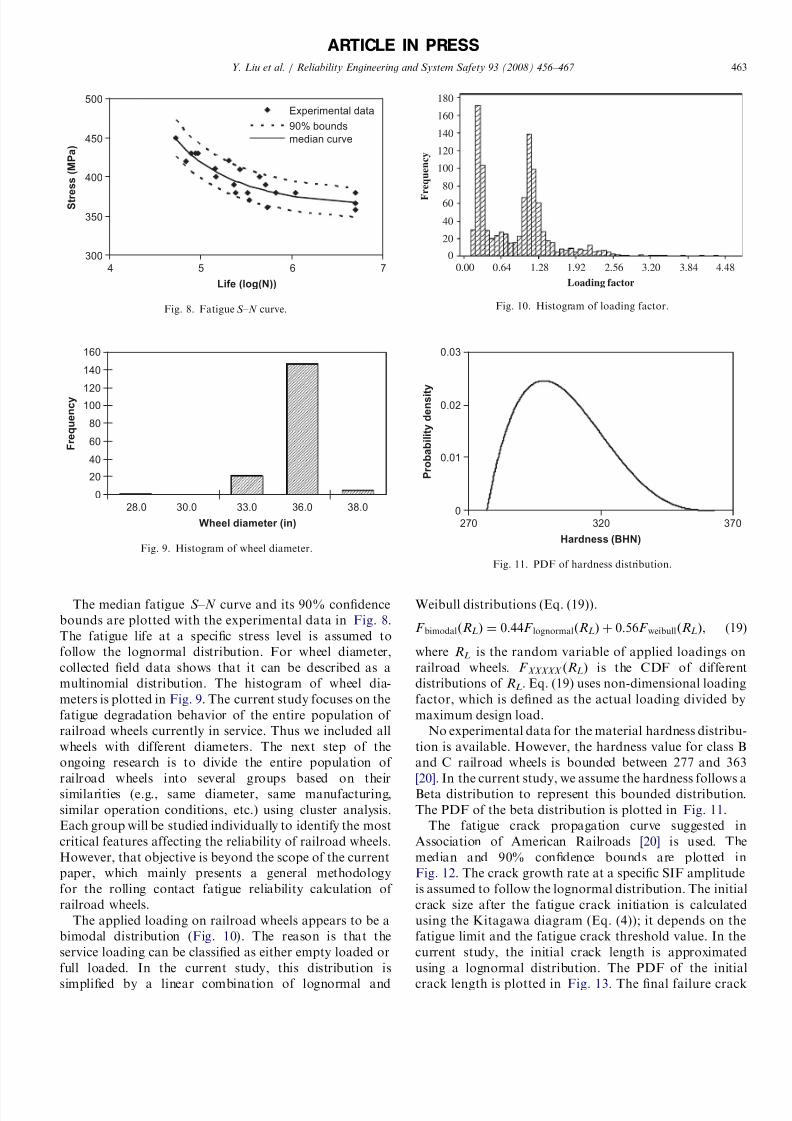
The median fatigue S – N curve and its 90% confidence
bounds are plotted with the experimental data in Fig. 8.
The fatigue life at a specific stress level is assumed to
follow the lognormal distribution. For wheel diameter,
collected field data shows that it can be described as a
multinomial distribution. The histogram of wheel dia-
meters is plotted in Fig. 9. The current study focuses on the
fatigue degradation behavior of the entire population of
railroad wheels currently in service. Thus we included all
wheels with different diameters. The next step of the
ongoing research is to divide the entire population of
railroad wheels into several groups based on their
similarities (e.g., same diameter, same manufacturing,
similar operation conditions, etc.) using cluster analysis.
Each group will be studied individually to identify the most
critical features affecting the reliability of railroad wheels.
However, that objective is beyond the scope of the current
paper, which mainly presents a general methodology
for the rolling contact fatigue reliability calculation of
railroad wheels.
The applied loading on railroad wheels appears to be a
bimodal distribution (Fig. 10). The reason is that the
service loading can be classified as either empty loaded or
full loaded. In the current study, this distribution is
simplified by a linear combination of lognormal and
Weibull distributions (Eq. (19)).
F bimodalðRLÞ ¼ 0:44F lognormalðRLÞ þ 0:56F weibullðRLÞ, (19)
where RL is the random variable of applied loadings on
railroad wheels. F XXXXX ðRLÞ is the CDF of different
distributions of RL. Eq. (19) uses non-dimensional loading
factor, which is defined as the actual loading divided by
maximum design load.
No experimental data for the material hardness distribu-
tion is available. However, the hardness value for class B
and C railroad wheels is bounded between 277 and 363
[20]. In the current study, we assume the hardness follows a
Beta distribution to represent this bounded distribution.
The PDF of the beta distribution is plotted in Fig. 11.
The fatigue crack propagation curve suggested in
Association of American Railroads [20] is used. The
median and 90% confidence bounds are plotted in
Fig. 12. The crack growth rate at a specific SIF amplitude
is assumed to follow the lognormal distribution. The initial
crack size after the fatigue crack initiation is calculated
using the Kitagawa diagram (Eq. (4)); it depends on the
fatigue limit and the fatigue crack threshold value. In the
current study, the initial crack length is approximated
using a lognormal distribution. The PDF of the initial
crack length is plotted in Fig. 13. The final failure crack
ARTICLE IN PRESS
300
350
400
450
500
4 6
Life (log(N))
S t r e s s ( M P a )
Experimental data
90% bounds
median curve
5 7
Fig. 8. Fatigue S – N curve.
0
20
40
60
80
100120
140
160
28.0 30.0 33.0 36.0 38.0
Wheel diameter (in)
F r e q u e n c y
Fig. 9. Histogram of wheel diameter.
180
160
140
120
100
80
60
40
20
0
0.00 0.64 1.28 1.92 2.56 3.20 3.84 4.48
Loading factor
F
r e q u e n c y
Fig. 10. Histogram of loading factor.
0
0.01
0.02
0.03
270 320 370
Hardness (BHN)
P r o b a b i l i t y d e n s i t
y
Fig. 11. PDF of hardness distribution.
Y. Liu et al. / Reliability Engineering and System Safety 93 (2008) 456–467 463
8/6/2019 RESS-Multiaxial Fatigue Reliability
http://slidepdf.com/reader/full/ress-multiaxial-fatigue-reliability 9/12
length uses field observation data and is approximated
using a lognormal distribution. The histogram and lognor-
mal fit are plotted in Fig. 14. The statistical properties of the
input random variables are listed in Table 2.
5.2. Probabilistic life distribution and reliability
Using the described statistics of the input random
variables, Monte Carlo simulation can be used to predict
the fatigue life of railroad wheels with the response surface
in Section 4.
Ten thousand Monte Carlo samples are used to simulate
the fatigue failure life of railroad wheels. Field data
regarding the number of cycles to failure of railroad wheels
are collected and compared with the Monte Carlo
simulation results. The empirical CDF and the frequencyhistogram of the numerical fatigue life prediction are
plotted in Fig. 15 together with the field observations. The
fatigue life in Fig. 15 is censored at 2Â 109 cycles because it
is assumed that the wheel would fail due to other failure
mechanisms by the end of this time-period.
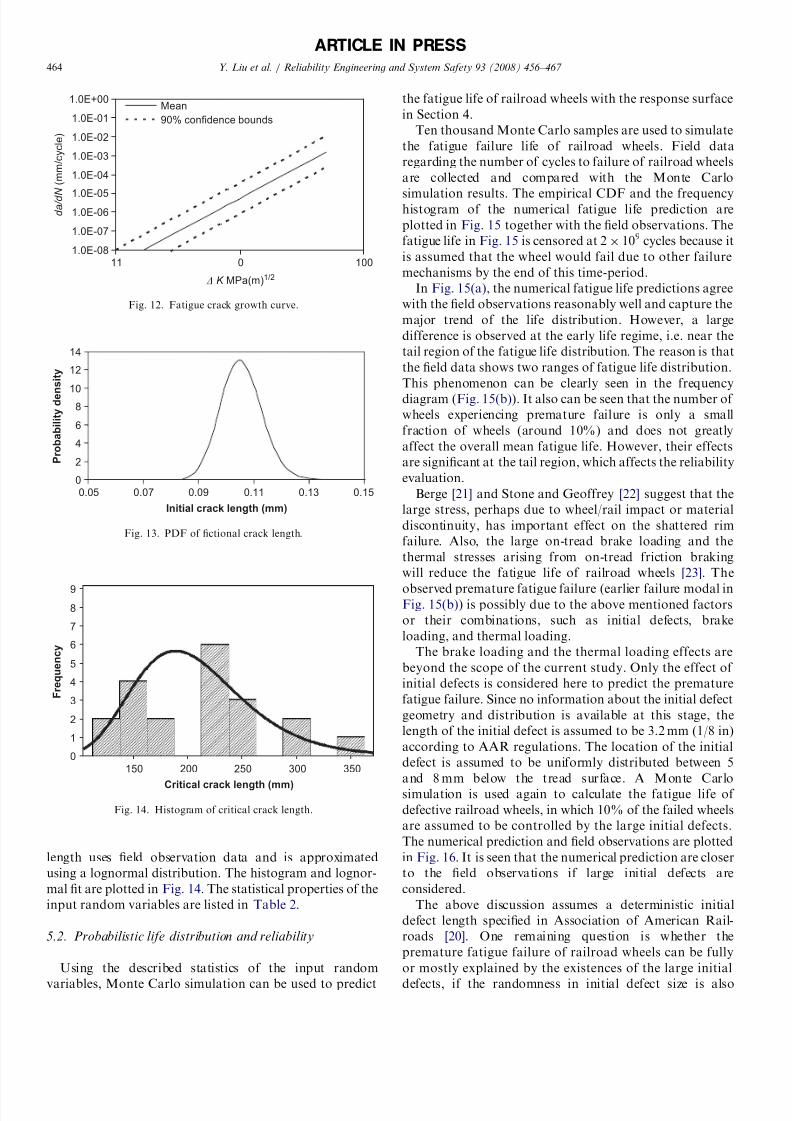
In Fig. 15(a), the numerical fatigue life predictions agree
with the field observations reasonably well and capture the
major trend of the life distribution. However, a large
difference is observed at the early life regime, i.e. near the
tail region of the fatigue life distribution. The reason is that
the field data shows two ranges of fatigue life distribution.
This phenomenon can be clearly seen in the frequency
diagram (Fig. 15(b)). It also can be seen that the number of
wheels experiencing premature failure is only a small
fraction of wheels (around 10%) and does not greatly
affect the overall mean fatigue life. However, their effects
are significant at the tail region, which affects the reliability
evaluation.
Berge [21] and Stone and Geoffrey [22] suggest that the
large stress, perhaps due to wheel/rail impact or material
discontinuity, has important effect on the shattered rim
failure. Also, the large on-tread brake loading and the
thermal stresses arising from on-tread friction braking
will reduce the fatigue life of railroad wheels [23]. The
observed premature fatigue failure (earlier failure modal inFig. 15(b)) is possibly due to the above mentioned factors
or their combinations, such as initial defects, brake
loading, and thermal loading.
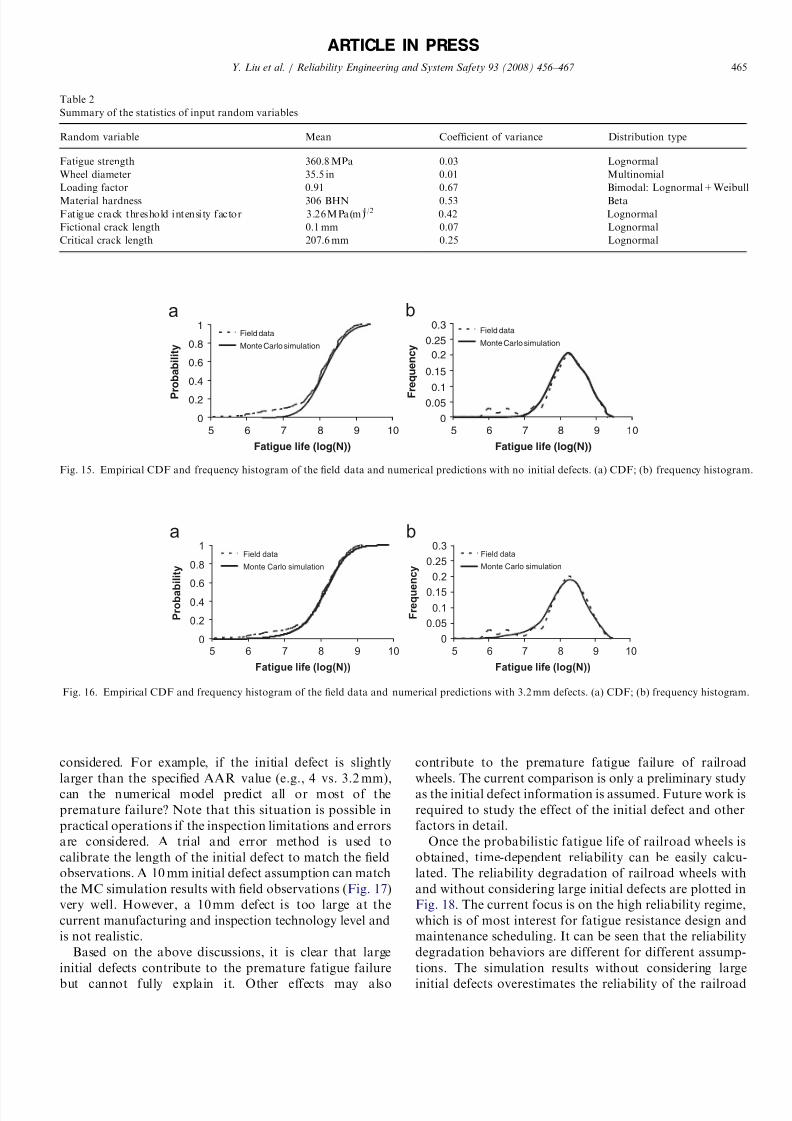
The brake loading and the thermal loading effects are
beyond the scope of the current study. Only the effect of
initial defects is considered here to predict the premature
fatigue failure. Since no information about the initial defect
geometry and distribution is available at this stage, the
length of the initial defect is assumed to be 3.2 mm (1/8 in)
according to AAR regulations. The location of the initial
defect is assumed to be uniformly distributed between 5
and 8 mm below the tread surface. A Monte Carlo
simulation is used again to calculate the fatigue life of
defective railroad wheels, in which 10% of the failed wheels
are assumed to be controlled by the large initial defects.
The numerical prediction and field observations are plotted
in Fig. 16. It is seen that the numerical prediction are closer
to the field observations if large initial defects are
considered.
The above discussion assumes a deterministic initial
defect length specified in Association of American Rail-
roads [20]. One remaining question is whether the
premature fatigue failure of railroad wheels can be fully
or mostly explained by the existences of the large initial
defects, if the randomness in initial defect size is also
ARTICLE IN PRESS
1.0E-08
1.0E-07
1.0E-061.0E-05
1.0E-04
1.0E-03
1.0E-02
1.0E-01
1.0E+00
11 0 100
Mean
90% confidence bounds
d a / d N
( m m / c y c l e )
K MPa(m)1/2
Fig. 12. Fatigue crack growth curve.
0
2
4
6
810
12
14
0.05 0.07 0.09 0.11 0.13 0.15
Initial crack length (mm)
P r o b a b i l i t y d e n
s i t y
Fig. 13. PDF of fictional crack length.
Critical crack length (mm)
F r e q u e n c y
350300250200150
9
8
7
6
5
4
3
2
1
0
Fig. 14. Histogram of critical crack length.
Y. Liu et al. / Reliability Engineering and System Safety 93 (2008) 456–467 464
8/6/2019 RESS-Multiaxial Fatigue Reliability
http://slidepdf.com/reader/full/ress-multiaxial-fatigue-reliability 10/12
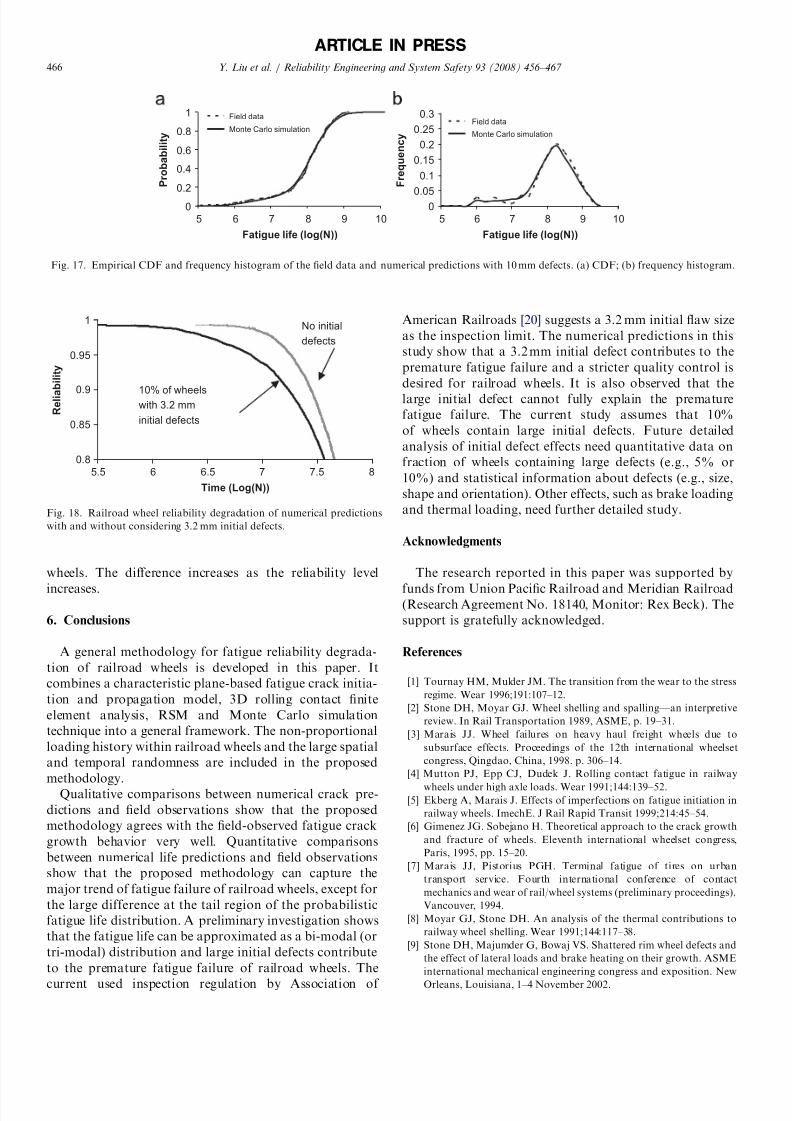
considered. For example, if the initial defect is slightly
larger than the specified AAR value (e.g., 4 vs. 3.2 mm),
can the numerical model predict all or most of the
premature failure? Note that this situation is possible in
practical operations if the inspection limitations and errors
are considered. A trial and error method is used to
calibrate the length of the initial defect to match the field
observations. A 10 mm initial defect assumption can match
the MC simulation results with field observations (Fig. 17)
very well. However, a 10 mm defect is too large at the
current manufacturing and inspection technology level and
is not realistic.
Based on the above discussions, it is clear that large
initial defects contribute to the premature fatigue failure
but cannot fully explain it. Other effects may also
contribute to the premature fatigue failure of railroad
wheels. The current comparison is only a preliminary study
as the initial defect information is assumed. Future work is
required to study the effect of the initial defect and other
factors in detail.
Once the probabilistic fatigue life of railroad wheels is
obtained, time-dependent reliability can be easily calcu-
lated. The reliability degradation of railroad wheels with
and without considering large initial defects are plotted in
Fig. 18. The current focus is on the high reliability regime,
which is of most interest for fatigue resistance design and
maintenance scheduling. It can be seen that the reliability
degradation behaviors are different for different assump-
tions. The simulation results without considering large
initial defects overestimates the reliability of the railroad
ARTICLE IN PRESS
Table 2
Summary of the statistics of input random variables
Random variable Mean Coefficient of variance Distribution type
Fatigue strength 360.8 MPa 0.03 Lognormal
Wheel diameter 35.5 in 0.01 Multinomial
Loading factor 0.91 0.67 Bimodal: Lognormal+Weibull
Material hardness 306 BHN 0.53 Beta
Fatigue crack threshold intensity factor 3.26MPa(m)1/2 0.42 Lognormal
Fictional crack length 0.1 mm 0.07 Lognormal
Critical crack length 207.6 mm 0.25 Lognormal
0
0.2
0.4
0.6
0.8
1
5 8 10
Fatigue life (log(N))
P r o b a b i l i t y
Field data
Monte Carlo simulation
0
0.05
0.1
0.15
0.2
0.25
0.3
5 7 9 10
Fatigue life (log(N))
F r e q u e n c y
Field data
Monte Carlo simulation
6 7 9 6 8
ba
Fig. 15. Empirical CDF and frequency histogram of the field data and numerical predictions with no initial defects. (a) CDF; (b) frequency histogram.
0
0.2
0.4
0.6
0.8
1
5 7 9 10
Fatigue life (log(N))
P r o b a b
i l i t y
Field data
Monte Carlo simulation
0
0.05
0.1
0.15
0.2
0.25
0.3
5 8 9 10
Fatigue life (log(N))
F r e q u e
n c y
Field data
Monte Carlo simulation
6 8 6 7
ba
Fig. 16. Empirical CDF and frequency histogram of the field data and numerical predictions with 3.2 mm defects. (a) CDF; (b) frequency histogram.
Y. Liu et al. / Reliability Engineering and System Safety 93 (2008) 456–467 465
8/6/2019 RESS-Multiaxial Fatigue Reliability
http://slidepdf.com/reader/full/ress-multiaxial-fatigue-reliability 11/12
wheels. The difference increases as the reliability level
increases.
6. Conclusions
A general methodology for fatigue reliability degrada-
tion of railroad wheels is developed in this paper. It
combines a characteristic plane-based fatigue crack initia-
tion and propagation model, 3D rolling contact finite
element analysis, RSM and Monte Carlo simulation
technique into a general framework. The non-proportional
loading history within railroad wheels and the large spatial
and temporal randomness are included in the proposed
methodology.
Qualitative comparisons between numerical crack pre-
dictions and field observations show that the proposed
methodology agrees with the field-observed fatigue crack
growth behavior very well. Quantitative comparisons
between numerical life predictions and field observations
show that the proposed methodology can capture the
major trend of fatigue failure of railroad wheels, except for
the large difference at the tail region of the probabilistic
fatigue life distribution. A preliminary investigation shows
that the fatigue life can be approximated as a bi-modal (or
tri-modal) distribution and large initial defects contribute
to the premature fatigue failure of railroad wheels. The
current used inspection regulation by Association of
American Railroads [20] suggests a 3.2 mm initial flaw size
as the inspection limit. The numerical predictions in this
study show that a 3.2 mm initial defect contributes to the
premature fatigue failure and a stricter quality control is
desired for railroad wheels. It is also observed that the
large initial defect cannot fully explain the premature
fatigue failure. The current study assumes that 10%
of wheels contain large initial defects. Future detailed
analysis of initial defect effects need quantitative data on
fraction of wheels containing large defects (e.g., 5% or
10%) and statistical information about defects (e.g., size,
shape and orientation). Other effects, such as brake loading
and thermal loading, need further detailed study.
Acknowledgments
The research reported in this paper was supported by
funds from Union Pacific Railroad and Meridian Railroad(Research Agreement No. 18140, Monitor: Rex Beck). The
support is gratefully acknowledged.
References
[1] Tournay HM, Mulder JM. The transition from the wear to the stress
regime. Wear 1996;191:107–12.
[2] Stone DH, Moyar GJ. Wheel shelling and spalling—an interpretive
review. In Rail Transportation 1989, ASME, p. 19–31.
[3] Marais JJ. Wheel failures on heavy haul freight wheels due to
subsurface effects. Proceedings of the 12th international wheelset
congress, Qingdao, China, 1998. p. 306–14.
[4] Mutton PJ, Epp CJ, Dudek J. Rolling contact fatigue in railway
wheels under high axle loads. Wear 1991;144:139–52.[5] Ekberg A, Marais J. Effects of imperfections on fatigue initiation in
railway wheels. ImechE. J Rail Rapid Transit 1999;214:45–54.
[6] Gimenez JG. Sobejano H. Theoretical approach to the crack growth
and fracture of wheels. Eleventh international wheelset congress,
Paris, 1995, pp. 15–20.
[7] Marais JJ, Pistorius PGH. Terminal fatigue of tires on urban
transport service. Fourth international conference of contact
mechanics and wear of rail/wheel systems (preliminary proceedings),
Vancouver, 1994.
[8] Moyar GJ, Stone DH. An analysis of the thermal contributions to
railway wheel shelling. Wear 1991;144:117–38.
[9] Stone DH, Majumder G, Bowaj VS. Shattered rim wheel defects and
the effect of lateral loads and brake heating on their growth. ASME
international mechanical engineering congress and exposition. New
Orleans, Louisiana, 1–4 November 2002.
ARTICLE IN PRESS
0
0.2
0.4
0.6
0.8
1
5 7 9 10
Fatigue life (log(N))
P r o b a b i l i t y
Field data
Monte Carlo simulation
00.05
0.1
0.15
0.2
0.25
0.3
5 10
Fatigue life (log(N))
F r e q u e n c y
Field data
Monte Carlo simulation
6 8 6 7 8 9
Fig. 17. Empirical CDF and frequency histogram of the field data and numerical predictions with 10 mm defects. (a) CDF; (b) frequency histogram.
0.8
0.85
0.9
0.95
1
5.5 6 6.5 7 7.5 8
Time (Log(N))
R e l i a
b i l i t y
No initial
defects
10% of wheelswith 3.2 mm
initial defects
Fig. 18. Railroad wheel reliability degradation of numerical predictions
with and without considering 3.2 mm initial defects.
Y. Liu et al. / Reliability Engineering and System Safety 93 (2008) 456–467 466

8/6/2019 RESS-Multiaxial Fatigue Reliability
http://slidepdf.com/reader/full/ress-multiaxial-fatigue-reliability 12/12
[10] Giammarise AW, Gilmore RS. Wheel quality: a North American
locomotive builder’s perspective. GE Research & Development
Center, CRD140, September 2001.
[11] Ekberg A, Kabo E, Andersson H. An engineering model for
prediction of rolling contact fatigue of railway wheels. Fatigue Fract
Eng Mater Struct 2002;25:899–909.
[12] Liu Y, Stratman B, Mahadevan S. Fatigue crack initiation life
prediction of railroad wheels. Int J Fatigue 2006;28(7):747–56.[13] Liu Y, Mahadevan S. Multiaxial high-cycle fatigue criterion and life
prediction for metals. Int J Fatigue 2005;7(7):790–800.
[14] Lawson L, Chen EY, Meshii M. Near-threshold fatigue: a review. Int
J Fatigue 1999;21:15–34.
[15] Kitagawa H. Takahashi S. Applicability of fracture mechanics to
vary small cracks or cracks in early stage. In: Proceedings of the 2nd
international conference on mechanical behavior of materials. Metal
Park (OH, USA), ASM International, 1976, p. 627–31.
[16] El Haddad MH, Topper TH, Smith KN. Prediction of nonpropagat-
ing cracks. Eng Fract Mech 1979;11:573–84.
[17] Liu Y, Mahadevan S. Threshold intensity factor and crack growth
rate prediction under mixed-mode loading. Eng Fract Mech
2007;74:332–45.
[18] Liu Y. Stochastic multiaxial fatigue and fracture modeling. PhD
dissertation, Vanderbilt University, Nashville, TN, March 2006.
[19] Nagode M, Fajdiga M. On a new method for prediction of the scatter
of loading spectra. Int J Fatigue 1998;20(4):271–7.
[20] Association of American Railroads. Manual of standards andrecommended practices: section G-wheels and axles, Issue of 1998.
[21] Berge S. Shattered rim fracture research. Proceedings of the 2000
Brenco rail conference, LaQuinta, California, October 19–20, 2000.
[22] Stone DH, Geoffrey ED. The effect of discontinuity size on the
initiation of shattered rim defects. ASME Transportation Division,
vol. 19, ASME Spring 2000, p. 7–14.
[23] Gordon J, Perlman AB. Estimation of residual stresses in railroad
commuter car wheels following manufacture. Proceedings, Interna-
tional Mechanical Engineering Congress and Exhibition, ASME
RTD, vol. 15, p. 13–18, 1998.
ARTICLE IN PRESS
Y. Liu et al. / Reliability Engineering and System Safety 93 (2008) 456–467 467