multiaxial fatigue strength to notched specimens …multiaxial fatigue strength to notched specimens...
TRANSCRIPT

© 2016 Filippo Berto, Abedin Gagani, Raffaella Aversa, Relly Victoria V. Petrescu, Antonio Apicella and Florian Ion T.
Petrescu. This open access article is distributed under a Creative Commons Attribution (CC-BY) 3.0 license.
American Journal of Engineering and Applied Sciences
Original Research Paper
Multiaxial Fatigue Strength to Notched specimens made of
40CrMoV13.9
1Filippo Berto,
1Abedin Gagani,
2Raffaella Aversa,
3Relly Victoria V. Petrescu,
2Antonio Apicella and
3Florian Ion T. Petrescu
1Department of Engineering Design and Materials, NTNU, Trondheim, Norway 2Advanced Material Lab, Department of Architecture and Industrial Design,
Second University of Naples, 81031 Aversa (CE) Italy 3ARoTMM-IFToMM, Bucharest Polytechnic University, Bucharest, (CE) Romania
Article history
Received: 28-09-2016 Revised: 24-12-2016 Accepted: 30-12-2016 Corresponding Author: Filippo Berto Department of Engineering Design and Materials, NTNU, Trondheim, Norway Email: [email protected]
Abstract: Fatigue is a process (succession of mechanisms) which under the action of time-varying strains or deformations modifies the local properties of a material. These can lead to the formation of cracks and eventual rupture of the structure. Fatigue is in particular characterized by an extent of variation in stress which may be well below the yield strength of the material. The main stages of fatigue failure of an assembly are the initiation of cracks (if defects are not already present in the material), the propagation of cracks and the final rupture. The parameters often used to predict the fatigue behavior and thus the number of cycles at break of a structure is: The amplitude of the stress (loading or imposed strain), its average value, the surface state and the medium In which the structure will be used. Even if the study of fatigue is based on theoretical considerations (in particular the mechanics of the rupture), it is essentially an experimental field. The characterization of a material, a part, an assembly, a structure, requires numerous tests and measurements. The work deals with multiaxial fatigue power of specimens which are notched and all made of 40CrMoV13.9. Circumferentially V-notched specimens and semicircular notched were tested under combined tension and torsion loading, both, in phase or out of phase. Geometry of symmetric axis of V notched issues has been characterized of a notch radius constant from (1 mm) and V-notch opening angle of 90°. The semicircular specimens were characterized by a constant notch tip radius. For both situations the net diameter sectional area was 12 mm. The results from multi-axial tests are discussed together with those obtained being all under loading pure torsion and tension by the issues notched having the same geometry. Altogether more than 120 new fatigue data are summarized in the present work. All presented fatigue data are first in terms of nominal amplitudes stress and then reanalyzed in terms of the mean value of the strain energy density evaluated over a finite size semicircular sector surrounding the tip of the notch. Keywords: Multiaxial Fatigue, SED Criterion, Notched Components, Non Proportional Loading
Introduction
Fatigue is a process (succession of mechanisms) which under the action of time-varying strains or deformations modifies the local properties of a material. These can lead to the formation of cracks and eventual rupture of the structure. Fatigue is in particular
characterized by an extent of variation in stress which may be well below the yield strength of the material. The main stages of fatigue failure of an assembly are the initiation of cracks (if defects are not already present in the material), the propagation of cracks and the final rupture.
The parameters often used to predict the fatigue behavior and thus the number of cycles at break of a

Filippo Berto et al. / American Journal of Engineering and Applied Sciences 2016, 9 (4): 1269.1291 DOI: 10.3844/ajeassp.2016.1269.1291
1270
structure are, the amplitude of the stress (loading or imposed strain), its average value, the surface state and the medium in which the structure will be used.
Even if the study of fatigue is based on theoretical considerations (in particular the mechanics of the rupture), it is essentially an experimental field. The characterization of a material, a part, an assembly, a structure, requires numerous tests and measurements.
Consider a steel traction bar, with a section of 1 cm2. If it is fired at a force greater than 23 500 N (the equivalent of the weight of a mass of 2.35 t), the bar presents an irreversible deformation (plastic deformation); It breaks for a force of 37 000 N (the equivalent of 3.7 t) -these are the values guaranteed for a standard S235 steel, the actual resistance is normally somewhat higher.
Now, let us suppose that we draw on this bar with a force of 23 400 N (2.34 t). The part resists without problem and does not present any irreversible deformation. But if we repeat this traction ten million times, we find that the piece breaks. We talk about fatigue failure.
At each solicitation, the part undergoes micro-damage which has no short-term consequences, but this damage accumulates over hundreds of thousands of cycles and leads to rupture.
Such repeated stresses may correspond to starting and stopping phases of an engine, to variations in engine speed, to gusts of wind on a structure, to swell on floating structures (boats, oil platforms), to the effects (Petrescu and Calautit, 2016a; 2016b).
The expansion of a heating and cooling device (e.g., a boiler), repeated contacts (gears, balls on the track of a ball bearing), road jolts for a vehicle, take-offs and Landing gear for the landing gear of an aircraft, vibrations for small parts (mounting brackets, wire of an electronic circuit).
The first fatigue tests recorded were carried out by Wilhelm Albert in 1829 and concerned mine chains. In 1839, Jean-Victor Poncelet used the term "fatigue" for the first time.
In 1842, the fatigue failure of an axle caused the Meudon railway disaster, as will be shown by the work of William Rankine.
In 1852, August Wöhler was commissioned by the Prussian Minister of Commerce to work on axle disruptions on trains. He exhibited his work at the Universal Exhibition of 1867 in Paris.
In 1954, S. S. Manson and L. F. Coffin worked on oligo-cyclic fatigue (Fatigue material, From Wikipedia).
Description of the Fatigue of a Metal Part
When a monotonic stress (see Tensile test) is applied to a ductile metallic quasi-smooth (with a quasi-uniform stress field), the test piece begins to deform irreversibly
by plastic deformation from a value of Constraint called "yield stress" and denoted Re. As the test piece continues to elongate, this plastic deformation generates damage and then breakage, the stress causing the damage being called "tensile strength" and denoted Rm; Rm is greater than Re.
When designing a part, it is generally dimensioned so that the stress never exceeds Re, which would indicate irreversible deformation of the part and thus disrupt the operation of the system, so a fortiori for the constraint never to exceed Rm.
However, in the case of a cyclic loading, a rupture occurs after several cycles (sometimes several million cycles), for stress values less than Re.
Some materials have a limit of endurance, less than Re: If the stress is less than this limit of endurance, one never observes "rupture" (at least not within a reasonable time, typically more than one hundred million cycles). Some materials have no limit of endurance and the rupture always occurs after a more or less long number of cycles even for low stress values; this is particularly the case for aluminum alloys.
When designing a room, one must examine its various modes of degradation: • Static rupture or rupture in less than one cycle (in
the ascending phase of the charge, i.e., in the first quarter of the cycle in the case of a sinusoidal cycle)
• Permanent deformation (plastic deformation) if it can impede further operation
• And if the structure undergoes repeated constraints:
• Failure in oligocyclic fatigue, for loads leading to ruin in less than 50 000 cycles
• Conventional fatigue beyond 50,000 cycles
These different modes of ruin correspond to loadings of decreasing amplitudes.
Fatigue damage occurs primarily in areas with the highest alternating stresses, i.e., in zones with stress concentrations (holes, notches, etc.).
If one observes the surface broken under the microscope, one has a typical facies: One sees streaks globally parallel, corresponding to the propagation of the crack at each stress, then a zone of tearing, corresponding to the final rupture.
The lifetime at crack initiation often has a long duration compared to propagation time. In the case of a smooth specimen, the propagation lifetime is low. On the other hand, for a structure, the propagation part can be significant. There are therefore two phases:
The phase of initiation during which the material is damaged in a non-detectable way (N.B.: An anglicism commonly used is "initiation", the use of this term is incorrect in French); the lifetime is often defined at the detectable crack initiation of the structure, with an

Filippo Berto et al. / American Journal of Engineering and Applied Sciences 2016, 9 (4): 1269.1291 DOI: 10.3844/ajeassp.2016.1269.1291
1271
appropriate choice of the minimum properties of the material.
The crack propagation phase during which inspections can be performed before breaking. This is the domain of the mechanics of rupture (Fatigue material, From Wikipedia).
With reference to cracked and notched components a number of multi-axial predictive models were proposed in the last years (Carpinteri et al., 2009; Lagoda et al., 1999; Ye and Vormwald, 2008). A comparison among different failure criteria, with the SED approach being included, was carried out considering a large bulk of experimental data from notched specimens (Nieslony and Sonsino, 2008).
The critical plane approach was reviewed and modified (Carpinteri et al., 2009) correlating the critical plane orientation with the weighted mean principal stress directions. A thermodynamics analysis of cyclic plastic deformation was carried out (Ye and Vormwald, 2008) to establish an energy transition relation for describing the elastic-plastic stress and strain behavior of the notch-tip material element in bodies subjected to uni-axial and multiaxial cyclic loads. According to the actual energy conversion occurring in the notch-tip issue material in time of plastic cyclic deformation, an only one method to estimating the elastic-plastic notch stress-strain responses in bodies subjected to multiaxial cyclic loads has been carried out and Neuber’s rule and method of Glinka’s ESED all become just particular two cases.
Theoretical and experimental difficulties arising in the multi-axial fatigue testing and in the interpretations of the final results were discussed by several researchers (Pook and Sharplesm, 1979; Pook, 1985; Tong et al., 1986; Ritchie, 1988; Yu et al., 1998; Tanaka et al., 1999; Pippan et al., 2011).
Prediction of the branch crack threshold condition under mixed mode (I+III) was suggested (Pook and Sharples, 1979) through the analysis of the main crack tip stress field. Pook pointed out that it is necessary to distinguish between the different thresholds for the initiation of crack growth, crack arrest and specimen failure (Pook, 1985).
It was clearly shown (Tong et al., 1986) that a definition of a fatigue threshold ∆Kth under poly-modal loading is far from easy mainly because under torsion loading an extensive plastic zone is developed to a III crack model. Yielding together with the dissipative phenomenon due to the possible contact of the crack flanks, result in a strong influence for the test data geometry.
The mechanisms (intrinsic and extrinsic) producing shielding effects during fatigue crack propagation were classified by Ritchie (1988) whereas near threshold fatigue crack propagation was examined by Yu et al. (1998) and by Tanaka et al. (1999).
The crack propagation rate decreased with crack extension due to the shear contact of the faces crack, leading to a friction increase, interlocking and abrasion.
The mechanisms of crack propagation were recently revisited also by Pippan et al. (2011) who, dealing with ductile metallic materials, considered the effect of the environment, short cracks, small scale and large scale yielding. It has been highlighted the important role of the crack propagation mechanisms; one developed methodology for a certain material and loading case can be applied to other materials under the same loading conditions just when the mechanisms of fatigue crack propagation are the same.
Another new math stresses model about the tip of a fatigue crack, who considers the effects of plasticity through an analysis of their shielding effects on the applied elastic field was developed by Christopher et al. (2007).
The possibility of this model to present the induced plasticity effects of loading cycling in the field of elastic stress has been demonstrated by using full field theory photo elasticity.
Initiation of the growth crack (under a combination of opening and anti-plane shearing mode loading) has been also considered by Ravi-Chandar and co-workers (Lin et al., 2010) where was showed the fact that cracks do not grow (through a continuous evolution of the crack surface) but rather by means of an abrupt fragmentation or segmentation of the front crack.
In some studies (Tanaka, 2012; 2013) circumferentially notched bars (of austenitic stainless steel, SUS316L and carbon steel, SGV410, with three different notch-tip radii) were fatigued under cyclic torsion without and with static tension.
All these (main) results were that in pure cyclic torsion, the fatigue life of circumferentially notched bars of austenitic stainless steel SUS316L were found to be longer than that of smooth bars (get longer with increasing stress concentration under the same amplitude of the nominal shear stress).
The anomalous behavior of the notch-strengthening effect was ascribed to the larger retardation of fatigue crack propagation by crack surface contact for the sharper notches. The superposition of static tension on cyclic torsion of SUS316L reduced the retardation due to the smaller amount of crack surface contact, which gave rise well known notch-weakening of the fatigue strength. This notch-strengthening effect was not found in torsional fatigue of SGV410 under cyclic torsion with and without static tension.
In the last years the approach based on the SED over a control volume has been extended from the welded joints to the quasi-sharp notches where the absence of residual stresses and alterations of microstructure like those provoked by the welding process make much more

Filippo Berto et al. / American Journal of Engineering and Applied Sciences 2016, 9 (4): 1269.1291 DOI: 10.3844/ajeassp.2016.1269.1291
1272
difficult the interpretation of the results which are strongly dependent on the considered material.
In particular, the SED approach was used to summarize about 300 fatigue data from axis-symmetric specimens made of a medium carbon steel C40 (Atzori et al., 2006) and a 39NiCrMo3 (Berto et al., 2011) steel weakened by circumferential quasi-sharp V-notches and subjected to uniaxial and multiaxial loading.
The dissipative phenomena occurring during the experimental activity were widely investigated (Berto et al., 2011) in combination with fracture surfaces and non-propagating cracks in the run-out specimens.
A final synthesis of the main body of the data, with the only exclusion of the out-of-phase data, were presented in terms of a single SED-based scatterband adapting the control volume as a function of the loading mode (Berto et al., 2011). Under mode III loading conditions the control volume radius was found to be strongly influenced by extrinsic shielding mechanisms. The data from the out-of-phase loads were not included into the proposed scatterband, being located well below its lower limit.
Dealing with sharply notched components, the main objective of Ref. (Berto and Lazzarin, 2011) was to briefly summarize the multi-axial fatigue strength data reported in Refs (Atzori et al., 2006; Berto et al., 2011) and document more recent data from plain and notched specimens made of AISI 416 stainless steel (at hardened and tempered state), subjected to combined tension and torsion loading, both in-phase and out-of-phase (Φ = 0° and Φ = 90°).
In particular 13 new fatigue series dealing with tension loading, torsion loading and combined tension and torsion loading were presented there for the first time. All results were re-analyzed in terms of local SED showing that the same value of the local energy can be re-establish at high cycle fatigue by using two different control volumes under mode I and mode III
loading, as already documented for 39NiCrMo3 steel (Berto et al., 2011).
The present work deals with multiaxial fatigue strength of notched specimens made of 40CrMoV13.9. Circumferentially V-notched specimens and semicircular notched were tested under combined tension and torsion loading, both in-phase and out-of-phase. The geometry of axis-symmetric V-notched specimens was characterized by a constant notch tip radius (1 mm) and V-notch opening angle of 90°.
The averaged Strain Energy Density (SED) criterion is used in order to estimate the fatigue strength behavior of notched components subjected to in phase and out of phase loading.
The results from multi-axial tests are discussed together with those obtained under pure tension and pure torsion loading from notched specimens with the same geometry. Altogether more than 120 new fatigue data are summarized. For this material which is a high strength steel the SED approach is intrinsically able to overcome the complex problem of non-proportional loading and a single value of the control volume has been used independent of the loading mode.
Material and Methods (Geometry of the
Specimens)
All the specimens were made of 40CrMoV13.9 steel. Static tensile tests were carried out to evaluate the elastic and the strength properties of the material; the relevant mean values are listed in Table 1, while the chemical composition of the material is reported in Table 2. The geometries of the specimens tested in the present investigation are shown in Fig. 1.
The V-notch depth d was equal to 4 mm for both cases. The axis-symmetric V-notched specimens were characterized by a constant notch tip radius (1 mm) and a V-notch opening angle equal to 90°. The geometry of semicircular specimens instead was characterized by a constant notch tip radius equal to 4 mm.
Fig. 1. Geometry of V-notched specimens and semicircular specimens

Filippo Berto et al. / American Journal of Engineering and Applied Sciences 2016, 9 (4): 1269.1291 DOI: 10.3844/ajeassp.2016.1269.1291
1273
Table 1. Mechanical properties of 40CrMoV13.9
Ultimate tensile strength (MPa) Yield stress (MPa) Elongation to fracture (%) Brinell Hardness 1355 1127 15.2 393-415 Table 2. Chemical composition wt.%, balance Fe C Mn Si S P Cr Ni Mo V Al W 0.38 0.5 0.27 0.006 0.003 3.05 0.24 1.04 0.24 0.013 0.005
The specimens were tested under pure tension, pure torsion and multiaxial tension-torsion loading with different biaxiality ratios (λ = τa/σa = 0.6 and 1.0). In particular, ten fatigue test series were conducted, according to the following subdivision: • Two series of tests on notched specimens (V and
semicircular notches) under pure torsion fatigue loading (nominal load ratio R = -1)
• One series of tests on V-notched specimens under pure tension fatigue loading (nominal load ratio R = -1)
• Two series of tests on V-notched specimens under combined tension-torsion fatigue loading, under constant biaxiality ratio λ = 1, load ratio R = -1, load phase angle Φ = 0° or Φ = 90°
• Two series of tests on V-notched specimens under combined tension-torsion fatigue loading, under constant biaxiality ratio λ = 0.6, load ratio R = -1, load phase angle Φ = 0° or Φ = 90°
• Two series of tests on semicircular specimens under combined tension-torsion fatigue loading, under constant biaxiality ratio λ = 1, load ratio R = -1, load phase angle Φ = 0° or Φ = 90°
• One series of tests on semicircular specimens under combined tension-torsion fatigue loading, under constant biaxiality ratio λ = 0.6, load ratio R = -1, load phase angle Φ = 0°
Fatigue Test Data on V-Notched and
Semicircular Specimens
Before being tested, all specimens have been polished in order to both eliminate surface scratches or machining marks and to make the observation of the fatigue crack path easier.
Fatigue tests have been carried out on a MTS 809 servo-hydraulic biaxial machine with a 100 kN axial load cell and a torsion load cell of 1100 Nm. All tests have been performed under load control, with a frequency ranging from 1 and 10 Hz, as a function of the geometry and load level.
At the end of the fatigue tests, the notch root and the fracture surfaces were examined using optical and electronic microscopy. Some examples of fracture surfaces are visible in Fig. 2a and 2b for in phase and out of phase multiaxial loading.
The results of statistical analyses carried out by assuming a log-normal distribution are summarized in Table from Fig. 3. In particular, it is summarized the mean values of the nominal stress amplitudes at different number of cycles, the inverse slope k of the Wöhler curves and the scatter index T, which quantifies the width of the scatterband included between 10 and 90% probability of survival curves. All failures from 104 to 5×10⁶ have been processed in the statistical analysis whereas the run-outs were excluded.
Figure 4 depicts fatigue data from V-notched specimens tested under tension, torsion and combined tension and torsion with different load phases. In this case the biaxiality ratio is equal to 1. It is visible from the figure that the out of phase loading causes a detrimental effect on the fatigue life of the V-notched specimens. This effect is not observed in the case of semicircular notches where the most damaging case is the in-phase loading. By changing the biaxiality ratio from 1 to 0.6 on V notched specimens tests, the effect of out of phase is again present. Summarizing this aspect it seems that the phase displacement could increase or viceversa decrease the fatigue life of the component as a function of the notch geometry.
A Synthesis in Terms of Linear Elastic SED
Averaged Over a Control Volume
The averaged Strain Energy Density criterion (SED) states that brittle failure occurs when the mean value of the strain energy density over a given control volume is equal to a critical value Wc.
This critical value varies from material to material but does not depend on the notch geometry and sharpness. In the particular case of 40CrMoV13.9 steel the radius of the control volume (Rc) has been found to be equal to 0.05 mm.
Dealing with V-shaped notches the control volume is defined as is visible in Fig. 5a, the volume assumes a crescent shape and it is centred at a distance equal to r0 from the notch tip. The distance r0 depends on the radius of the notch ρ and on the notch opening angle 2α:
2 2q
π απ−
= (1)
0
1qr
qρ
−= (2)

Filippo Berto et al. / American Journal of Engineering and Applied Sciences 2016, 9 (4): 1269.1291 DOI: 10.3844/ajeassp.2016.1269.1291
1274
(a) (b)
Fig. 2. Fracture surfaces of in phase (a) and out of phase multiaxial loading (b)
Fig. 3. Results from fatigue tests. Mean values, Ps = 50%. Stresses referred to the net area
Fig. 4. Data from multiaxial tests from V-notched specimens

Filippo Berto et al. / American Journal of Engineering and Applied Sciences 2016, 9 (4): 1269.1291 DOI: 10.3844/ajeassp.2016.1269.1291
1275
(a) (b)
Fig. 5. Critical volume for V-shaped notches (a) and semicircular notches (b)
Fig. 6. Synthesis by means of local SED of multiaxial series data
For semicircular notches under mode I and III loadings, the volume assumes the crescent shape shown in Fig. 5b, where Rc is the depth measured along the notch bisector line. The outer radius of the crescent shape is equal to Rc+ρ/2, being ρ/2 the distance between the notch tip and the origin of the local coordinate system.
The value of the SED averaged over the control volume carefully defined as presented above, has been calculated numerically by using the FE code ANSYS 12.0 both for V-notched and semicircular notched specimens. Figure 6 shows the synthesis based on local SED. By comparing Fig. 6 with Fig. 4 it is evident that a single narrow scatterband has been obtained by means of the local energy.
Result and Discussion
Description of the Fatigue of a Metal Part
When a monotonic stress (see Tensile test) is applied to a ductile metallic quasi-smooth (with a quasi-uniform stress field), the test piece begins to deform irreversibly by
plastic deformation from a value of Constraint called "yield stress" and denoted Re. As the test piece continues to elongate, this plastic deformation generates damage and then breakage, the stress causing the damage being called "tensile strength" and denoted Rm; Rm is greater than Re.
When designing a part, it is generally dimensioned so that the stress never exceeds Re, which would indicate irreversible deformation of the part and thus disrupt the operation of the system, so a fortiori for the constraint never to exceed Rm.
However, in the case of a cyclic loading, a rupture occurs after several cycles (sometimes several million cycles), for stress values less than Re.
Some materials have a limit of endurance, less than Re: If the stress is less than this limit of endurance, one never observes "rupture" (at least not within a reasonable time, typically more than one hundred million cycles). Some materials have no limit of endurance and the rupture always occurs after a more or less long number of cycles even for low stress values; this is particularly the case for aluminum alloys.

Filippo Berto et al. / American Journal of Engineering and Applied Sciences 2016, 9 (4): 1269.1291 DOI: 10.3844/ajeassp.2016.1269.1291
1276
When designing a room, one must examine its various modes of degradation: • Static rupture or rupture in less than one cycle (in
the ascending phase of the charge, i.e., in the first quarter of the cycle in the case of a sinusoidal cycle)
• Permanent deformation (plastic deformation) if it can impede further operation
• And if the structure undergoes repeated constraints:
• Failure in oligocyclic fatigue, for loads leading to ruin in less than 50 000 cycles
• Conventional fatigue beyond 50,000 cycles
These different modes of ruin correspond to loadings of decreasing amplitudes.
Fatigue damage occurs primarily in areas with the highest alternating stresses, i.e., in zones with stress concentrations (holes, notches, etc.).
If one observes the surface broken under the microscope, one has a typical facies: One sees streaks globally parallel, corresponding to the propagation of the crack at each stress, then a zone of tearing, corresponding to the final rupture.
The lifetime at crack initiation often has a long duration compared to propagation time. In the case of a smooth specimen, the propagation lifetime is low. On the other hand, for a structure, the propagation part can be significant. There are therefore two phases:
The phase of initiation during which the material is damaged in a non-detectable way (N.B.: An Anglicism commonly used is "initiation", the use of this term is incorrect in French); the lifetime is often defined at the detectable crack initiation of the structure, with an appropriate choice of the minimum properties of the material.
The crack propagation phase during which inspections can be performed before breaking, but this is the domain of the mechanics of rupture (Fig. 7).
Fig. 7. Photomicrograph of the progression of cracks in a material due to fatigue

Filippo Berto et al. / American Journal of Engineering and Applied Sciences 2016, 9 (4): 1269.1291 DOI: 10.3844/ajeassp.2016.1269.1291
1277
Fig. 8. Fatigue (crank of bike crank): we can distinguish the lines of progression of cracks in the bottom right (dark zone), and the
zone of removal (clear zone)
Fig. 9. Fatigue test under purely alternating stress Fatigue Failure of a Smooth Traction-Compression
Test Piece
The case of the smooth traction-compression test piece is an elementary case. The breaks in real situations are more complex, but this study allows the understanding of the basic concepts and the implementation of the concepts. Figure 8 Fatigue (crank of bike crank): we can distinguish the lines of progression of cracks in the bottom right (dark zone), and the zone of removal (clear zone).
Uniaxial Fatigue Test, Purely Alternating
The simple traction test consists of stretching a specimen in a progressive and uninterrupted manner (Fig. 9). This test gives (among other things) two fundamental values for the study of the resistance of materials: • The tensile strength, or breaking strength, Rm • For ductile materials, the yield strength Re
To study fatigue, the specimen is subjected to a cyclically varying stress, sinusoidal. The basic test is a test with a "purely alternating" stress, called "test at R = -1" (see below): The stress undergone has the form 3:
( )( ) sin 2at ftσ σ π= × (3)
where, σa is the amplitude of stress; not to be confused with the extent of constraint ∆σ (expression 4):
2 aσ σ∆ = ⋅ (4)
And f is the frequency. One therefore fixes the amplitude of stress σa and one
looks at after how many cycles N produces the rupture. This number of cycles is normally independent of frequency; however:
A high frequency can cause the specimen to overheat, especially for stainless steels and polymers and therefore early rupture on the one hand, the endurance limit therefore decreases with frequency.
On the other hand, in the presence of corrosion, a slow frequency allows the chemical reactions to take place, the limit of endurance therefore increases with the frequency.
It is generally limited to 30 Hz for a steel and 3 Hz for a polymer.
The test piece breaks at random. For a given material, it is therefore necessary to carry out several tests for an

Filippo Berto et al. / American Journal of Engineering and Applied Sciences 2016, 9 (4): 1269.1291 DOI: 10.3844/ajeassp.2016.1269.1291
1278
alternating stress level σa given: At least 3, ideally about 20. In practice, 3 to 9 test pieces are used.
The main limitation of this test is duration and cost. For this reason, we often have a limited number of specimens and the tests are stopped after ten million cycles (107) even if the test piece is not broken (censorship): At 30 Hz, a test lasts 3.3·105s, i.e., three days and twenty hours. For polymers, the frequency being lower, it is generally limited to one million cycles (106).
For a metal, the number of cycles at break N is a random variable that follows a normal distribution.
For a polymer, it follows a Weibull law. Tests are performed at various stress amplitude
levels σa. It is thus possible to determine the average number of
cycles at break as a function of σa, ( )a
N σ . These points are placed on a log-linear diagram
(logarithmic scale in base 10 for N, linear scale for σa) and forms the Wöhler curve, or S-N curve (stress vs. number of cycles; Fig. 10).
This test qualifies the material. If a part made of this material is in a state of uniaxial
stress and suffers from purely alternating fatigue, this curve makes it possible to predict the life of the part or to dimension the part so that it has a lifetime Given.
Facies and Rupture Mechanism
On an ideal test, the rupture facies of the test specimen presents two zones: A silky-looking zone and a zone of rough appearance. The two zones are in a plane perpendicular to the stressing axis. The rupture has three stages:
• First stage: Germination of cracks; Externally, nothing is seen, but the material gradually changes locally; Cracks are created which lie in a maximum plane of shear, at 45° from the axis of the test piece
• Second stage: Crack propagation; At least one crack reaches a critical size and begins to propagate; the propagation takes place in a plane perpendicular to the load (mode of opening I)
• The crack progresses at each cycle, so if we look at the fracture facies under the Scanning Electron Microscope (SEM), we see streaks of fatigue; if the solicitation changes (stop and restart of the machine, change of regime), a more marked line, visible to the naked eye, called stop line occurs
• Third stage: Sudden breaks; the crack has reduced the strength section of the part, the stress exceeds the tensile strength
• There is therefore a final breaking zone having cups if the material is ductile, or cleavage planes or grain boundaries if the fracture is fragile
Modeling of the Wöhler Curve
If the amplitude of stress is close to the tensile strength Rm, the test piece breaks after a few cycles. One can speak of a break called "quasi-static". The static rupture is a rupture in 1/4 cycle (during the first rise).
If the amplitude of stress is of the order of magnitude of the yield stress Re, there is breaking after a small number of cycles. It is the left part of the curve of Wöhler, we speak of oligo-cyclic fatigue.
Fig. 10. Wöhler curve for aluminum alloy

Filippo Berto et al. / American Journal of Engineering and Applied Sciences 2016, 9 (4): 1269.1291 DOI: 10.3844/ajeassp.2016.1269.1291
1279
Then comes the domain of the rupture with large number of cycles, for N ≥ 50 000 (5·104). The Wölher curve has a decreasing portion and then a horizontal asymptote. The limit value of σa is called the "endurance limit" and is denoted σD.
One often use an analytical model N = ƒ(σa) to describe the curve-note that the Wöhler curve is in σa = ƒ(N). Using a model reduces the number of tests needed to determine the curve and allows you to use a formula rather than reading on a graph. This is particularly interesting in the case of a computer-based calculation.
Let us take as an illustration the simplest model, the model of Basquin, which describes the central part of the curve (fatigue with large number of cycles, see relations 5):
( ) ( ) ( ); log log logm
a aN C N C mσ σ⋅ = = − ⋅ (5)
where, C and m are regression-determined parameters; 1/m is of the order of 0.1. Note that the Wöhler curve uses a semi-logarithmic scale, whereas Basquin's law gives a straight line in a log-log scale.
The Limit of Endurance and Beyond
We have seen that, for economic reasons, the tests are interrupted after a given number of cycles (generally 106 or 107). The method of censored tests does not make it possible to determine the limit of endurance. On the other hand, while some materials seem to show a non-zero horizontal asymptote (especially steels), we have the impression that the Wöhler curve tends towards 0 for others (especially aluminum alloys). Clearly, some materials have zero limit of endurance, have no endurance limit and for a given stress amplitude even small, it is enough to wait "sufficiently long" so that the piece breaks by fatigue.
The conventional limit is defined as the highest stress for which there is no break after a given number of cycles, 106 or 107. To determine this, use is made of truncated test methods. One can say that the amplitude of stress σa is varied between two tests.
The endurance limit σD is defined for a given stress ratio R (see below) and for a conventional cycle number (typically 106 or 107).
For steel, there exists an empirical formula giving σD as a function of Rm. In first intention, one can use: • For steels, σD = Rm/2 • For aluminum alloys, σD = Rm/3
We do not know how the material behaves at more than 106 or 107 cycles, but is the question relevant? Indeed, most parts undergo at best a few solicitations per minute, even per hour or per day. Ten million cycles represent ten years or a thousand years. If, on the other
hand, the frequency of solicitation is of the order of one second, 107 cycles represent a few months, it is legitimate to be interested in a larger number of cycles, for example one hundred million (108).
Beyond the number of conventional cycles chosen (typically 106 or 107 or even 108), it is considered that the system has an "infinite" lifetime, that is to say that it will experience a failure by another mechanism Fatigue (wear, corrosion, accident).
Other Sinusoidal Stresses
The actual solicitation has no reason to be purely alternate. Tests are therefore carried out with a sinusoidal stress, but with a non-zero mean. We then define: • Σmin and σmax the extreme values that the constraint
takes • Σm is the mean value, σm = (σmin + σmax)/2
The stress ratio R = σmin/σmax. For a purely alternating stress, we have σm=0 and σmin
= -σmax, so R = -1. From a vocabulary point of view, we talk about: Undulating compressive stresses when σmax<0; Then
R>1. Constraints of compression when σmax = 0; Then R =
+∞. Constraint when σmin<0 and σmax>0; One has
alternately traction and compression and therefore R <0. Repeated tensile stresses when σmin = 0; Then R = 0. Tensile stresses of traction when σmin > 0; Then 0
<R <1. Note that corrugated compressive stress tests are
rarely performed because the probability of failure is low. Moreover, it is difficult to control the level σ=0 of the test machine, the tests of repeated tensile stresses generally take place with a slightly positive σmin, typically R = 0.1 to 0.5. A value R = 1 corresponds to a simple tensile test (σmin = σmax = σm).
Tests are therefore carried out for a given value of R and at various amplitude levels σa.
The stress ratio R must always be shown on a Wöhler curve.
One can thus determine an endurance limit for each constraint ratio, σD(R).
Asymptotic Behavior of Visco-Elastic and Plastic
Materials
The viscoelastic and viscoplastic materials have a limit of elasticity. If, during the solicitation cycle, one never exceeds this limit, one speaks of elastic behavior.
If the elastic limit is exceeded, one can have several asymptotic behaviors, also called stabilized responses: • Adaptation (shakedown): The hardening makes that
one returns quickly in the elastic domain

Filippo Berto et al. / American Journal of Engineering and Applied Sciences 2016, 9 (4): 1269.1291 DOI: 10.3844/ajeassp.2016.1269.1291
1280
• Accommodation: We have a hysteresis cycle by Bauschinger effect
• Ratchet cycling: The deformation increases with each cycle, this is the field of oligocyclic fatigue
Haigh and Goodman Diagrams
The determination of the endurance limit for a given value of R requires numerous tests and therefore an investment of time and money. However, there are many data available for certain classes of materials, which make it possible to determine a law:
ƒ( )D RΣ =
From the values of Rm and σD (R = -1). This
relationship is more often expressed in the form:
( )ƒD mσΣ =
Since:
( ) ( )1 / 1m D R RσΣ = ⋅ + −
The simplest form is Goodman's linear law:
( ) ( ) ( )1 1 /D D m mR R Rσ σΣ = = − ⋅ −
This curve (Fig. 11). Or on a diagram (σm, σa), this is the Haigh diagram; Or on a diagram (σm, σmin or σmax), this is the
Goodman diagram (Fig. 10). Thus, if one is in a given case (σm = a; σa = b), The point (a; b) is placed in the Haigh diagram; If
this point is in the validation zone (under the curve σD = ƒ(σm), then we consider that the design is validated, that the part will resist;
Or, on the Goodman diagram, the segment [(a; a - b); (A; a + b)] - segment centered on the point (a; a) -; If the segment is inside the validation zone (between the curves σmin = ƒ(σm) and σmax = ƒ(σm), then we consider that the design is validated, that the part will resist.
If the point is outside the safety zone, it is in the "danger zone", the limited life zone (Nrupture <107); the design is not validated.
The Haigh and Goodman diagrams thus allow to extrapolate the results obtained in pure alternating traction-compression (R = -1) to all cases (all values of R).
Case of other Simple Solicitations
There are other simple stresses for which fatigue tests can be performed: Alternating flat flexion, flexion-rotation a rotating shaft undergoes static flexion, the longitudinal fibers undergo each turn of the traction and compression, alternating twist.
Fig. 11. Placement of a particular case on a Haigh or Goodman
diagram
By accumulating the tests on a class of material, it is possible to determine coefficients which make it possible to calculate the endurance limit for a given stress from the endurance limit of a reference case. For example, for steel, taking as reference the uniaxial tension-compression: • Torsion: 0.67× σD • Traction-compression: 1× σD • Rotating bending: 1.11× σD • Flexion plane: 1.17× σD
This is understandable from a qualitative point of view. The torsional strength is about half the tensile
strength (1/√3 = 0.577 times according to the Tresca criterion), but the fibers close to the neutral fiber have few constraints, so if a defect finds, it does not provoke a crack, which makes "rise" the coefficient.
In the case of rotary bending, the outer fibers undergo tension-compression, but the fibers close to the neutral fiber have few constraints, so if a defect is found there is no cracking. "Raise" the coefficient.
Flexion plane: In the case of rotary bending, all the fibers located outside are stressed; In the case of planar flexion, the fibers situated outside but close to the neutral sheet are not stressed, so the faults found therein do not cause a crack, which makes the coefficient "rise".
Filippo Berto et al. / American Journal of Engineering and Applied Sciences 2016, 9 (4): 1269.1291 DOI: 10.3844/ajeassp.2016.1269.1291
1281
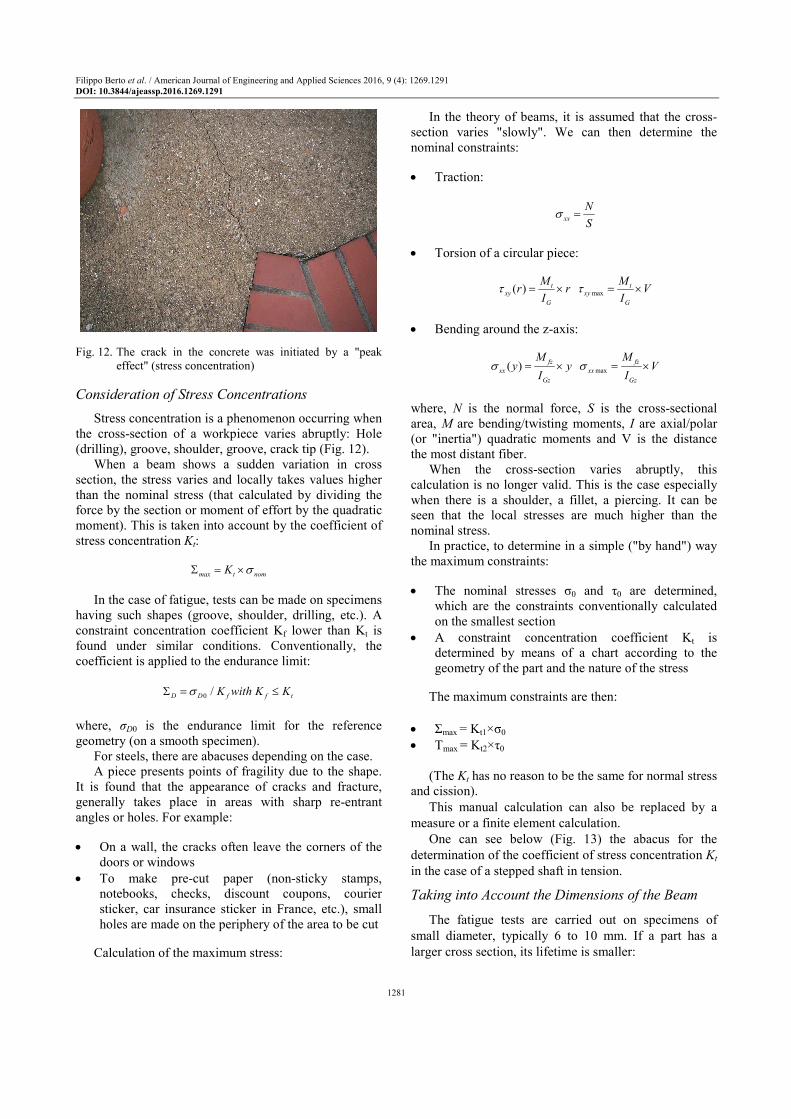
Fig. 12. The crack in the concrete was initiated by a "peak
effect" (stress concentration) Consideration of Stress Concentrations
Stress concentration is a phenomenon occurring when the cross-section of a workpiece varies abruptly: Hole (drilling), groove, shoulder, groove, crack tip (Fig. 12).
When a beam shows a sudden variation in cross section, the stress varies and locally takes values higher than the nominal stress (that calculated by dividing the force by the section or moment of effort by the quadratic moment). This is taken into account by the coefficient of stress concentration Kt:
max t nomK σΣ = ×
In the case of fatigue, tests can be made on specimens
having such shapes (groove, shoulder, drilling, etc.). A constraint concentration coefficient Kf lower than Kt is found under similar conditions. Conventionally, the coefficient is applied to the endurance limit:
0 / D D f f tK with K KσΣ = ≤
where, σD0 is the endurance limit for the reference geometry (on a smooth specimen).
For steels, there are abacuses depending on the case. A piece presents points of fragility due to the shape.
It is found that the appearance of cracks and fracture, generally takes place in areas with sharp re-entrant angles or holes. For example: • On a wall, the cracks often leave the corners of the
doors or windows • To make pre-cut paper (non-sticky stamps,
notebooks, checks, discount coupons, courier sticker, car insurance sticker in France, etc.), small holes are made on the periphery of the area to be cut
Calculation of the maximum stress:
In the theory of beams, it is assumed that the cross-section varies "slowly". We can then determine the nominal constraints: • Traction:
xx
N
Sσ =
• Torsion of a circular piece:
max( ) t txy xy
G G
M Mr r V
I Iτ τ= × = ×
• Bending around the z-axis:
max( ) fz fz
xx xx
Gz Gz
M My y V
I Iσ σ= × = ×
where, N is the normal force, S is the cross-sectional area, M are bending/twisting moments, I are axial/polar (or "inertia") quadratic moments and V is the distance the most distant fiber.
When the cross-section varies abruptly, this calculation is no longer valid. This is the case especially when there is a shoulder, a fillet, a piercing. It can be seen that the local stresses are much higher than the nominal stress.
In practice, to determine in a simple ("by hand") way the maximum constraints: • The nominal stresses σ0 and τ0 are determined,
which are the constraints conventionally calculated on the smallest section
• A constraint concentration coefficient Kt is determined by means of a chart according to the geometry of the part and the nature of the stress
The maximum constraints are then:
• Σmax = Kt1×σ0 • Τmax = Kt2×τ0
(The Kt has no reason to be the same for normal stress and cission).
This manual calculation can also be replaced by a measure or a finite element calculation.
One can see below (Fig. 13) the abacus for the determination of the coefficient of stress concentration Kt in the case of a stepped shaft in tension.
Taking into Account the Dimensions of the Beam
The fatigue tests are carried out on specimens of small diameter, typically 6 to 10 mm. If a part has a larger cross section, its lifetime is smaller:

Filippo Berto et al. / American Journal of Engineering and Applied Sciences 2016, 9 (4): 1269.1291 DOI: 10.3844/ajeassp.2016.1269.1291
1282
• On the one hand, the probability of having a defect is greater
• On the other hand, in the case of torsion or flexion, the circumference subjected to a given stress level is greater, so there is a greater risk of a defect
This is taken into account by a scale factor Ke,
provided by an abacus:
0 D e DK σΣ = ×
The Ke factor is a decreasing function of the diameter.
Consideration of Surface Condition
Initiation of cracking occurs at the surface and surface defects create stress concentrations. We define a surface condition factor Ks, which depends on the total roughness Rt - and not on the average roughness Ra:
0D s DK σΣ = ×
The Ks factor is less than 1, since the test specimens are machined with care. It is given by a chart as a function of Rt and of the tensile strength Rm.
Simplified Calculation Method
The above considerations make it possible to validate in a simple manner the use of a part subjected to fatigue under the following conditions: • The part undergoes a state of uniaxial stress; Typically,
it is a beam subjected to simple stresses: Tensile compression, plane flexion, rotational bending, torsion
• The part undergoes forces which can be described by a sinusoidal function, the mean stress σm and the stress amplitude σa of which are known
• The part is made of a material whose limit of endurance is known under the conditions of stress (type of stress, σm and σa given); or
• The part is made of steel and its tensile strength Rm is known
Fig. 13. Abacus for the determination of the coefficient of stress concentration Kt in the case of a stepped shaft in tension

Filippo Berto et al. / American Journal of Engineering and Applied Sciences 2016, 9 (4): 1269.1291 DOI: 10.3844/ajeassp.2016.1269.1291
1283
The simplified methodology (Brand, 1999, p. 321-341) it was put in place by Brand and col. in 1999 and consist in: • Plot the Haigh diagram for the reference geometry
(∅ 6 mm smooth test piece) • Determining the stress concentration factors Kf, Ks
roughness and Ke scale • Determining the nominal stresses σmn and σan • Determine the corrected constraints:
f
mc f mn ac an
e s
KK
K Kσ σ σ σ= × = ×
• Place the point (σmc; σac) on the Haigh diagram
We note here that we apply the coefficients Ki on the stresses σm and σa and not on the limit σD, which avoids having to trace the Haigh diagram. It is also noted that only the stress concentration factor affects the mean stress σm.
This method allows to validate a design the point must be in the safety zone and to determine a safety coefficient from the distance to the curve. However, it does not make it possible to determine an expected lifetime.
Estimation of fatigue
Estimating the fatigue life of a structure is a complex problem.
The first problem is the characterization of the material. This is done by means of tests which must be easy to perform in order to be reproducible. This makes it possible to establish "fatigue curves".
The second problem is the characterization of the stress; this is the specification of the study. Note that the materials tests use a single, sinusoidal loading and in one direction only; now, taking the example of aeronautics, a succession of take-offs and landings is anything but a uniaxial sinusoidal law.
The third problem is the characterization of the structure. This is very different from a test specimen ... Knowing the external loading (the stress above), it is necessary to be able to indicate the state of stress within the structure (stress field). The resistance of the materials (structural calculation) is generally used. In the simplest cases, calculations can be done by hand, but a computer-based calculation is usually required. The finite element method (FEM) is the most widely used method, but there are also analytical methods for the simplest cases, the Integral Border Equation (IBE) method. Experimental methods such as photo elasticimetry and strain gauges are also used.
But the state of the structure also involves the manufacturing process. In particular, the arrangement of crystals (for metals) or chains (for polymers) creates anisotropies (different behavior depending on
the direction of stress). Furthermore, the manufacturing process can generate residual stresses. Thus, a piece of foundry, forge or machined in the mass have a radically different behavior. The initial stress field can be determined by the simulation of the manufacturing process, it can be verified by an X-ray diffraction measurement.
Finally, a criterion for the validation of the structure must be established. Fatigue failure is a statistical phenomenon with great dispersion. In the simplest cases, we can only say that the maximum equivalent stress in the structure must not exceed a limit value determined from the fatigue curve of the material. But this criterion is not always precise enough.
It is essential to verify the calculations by testing. Of course, tests can be made on complete systems, but this is often complicated and time-consuming. It is more appropriate to carry out tests on sub-assemblies or even on isolated parts: This allows accelerated testing. The acceleration can consist of cycles faster than the actual stress, but also to increase the effort. We can also replace a complex solicitation by a simpler solicitation, but creating an equivalent damage, we speak then of fatigue equivalence.
Fatigue Curves
Tests on smooth specimens with a periodic loading characterized by its average stress and its alternating stress make it possible to define the number of rupture cycles of the material (Fig. 14).
The rupture in 1/4 cycle is the result of the tensile test, it is obtained when the maximum stress (average stress plus alternating stress) reaches the limit of rupture in tension. It is possible to represent in the form of Wöhler curves the relation between its alternating stress amplitude Sa and N the number of rupture cycles for each value of R, the charge ratio (Fig. 14).
If necessary, the tests are repeated for different temperatures.
The load ratio R is the ratio between minimum stress (mean stress less alternating stress) and maximum stress (mean stress plus alternating stress).
The endurance limit SaD(R) is the alternating stress value below which there is no fatigue.
Secondary factors affect the number of rupture cycles N: The surface state, the loading frequency, the size of the specimen. To study the lifetime of a structure, Wöhler curves can be used for loads leading to long lifetimes (> 50,000 cycles). To do this, it is necessary to transform the variable local tensor into its mean and alternating uniaxial equivalent at the most constrained places. For more intense loadings, fatigue tests leading to a ratchet effect (cumulative permanent deformation at each cycle), they are substituted for tests in imposed strain.

Filippo Berto et al. / American Journal of Engineering and Applied Sciences 2016, 9 (4): 1269.1291 DOI: 10.3844/ajeassp.2016.1269.1291
1284
Fig. 14. Wöhler fatigue curve (Wöhlerlinie in German), representing in logarithmic scales the stress at break as a function of the
number of loading cycles
The stabilized stress cycle obtained, characterized by its average stress and its alternating stress) makes it possible to extend the Wöhler curves in the oligocyclic domain. In the case of a structure or a notched specimen, the variable local tensor must be transformed at the most heavily loaded points into its mean and alternating uniaxial equivalent. It is also assumed that if there is plastification, it is only local: There exists a cycle of constraint which stabilizes and which will be characterized by its mean tensor and its alternating tensor (Aversa et al., 2016a; 2016b; 2016c; 2016d; 2016e).
The mean tensor can thus be affected by a state of initial stress (residual stresses) and by plasticity in the event of local overrun of the elastic limit.
The relevant invariant of the alternating tensor is the second invariant of its deviator, that is, its von Mises constraint. The relevant invariant of the mean tensor is its trace: Indeed, torsion tests on axisymmetric specimens demonstrate, in the absence of plasticity, that fatigue in torsion is not affected by the average torsion. While hydrostatic pressure does not affect plasticity, it reduces fatigue life when it is positive. It is the variation in load that produces fatigue, fatigue damage is weighted by the average hydrostatic pressure (equal to one third of the trace of the average tensor).
Consistent with the above assumptions, it is necessary to obtain a periodic loading.
If the maximum stress level in the von Mises direction is small (less than 60% of the elastic limit), a force loaded load is applied.
If the maximum stress level in the direction of von Mises is greater, tests are carried out in imposed strain in order to obtain a stable stress-strain cycle during periodic loading.
At the stabilized average and alternate cycles characterized by the invariants defined above, the number of rupture cycles of the fatigue test performed is associated.
The fatigue criteria consist in combining the two invariants to relate the scalar thus defined to the number of rupture cycles.
The fatigue curves link the number of break cycles to an alternating stress amplitude for different load ratios (minimum stress to maximum stress ratio).
From a fatigue criterion, it is possible to connect an effective alternating stress to the number of break cycles, whatever the load ratio: A unified curve is obtained.
Since fatigue tests are generally carried out on smooth specimens, the definition of invariants is obvious.
For any load, decompositions more or less justified (algorithm of counting type rainflow) make it possible to obtain equivalent cyclic loadings.
It is generally accepted that the period and the exact shape of the oscillations have no effect on the number of permissible cycles.
On the other hand, the fatigue strength can be modified by numerous factors (surface condition, random causes, type of load, temperature, stress concentration, etc.), which can lead to complementary studies.
Taking into Account the Statistical Aspect of the
Fatigue Test Results is Imperative
In the oligocyclic domain, we generally define the lifetimes with the mean value minus three standard deviations (m-3σ), which corresponds to a probability of 1/741 or with the definition B0.1 which corresponds to probability 1/1000. For manufacturing processes controlled as they are in the aviation industry, a factor of

Filippo Berto et al. / American Journal of Engineering and Applied Sciences 2016, 9 (4): 1269.1291 DOI: 10.3844/ajeassp.2016.1269.1291
1285
2.5 exists between the average value and the minimum value defined by m-3σ.
In conventional fatigue, the dispersion is greater than that of oligocyclic fatigue.
The minimum SAD endurance limit is about half of the mean endurance limit.
The secondary factors (surface condition, residual stresses) are stronger when the lifetime increases.
Fatigue of Structural Details
The analysis of the structure requires that states of constraint be examined at every point. It is generally during the variations of geometry (notches, holes etc.) that one obtains the limiting states in fatigue. Life expectancy therefore requires attention to the study of structural details.
The most elaborate lifetime prediction method uses only the fatigue results obtained on smooth specimens, imposed stress or imposed strain as explained above.
To analyze a structure, it is assumed that the cyclic local stress state of the structure, resulting from initial constraint state, stress redistribution in the case of plastification due to loading and loading, gives the same duration to Crack initiation than that of a smooth specimen subjected to the same stress cycle. It is often assumed that the crack propagation life of the specimen is negligible.
The calculation of the structures makes it possible to access each cycle characterized by an average stress and an alternating stress computed in elastic regime or, if necessary, the redistribution of stress due to plasticity, which will change the mean stress.
The corresponding SN curves are generally described by the following equation, for each value of the charge ratio R, in which a and k are characteristic values of the material with given mean stress and temperature, obtained from the tests on smooth specimens, above, in constraint or imposed strain:
( )( )
( )
k R
a
a aD
N b R S
S S R
−= ×
>
Where: SaD = Endurance limit R = The charge ratio = minimum stress/maximum stress R = Given by the elastic calculation and the initial
constraint state for a number of cycles greater than 50,000 cycles
Calculated after plastification if the number of cycles
is less than 50,000 cycles. In the uniaxial case, the R ratio of charge to the
bottom of the notch tends towards -1 for a number of cycles of approximately 1000 cycles: It is the relaxation of the mean stress; thus the Whöler curves obtained with
the notched specimens for different values of the ratio R' (load ratio of the external forces) all converge at low number of cycles (in oligocyclic fatigue) to that corresponding to R' = -Alternate fatigue test. In the case of deformation tests imposed on smooth specimens with a low number of cycles, there is also relaxation of the mean stress, R also tends to -1; These tests are considered representative of damage to structural details in oligocyclic fatigue. In conventional fatigue, the tests in imposed force are suitable because there is no variation of R during the test.
It is convenient to give it a slightly different form by defining conventional damage in the sense of Miner created by n cycles as:
( ))( )
k R
a
n nD S
N b R= = ×
The Smith-Watson-Topper criterion, SWT, for example,
considers the effective stress for the fatigue cycle:
maxeff aEσ ε σ= × ×
Where: E = Young's modulus; εa = alternating deformation; σmax = maximum stress = average stress + alternating
stress
There is thus obtained a unified formulation of the number of cycles to break, whatever R ratio of charge:
2 2;
1 1
k
a a aDN b S S SR R
−
= × × > × − −
In steel or titanium, the limit of endurance SaD is non-
zero, amplitude of cycle below which there is no more fatigue: The structure supports an infinite number of cycles.
Rule of Miner
In the general case of analysis of a fatigue structure, the loading can consist of cycles of amplitudes very varied. The load is decomposed into partial cycles according to a rainflow counting algorithm. Its principle consists in making pairings between decreasing maxima and minima.
Each partial cycle is associated with damage. There are different definitions of damage or damage, it may have a physical or conventional meaning. Conventional damage in the sense of Miner is defined by the ratio between the number of cycles performed for a periodic loading to the number of cycles which will cause the rupture under the same load.
The rule of Miner, or Palmgren-Miner, posits that the corresponding damages are additive, we speak of cumulative linear. Breakage therefore occurs when the sum of the damage related to each amplitude reaches unity.

Filippo Berto et al. / American Journal of Engineering and Applied Sciences 2016, 9 (4): 1269.1291 DOI: 10.3844/ajeassp.2016.1269.1291
1286
In practice, the principle of calculation consists in dividing the cycles into categories in which the amplitudes and periods are similar and for which a frequency of appearance has been estimated.
The duration of operation being given, multiplying it by this frequency one obtains the probable duration of the category.
By dividing this duration by the average of the corresponding periods, a number of cycles are obtained which makes it possible to calculate partial damage. All you have to do is add the partial damage and verify that the sum is less than unity.
The rule of Miner supposes that there is no influence of the timing of application of the charges, that is to say no effect of order.
Fatigue testing cycles of large amplitude followed by small amplitude up to rupture and the opposite small amplitude followed by large amplitude show that the cumulative is not linear because it is non-commutative.
However, in many cases, different amplitude cycles are mixed, linear cumulation is most commonly used, in combination with the rainflow algorithm for cyclic decomposition.
This algorithm, by changing the timing of load application, violates non-commutativity.
Law of Propagation of a Crack
A singularity can exist in the material, it can have two origins: • An initial manufacturing defect • Initiation of a detectable crack due to fatigue
It is characterized by its dimension a and its form. This crack will propagate, so a will increase if the
loading is variable up to critical dimension ac. The law of Paris is the simplest law governing its
propagation. Let: • N the number of cycles • ∆K the variation of the stress intensity factor over a
cycle • C and m of the material-dependent coefficients
( )mdaC K
dN= ∆
Its critical dimension ac is related to the characteristic
of the KIC material, the toughness, it causes fragile fracture of the structure:
IC cK F aσ π= × × ×
where, σ is an effective stress in a direction normal to the crack and F is a form factor.
Notched Test Specimens
The simplest example of structure is that of a notched specimen. Its lifetime forecast shows that precautions must be taken. A nominal stress is the stress computed in the minimum section under the beam hypothesis for a component of the external torsor. It is therefore possible to define the nominal stresses in tension, flexion, torsion etc. By definition, a notch coefficient Kt of the test piece is the ratio between the maximum main stress in the minimum section and the nominal stress in the same Section for the same component of the external torsor.
This definition is therefore not suitable for the fatigue life expectancy.
It is therefore necessary to recalculate the test piece in order to determine the biaxial stress state at the bottom of the notch on each component of the torsor. With the set of biaxial states corresponding to the components of the torsor, we can determine the Von Mises stress and the tensor trace for the alternating and average values for any periodically variable external torsor. It is thus possible to define the effective stress on a loading cycle.
Fatigue-Corrosion
The phenomenon of fatigue can be aggravated by corrosion: A material resistant very well to fatigue and very well to corrosion in a given medium, can break catastrophically under the combined effect of fatigue and corrosion.
Very similar to stress corrosion, the phenomenon of fatigue-corrosion appears under the combined action of the environment and a cyclical stress. It is manifested by a lowering of the resistance of the material to fatigue.
Most often and considering the relatively slow dissolution and repassivation kinetics compared to mechanical phenomena, this type of damage occurs for parts subjected to low-frequency stress (oligocyclic fatigue), for example during heating-cooling cycles of structures.
Mechanisms evoked to account for fatigue corrosion are the same as those presented for stress corrosion and laboratory tests are generally fatigue tests in the presence of the medium under consideration either with a constant strain amplitude or Constant stress amplitude.
Corrosion refers to alteration of a material by chemical reaction with an oxidant (mostly dioxygen and H+ cation). The purely mechanical effects must be excluded (this does not apply, for example, to breakage under the effect of air, but corrosion may be combined with mechanical effects and give stress corrosion and fatigue- Corrosion and it is involved in certain forms of surface wear, the causes of which are both physicochemical and mechanical.

Filippo Berto et al. / American Journal of Engineering and Applied Sciences 2016, 9 (4): 1269.1291 DOI: 10.3844/ajeassp.2016.1269.1291
1287
The best known examples are the chemical alterations of metals in air or water, such as the rusting of iron and steel or the formation of verdigris on copper and its alloys (bronze, brass). However, corrosion is a much wider field that affects all kinds of materials (metals, ceramics, polymers) in variable environments (aqueous medium, atmosphere, high temperatures).
The fundamental study of corrosion phenomena is essentially electrochemical. The applied study of the phenomena of corrosion is an area of the science of materials, which comprises both notions of chemistry and physics (physico-chemistry).
Corrosion is an important industrial problem: The cost of corrosion, covering all means of combating corrosion,
replacement of corroded parts or structures and the direct and indirect consequences of corrosion accidents, is estimated at 2% of the gross world product. Every second, some 5 tons of steel are transformed into iron oxides.
Below (Fig. 15) one can see the rust - the most familiar example of corrosion.
Antifoulings (Fig. 16), only temporarily limit the corrosion of boat hulls.
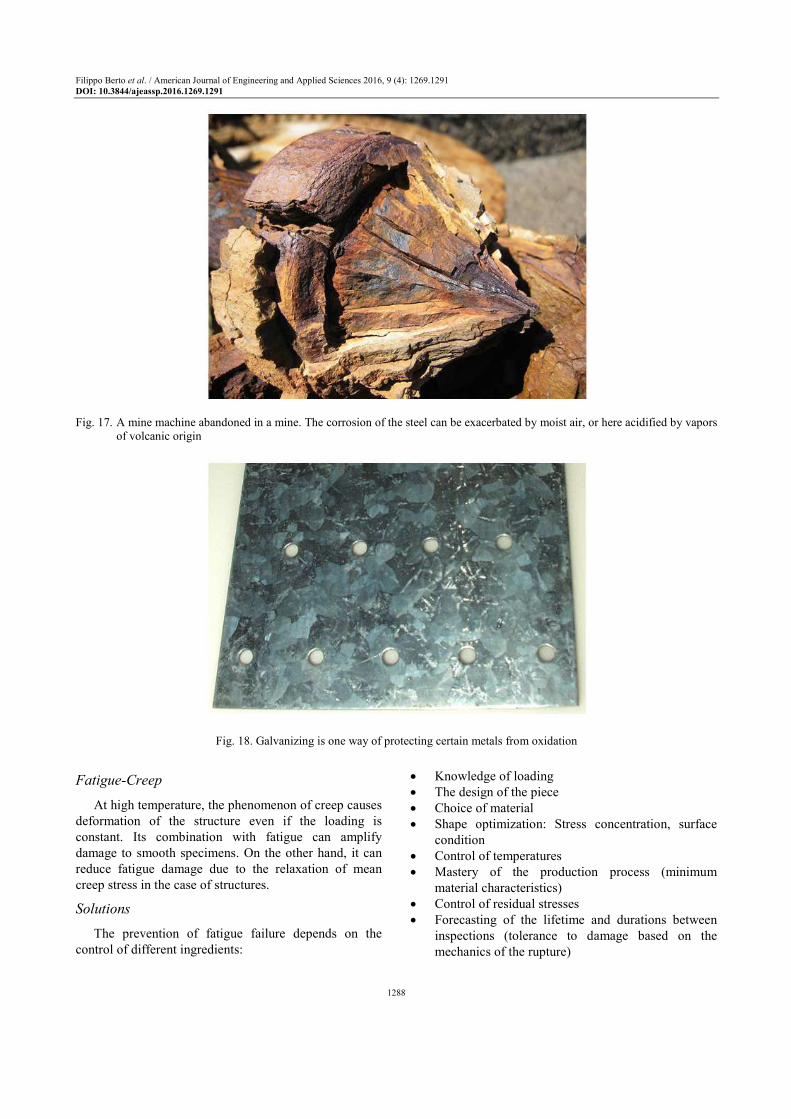
A mine machine abandoned in a mine. The corrosion of the steel can be exacerbated by moist air, or here acidified by vapors of volcanic origin (Fig. 17).
Galvanizing is one way of protecting certain metals from oxidation (Fig. 18).
Fig. 15. Rust-The most familiar example of corrosion
Fig. 16. Antifoulings only temporarily limit the corrosion of boat hulls
Filippo Berto et al. / American Journal of Engineering and Applied Sciences 2016, 9 (4): 1269.1291 DOI: 10.3844/ajeassp.2016.1269.1291
1288
Fig. 17. A mine machine abandoned in a mine. The corrosion of the steel can be exacerbated by moist air, or here acidified by vapors
of volcanic origin
Fig. 18. Galvanizing is one way of protecting certain metals from oxidation
Fatigue-Creep
At high temperature, the phenomenon of creep causes deformation of the structure even if the loading is constant. Its combination with fatigue can amplify damage to smooth specimens. On the other hand, it can reduce fatigue damage due to the relaxation of mean creep stress in the case of structures.
Solutions
The prevention of fatigue failure depends on the control of different ingredients:
• Knowledge of loading • The design of the piece • Choice of material • Shape optimization: Stress concentration, surface
condition • Control of temperatures • Mastery of the production process (minimum
material characteristics) • Control of residual stresses • Forecasting of the lifetime and durations between
inspections (tolerance to damage based on the mechanics of the rupture)

Filippo Berto et al. / American Journal of Engineering and Applied Sciences 2016, 9 (4): 1269.1291 DOI: 10.3844/ajeassp.2016.1269.1291
1289
• Control of its use: Periodic inspections, validation of initial assumptions (temperatures, loading)
Utilization and Applications:
• Aviation: Aircraft are subject to cyclic takeoff-climb-descent-landing constraints. This is aggravated by specific conditions of use, such as for water bombers (Petrescu et al., 2016a; 2016b; 2016c; 2016d).
• At sea, wave fatigue can lead to disasters, particularly on oil installations
• Bone fracture by fatigue in athletes (Aversa et al., 2016a; 2016b; 2016c; 2016d; 2016e)
• Breakage of a load lifting hook • The Miner Damage Additive Law is used in the
design of road pavements to define the aggressiveness of an axle as the damage created by this axle. For a given traffic, the spectrum of the different axles of heavy goods vehicles is taken into account in order to obtain the predicted average aggressiveness
Conclusion
A large bulk of results from multiaxial tests on V-notched and semicircular notched specimens made of 40CrMoV13.9 steel are discussed together with those obtained under pure tension and pure torsion loading from notched specimens with the same geometry. Altogether more than 120 new fatigue data (10 fatigue curves) are summarized in the present work.
Estimating the fatigue life of a structure is a complex problem.
Secondary factors affect the number of rupture cycles N: The surface state, the loading frequency, the size of the specimen. To study the lifetime of a structure, Wöhler curves can be used for loads leading to long lifetimes (> 50,000 cycles). To do this, it is necessary to transform the variable local tensor into its mean and alternating uniaxial equivalent at the most constrained places. For more intense loadings, fatigue tests leading to a ratchet effect (cumulative permanent deformation at each cycle), they are substituted for tests in imposed strain. The stabilized stress cycle obtained, characterized by its average stress and its alternating stress) makes it possible to extend the Wöhler curves in the oligocyclic domain. In the case of a structure or a notched specimen, the variable local tensor must be transformed at the most heavily loaded points into its mean and alternating uniaxial equivalent. It is also assumed that if there is plastification, it is only local: There exists a cycle of constraint which stabilizes and which will be characterized by its mean tensor and its alternating tensor; The mean tensor can thus be affected by a state
of initial stress (residual stresses) and by plasticity in the event of local overrun of the elastic limit.
The first problem is the characterization of the material. This is done by means of tests which must be easy to perform in order to be reproducible. This makes it possible to establish "fatigue curves".
The second problem is the characterization of the stress; this is the specification of the study. Note that the materials tests use a single, sinusoidal loading and in one direction only; now, taking the example of aeronautics, a succession of take-offs and landings is anything but an uniaxial sinusoidal law.
The third problem is the characterization of the structure. This is very different from a test specimen. Knowing the external loading (the stress above), it is necessary to be able to indicate the state of stress within the structure (stress field). The resistance of the materials (structural calculation) is generally used. In the simplest cases, calculations can be done by hand, but a computer-based calculation is usually required. The Finite Element Method (FEM) is the most widely used method, but there are also analytical methods for the simplest cases, the Integral Border Equation (IBE) method. Experimental methods such as photo elasticimetry and strain gauges are also used.
But the state of the structure also involves the manufacturing process. In particular, the arrangement of crystals (for metals) or chains (for polymers) creates anisotropies (different behavior depending on the direction of stress). Furthermore, the manufacturing process can generate residual stresses. Thus, a piece of foundry, forge or machined in the mass have a radically different behavior. The initial stress field can be determined by the simulation of the manufacturing process, it can be verified by an X-ray diffraction measurement.
Finally, a criterion for the validation of the structure must be established. Fatigue failure is a statistical phenomenon with great dispersion. In the simplest cases, we can only say that the maximum equivalent stress in the structure must not exceed a limit value determined from the fatigue curve of the material. But this criterion is not always precise enough.
It is essential to verify the calculations by testing. Of course, tests can be made on complete systems, but this is often complicated and time-consuming. It is more appropriate to carry out tests on sub-assemblies or even on isolated parts: this allows accelerated testing. The acceleration can consist of cycles faster than the actual stress, but also to increase the effort. We can also replace a complex solicitation by a simpler solicitation, but creating an equivalent damage, we speak then of fatigue equivalence.
All fatigue data are present first in terms of nominal stress amplitudes and then reanalyzed in terms of the

Filippo Berto et al. / American Journal of Engineering and Applied Sciences 2016, 9 (4): 1269.1291 DOI: 10.3844/ajeassp.2016.1269.1291
1290
mean value of the strain energy density evaluated over a finite size semicircular sector surrounding the tip of the notch. The synthesis permits to obtain a very narrow band characterized by a scatter index equal to 1.96. The synthesis has been carried out with a constant radius independent on the loading conditions.
Acknowledgement
The Authors acknowledge Liquid Metals Technologies Inc, Ca USA that kindly supply the samples for the characterization.
Author’s Contributions
All the Authors equally contributed to the experimental part and to the paper preparation.
Ethics
This article is original. Author declares that are not ethical issues that may arise after the publication of this manuscript.
References
Atzori, B., F. Berto, P. Lazzarin and M. Quaresimin, 2006. Multi-axial fatigue behaviour of a severely notched carbon steel. Int. J. Fatigue, 28: 485-493. DOI: 10.1016/j.ijfatigue.2005.05.010
Aversa, R., F.I.T. Petrescu, R.V.V. Petrescu and A. Apicella, 2016a. Biomimetic finite element analysis bone modeling for customized hybrid biological prostheses development. Am. J. Applied Sci., 13: 1060-1067. DOI: 10.3844/ajassp.2016.1060.1067
Aversa, R., R.V.V. Petrescu, F.I.T. Petrescu and A. Apicella, 2016b. Smart-factory: Optimization and process control of composite centrifuged pipes. Am. J. Applied Sci., 13: 1330-1341.
DOI: 10.3844/ajassp.2016.1330.1341 Aversa, R., F. Tamburrino, R.V.V. Petrescu, F.I.T.
Petrescu and M. Artur et al., 2016c. Biomechanically inspired shape memory effect machines driven by muscle like Acting NiTi alloys. Am. J. Applied Sci., 13: 1264.1271.
DOI: 10.3844/ajassp.2016.1264.1271 Aversa, R., F.I.T. Petrescu, R.V.V. Petrescu and A.
Apicella, 2016d. Biofidel FEA modeling of customized hybrid biological hip joint design Part II: Flexible stem trabecular prostheses. Am. J. Biochem. Biotechnol.
Aversa, R., F.I.T. Petrescu, R.V.V. Petrescu and A. Apicella, 2016e. Biofidel FEA modeling of customized hybrid biological hip joint prostheses, Part I: Biomechanical behavior of implanted femur. Am. J. Biochem. Biotechnol.
Berto, F., P. Lazzarin and J. Yates, 2011. Multiaxial fatigue of V-notched steel specimens: a non-conventional application of the local energy method. Fatigue Fract. Eng. M, 34: 921-943.
DOI: 10.1111/j.1460-2695.2011.01585.x Berto, F. and P. Lazzarin, 2011. Fatigue strength of
structural components under multi-axial loading in terms of local energy density averaged on a control volume. Int. J. Fatigue, 33: 1055-1065.
DOI: 10.1016/j.ijfatigue.2010.11.019
Brand, A., 1999. Données Technologiques sur la Fatigue. Senlis, 4th Édn., CETIM, pp: 384.
Carpinteri, A., A. Spagnoli and S. Vantadori, 2009. Multiaxial fatigue life estimation in welded joints using the critical plane approach. Int. J. Fatigue, 31: 188-196. DOI: 10.1016/j.ijfatigue.2008.03.024
Christopher, C.J., M.N. James, E.A. Patterson and K.F. Tee, 2007. Towards a new model of crack tip stress fields. Int. J. Fracture, 148: 361-371.
DOI: 10.1007/s10704-008-9209-3 Fatigue (material), From Wikipedia, the free
encyclopedia. Ye, D., O. Hertel and M. Vormwald, 2008. A unified
expression of elastic-plastic notch stress-strain calculation in bodies subjected to multiaxial cyclic loading. Int. J. Solids Struct., 45: 6177-6189.
DOI: 10.1016/j.ijsolstr.2008.07.012 Lagoda, T., E. Macha and W. Bedkowski, 1999. A
critical plane approach based on energy concepts: Application to biaxial random tension-compression high-cycle fatigue regime. Int. J. Fatigue, 21: 431-443. DOI: 10.1016/S0142-1123(99)00003-1
Lin, B., M.E. Mear and K. Ravi-Chandar, 2010. Criterion for initiation of cracks under mixed-mode I + III loading. Int. J. Fracture, 165: 175-188.
DOI: 10.1007/s10704-010-9476-7 Nieslony, A. and C. M. Sonsino, 2008. Comparison of
some selected multiaxial fatigue assessment criteria. LBF Report No. FB-234.
Petrescu, F.I.T. and J.K. Calautit, 2016a. About the light dimensions. Am. J. Applied Sci., 13: 321-325.
DOI: 10.3844/ajassp.2016.321.325 Petrescu, F.I.T. and J.K. Calautit, 2016b. About nano
fusion and dynamic fusion. Am. J. Applied Sci., 13: 261-266. DOI: 10.3844/ajassp.2016.261.266
Petrescu, F.I.T., A. Apicella, R. Aversa, R.V.V. Petrescu and J.K. Calautit et al., 2016a. Something about the mechanical moment of inertia. Am. J. Applied Sci. DOI: 10.3844/ajassp.2016.1085.1090
Petrescu, F.I.T., A. Apicella, R.V.V. Petrescu, S. Kozaitis and R. Bucinell et al., 2016b. Environmental protection through nuclear energy. Am. J. Applied Sci., 13: 941-946.
DOI: 10.3844/ajassp.2016.941.946
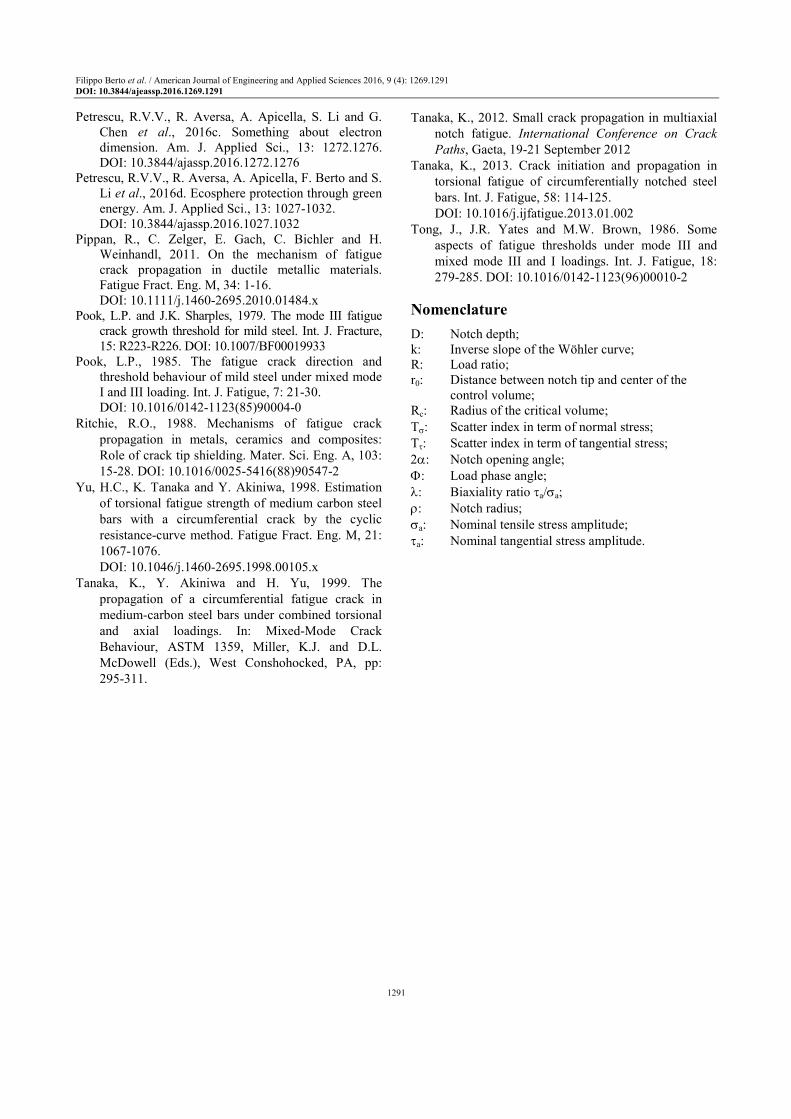
Filippo Berto et al. / American Journal of Engineering and Applied Sciences 2016, 9 (4): 1269.1291 DOI: 10.3844/ajeassp.2016.1269.1291
1291
Petrescu, R.V.V., R. Aversa, A. Apicella, S. Li and G. Chen et al., 2016c. Something about electron dimension. Am. J. Applied Sci., 13: 1272.1276. DOI: 10.3844/ajassp.2016.1272.1276
Petrescu, R.V.V., R. Aversa, A. Apicella, F. Berto and S. Li et al., 2016d. Ecosphere protection through green energy. Am. J. Applied Sci., 13: 1027-1032.
DOI: 10.3844/ajassp.2016.1027.1032 Pippan, R., C. Zelger, E. Gach, C. Bichler and H.
Weinhandl, 2011. On the mechanism of fatigue crack propagation in ductile metallic materials. Fatigue Fract. Eng. M, 34: 1-16.
DOI: 10.1111/j.1460-2695.2010.01484.x Pook, L.P. and J.K. Sharples, 1979. The mode III fatigue
crack growth threshold for mild steel. Int. J. Fracture, 15: R223-R226. DOI: 10.1007/BF00019933
Pook, L.P., 1985. The fatigue crack direction and threshold behaviour of mild steel under mixed mode I and III loading. Int. J. Fatigue, 7: 21-30.
DOI: 10.1016/0142-1123(85)90004-0 Ritchie, R.O., 1988. Mechanisms of fatigue crack
propagation in metals, ceramics and composites: Role of crack tip shielding. Mater. Sci. Eng. A, 103: 15-28. DOI: 10.1016/0025-5416(88)90547-2
Yu, H.C., K. Tanaka and Y. Akiniwa, 1998. Estimation of torsional fatigue strength of medium carbon steel bars with a circumferential crack by the cyclic resistance-curve method. Fatigue Fract. Eng. M, 21: 1067-1076.
DOI: 10.1046/j.1460-2695.1998.00105.x Tanaka, K., Y. Akiniwa and H. Yu, 1999. The
propagation of a circumferential fatigue crack in medium-carbon steel bars under combined torsional and axial loadings. In: Mixed-Mode Crack Behaviour, ASTM 1359, Miller, K.J. and D.L. McDowell (Eds.), West Conshohocked, PA, pp: 295-311.
Tanaka, K., 2012. Small crack propagation in multiaxial notch fatigue. International Conference on Crack
Paths, Gaeta, 19-21 September 2012 Tanaka, K., 2013. Crack initiation and propagation in
torsional fatigue of circumferentially notched steel bars. Int. J. Fatigue, 58: 114-125.
DOI: 10.1016/j.ijfatigue.2013.01.002 Tong, J., J.R. Yates and M.W. Brown, 1986. Some
aspects of fatigue thresholds under mode III and mixed mode III and I loadings. Int. J. Fatigue, 18: 279-285. DOI: 10.1016/0142-1123(96)00010-2
Nomenclature
D: Notch depth; k: Inverse slope of the Wöhler curve; R: Load ratio; r0: Distance between notch tip and center of the
control volume; Rc: Radius of the critical volume; Tσ: Scatter index in term of normal stress; Tτ: Scatter index in term of tangential stress; 2α: Notch opening angle; Φ: Load phase angle; λ: Biaxiality ratio τa/σa; ρ: Notch radius; σa: Nominal tensile stress amplitude; τa: Nominal tangential stress amplitude.