standard & poor’s research insightjvileta/documents/researchinsight_primer.pdf · standard...
TRANSCRIPT

Standard & Poor’s
Research Insight
COMPUSTAT (North America)
A Primer for Getting Started
This document is designed to help users become familiar with the Standard & Poor’s Research Insight software and the COMPUSTAT (North America) database. Consider the information contained herein to be a starting point. Current subscribers may copy this document for internal use only. More complete documentation may be found both within the software and in the manual set (Getting Started, Beyond Basics, Report and Chart Library, and Data Guide) supplied with your subscription. Additional manuals may be ordered by contacting Standard & Poor’s Institutional Market Services Customer Support at 800-523-4534. All information and data provided through university subscriptions is restricted to academic use only.
8/00
1
Table of Contents Topic Page Overview 2 Population and Pre-defined Sets
Research Insight Help Features 3 Help Menu (including software demo) Look Up Tool
Understanding Time Periods 5 Current Period Setting the cutoffs (very important for faculty & research!)
Time Period References 6 Absolute, Relative and Calendar time referencing Specifying in Reports, Screens and Formulas
Functions Overview 8 Multiple Regression Calculating Statistics Across Sets
Formulas Overview 9 Formula Examples (examples of logic and syntax)
Screening Overview 11 Defining Criteria Viewing Results and Saving Sets
Importing Company Sets 12 Report Overview (Generating Data) 13 Pre-Defined Reports Exporting/Saving Accessing in Microsoft Excel® Sector & Industry Reports Creating Reports / Report Assistant Panel Reports for SAS (important for faculty & research!) Charts Sample Applications - Putting it all together 22 Event Studies, S&P Indexes, Backtesting, ZSCORE and DUPONT models Standard & Poor’s Institutional Market Services Corporate Headquarters 7400 South Alton Court Englewood, CO 80112
U.S. & Canadian Clients: 800-525-8640 Fax: 303-721-4677 International Clients:+44 181543-2555 Copyright© 2000 The McGraw-Hill Companies, Inc.

8/00
2
Overview Welcome to Standard & Poor’s Research Insight! Standard & Poor’s Institutional Market Services, a division of The McGraw-Hill Companies, produces a variety of software and database products for institutional, financial, corporate and academic clients. Research Insight is a powerful yet easy-to-use graphical interface to the renowned Standard & Poor’s COMPUSTAT database(s). The sophisticated software provides faculty, staff and students an efficient means of conducting research via data queries, retrieval, manipulation and analysis. Additionally, graduates will find that money managers, investment banks, consulting and accounting firms, government agencies and corporations use Standard & Poor’s Institutional Market Services data and software commercially in general. Experience with Research Insight could help secure internships or employment for many students and graduates. The COMPUSTAT (North America) database contains fundamental financial, statistical, and market data for U.S. and Canadian corporations, banks, S&L’s, ADR’s/ADS’s, business segments, geographic areas, industry composites and indexes. Extensive coverage of annual and quarterly Income Statement, Balance Sheet, Cash Flow and supplemental data items is provided on publicly held companies. Academic subscriptions to Research Insight databases are updated on a quarterly basis as of 2000. COMPUSTAT (North America) data is derived from publicly traded companies and closed-end funds trading on the NYSE, AMEX, NASDAQ, OTC and Canadian stock exchanges, and wholly-owned subsidiaries of companies that are required to file with the SEC. Throughout this document look for the symbol “ ◊◊ ◊◊ ”, which is used to identify tips or information of particular interest to users. Research Insight may be used for advanced quantitative analysis, including database queries, or for quick access to company/industry financial statements and data. To easily generate data using pre-defined reports, please refer to page 13 of this primer. •• Population and Pre-defined Sets Research Insight has many different predefined sets for different types of data, referred to as dollar sign ( $ ) sets. The COMPUSTAT (North America) contains unique predefined $ sets. The available $ sets are listed below: COMPUSTAT (North America) Database $ Set Description What it contains... $C CS Active Active U.S. company data $R CS Research Inactive U.S. company data $T Canadian Active Canadian company data displayed in Canadian currency $I CS Indexes - Active and Research Market data for active and inactive indexes $CS CS Business Segment Business Segment data for active U.S. comp anies $CG CS Geographic Segment Geographic Segment data for active U.S. companies $CI CS Active Issue Issue data for active U.S. companies $RI CS Research Issue Issue data for inactive U.S. companies $TI Canadian Issue Issue data for active Canadian companies $II CS Index Issue Index data for stock issues $SP_100 S&P 100 Index All companies in the S&P 100 Index $SP_500 S&P 500 Index All companies in the S&P 500 Index $SP_Ind S&P Industrials Index All companies in the S&P Industrials Index $SP_Mid S&P MidCap 400 Index All companies in the S&P MidCap 400 Index $SP_Small S&P SmallCap 600 Index All companies in the S&P SmallCap 600 Index $SP_Super S&P 1500 Super Composite Index All companies in the S&P Super Composite Index,
comprised of the S&P 500, MidCap 400, and SmallCap 600 Indexes. $ADR ADR/ADS Companies Non-U.S. Companies trading American Depository Receipts/Shares
8/00
3
Research Insight Help Features Take a minute to get acquainted with the Research Insight Help Menu (available via the HELP/Research Insight Help Topics menu option), learn how Help is organized, and discover some tips and short cuts to make your tasks easier. • The Research Insight Help Menu
Research Insight Help Topics Includes the Table of Contents, an Index, and Find (lets you search for a topic).
Data Definitions Displays item and concept definitions for the selected database ◊◊ ◊◊ Note that you can “bookmark” frequently used data definitions as well as help topics and functions.
Reference Tables
For COMPUSTAT (North America) topics include: Data Item Lists; Economic and Industry Sectors; Geographic Codes; Function Calculations; Indexes; SIC Codes; Restated Data Policy
FAQ’s
A list of the most Frequently Asked Questions about Research Insight, including specific examples on screening, reporting, formulas and other applications...very helpful !
Each of the help sub-topics listed above include the following features, or “tabs”: Contents Tab Works like a table of contents, displaying a list of available topics in on-line Help. Index Tab Lets you search the index for a topic. Find Tab Lets you perform a full-text search for a word or phrase...extremely useful!
Software Demo
A basic demonstration of the Research and Report Assistant features of Research Insight. More detailed instructions regarding these features are provided later in this document in the “Screening Overview” and “Report Overview” sections.
Other Compustat Products
Provides you with a complete list of Standard & Poor’s Institutional Market Services products
Welcome to Research Insight Opens the Welcome Window, which links you to the main functions of Research Insight, including the innovative and user-friendly “Wizards”. The Research Assistant wizard allows you to search (screen) the COMPUSTAT databases for companies that meet specific criteria. The Report and Chart Assistant wizards allow you to create custom reports and charts.
About Research Insight
Displays version and copyright information for Research Insight Research Insight also allows you to Bookmark and Annotate help topics and definitions. These features can be very helpful and are accessed, respectively, by the menu options Bookmark/Define... or Edit/Annotate.... Additional help is available in Research Insight via the Look Up Tool, detailed further in the section that follows.

8/00
4
•• Look Up
The Look Up Tool is accessed via the menu option Tools/Look Up ..., via the toolbar button , or via a Look Up button within various dialogue boxes. The Look Up Tool provides users with the ability, when needed, to “look up” various items used in Research Insight. Select one of the tabs in the Look Up Tool to view lists of Companies, Items and Concepts, Functions, or Sets. The number of tabs displayed will vary, depending on where you are in the software. For example, in Step 1 of the Research Assistant, the Look Up Tool only displays the Company tab since the program is expecting a company identifier in the input box. To search for a company within the Look Up Tool: Use prefix search by typing the beginning characters of the name you want to find in the Select Companies (or Select Items) field You can enter a text string in the Find Text field and Research Insight will display the first name it finds that contains the string anywhere within the name of a company, item or concept, function, or set. Click the Find Next button to find additional occurrences of that text string. Be sure to specify which “Company Category” you are accessing (i.e. $C CS Active, $R CS Research, etc.). For example, suppose you want to add American Biomed Inc., to your screening criteria in the Research Assistant: 1. Beginning in the Look Up Tool, type American Bio in the Select Companies text box.
American Biomed Inc is highlighted in the list box, and its ticker symbol (3ABMI) appears below the list box. 2. Click the Paste button.
The Look Up Tool pastes the ticker symbol into the Companies text box in the Assistant window. 3. Click Close to return to the Assistant window.
◊◊ ◊◊ Note that you can “bookmark” frequently used data definitions as well as help topics and functions.

8/00
5
Understanding Time Periods
• About the current period . . . The current period changes each time data is updated for a new year, quarter, month, or day. Since companies have different fiscal years and reporting time frames, the current period differs among companies. If you do not reference a time period in your applications, you could evaluate formulas for a set of companies with different time periods, especially if you are using both Active and Research companies. To avoid this, include an “absolute” time period reference in the formula or specify the time period when you run a report or screen (see examples given on pages 6 and 17). • Current Period Command - Options Menu
◊◊ ◊◊ Use this command to define the current period cutoff for annual, quarterly, monthly, weekly, and daily data. Since a company's current period depends on the last reported data of a company, you can direct Research Insight how far back in time data is considered current. This can be very important when screening the database, especially when accessing the research population! If you consider current annual data to be within the last five fiscal years, then enter the number 5 in the Annual box. The example below shows how all cutoffs have been changed to the maximums for a typical academic subscription. Enter values to define current period settings for annual, quarterly, monthly, weekly, and daily time periods. The default values for these cutoffs are 3, 6, 6, 3 and 5 respectively.
◊◊ ◊◊ It is important to set these to the maximums as shown above in order to be sure the software screens all available periods. An example of how this can affect the results of screening for companies or data can be seen in the “Bankruptcy Event” application given later in this document. Leaving the cutoff for the Annual time period at the default of “3” results in the first line of the Bankruptcy Event screen returning only about half of the total companies which should pass the screen, instead of the over 700 companies which should result by setting to the *maximum of 20 as shown above. The reason for the apparent discrepancy is that the “additional” companies, most if not all of which are “research’ companies, have current periods beyond the three-year default setting. That is to say the only data available for these companies exists three or more years prior to the database default period (1999 as of this writing). A company that quit filing reports with the SEC in 1987 would have its most current data (i.e. current period) twelve years before the default period of 1999. The program would look for the existence of data in 1999, 1998 and 1997 and not look any further unless specifically told to via the settings above. For more specific information, refer to the following data items/mnemonics; Mnemonic Data Item Format CPD Current Period This item is presented as YY (for example, "Y90") CPDQ Current Period – Quarterly This item is presented as QQ/YY (for example, "Q4Y90") CPDM Current Period – Monthly This item is presented as MMM/YY (for example, "Aug 88") CPDW Current Period Weekly This item is presented as 26W90 CPDD Current Period – Daily This item is presented as 29 Jun 90 *maximum assumes you are not accessing “Back Data” beyond the twenty-year window, available as an add-on subscription

8/00
6
Time Period References Time period references direct Research Insight to retrieve a data value for a particular point in time other than the current period. If you do not include time period references in your formulas, Research Insight automatically uses the current period (or the most recently available data). There are three ways to specify the time periods: absolute, relative, and calendar, each of which are discussed below. The issue of Current Period Cutoffs on page 5 pertains primarily to “relative” time referencing. For example, if you are screening for SALE[Y90] > 100 the issue of cutoff is irrelevant since you are looking at an absolute date/time period of 1990. This is also true if you are using relative time referencing but actually running the screen for an absolute time period. Fiscal years (defined as an accounting period of twelve months) ending in January through May are assigned to the calendar year in which that fiscal year begins. Fiscal years ending June through December are assigned to the calendar year in which the fiscal year ends. The calendar year for each company is the year in which the fiscal year ends. For example, if pulling the year-end data from 1991 to 1995 and one of the comparable company’s fiscal year ends in February, the data from February 1992 to February 1996 will be pulled for comparison . This is done to ensure the closest alignment of operating periods (see below). In this case, the company having the February fiscal year-end would overlap ten months of operating cycle with a December fiscal company for any given year. Also, balance sheet data is only two months off versus what would be ten months if based solely on calendar years.
March 1991 February 1992
January 1991 December 1991
• Absolute time period references Absolute references direct Research Insight to an exact fiscal year, quarter, month, etc. If you use an absolute time period reference in a formula, then Research Insight will always evaluate the fiscal time period specified. Below are some examples of absolute time period references:
SALE[Y94] SALEQ[Q2Y94] PRCCM[AUG94] • Relative time period references Relative references direct Research Insight to evaluate formulas relative to the current time period. The current time period is 0, so the current time period reference is an implied [0]. Therefore, one period prior to the current period is indicated with [-1], two periods prior to the current period is indicated [-2], and so on. Below are some examples of relative time period references:
SALE[-1] SALEQ[-3] PRCCM[-4M] • Calendar time period references Calendar references direct Research Insight to an exact calendar year, quarter, month, week, or day. The calendar time period is always the exact year in which the time period ends. ◊◊ ◊◊ For example, suppose a company's fiscal year-end is May 1997. The calendar time period for annual data is 1997, but the fiscal time period for the same company is different. If you evaluate monthly time periods for annual data ending May 1997, you'll see that seven of the 12 months are from the year 1996. Therefore, the fiscal time period for annual data is 1996. Below are some examples of calendar time period references:
Calendar Year SALE[C97] Calendar Quarter SALEQ[IV97] Calendar Month PRCCM[JUN97] Calendar Week AJEXW[26W97] Calendar Day CSHTRD[28MAY97]

8/00
7
•• Knowing when to use absolute, relative, or calendar time periods ◊◊ ◊◊ Use relative time referencing to create more flexible formulas in your reports, screens, and spreadsheets. For example, suppose you create a monthly report that includes stock performance formulas for the past 12 months using relative referencing. When you evaluate the report, you can specify any beginning month. This gives you the flexibility to display the report for any time period without having to create another report. Use absolute or calendar referencing to always evaluate a formula for the same time period.
◊◊ ◊◊ Time periods and periodicity are important in the alignment of data between companies, especially when exporting/saving data in columnar/table report formats. Gaining an understanding of these concepts helps to ensure efficient use of the Research Insight software and COMPUSTAT database(s). • Specifying time periods when you run a report or screen You may specify the time period for which you want your report evaluated, assuming that the report contains “relative” time references, by choosing the Select Period tab in the Run Assistant. For screening, in the Research Assistant you must choose the Classic View option in order to specify the time periods for which data is to be screened. If you do not invoke the Research Assistant for your screening, but choose the File and Classic View menu options you may “right-click” your mouse for the ability to “Run for Time Period” You can specify more than one time period, depending on the type of data in your report or screen. For example, suppose you are evaluating monthly closing price and quarterly common equity. These two data types have different periodicities, monthly and quarterly. You can select a monthly and quarterly time period for the report or screen. •• Specifying time periods in formulas ◊◊ ◊◊ Time period references will always be contained within brackets “[ ]”, or will default to the “current” time period if no reference is specified. Always use brackets to specify time references and to enclose period functions when you are building free-form reports or when you are working in the Classic View window, as the following examples indicate: SALE[Y96] Returns fiscal 1996 - Sales - Net (SALE + SALE[-1]) / 2 Returns the average of current and prior years’ Sales - Net PRCCM[@MNT(-1Q)] Returns the Monthly Close Price for the last month of the prior fiscal quarter NOTE: If a formula is already referenced with an absolute time period (e.g., (SALE[Y94])), then that formula will always return data for the time period specified within brackets, even if you select a different time period when you run a report or screen. For additional information/examples see Getting Started, Chapter 8 - Understanding Periodicities See also in online help: @YR - Identify fiscal period year
@QTR - Identify fiscal period quarter @MNT - Identify period month @WK - Identify period week @DAY - Identify period day

8/00
8
Functions Overview Functions are predefined calculation tools used to perform numerous tasks, from simply averaging data for an industry, to more sophisticated analyses using fractiles. Use functions in your screening, reporting, spreadsheet, and concept formulas individually, or combine them for more complex analysis. Research Insight provides you with more than 100 functions for historical, statistical, logical, growth and other analyses that allow you to easily and automatically perform data calculations and get complex results fast. • How to construct a function Every function begins with @, followed by a short name, such as CAVG. Additionally, each function requires instructions for what you want evaluated. We refer to these instructions as arguments and they are always enclosed in parenthesis following the function name (i.e. @CAVG(NI,Y94,Y98) calculates average annual net income from 1994 to 1998). ◊◊ ◊◊ Research Insight categorizes functions by the particular type of analysis you want to perform. A complete list of functions in each category, along with syntax and descriptions for each, are available by selecting the Functions tab in the Look Up tool. • Multiple Regression Functions These functions allow you to predict the value of a dependent variable (such as a company’s share price) based on its correlation over time with a number of independent variables (for example, Consumer Price Index, Housing Starts, and Price to Book). With the multiple regression functions, you can evaluate and compare the effects of up to 8 independent variables in a time series.
@MRALPHA Returns the intercept of the y-axis in the multiple regression equation @MRBETA Returns the slope of the line for the specified variable @MRTSTAT Indicates a statistically significant variable @MRFSTAT Determines whether the observed relationship between the dependent/independent variables occurs by chance @MRCORR Calculates the correlation coefficient between 3 or more items @MRSTDERR Calculates the standard error of the desired variable
• Set Analysis Functions - Calculating Statistics Across Sets While Research Insight set analysis functions calculate statistics across sets of companies quickly and easily, you may want those statistics to be based on a company’s sector or SIC. Let’s say you want to compare companies in your current portfolio, but also want to compare them across industry sectors and against benchmarks such as the S&P 500. Research Insight makes it easy! ◊◊ ◊◊ All set analysis functions accept an optional parameter that you can use to base your calculations on and to enhance your analysis. For example, if you want to create a report that compares the Return on Equity (ROE) for companies and then compare them to the S&P 500 and each company’s respective industry sector, you would use the following expressions in your report: MNEMONIC/EXPRESSION RETURNS ROE Company ROE @CAVG(ROE,$SP_500) Average ROE for S&P 500 companies @CAVG(ROE,$SP_500, SECTOR) Average ROE for S&P 500 companies in same sector as target company. The last expression calculates an average ROE using the S&P 500, but to base the average on each company’s sector. All of the set functions in Research Insight accept this new parameter. Research Insight uses this parameter to find other companies that have the same value. And, you can use any data item for this type of analysis. The options are virtually limitless!
• Trimming outlying data points
The functions @TRIMPCT and @TRIMSTD, designed to work with all Research Insight set functions, give you the ability to narrow the scope of your search resulting in data that may be more meaningful to your financial analysis. The following expression instructs Research Insight to calculate an average ROE for the S&P 500, but to also trim off 1% of the high and low values: @CAVG(ROE,@SET($SP_500,@TRIMPCT(ROE,1)))

8/00
9
Related Topics in Research Insight: Set Analysis functions - Evaluate data across a set of companies or industries

8/00
10
Formulas Overview Although the majority of your analysis can be performed through the Research Assistant, there may be times when you are building a custom report or chart or working in Research Insight’s Classic window when you will want to incorporate formulas and functions. A formula is a mathematical or logical combination of one or more items, concepts, functions, and operators that you can build to extract information from the database or perform a calculation. You can use formulas in Research Insight to create screen criteria, define data in your report or spreadsheet, add date labels to your report or spreadsheet, or create your own “concepts”. For a list of pre-defined concepts in Research Insight, see the COMPUSTAT (North America) Data Guide, Appendix - A, or use the Look Up Tool for Items under the category Concepts. Formulas often incorporate both time references and functions as previously described. ◊◊ ◊◊ Formulas may be saved as concepts and given a user-defined name or mnemonic. Concepts are saved to a “user database”, either locally or on your network. For more information regarding user databases please refer to chapters 10 and 11 in Beyond Basics. • Formula Examples This topic provides you with actual formulas you can create in Research Insight. These are just a sample of formulas that show various combinations of items, functions, parentheses, relational operators, company references, and time period references. ◊◊ ◊◊ You may also copy/cut formulas directly from examples given in data definitions or help files within Research Insight and paste them into your own formula, screen or report.
*Note that after copying some formulas you may need to delete spaces from within, or trailing, the formula. The spaces exist because the formulas are designed for readability, and will produce a “syntax error” when pasted to the formula cell.
• Formulas for Screens
*Note: The “$” symbol by itself represents a wildcard placeholder for a company set in the following examples. The formula will use the “base set” in screening or the set being run in a “table” report. This convention for specifying a set is restricted to screening and “table” reports only, not “Freeform” reports.
TIC=TICI Finds the primary issue for multiple issue companies. The base set=$CI. @AND(SPMIX<=60,TIC=TICI) *Note: Be sure to time reference SPMIX and use $CI+$RI if looking for historical data Finds all issues in the SP500. The base set=$CI. @CSIZE(@SET(@CHGCO(ISSUE),TSCI=0)) Screens for active issues. • Formulas for Reports SALE[0Y-(@PCOUNT(SALE,-9,0))+1] Looks back 10 years and uses sales reported at that time. If the company didn’t exist 10 years ago, use sales for the first year on file. @RANK(ITEM*-1,$) Reverses the order of @RANK. @PSUM(DVPSXM,@MNT(0Y,12)+1,@MNT(0M)) Calculates year-to-date dividends on a calendar year basis.

8/00
11
@PSUM(SALEQ,Q1Y93,Q4Y93)*(4/(@PCOUNT(SALEQ,Q1Y93,Q4Y93)*1)) Annualizes quarterly income statement data when all four quarters have not yet reported. @IF(@PCOUNT(CSHTRD,-9,0)=10,@PAVG(CSHTRD,-9,0),@PAVG(CSHTRD,-10,0)) Returns a 10-day average volume when one of the days is a holiday. @PSUM(EPSPXQ,0,3)[@IF(@AND(@PERIOD(0Q)=4,UPDQ=3),@QTR(-1Y)+1,@QTR(0Y)+1)] Calculates year-to-date EPS. @PMAXPD(@AND(@ISVALUE(SALE),@ISNA(SALE[-1])),-19,0) Finds a company’s first year of data. @IF(@PERIOD(0Q)=1,SALEQ,@PSUM(SALEQ,-@PERIOD(0Q)+1,0)) Calculates year-to-date values for the current period in free form reports. • Formulas for calculating decile rankings (1-@FRAC(CR,$MYSET))*10 Returns decimal values where the higher value decile is the best. @INT((@FRAC(CR*-1,$MYSET)*10)+1) Returns integer values where the lower value decile is the best. @IF(@INT((1-(@FRAC(ITEM,$)))*10)<10,@INT((1-(@FRAC(ITEM,$)))*10)+1,@INT((1-(@FRAC(ITEM,$)))*10)) Calculates decile rankings in tables. @CMIN(XLR,@SET($SP_100,@NTILE(XLR,10,$SP_100)=1)) Calculates bottom value/cutoff of the first decile based upon “Labor and Related Expenses” for the S&P 100. To calculate the top value for the decile, replace the @CMIN with @CMAX. To get a ranges of all deciles, use =2, =3, etc., to =10 with @CMIN and @CMAX. • Formulas for calculating industry/set relatives (DT/SEQ)/(@CSUM(DT,$SP_SUPER,SIC)/@CSUM(SEQ,$SP_SUPER,SIC)) When used in free form report, calculates company debt to equity ratio divided by aggregate debt to equity for all companies in the S&P Supercomposite index having the same SIC code as the company for which the report is run. ◊◊ ◊◊ Take advantage of the Report/Define Name... menu option to replace $SP_SUPER, or any set reference, with a prompt for a different base set, providing additional flexibility. With a basic understanding of time periods, formulas and functions, we are ready to see how these are used in screening the database and generating reports. Related Topics in Research Insight: Creating a formula
Understanding time periods Mixing time periods Time period references

8/00
12
Screening Overview Screening allows users to query the COMPUSTAT database(s) in order to create a set of companies for which data will be generated (see Importing Sets or Set Overview for alternate methods of creating sets). A default “style” is chosen during installation that dictates the items and parameters used by the Research Assistant. Other styles (i.e. Finance, Money Management, Transfer Pricing, or Credit) may be chosen or created using the Tools menu option, then choosing Options… and Styles. Additionally, styles may be modified within the Research Assistant – Step 1 window by using the Customize button. • Defining Screening Criteria ◊◊ ◊◊ Users may create and run screens using either the Research Assistant or the Open Screen option from the side bar, or by selecting the File and Classic View menu options. The Classic View option is the most flexible in terms of saving and/or accessing interim subsets created as part of the screening process. The Research Assistant provides an easy method of designing queries without having to know the syntax required for the formula(s). Right-clicking on the “Indicator Item” to be screened allows access to the definition and/or concept chosen. Once the screen has been defined and saved, you may use Open Screen and Classic View to modify it or gain access to subsets. The “Classic View” facilitates saving or viewing multiple sets from within a single screen. For example to use the pre-defined Bankruptcy “Event” Screen (which screens for companies having been, or currently in, bankruptcy) and save each interim set you must open such using Open Screen and subsequently choosing the Classic View mode to open. To screen, or query, the COMPUSTAT (North America) database using the Research Assistant “Wizard”, begin by defining your screening criteria in the Research Assistant - Step 1 window. 1) If your criteria relate to a particular company, enter the ticker symbol in the Companies box (separating tickers with commas). 2) To find related companies, choose one of the options under Find Similar Companies (or you can accept the default, Don’t Find
Similar Companies). 3) Choose financial criteria from the tabs on the right. Each tab contains a set of related financial indicators. You can select as many
indicators as you like for your screen by clicking the box next to the item name. (To de-select an indicator, click the box a second time to remove the check mark.)
4) Choose a mathematical symbol (e.g., <, or >) from the drop-down list. Enter a number or range related to the indicator in the far right field.
5) Choose the subset of the database that your screen will run against by clicking the Change Set button and selecting a set name from the drop-down list. Your screen will run against the set of all Active companies ($C) by default if no other set is chosen.
6) Click Next and Research Insight screens the database for companies that meet your criteria, and automatically proceeds to the next window where you can view the results of your screen.
• Viewing results and saving sets After selecting criteria in Research Assistant - Step 1, click Next and you will see a list of the companies that met your screening criteria in the Company List box in Research Assistant - Step 2. If you are satisfied with the list as is, you can save these companies using the Save button to save a new set, or the Save As button to save the set with a new name leaving the original set intact. To add a company to the list, enter its ticker symbol in the Add Company to set box, and click the Add Company button. To remove a company from the Company List, highlight the company name, and click the Remove Company button under the list. Research Insight keeps track of changes you make in the Added Companies and Removed Companies boxes on the right. To restore the original list of companies, click the Reset button in the center of the window. There may be times when you want to save the screening criteria, or screen, associated with a particular report. For information on saving or associating a particular screen with a report, please refer to the section titled Screen Association on page 14 of this primer. Another method of creating company sets is to import the company tickers or cusips from existing files, detailed in the next section. Related Topics in Research Insight: How does Research Insight evaluate the criteria I choose?

8/00
13
Importing Company Sets
Importing sets of companies from an ASCII file into Research Insight is fast and easy! There are *two steps involved in importing your own sets: 1) creating your spreadsheet file and 2) importing the sets from your spreadsheet file into Research Insight.
*Note: Assumes that companies being imported are “known” to the system. If you import private companies, or those not in the population(s) of Research Insight, you would first have to define the company via the Databases and Company... menu options.
◊◊ ◊◊ A timesaving feature alerts you to “unrecognized” tickers, cusips or GVKEYS. When Research Insight encounters an unknown company identifier it will document such in an IMPORTXX.ERR file (XX signifying a number), while continuing to process those that are recognized. The file may be easily printed or SAVED PRIOR TO EXITING RESEARCH INSIGHT.
• Creating your spreadsheet To create your spreadsheet file, open a new (or existing ) document in your spreadsheet software. Next create the table header, which must contain a retrieval key. Valid retrieval keys include:
TIC The company’s ticker symbol. CUSIP The company’s CUSIP number. GVKEY The company’s GLOBAL Vantage Company Key, a permanent, non-changing key. Currency Code A currency key used for GLOBAL Vantage.
If you want to import a specific Issue, Business Segment, or Geographic Segment, type a backslash, the appropriate segment letter and two-digit segment identifier after the ticker symbol. For example, if you want to import the Domestic Geographic segment of the Mirage Hotel and Casino, you would use MIR\G01 as the ticker symbol. We recommend that you save your file as a Comma Separated Values file (*.csv file). Close your spreadsheet application. You are ready to import your set into Research Insight. • Importing your set After creating a delimited text file, you are ready to import the set into Research Insight. Begin from the Import dialog box (from the File menu, select Import...): 1. Type the name of the file you want to import in the File Name: text box or select the file from the list box. 2. Select the Set radio button in the Import: text box and click Open, you will be prompted to confirm that the file is comma delimited,
click on Yes (The Set Type dialog box appears). 3. Select the type of set that you want to import, normally just accept the default of Company, then Click OK. NOTE: If your spreadsheet contains a company ticker, you can still import the company as a business segment set, a geographic segment set, or an issue set. The retrieval keys in the spreadsheet do not have to match the set type you choose. A new window will briefly display an import progress bar, the type of retrieval key used, and the items being imported. Research Insight will tell you when the processing is complete. The imported set appears on your screen. 4. Save file as a set. From the File menu, select Save (You’ll see the Save File dialog box). Enter the set name in the File Name: text box.
Click OK, Your file is saved as a set. Once you’ve saved your set of companies and are ready to generate data for these companies, you are ready to run a report. You may use one of the many pre-defined reports available, or you may create your own report/format using the Report Assistant ◊◊ ◊◊ You may also import data/concepts into a “user database”. Please refer to the Beyond Basics manual for more information. Related Topics in Research Insight: Importing Data

8/00
14
Importing Concepts

8/00
15
Report Overview A report allows you to generate, view, print, and save/export data for a company or set of companies. In addition you may use existing reports provided with Research Insight to copy formulas, cells, or entire sections into a “new” report, or to examine the logic used in creating formulas. Yo u can create your own report or use one of the pre-defined reports in Research Insight. • Pre-defined reports Research Insight contains a library of free form and table reports, including a variety of financial statements and comparative presentations. These reports supply you with common data presentations, so that you don't have to create a report from scratch. ◊◊ ◊◊ These pre-defined reports can also help users by providing a good source of formula/expression examples. If an existing report has the type of data you want, such as industry relatives or ratios, you can copy and/or modify the formula for your particular need. ◊◊ ◊◊ Pre-defined reports may also be pulled up directly into EXCEL, taking advantage of Active -X technology. Once you have opened a report in EXCEL, simply use the S&P and Break Arrays menu commands or the Unlink Arrays tool to save formulas as values! Running the reports directly in EXCEL alleviates the need to specify file “delimiters” when exporting directly from Research Insight and the potential need to realign data within the finished reports.
To access a pre-defined report, click Open Report in the Welcome window or sidebar, or the Open Report icon in the toolbar, and choose from the list of reports categorized by type..
The report template will appear, followed by the Run Assistant dialogue box prompting you for the company/set for which you need data. At this point you should: 1. Type the company ticker, or tickers separated by commas in the Companies box, or use the Change Set button to enter a set name in the Initial Sets dialog box. You can also use the @SET function to enter a set in the Initial Sets box. For more information, see Current and temporary sets . 2. Research Insight automatically runs the report for the current period unless you select a specific time period. To specify a time
period, select the Report Time Periods tab in the Run Assistant. Use the arrow buttons to select appropriate periodicities. 3. To run the report, Click OK. Research Insight evaluates the report, then displays the report results. 4. To print the report, from the File menu, select Print and click OK.

8/00
16
• Screen Association There may be times when you want to save the screening criteria, or screen, associated with a particular report. To save a particular screen with a report: From the Tools menu, choose Options. Next, select the Report tab and, under Saving Reports, click the Save Screen association to reports check box. To turn off this option, click the check box again to remove the check mark. What happens when I select this option? When you close a report, Research Insight will prompt you to save the screen, then the report. With this option selected, Research Insight automatically links the last screen you ran with the report. The next time you open this report, Research Insight will immediately run the report using the associated screening criteria. What happens when I turn this option off? When you close a report, Research Insight will prompt you to save the screen, then the report. However, the software does not save a connection between the screen and the report. The next time you open this report, Research Insight opens the Run Assistant so you can select new screening criteria. • Exporting/saving report results The data in the report can also be saved to an ASCII file for use in other application software such as spreadsheet software. To save the data you have generated, begin from the report you have just run: 1. To export your report results, from the File menu, select Save As. You'll see the Save File dialog box. 2. Before saving the file, notice the Text Options... dialog box, which you can use to select column delimiters for your reports.
The column delimiter you use depends on the software to which you want to export. The default is to use Tab delimiters, and Labels are not selected. To include labels with your export you must select such. For more information about specific delimiters required by your software program, refer to your specific software manual.
3. Type a file name and click Save (Note that in many universities, you may not have proper permissions to save to the network
drive and must first re-direct the file using the Save in: option). The report results are saved with a .txt extension . • Pre-defined Reports & Templates in Microsoft Excel® One of the most powerful features of Standard & Poor’s Research Insight is its ability to communicate with other active software packages through Active-X technology . This technology allows almost instantaneous communication between Research Insight and Microsoft Excel®. Research Insight is compatible with Excel 97 or greater.
Note: You must turn off the Auto Correct feature in EXCEL to ensure you are retrieving data for the company you have specified. To do so, select Auto Correct from the Tools menu and deselect the Replace Text As You Type option.
◊◊ ◊◊ Users may also create or open existing Research Insight reports (pre-defined or user-defined) directly in Excel, eliminating the need to export data, by using the S&P add-in on the Excel menu. Begin with Excel open: From the S&P menu, select the Open Report option, you will see the File Open window. Next, select the folder/report you wish to run, then click Finish. You will see the Run Assistant window. Enter your target companies’ ticker symbols in the Companies field, separating ticker symbols with commas (i.e.sbux,bean,f), or the set name. Finally, click OK, and you should see the requested data/report in Excel. To view the report for other companies, select the company from the drop-down list directly above the report. To modify the criteria used to create the spreadsheet, select Run Assistant from the S&P menu.
Although there is no need to export the data, the file actually contains formulas as opposed to raw data. You may save the EXCEL spreadsheet and the Active-X syntax will automatically be saved within the sheet. In order to save the data for use without Research Insight, (i.e. save the file for use at home) users can use the “Unlink Arrays” icon on the EXCEL toolbar or the S&P and Break Arrays menu options. Breaking the arrays produces an additional sheet within the EXCEL workbook containing data only, while maintaining the original sheet/report containing the formulas. This is a great way to learn the Research Insight/EXCEL syntax!
◊◊ ◊◊ In addition to the reports listed in the Report Library, several useful templates have been created for use within EXCEL exclusively. These templates cannot be accessed from within Research Insight itself. Please refer to pages 27 and 28 of this primer for examples and more information on accessing these valuable tools.

8/00
17
•• Sector & Industry Reports Many clients have asked for quick and easy methods to get industry composite, or aggregate, data for sets that they have created. The following reports, located in the Sector and Industry Reports folder in the Report Library, were created to meet that need:
*FILE NAME DESCRIPTION
CBSCMPOS.RPT Annual Balance Sheet for a User-Defined Set CISCMPOS.RPT Annual Income Statement for a User-Defined Set CBSCMAVG.RPT Average Annual Balance Sheet for a User-Defined Set CISCMAVG.RPT Average Annual Income Statement for a User-Defined Set CRATAVG.RPT Average Annual Ratio for a User-Defined Set CSUMXIND.RPT ` * Financial Summary (Including Industry Comparisons) - 5 Years
These files were designed to take advantage of the @CSUM, @CAVG and @CWAVG functions in Research Insight. The reports also take advantage of the * Report and Define Name ... menu options in Research Insght, which prompts users for either company keys, formulas or, as is the case with these reports, sets . Please note that only the first two reports are true aggregations, as the other reports use averages and weighted averages as opposed to summations. The first step in generating aggregate data is to run a screen to define your set (or composite). The example below shows a simple screen (in the Classic View) for companies having a 2000 sic code. Once the screen has been run, save the resulting set (i.e. sic2000) to be run for the specific report.
The next step is to open the report(s) of choice from within Research Insight and, if applicable, choose the date for which you wish to extract data. The date is chosen by selecting the Select Period in the Report Time Periods option in the Run Assistant dialogue box. You will automatically be prompted for such, and by default RI will return the most recent data available. All reports are designed to return five years of annual information, except the ratio report, which returns six years of information. * Once the date has been selected, you should see the following Defined Names Prompt, for which you will enter your set name.
You may actually screen directly from the Input Set Name prompt using the @SET function (i.e. @SET($C,SIC=2000), but this will not allow you to save the set for future use. Also, you may choose to modify the reports for other statistical purposes. For instance you may use the Edit/Replace menu options to replace the @CSUM with @CMED to get medians rather than aggregates. * Note: the Financial Summary report dynamically screens the S&P 1500 Super Composite for companies matching the target company SIC, and does not require nor prompt for a user-defined set.

8/00
18
• Creating your own reports When you create a report, you choose the data you want to display as well as how you want to display it. You can create table reports or free-form reports in the Report Assistant. You may also design a free-form report by choosing the Blank Report radio button in Report Assistant - Step 1. The characteristics of each type of report are listed below: Table Report Free-form Report Displays data for a set Displays data for a single company or group of companies Presents data in columns and rows, with each Labels and data can be anywhere in the report, or with each company's data presented in 1 row you can align the data into columns and rows Automatically provides default labels for each column You must add label cells and type labels for data Displays Research Insight or user data Displays Research Insight or user data Displays subtotals Displays summary statistics • Parts of a report Whether you create your own report, or use a pre-defined report, one or more of the following elements are found:
Cells A cell is the intersection of every row and column, into which you paste or type a formula or label. In free-form reports, cells may appear anywhere in the report.
Formulas A formula is an item, concept, function, or combination of, and can also
include time periods, and relational and mathematical operators.
Labels A label is the text that identifies data dis played in your report.
Tables A table displays information in columns and rows. It provides you with a title cell to name your report, column labels, and formula cells.
•• Report Assistant The Report Assistant is designed to automate and simplify the steps needed for users to create custom reports for data viewing/output. The Report Assistant can be invoked via the Welcome Screen, the sidebar, the Tools menu, or from Step 3 of the Research Assistant. In the Report Assistant - Step 1 window you can begin building a custom report by defining your report parameters. Define the time period - Research Insight gives you the option of creating a report for the Current Time Period (the most recently available data for the day, month, quarter, or year) or running a Historical Analysis report comparing data items and companies over a specified period of time. Choose a report format - Select one of the radio buttons under *Current Time Period or *Historical Analysis to determine how items, companies, and time periods will display in your report. You will see a preview of the report format you choose in the Example window. If you choose a Companies vs. Items report format under Current Time Period, the Company Count box is enabled. You must then select the number of companies that will appear across the top of your report. You may also create a blank template and add/position your own cells by selecting the Blank Report radio button.
*Choosing the Items vs. Companies produces a Table Report in both scenarios. The remaining options produce Free-form reports, usually the most useful for displaying detailed information for one company record at a time. Keep in mind that “table” reports often run much faster than “free form” reports for generating data on large sets of companies.
After choosing your format, click Next to advance to the next window (Step 2) and choose the items that will appear in your report.

8/00
19
The Report/Chart Assistant - Step 2 window is used to select items that you want to appear in your report or chart. For your convenience, data items are organized according to Item Groups (e.g. Valuation, Growth, etc.). Click one of the radio buttons next to an Item Category. You will see that the Items list below changes to show all of the items that are available under that category. Highlight an item in the list and click the Add button to select it for your report. The item appears in the Selected Items box on the right. If you decide not to include a selected item in your report or chart, highlight the item and click the Remove button. You can arrange Selected Items in the list in the order you would like them to appear in your report or chart. To do this, select a listed item and change its position in the list with the Move Up or Move Down button. Additional items and functions can be added to your report or chart by entering the mnemonic in the New Item text box. Then click the down arrow button to add that item to the Selected Items list. If you don’t know the mnemonic, click the Look Up button to search for items and functions. ◊◊ ◊◊ You can also customize the Item Categories to include the items that you use most often. After you have chosen the items for your report or chart, if you chose a Historical Analysis report, click Next to advance to the next step in the Report or Chart Assistant. If you chose a Current Period report, click Finish to run your report or chart. The Report/Chart Assistant - Step 3 window appears only when you have chosen a Historical Analysis report or chart. It allows you to select a time period format as well as the beginning and ending time periods. It also lets you align items with different periodicities so that they appear on the same period basis. Select one of the three Time Period Formats - Relative for the year, quarter, month, week, or day relative to the current period; Absolute for the exact year, quarter, month, week, or day; or Calendar for a calendar year, quarter, month, week, or day. Use the arrow buttons to choose the Beginning Period and the Ending Period for your report or chart. The following are some examples of beginning and ending periods for each time period format:
Beginning Period Ending Period Time period returned in your report
Relative -1Y 0Y If the current year (0Y) is 1997, the report returns 1996 and 1997. The current period differs among companies. It depends on when the latest update was done and on the company’s fiscal year-end.
Absolute Y96 Y97 Returns data for fiscal 1996 and 1997. If the company has a June fiscal year-end, the years run from Jul95 to Jun96 and Jul96 to Jun97.
Calendar C96 C97 Returns data for 1996 and 1997, January through December.
Choose one Alignment for each data item/periodicity in the report or chart. For example, if you selected a data item with an annual periodicity (like Sales) and an item with a monthly periodicity (like Market Value-monthly), then the annual and the monthly alignment options will both be enabled. If you choose monthly, then Research Insight calculates the annual item on a monthly basis, and returns a monthly Sales figure as well as the monthly Market Value. Users may want to use period reference functions in their formulas, allowing the ability to change the time period associated with an item. For example, you can change the time reference for a monthly item to a quarterly time period using the @MNT function such as PRCCM@MNT(0Q). Other period reference functions are: @DAY - Identify period day, @PERIOD - Display period number, @QTR - Identify fiscal period quarter, @WK - Identify period week, @YR - Identify fiscal period year.

8/00
20
•• Custom “Panel” Reports for SAS Many users prefer to create their own reports for exporting data into ASCII files, which can then be used with other software for analysis. Research Insight provides the ease of use and flexibility to accommodate the needs of such users. A free-form report gives the user more control over the basic layout of the report for such applications, but table reports are usually “faster” in generating and saving data for large sets of companies. Free form reports, by default, generate one record per company in the same file. In the case of spreadsheet software, such as Excel, the records will appear one after another in subsequent rows of your spreadsheet (Any labels included in the report will be duplicated between records, so many users choose to add labels after saving the data). ◊◊ ◊◊ Include the item GVKEY with any reports, in addition to TIC or CUSIP, as this is a permanent company identifier for Research Insight companies. • Free Form “Panel” Reports The following are two possible methods of creating a free form “panel” report. Method 1 potentially requires more keystrokes and manipulation than Method 2, in that the user is required to create and align every cell into rows and columns. Method Two automates the creation of rows and columns and formula creation/input, but the user may end up deleting some labels and cells to create a finished report (Faculty may prefer using Method Two, or creating a “table” format as described on page 20). Begin in the Report Assistant - Step 1 window. Method 1 Selecting the Blank Report radio button, then selecting the Finish option will provide a blank report template. The user must then select either the “@” or “T” toolbar options to add/position formula or text cells. Once the cells have been added, input the formula or label for the respective cells. Be sure to take advantage of the copy, paste, and Edit/Replace... features of the software to minimize keystrokes and effort. You may also copy/paste rows/columns from existing reports and later change data and time references. Method 2 Define the basic layout for your report by selecting the radio button Items vs. Time for a Company or Time vs. Items for a Company in the Historical Analysis box. This choice defines whether you have items/time periods going vertically or horizontally in the finished report. After choosing your format/parameters, click Next> to advance to Step 2 and choose the items that will appear in your report. You can choose multiple items as in the following example, or select a single item then use the copy, paste and find/replace functionality of Research Insight to add additional cells and items. Once you have chosen your items, click Next> to proceed to Step 3 and select the time periods for which you need data. At this stage, clicking Finish will bring up the Run Assistant window. Click Cancel to remain in the template without processing. You can now delete the extraneous items that you may not want, such as company name and labels, and modify as in Method 1 (i.e. using copy, paste and find/replace). The following is an example of using the Report Assistant simply selecting the annual item Sales, Net Income and Pretax Income for a five-year period.
Above: Results of using Report Assistant, Items vs. Time for a Company, and selecting Sale for 5 years of data.

8/00
21
Below: Highlight the cells to delete (exporting the data creates an ASCII file with each record following the previous). To highlight simply click on the “CONM” formula cell, hold your Shift key and click on the “Net Income (Loss)” label cell, then hit Delete key.
If you decide that you want additional items or years, use the copy, paste and Edit/Replace options within Research Insight to mo dify the report. The example below shows how to add a column for Earnings per Share (EPSPX), Global Vantage Key (GVKEY) to the end of the report above, once the extraneous cells have been deleted.
Above: After deleting unwanted cells , copy the “sale” column by a) highlighting the cells, b) choosing Edit/Copy then Edit/Paste from the menu (or use the toolbar copy and paste) and, c) use the Edit/Replace and Replace Select (so that only the highlighted cells are replaced) to replace Sale with the additional items you need. Note that in the following example the last column contains the item GVKEY. This was not input using the Replace option, but instead just typed after highlighting the cells. This is because GVKEY is a “scalar” item and will not function with time references. Further, GVKEY is input several times simply for company / data identification and alignment of data once exported to a spreadsheet.

8/00
22
• Table “Panel” Reports An alternate format for creating panel reports is to use the Report Assistant, choosing the default Current Time Period and Items vs. Companies as shown below. This format is often preferable when data is needed for large sets of companies as it does not require the program to access an entire company record, instead only accessing the items requested of that record. This can be beneficial in terms of “speed” of both generating and exporting the data requested. You may choose *“Historical Analysis” as opposed to “Current Time Period” to get multiple years of data in a single report. Some users have indicated that this *format creates problems for certain software packages, as it lists the items multiple times across the top of the report.
Continue to Step 2 of the Report Assistant by clicking on Next > to select the items you require in your report. Once you have finished selecting the items choose Finish to run and/or save your report. If you wish to modify the report at any time, simply open the report to add/delete columns, change data items/formulas or make other formatting changes such as data sort orders. You must run this report multiple times to generate data for multiple years since it is defined to run for the “Current Time Period” only. Select the Report Time Periods folder, as shown below, to specify the period for which you would like to generate data.
8/00
23
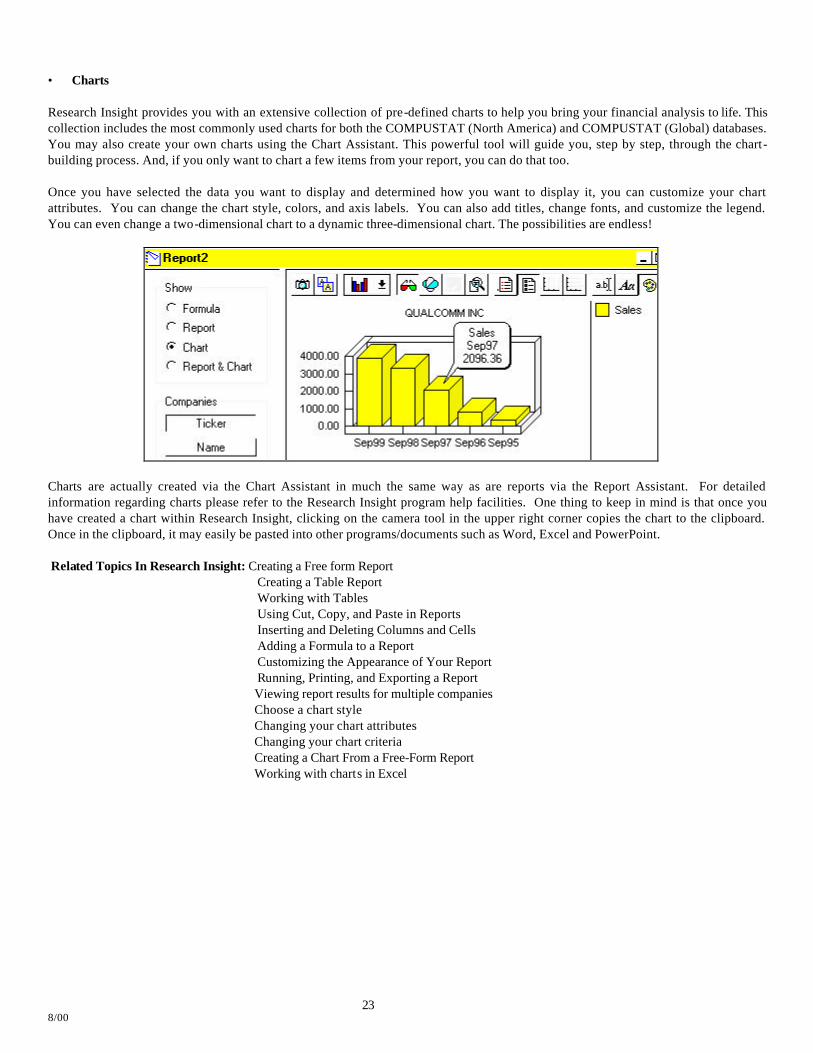
• Charts Research Insight provides you with an extensive collection of pre-defined charts to help you bring your financial analysis to life. This collection includes the most commonly used charts for both the COMPUSTAT (North America) and COMPUSTAT (Global) databases. You may also create your own charts using the Chart Assistant. This powerful tool will guide you, step by step, through the chart-building process. And, if you only want to chart a few items from your report, you can do that too. Once you have selected the data you want to display and determined how you want to display it, you can customize your chart attributes. You can change the chart style, colors, and axis labels. You can also add titles, change fonts, and customize the legend. You can even change a two-dimensional chart to a dynamic three-dimensional chart. The possibilities are endless!
Charts are actually created via the Chart Assistant in much the same way as are reports via the Report Assistant. For detailed information regarding charts please refer to the Research Insight program help facilities. One thing to keep in mind is that once you have created a chart within Research Insight, clicking on the camera tool in the upper right corner copies the chart to the clipboard. Once in the clipboard, it may easily be pasted into other programs/documents such as Word, Excel and PowerPoint. Related Topics In Research Insight: Creating a Free form Report
Creating a Table Report Working with Tables Using Cut, Copy, and Paste in Reports Inserting and Deleting Columns and Cells Adding a Formula to a Report Customizing the Appearance of Your Report Running, Printing, and Exporting a Report
Viewing report results for multiple companies Choose a chart style Changing your chart attributes Changing your chart criteria Creating a Chart From a Free-Form Report Working with charts in Excel
8/00
24
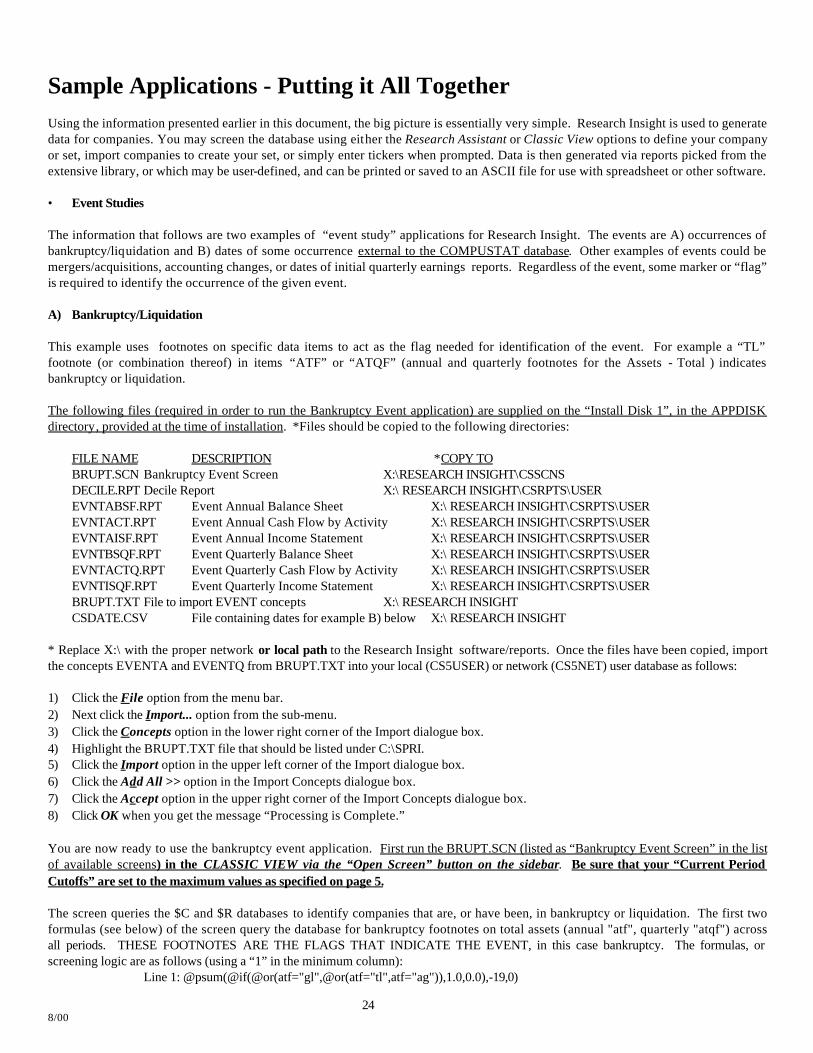
Sample Applications - Putting it All Together Using the information presented earlier in this document, the big picture is essentially very simple. Research Insight is used to generate data for companies. You may screen the database using either the Research Assistant or Classic View options to define your company or set, import companies to create your set, or simply enter tickers when prompted. Data is then generated via reports picked from the extensive library, or which may be user-defined, and can be printed or saved to an ASCII file for use with spreadsheet or other software. • Event Studies The information that follows are two examples of “event study” applications for Research Insight. The events are A) occurrences of bankruptcy/liquidation and B) dates of some occurrence external to the COMPUSTAT database. Other examples of events could be mergers/acquisitions, accounting changes, or dates of initial quarterly earnings reports. Regardless of the event, some marker or “flag” is required to identify the occurrence of the given event. A) Bankruptcy/Liquidation This example uses footnotes on specific data items to act as the flag needed for identification of the event. For example a “TL” footnote (or combination thereof) in items “ATF” or “ATQF” (annual and quarterly footnotes for the Assets - Total ) indicates bankruptcy or liquidation. The following files (required in order to run the Bankruptcy Event application) are supplied on the “Install Disk 1”, in the APPDISK directory, provided at the time of installation. *Files should be copied to the following directories:
FILE NAME DESCRIPTION *COPY TO BRUPT.SCN Bankruptcy Event Screen X:\RESEARCH INSIGHT\CSSCNS DECILE.RPT Decile Report X:\ RESEARCH INSIGHT\CSRPTS\USER EVNTABSF.RPT Event Annual Balance Sheet X:\ RESEARCH INSIGHT\CSRPTS\USER EVNTACT.RPT Event Annual Cash Flow by Activity X:\ RESEARCH INSIGHT\CSRPTS\USER EVNTAISF.RPT Event Annual Income Statement X:\ RESEARCH INSIGHT\CSRPTS\USER EVNTBSQF.RPT Event Quarterly Balance Sheet X:\ RESEARCH INSIGHT\CSRPTS\USER EVNTACTQ.RPT Event Quarterly Cash Flow by Activity X:\ RESEARCH INSIGHT\CSRPTS\USER EVNTISQF.RPT Event Quarterly Income Statement X:\ RESEARCH INSIGHT\CSRPTS\USER BRUPT.TXT File to import EVENT concepts X:\ RESEARCH INSIGHT CSDATE.CSV File containing dates for example B) below X:\ RESEARCH INSIGHT
* Replace X:\ with the proper network or local path to the Research Insight software/reports. Once the files have been copied, import the concepts EVENTA and EVENTQ from BRUPT.TXT into your local (CS5USER) or network (CS5NET) user database as follows: 1) Click the File option from the menu bar. 2) Next click the Import... option from the sub-menu. 3) Click the Concepts option in the lower right corner of the Import dialogue box. 4) Highlight the BRUPT.TXT file that should be listed under C:\SPRI. 5) Click the Import option in the upper left corner of the Import dialogue box. 6) Click the Add All >> option in the Import Concepts dialogue box. 7) Click the Accept option in the upper right corner of the Import Concepts dialogue box. 8) Click OK when you get the message “Processing is Complete.” You are now ready to use the bankruptcy event application. First run the BRUPT.SCN (listed as “Bankruptcy Event Screen” in the list of available screens) in the CLASSIC VIEW via the “Open Screen” button on the sidebar. Be sure that your “Current Period Cutoffs” are set to the maximum values as specified on page 5. The screen queries the $C and $R databases to identify companies that are, or have been, in bankruptcy or liquidation. The first two formulas (see below) of the screen query the database for bankruptcy footnotes on total assets (annual "atf", quarterly "atqf") across all periods. THESE FOOTNOTES ARE THE FLAGS THAT INDICATE THE EVENT, in this case bankruptcy. The formulas, or screening logic are as follows (using a “1” in the minimum column): Line 1: @psum(@if(@or(atf="gl",@or(atf="tl",atf="ag")),1.0,0.0),-19,0)

8/00
25
Line 2: @psum(@if(@or(atqf="gl",@or(atqf="tl",atqf="ag")),1.0,0.0),-47,0) Line 3 of the screen adds the two sets identified by lines 1 and 2, and names the set "events". Line 4 queries the "research" population ($R) for all companies whose reason for deletion is bankruptcy or liquidation. Line 5 looks for all NASDAQ companies with five-digit tickers ending in "Q", the convention used by NASDAQ to indicate bankruptcy. Finally, Line 6 adds the sets from lines 4 and 5 to the "events" set to create a set (bnkrpts) of all companies either in or having been in bankruptcy. Lines 3 - 6 show other methods of identifying companies in bankruptcy. The resulting sets do not contain the flags needed for the event reports .
*The footnote may be on the annual or quarterly item, or both. If the annual footnote exists but the quarterly doesn't (or vice versa), the later respective report will not function properly. Also, the difference in the number of companies passing the annual/quarterly screens is due to differences in the history of files (quarterly -12 years, annual-20 years).
Next, save the resulting company sets (EVENTA & EVENTQ) on lines 1 and 2 of the screen. These will be the *sets of companies to be run through the various reports supplied with this application. The set $EVENTA should be used for the annual reports, whereas $EVENTQ will be the set used for the quarterly reports. It is important to recognize that the existence of the footnotes IS REQUIRED in order to run the event reports. If there is no footnote the time-reference concepts (EVENTA & EVENTQ) and the reports will not function properly (i.e. You will see the same data for all five years of the report). Other footnotes/items can be used as flags. For example an “AA” footnote in “SALEF” or “SALEQF” to indicate a merger or acquisition, or the item Reported Date of Qtly EPS (RDQ). You can time reference items such as PRCCD[@day(RDQ)+1] to get the closing daily stock price on the day after the quarterly earnings report, or modify a report such as the quarterly income statement to replace “relative” time references with that of the RDQ date (i.e. SALEQ becomes SALEQ[@QTR(RDQ)]. Users may also create their own flags if needed, as explained below. Example B) illustrates a user-defined data item acting as the flag, the values for such being “imported” into the Research Insight system. For details on “Creating Your Own Data Item” and “Importing” see chapters 3 and 12, respectively, in the Getting Started manual. B) DATES The next example of an event study focuses on specific dates of occurrence, such as an issue of stock going “ex-dividend”. In this example we will assume that the dates are external to the COMPUSTAT database, and so we need to create an item/indicator to flag the event. First create/define the data item in Research Insight:
1) Click the Databases... option from the Research Insight menu. 2) Next click the Item... option, and in the Item Definition dialogue box fill in the parameters as follows:
Item: EVTDATE (* after entering the item name you must click on the Edit button, you’ll see the message “EVTDATE was not found in the dictionary for the active Database Group. Do you want to add it to the dictionary?” Click on the “OK” button) Name: Ex-Date Indicator Data Type: Date Adjusted: None Item Type: Company (*Note that this can be Issue if tracking multiple issues for companies) Periodicity: Scalar (*Scalar was chosen for this example, other periodicities such as “Daily” could be chosen) Elements: 2 (*Note that this can be 1 or more, depending upon the number of possible occurrences)
3) Click the Accept option in the upper right corner of the dialogue box, then close the dialogue box.
Now that we have defined the item, it is time to import the values for the specific companies. The example below uses just three companies, but you may import values for thousands of companies. The idea is to create a matrix using the company identifier (TIC, CUSIP or GVKEY) in the first column and the item values in the remaining columns in the following format:
COLUMN HEADING => TIC @ELEMENT(EVTDATE.1) @ELEMENT(EVTDATE.2) VALUES => IBM 03/16/95
DEC 02/12/93 04/17/87 GE 01/13/94
There is no value in the second element for IBM (i.e. there is no second event ). Because the item was defined as “scalar”, we must use multiple elements for multiple events. *Cells containing values for dates are formatted as DATE, as shown above.
◊◊NOTE DAILY DATES MUST BE WEEKDAYS; WEEKENDS ARE NOT RECOGNIZED IN RESEARCH INSIGHT!

8/00
26
The system is now “aware” of the new item, so we can import the values from the CSDATE.CSV as follows:
1) Click the File option from the menu bar, Next click the Import... option from the sub-menu. 2) Click the Data option in the lower right corner of the Import dialogue box, which is the default. 3) Highlight the CSDATE.CSV file that should be listed under C:\SPWS, Click the Import option in the upper left
corner of the Import dialogue box. Click Yes when prompted “Is this .csv file comma delimited?”.
You will see a status bar quickly indicating the importation of the data into your user database, and you may check to see that the data has been imported using the Databases..., View/Modify Data... menu option. Now that you have imp orted the data, the last step is to use the dates/items for your specific purpose. For example you may wish to export data or run reports based upon the date of occurrence using time reference mnemonics such as @DAY(@element(evtdate,1)) or @MNT(@element(evtdate,1)) or @QTR(@element(evtdate,1)). You could replace the time references in existing reports (i.e. replace saleq[-1] with saleq[@qtr(@element(evtdate,1))]), in order to create entire reports to be run based upon an occurrence. A quick way to do this is to use the Edit... and Replace... menu options in the Research Insight workspace. •• Standard & Poor’s Indexes Research Insight contains a wealth of index information about companies listed in the Standard & Poor’s indexes. These indexes are classified in three different manners: Standard & Poor’s major indexes, economic sectors, and industry index groups. Standard & Poor’s Major Indexes. There is a logical structure to the construction of the indexes. First there are major indexes. They are:
S&P 500 S&P MidCap 400
+ S&P SmallCap 600 S&P 1500 Super Composite
Economic Sectors & Industry Index Groups . Next, there are economic sectors and industry index groups. There are 11 economic sectors and 141 active industry index groups. Each of the 11 economic sectors consists of one or more industry index groups. For example, the economic sector Communication Services consists of the following industry index groups:
Cellular/Wireless Telecommunication; Telephone Long Distance; Telephone Tying it all together. Each of the 141 Industry Index Groups is duplicated four times—once for each of the four S&P Major Indexes—for a total of 564 industry index groups! This level of detail allows you to fine-tune your analysis. Each industry index group is identified by a unique ticker, which consists of two parts:
1. A one- or two-letter prefix which identifies the S&P major index
2. Four digits which identify one of the 141 industry groups
Ticker Prefix = S&P Index Industry Index Group*
I0702 I = S&P 500 Banks (Major Regional)–500
MI0702 MI = S&P MidCap 400 Banks (Major Regional)–Mid
SI0702 SI = S&P SmallCap 600 Banks (Major Regional)–Small
XI0702 XI = S&P 1500 Super Composite Banks (Major Regional)–Super
*The suffix attached to the industry index group name indicates the S&P index represented. For example, “–Mid” indicates the S&P MidCap 400 index.
All of these indices can be easily screened for in Research Insight using the following items, which reference a specific time period:
Time Period Reference S&P Index Code S&P Industry Code Current SPMIX SPIIX Monthly SPMIM SPIIM

8/00
27
Historical (Annual) SPMI SPII

8/00
28
Screening on Economic Sectors and S&P Major Indexes Using the Classic View, you can screen on all companies in the Consumer–Cyclicals economic sector (ECNSEC=2000) that are also in the S&P SmallCap 600 major index (SPMIX=92) as follows...
Screening on Industry Index Groups and S&P Major Indexes
To screen on all S&P SmallCap 600 companies (SPMIX=92) in the Construction industry index group (SPIIX=106), you would run these formulas...
Using the Research Assistant, you can easily retrieve the identical information. Simply customize your Indicator Groups tabs and Items for the same screening criteria used in the above example: S&P Index Member = 92-S&P SmallCap 600 and S&P Industry Member = 106-Construction.

8/00
29
Backtesting
Did you ever wonder how companies with low valuations have performed over time? Do you have an investment theory that you want to see the performance of back in time? Research Insight provides an easy way to find the answers to these questions – and more – using the Excel backtest functionality.
With Research Insight, we’ve added backtest spreadsheets and an =SPWS_SCREEN function in EXCEL that allows you to backtest your theory and see which companies would have passed your investment criteria in previous years. This function takes a screen you have saved, runs it for a designated time period, and saves the companies that passed as a set. For example, you might use SPWS_SCREEN to create a set of companies that met your screening criteria as of Dec96. Make sure that your Economic data is imported before you use the backtest spreadsheet. See Add-in functions under Research Insight Help Topics for more information.
Let’s say, for example, that you wanted to identify companies that meet the following criteria at year-end:
Price is $50 or less
Price to Earnings is 18 or less Price to Book is 1.5 or less Price to Sales is between .2 and 1 Market Value is greater than or equal to $250 million
Your first step would be to create and save a screen in Research Insight based on the above criteria. There is just such a screen in the Research Insight pre-defined screen library called Backtest Monthly (BTM.SCN). There you will also find Backtest Quarterly, or you may create your own custom screen. In our example, we used the Classic View feature in Research Insight, but you can also use the Research Assistant to achieve the same results. If you create a new screen, you would first need to save it before proceeding.
Backtest Monthly screen in Classic View
To view the companies’ returns (assuming you bought and held them for a year) and test this theory for the past five years, open the BASICMNT.XLS spreadsheet in EXCEL. This template should be located in the Research Insight/Excel/Excel8/Backtest folder. You may have to use the “F9” key on your computer to initiate the calculation of cells.

8/00
30
Notice that the formula in cell B6 uses the =SPWS_SCREEN add-in function. To run this spreadsheet for your own screen, all you need to do is replace the screen “BTM.SCN” in cell D2 with your saved screen. The =SPWS_SCREEN function is used to create a set of companies based on a specific time period that you determine. Each set that is created is automatically saved in Research Insight and, for BTM.SCN, will begin with the characters $BTM (or whatever you’ve named your particular screen).
Comparing the results of our test, it appears that using the criteria we selected for our screen, we could have beat the S&P 500 in three of the past five years, and equaled it in a fourth.
To view the set of companies passed your screen for a specific year, click the one of the sheets labeled SET1 through SET6 tab at the bottom of the workbook, or one of the sets specified in cells B6 through B11. Note that the =spws_screen function will always begin your set names with the characters $BT (e.g. $BTDEC94). The spreadsheet now displays all of the companies in the specific set, as shown below.

8/00
31
The BASICMNT.XLS spreadsheet and the =spws_screen function are just two of the exciting new features waiting for you in Research Insight. Look for other custom templates located in Excel/Excel8 or Excel/Excel7 folder, depending upon your version of Excel, such as ZSCORE.XLS, DUPONT.XLS (both shown below), SNAPSHOT.XLS, ANALYZE.XLS and more!
DUPONT.XLS
ZSCORE.XLS
For additional information regarding Standard & Poor’s Institutional Market Services products and services please visit our web site at WWW.COMPUSTAT.COM, or refer to Other Compustat Products in the Research Insight Help menu option.