discussion of standard & poor’s presentation entitled ... · discussion of standard &...
TRANSCRIPT

Page 1 of 15
NAEP State Service Center Winter Workshop La Jolla, California -- January 26, 2006
Discussion of Standard & Poor’s Presentation Entitled “Comparing State Performance under NCLB: Issues and Opportunities for Using NAEP”
Bert D. Stoneberg
Idaho Department of Education
Introduction
My preparation for today’s discussion has been primarily a review of the
report entitled Leveling the Playing Field 2005: Identifying Outperforming and
Underperforming States on the NAEP in Demographic Context. (Standard &
Poor’s School Evaluation Services, 2005). All references to “the report” hereafter
will be references to this publication.
Before stating my concerns about the Standard & Poor’s study, let me
gratefully acknowledge that the report was free of three mistakes in analyzing and
reporting NAEP 2005 results that have appeared again and again in publications
issued by foundations, institutes and other research organizations, and in
newspaper columns and reports.
The report did not denigrate NAEP’s At or Above Basic as a “dumbing-
down” statistic whose primary use is to enable dishonest public educators
to escape the accountability measures of the No Child Left Behind Act.
The report did not resort to point-by-point comparison of performance
scores on NAEP and the state assessments.
Page 2 of 15
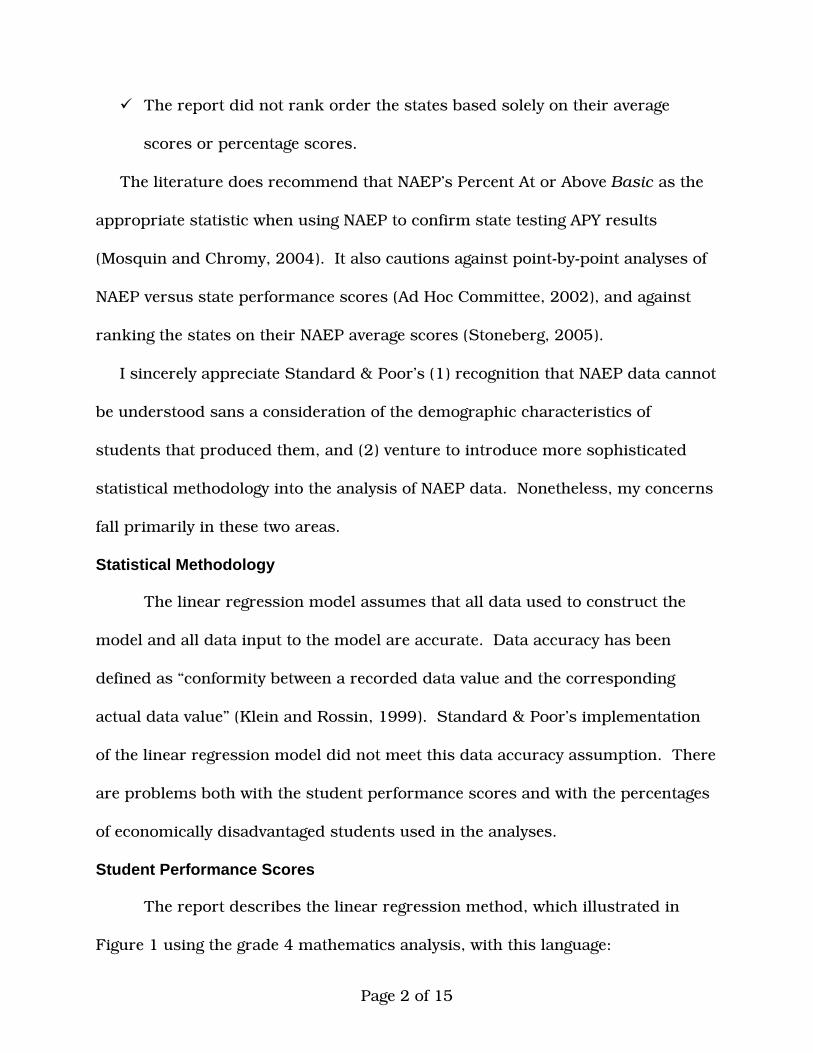
The report did not rank order the states based solely on their average
scores or percentage scores.
The literature does recommend that NAEP’s Percent At or Above Basic as the
appropriate statistic when using NAEP to confirm state testing APY results
(Mosquin and Chromy, 2004). It also cautions against point-by-point analyses of
NAEP versus state performance scores (Ad Hoc Committee, 2002), and against
ranking the states on their NAEP average scores (Stoneberg, 2005).
I sincerely appreciate Standard & Poor’s (1) recognition that NAEP data cannot
be understood sans a consideration of the demographic characteristics of
students that produced them, and (2) venture to introduce more sophisticated
statistical methodology into the analysis of NAEP data. Nonetheless, my concerns
fall primarily in these two areas.
Statistical Methodology
The linear regression model assumes that all data used to construct the
model and all data input to the model are accurate. Data accuracy has been
defined as “conformity between a recorded data value and the corresponding
actual data value” (Klein and Rossin, 1999). Standard & Poor’s implementation
of the linear regression model did not meet this data accuracy assumption. There
are problems both with the student performance scores and with the percentages
of economically disadvantaged students used in the analyses.
Student Performance Scores
The report describes the linear regression method, which illustrated in
Figure 1 using the grade 4 mathematics analysis, with this language:

Page 3 of 15
Figure 1. Depiction of Standard & Poor’s linear regression method used to predict a state’s performance from the percentage of its economically disadvantaged students.
“Standard & Poor’s method involves plotting statewide NAEP per-formance against economically disadvantaged enrollment, and then creating a regression line (representing the expected performance) that runs through the scatter plot. To account for the statistical uncertainty associated with test measurement error, an “error band” of plus or minus one standard deviation of the residuals is drawn around the regression line to determine the statistically expected zone of statewide performance. The resulting analysis, which can be depicted graphically, reveals which states perform as statistically expected, which states exceed these expectations (i.e., perform above the error band), and which states fall below statistical expectations (i.e., perform below the error band).” [Emphasis added.]
It must be duly noted that the linear regression model really does not
account for “test measurement error” as claimed. Consider:

Page 4 of 15
The “error band” is actually related to the correlation between the two
variables selected for a regression analysis -- the higher the correlation, the
smaller the error band (Runyon & Haber, 1971). Two variables of low
correlation would produce an “error band” even if the variables were free of
test measurement error.
The “error band” definitely does not account for the uncertainty in the data
associated with sampling. This uncertainty makes up the major portion of
what NAEP reports as the “standard error.”
NAEP reports out both an estimated score and its standard error. Let’s
continue using the percentage of students scoring At or Above Proficient on the
grade 4 NAEP 2005 mathematics test as an example. NAEP estimated that 40
percent of Idaho’s students were At or Above Proficient, with a standard error of
1.6 percent. The formula Estimate ± (1.96 x Standard Error) defines a 95
percent confidence interval for a NAEP estimate. Figure 2 illustrates the 95
percent confidence interval for Idaho’s estimate of 40, which is about 37 to 43
(rounding to whole numbers). In short, we can be 95 percent sure that the
percentage of Idaho’s grade 4 students scoring At or Above Proficient on the NAEP
2005 mathematics test was somewhere between 37 percent and 43 percent.
It is apparent in Figure 2 that the linear regression did not “account for the
statistical uncertainty associated with test measurement error.” It simply
ignored it. The model cannot account for it. Perhaps Standard & Poor’s should
seek a statistical model that is more appropriate for analyzing NAEP data.
Page 5 of 15
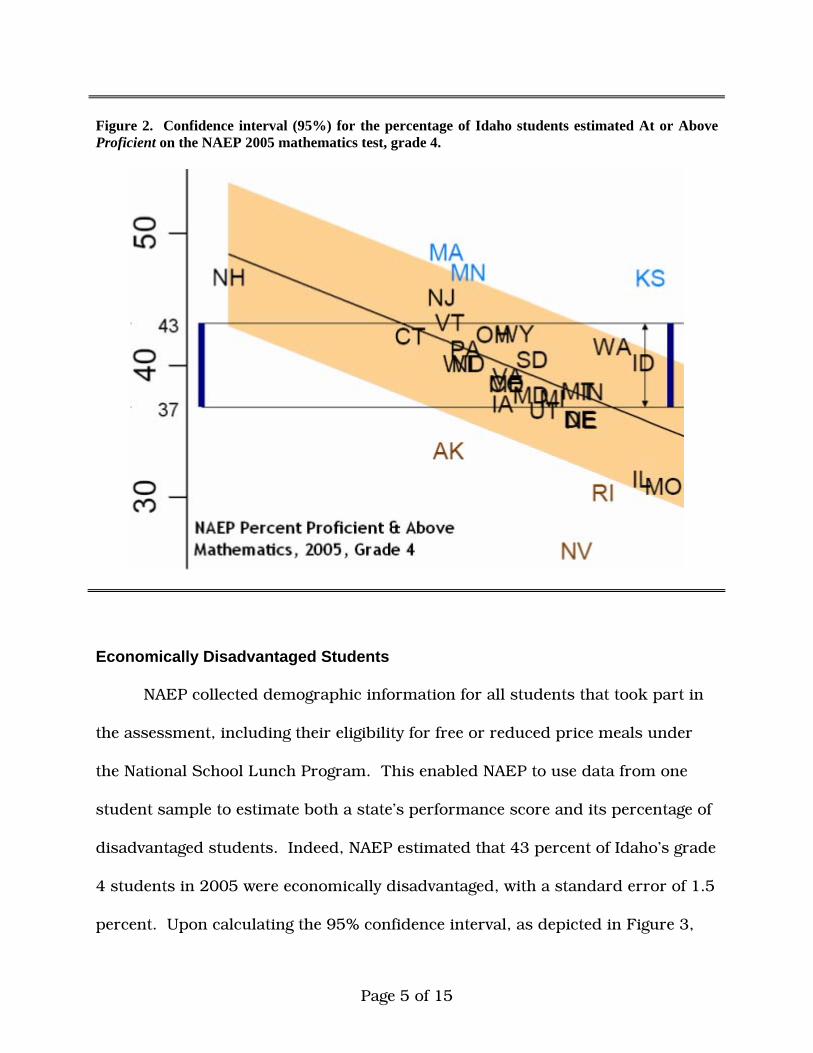
Figure 2. Confidence interval (95%) for the percentage of Idaho students estimated At or Above Proficient on the NAEP 2005 mathematics test, grade 4.
Economically Disadvantaged Students NAEP collected demographic information for all students that took part in
the assessment, including their eligibility for free or reduced price meals under
the National School Lunch Program. This enabled NAEP to use data from one
student sample to estimate both a state’s performance score and its percentage of
disadvantaged students. Indeed, NAEP estimated that 43 percent of Idaho’s grade
4 students in 2005 were economically disadvantaged, with a standard error of 1.5
percent. Upon calculating the 95% confidence interval, as depicted in Figure 3,

Page 6 of 15
Figure 3. The 2003-04 percentage of economically disadvantaged K-12 students in Idaho from the Common Core of Data, and the confidence interval (95%) for the percentage of economically disadvantaged grade 4 students in Idaho estimated from the NAEP 2005 mathematics test.
we can be 95 percent sure that the percentage of Idaho’s grade 4 students who
were economically disadvantaged in 2005 was between 40 and 46 percent.
Ignoring grade 4 estimates from the 2005 assessment, Standard & Poor’s
decided to use 2003-04 percentages of economically disadvantaged students in
grades K-12 listed in the Common Core of Data. As Figure 3 shows, the 2003-04
CCD percentage for Idaho students across K-12 (37) did not even fall within the
confidence interval of NAEP’s 2005 estimated percentage for Idaho grade 4
students (40 to 46). A state’s percentage of students in the National School Lunch

Page 7 of 15
Program across grades K-12 is typically lower than in grade 4 and higher than in
grade 8. Thus, this decision detracted from data accuracy at both grade levels,
just in different directions.
The intersection of the NAEP confidence intervals for the percentages of
students At or Above Proficient and economically disadvantaged are plotted on
Figure 4. The value for the grade 4 mathematics analysis that the report used for
Idaho is also plotted. It might be reasonably expected that the “actual” value for
Figure 4. Intersection of NAEP 2005 confidence intervals (95%) for percentage of Idaho students At or Above Proficient in grade 4 mathematics and percentage of economically disadvantaged students, and the “corresponding” value point used by Standard & Poor’s to represent Idaho.
Page 8 of 15
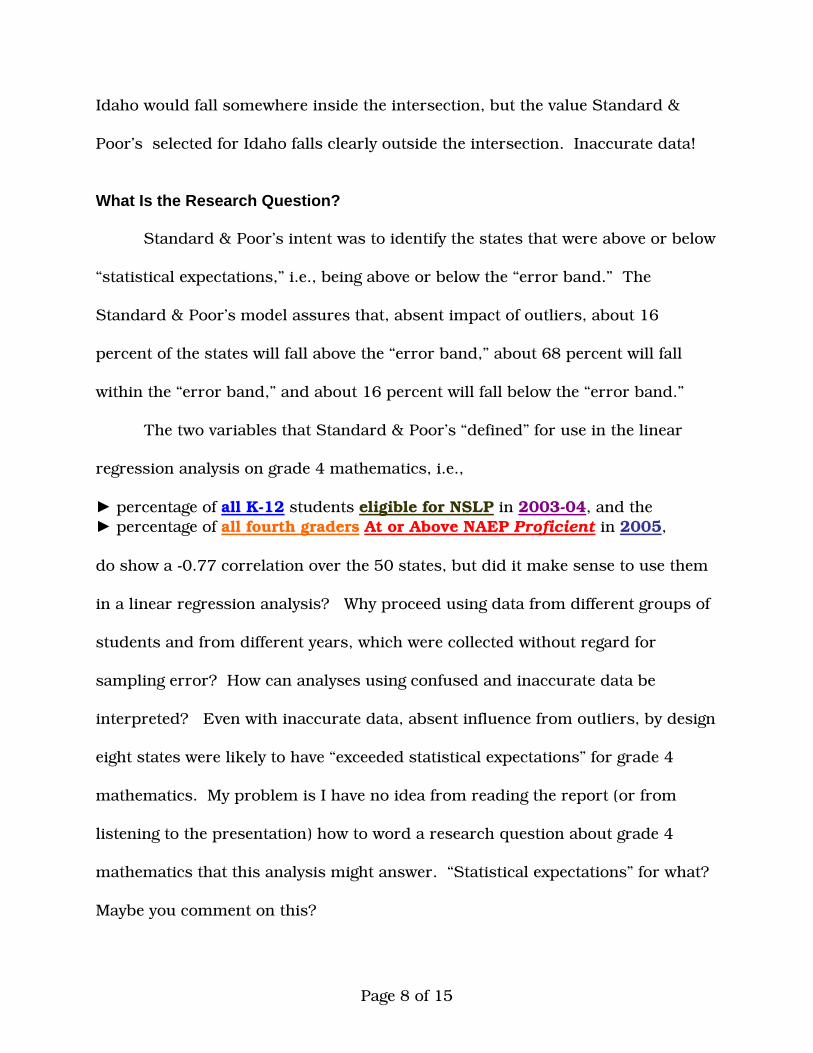
Idaho would fall somewhere inside the intersection, but the value Standard &
Poor’s selected for Idaho falls clearly outside the intersection. Inaccurate data!
What Is the Research Question? Standard & Poor’s intent was to identify the states that were above or below
“statistical expectations,” i.e., being above or below the “error band.” The
Standard & Poor’s model assures that, absent impact of outliers, about 16
percent of the states will fall above the “error band,” about 68 percent will fall
within the “error band,” and about 16 percent will fall below the “error band.”
The two variables that Standard & Poor’s “defined” for use in the linear
regression analysis on grade 4 mathematics, i.e.,
► percentage of all K-12 students eligible for NSLP in 2003-04, and the ► percentage of all fourth graders At or Above NAEP Proficient in 2005, do show a -0.77 correlation over the 50 states, but did it make sense to use them
in a linear regression analysis? Why proceed using data from different groups of
students and from different years, which were collected without regard for
sampling error? How can analyses using confused and inaccurate data be
interpreted? Even with inaccurate data, absent influence from outliers, by design
eight states were likely to have “exceeded statistical expectations” for grade 4
mathematics. My problem is I have no idea from reading the report (or from
listening to the presentation) how to word a research question about grade 4
mathematics that this analysis might answer. “Statistical expectations” for what?
Maybe you comment on this?

Page 9 of 15
Comparing State Performance Using NAEP, Another Way Linear regression is an unsuitable statistical method for analyzing NAEP data, but
appropriate statistical methods are available. The National Center for Education
Statistics (NCES), for example, has developed, and made available to the public,
an on-line tool known as the “NAEP Data Explorer” (NDE). Its URL is
http://nces.ed.gov/nationsreportcard/nde/
The NDE runs pair-wide t-tests, one test for each state against the nation.
To maintain a family probability level of .05, the NDE applies the Benjamini-
Hochberg False Discovery Rate.
Before going to the NDE, one should start the analysis by forming a
research question, such as:
How did the percentage of economically disadvantaged grade-4 students in each state who scored At or Above Proficient on the 2005 math assessment compare to the percentage of economically disadvantaged grade-4 students who scored At or Above Proficient in the nation as a whole?
The NDE will select the data needed to answer the question perform the
statistical analyses, and report the results. To answer the research question here,
the NDE will calculate for the nation and for each state two statistics: the percent
of students At or Above Proficient with its standard error. Only data generated by
students who qualify for free or reduced price meals under the National School
Lunch Program are used for the national and state calculations. The NDE then
uses these statistics to run 50 pair-wide t-tests followed by a correction to
preserve the family probability level of .05. Finally, the NDE prepares a map (see
Figure 5) painting the states into one of three categories: significantly higher than
Page 10 of 15
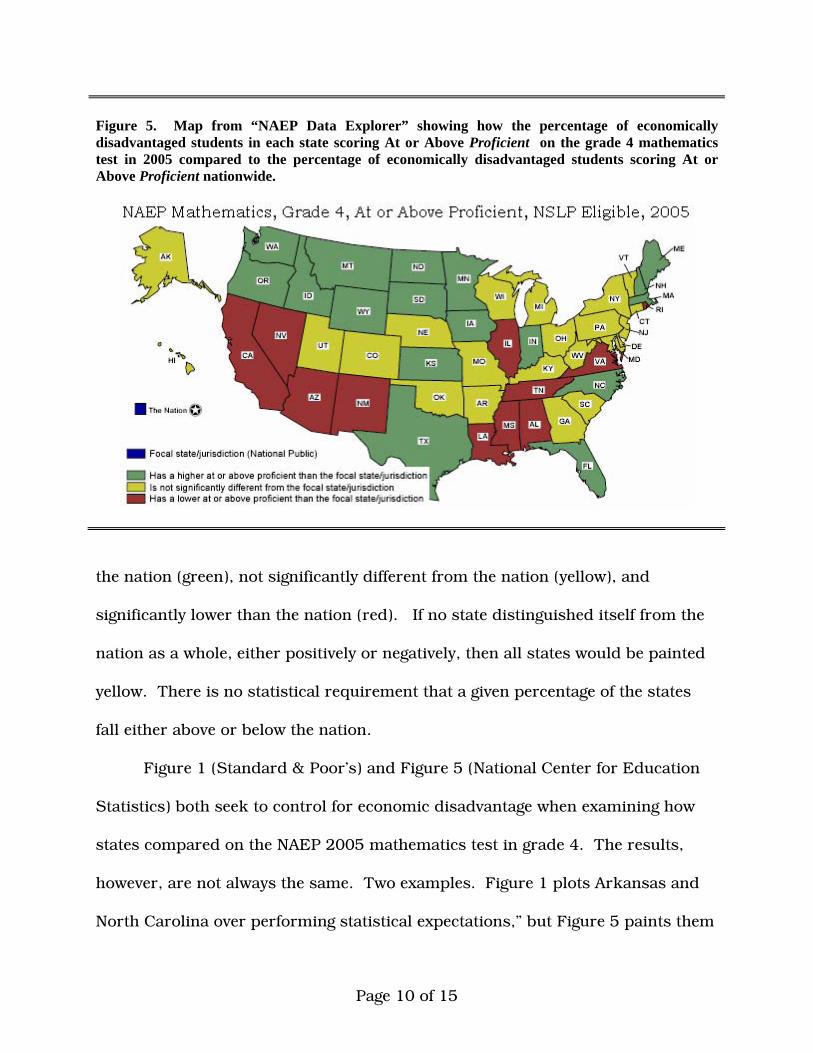
Figure 5. Map from “NAEP Data Explorer” showing how the percentage of economically disadvantaged students in each state scoring At or Above Proficient on the grade 4 mathematics test in 2005 compared to the percentage of economically disadvantaged students scoring At or Above Proficient nationwide.
the nation (green), not significantly different from the nation (yellow), and
significantly lower than the nation (red). If no state distinguished itself from the
nation as a whole, either positively or negatively, then all states would be painted
yellow. There is no statistical requirement that a given percentage of the states
fall either above or below the nation.
Figure 1 (Standard & Poor’s) and Figure 5 (National Center for Education
Statistics) both seek to control for economic disadvantage when examining how
states compared on the NAEP 2005 mathematics test in grade 4. The results,
however, are not always the same. Two examples. Figure 1 plots Arkansas and
North Carolina over performing statistical expectations,” but Figure 5 paints them

Page 11 of 15
as not significantly different from the nation. Figure 1 plots Alaska and Hawaii as
under performing “statistical expectations,” but Figure 5 paints them as not
significantly different from the nation.
NCLB, and At or Above NAEP Basic
The discussion thus far as focused on NAEP’s At or Above Proficient
performance level, but NCLB isn’t about NAEP Proficient. NCLB is about
Adequate Yearly Progress (AYP), and NAEP At or Above Basic is the appropriate
statistic when using NAEP to confirm state testing AYP results.
Figure 6 (reading) and 7 (mathematics) display the NDE maps showing the
percentage of economically disadvantaged grade-4 students in each state who
scored At or Above Basic on the 2005 NAEP assessments compared to their
counterparts nationwide.
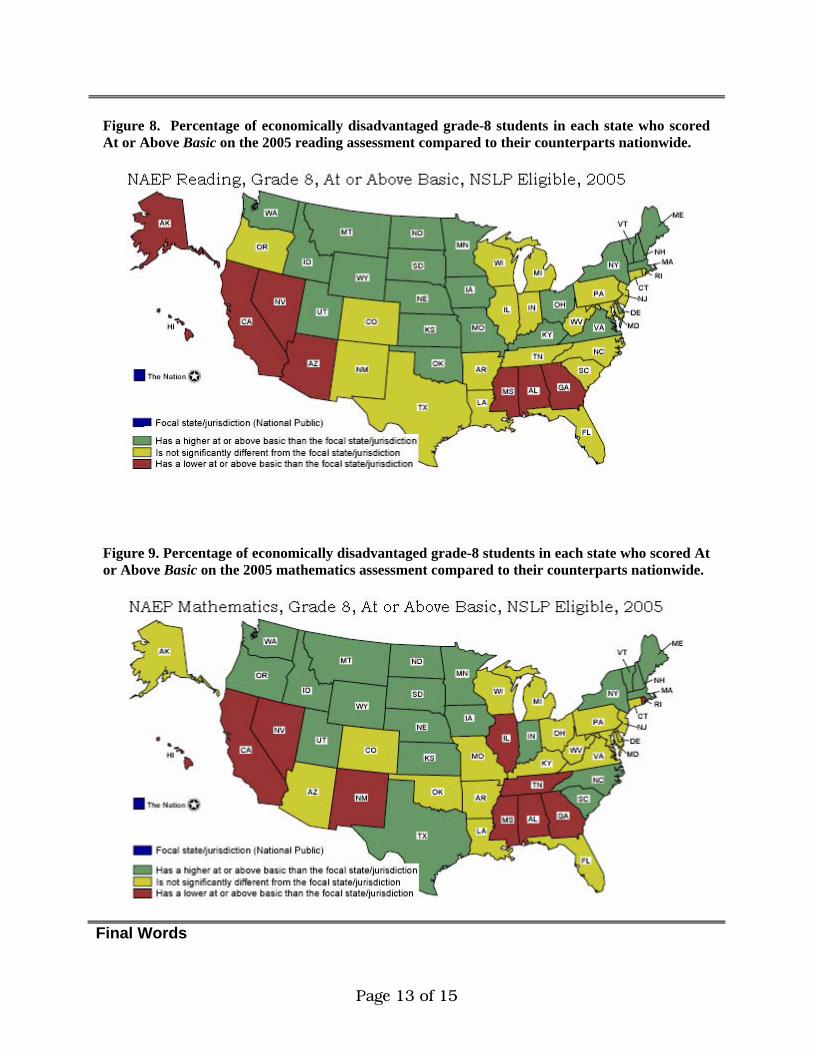
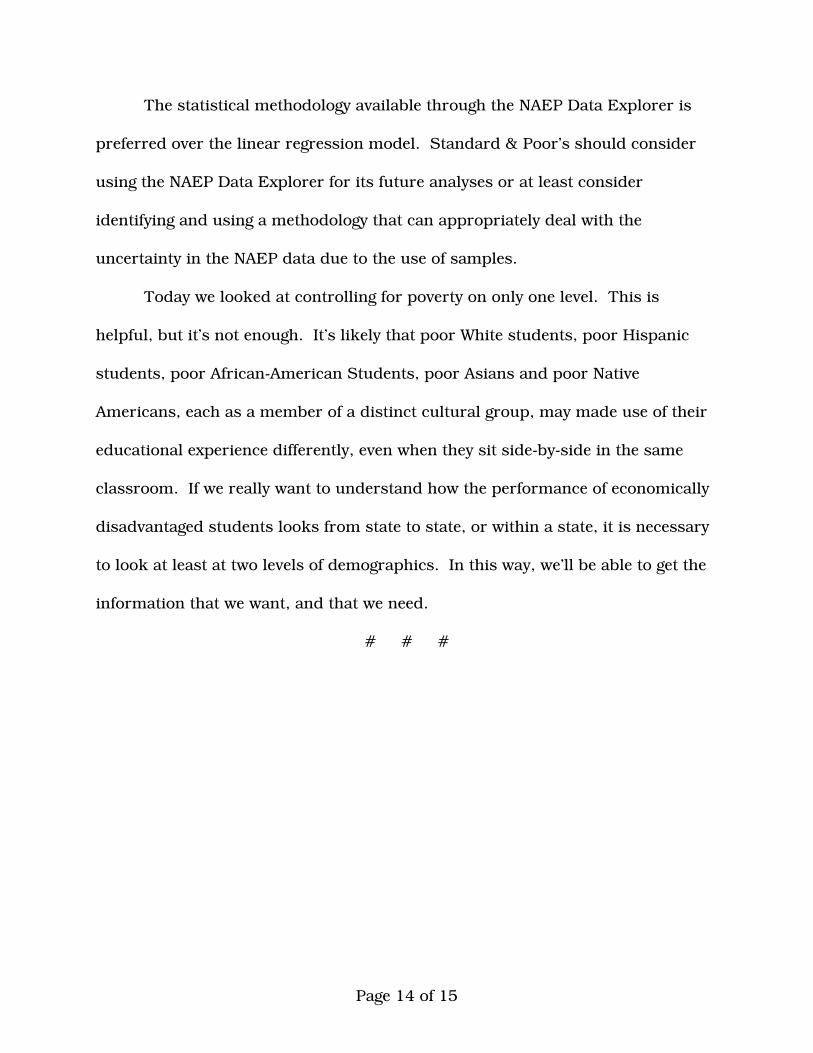
Figure 8 (reading) and 9 (mathematics) display the NDE maps showing the
percentage of economically disadvantaged grade-8 students in each state who
scored At or Above Basic on the 2005 NAEP assessments compared to their
counterparts nationwide.
We’ll move through these slides without comment. Find your state on each
slide; you’ll know immediately how well your economically disadvantaged
students are doing.

Page 12 of 15
Figure 6. Percentage of economically disadvantaged grade-4 students in each state who scored At or Above Basic on the 2005 reading assessment compared to their counterparts nationwide
Figure 7. Percentage of economically disadvantaged grade-4 students in each state who scored At or Above Basic on the 2005 mathematics assessment compared to their counterparts nationwide.
Page 13 of 15
Figure 8. Percentage of economically disadvantaged grade-8 students in each state who scored At or Above Basic on the 2005 reading assessment compared to their counterparts nationwide.
Figure 9. Percentage of economically disadvantaged grade-8 students in each state who scored At or Above Basic on the 2005 mathematics assessment compared to their counterparts nationwide.
Final Words
Page 14 of 15
The statistical methodology available through the NAEP Data Explorer is
preferred over the linear regression model. Standard & Poor’s should consider
using the NAEP Data Explorer for its future analyses or at least consider
identifying and using a methodology that can appropriately deal with the
uncertainty in the NAEP data due to the use of samples.
Today we looked at controlling for poverty on only one level. This is
helpful, but it’s not enough. It’s likely that poor White students, poor Hispanic
students, poor African-American Students, poor Asians and poor Native
Americans, each as a member of a distinct cultural group, may made use of their
educational experience differently, even when they sit side-by-side in the same
classroom. If we really want to understand how the performance of economically
disadvantaged students looks from state to state, or within a state, it is necessary
to look at least at two levels of demographics. In this way, we’ll be able to get the
information that we want, and that we need.
# # #

Page 15 of 15
References
Ad Hoc Committee on Confirming Test Results. (2002). Using the National Assessment of Educational Progress to Confirm State Test Results. Washington, D.C.: U.S. Department of Education, National Assessment Governing Board. Available online: http://www.nagb.org/pubs/color_document.pdf Gazzerro, P. (2006, January). Comparing State Performance under NCLB: Issues and Opportunities for Using NAEP. Presentation at the NAEP State Service Center Winter Workshop, La Jolla, California. Klein, B.D., and Rossin, D.F. (1999). Data Errors in Neural Network and Linear Regression Models: An Experimental Comparison. Data Quality Journal, 5(1). Available online: http://www.dataquality.com/1999KR.htm Mosquin, P., and Chromy, J. (2004). Federal Sample Sizes for Confirmation of State Tests in the No Child Left Behind Act. Washington, D.C.: American Institutes for Research, NAEP Validity Studies Panel. Available online: http://www.air.org/publications/documents/MosquinChromy_AIR1.pdf Runyon, R.P., and Haber, A. (1971). Fundamentals of Behavioral Statistics (2nd Ed.). Menlo Park, CA: Addison-Wesley Publishing Company. Standard & Poor’s School Evaluation Services. (2005, December). Leveling the Playing Field 2005: Identifying Outperforming and Underperforming States on the NAEP in Demographic Context. New York, NY: Author. Available online: http://www.schoolmatters.com Stoneberg, B.D. (2005). Please Don’t Use NAEP Scores to Rank Order the 50 States. Practical Assessment, Research & Evaluation, 10(9). Available online: http://pareonline.net/getvn.asp?v=10&n=9