southwick anguiano lmu-symposium_presentation_20140329
TRANSCRIPT
GRNsight: A Web Application for Visualizing Models of Gene Regulatory Networks
Britain Southwick
Nicole Anguiano
March 29, 2014
LMU Undergraduate Research Symposium

Outline
• Transcription factors interact with each other in a complex network of activation and repression.
• GRNmap , a network modeling and simulation application, does not generate a visualization of the network.
• GRNsight is an open source tool to create network graphs from the Excel spreadsheets used by GRNmap.
• Implementation consists of a web client for visualization and a server for reading uploaded spreadsheets.
• Future enhancements to GRNsight aim to include more GRN information in the graph visualization.
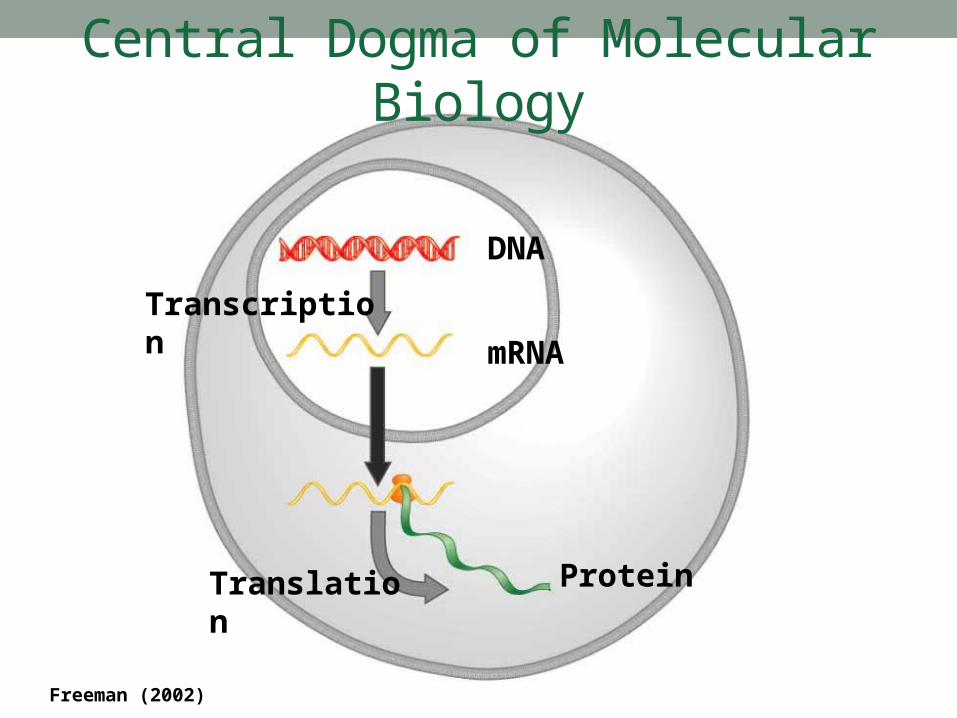
DNA
mRNA
Protein
Transcription
Translation
Freeman (2002)
Central Dogma of Molecular Biology
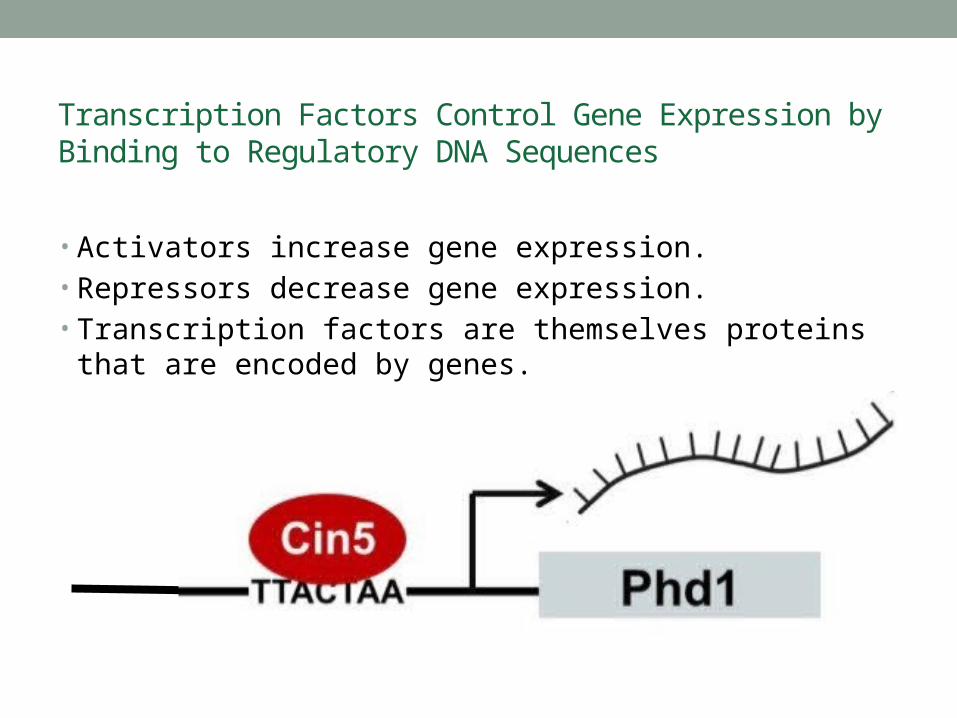
Transcription Factors Control Gene Expression by Binding to Regulatory DNA Sequences
• Activators increase gene expression.• Repressors decrease gene expression.• Transcription factors are themselves proteins that are encoded
by genes.

Gene Regulatory Networks Can Be Illustrated By Directed Graphs
• A gene regulatory network (GRN) consists of genes, transcription factors, and the regulatory connections between them, which govern the level of expression of mRNA and protein from those genes.
• Each node represents the gene, the mRNA, and the protein expressed from the gene.
• Each edge represents a regulatory relationship.• All of the nodes are transcription factors themselves.
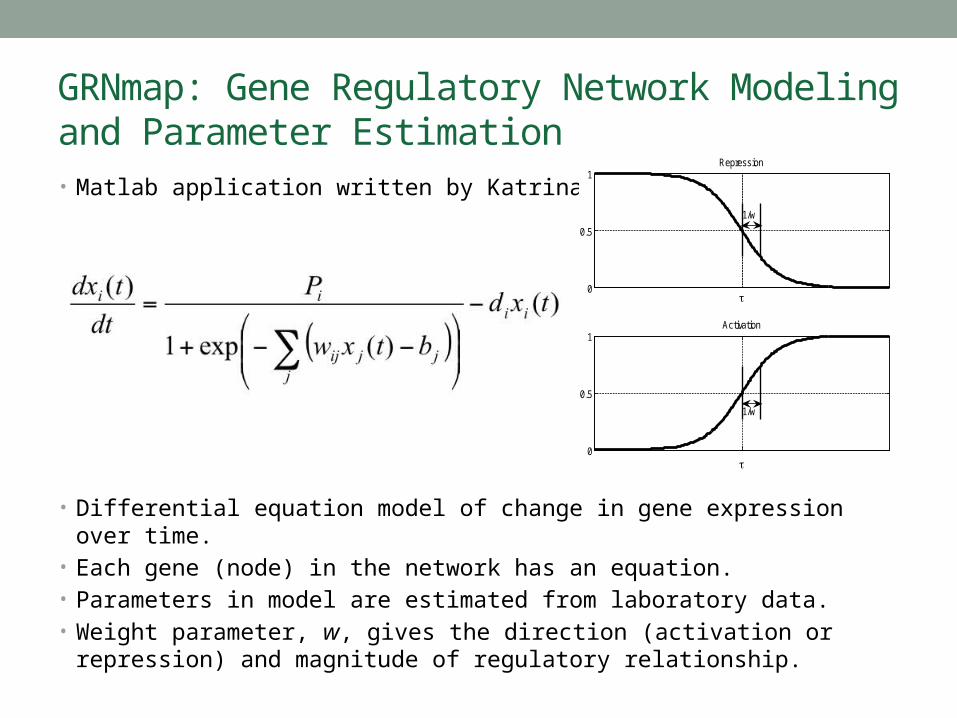
GRNmap: Gene Regulatory Network Modeling and Parameter Estimation• Matlab application written by Katrina Sherbina.
• Differential equation model of change in gene expression over time.• Each gene (node) in the network has an equation.• Parameters in model are estimated from laboratory data.• Weight parameter, w, gives the direction (activation or repression) and
magnitude of regulatory relationship.
0
0.5
1Activation
1/w
0
0.5
1Repression
1/w
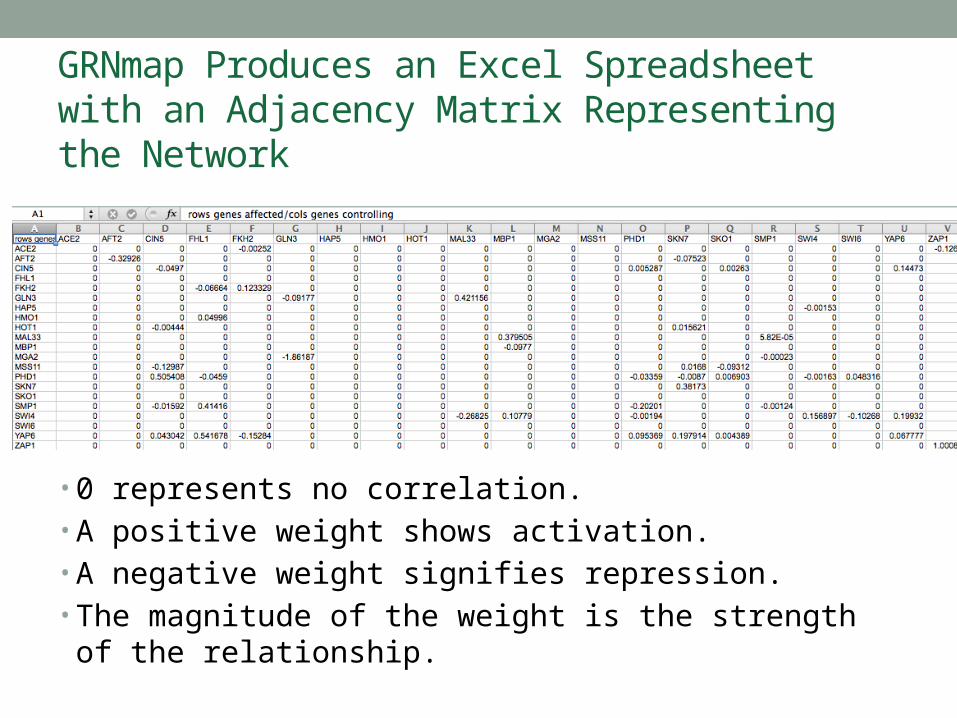
GRNmap Produces an Excel Spreadsheet with an Adjacency Matrix Representing the Network
• 0 represents no correlation.• A positive weight shows activation.• A negative weight signifies repression.• The magnitude of the weight is the strength of the
relationship.
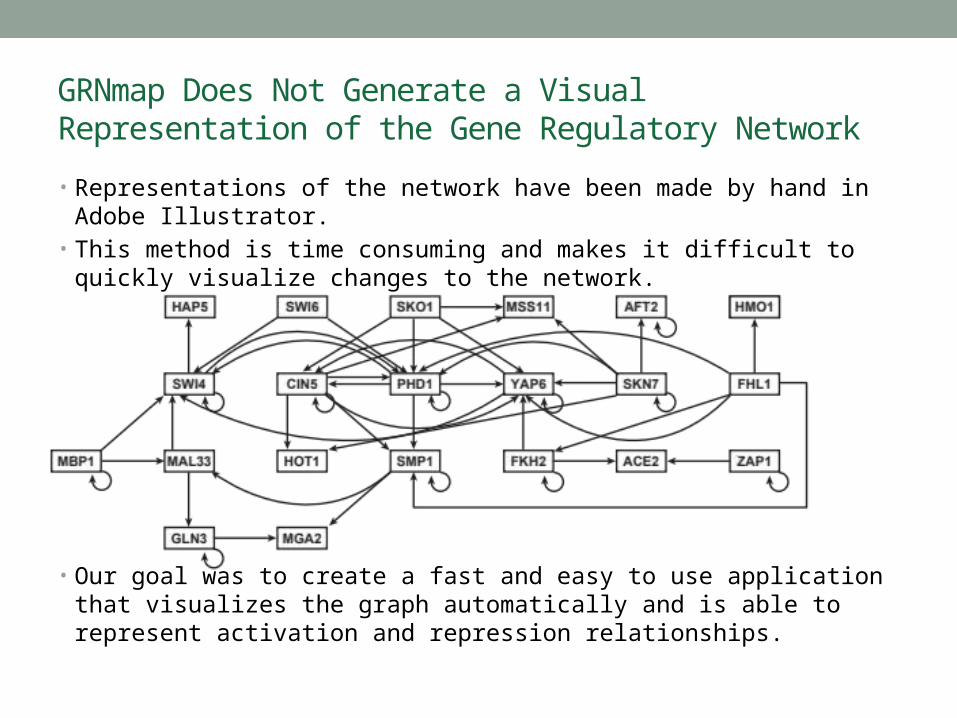
GRNmap Does Not Generate a Visual Representation of the Gene Regulatory Network
• Representations of the network have been made by hand in Adobe Illustrator.
• This method is time consuming and makes it difficult to quickly visualize changes to the network.
• Our goal was to create a fast and easy to use application that visualizes the graph automatically and is able to represent activation and repression relationships.
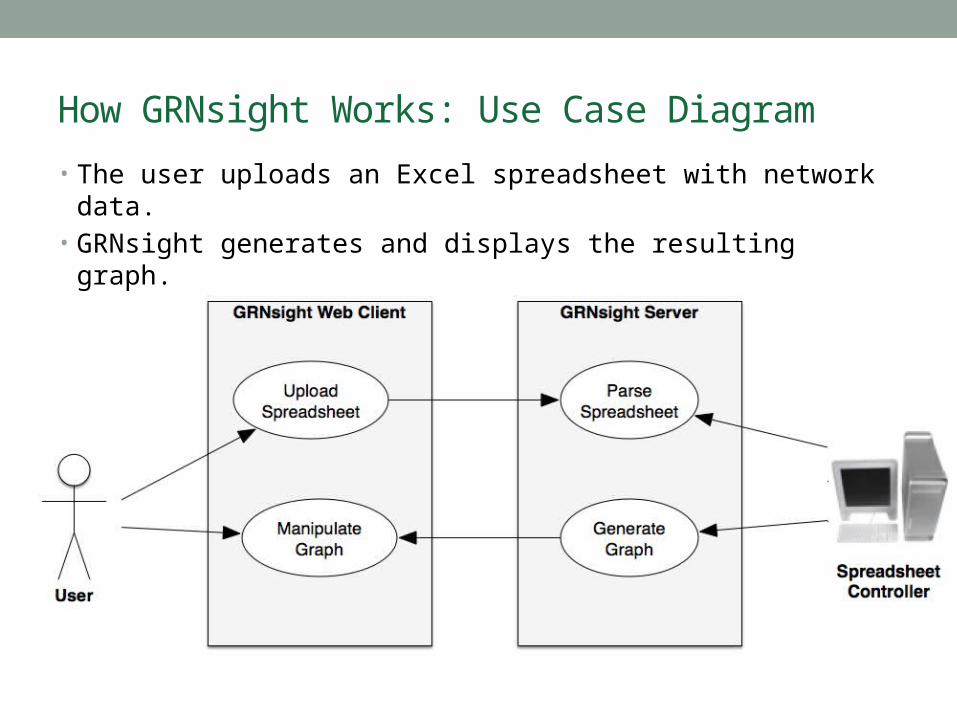
How GRNsight Works: Use Case Diagram
• The user uploads an Excel spreadsheet with network data.• GRNsight generates and displays the resulting graph.• The user can manipulate and refine the graph.
GRNsight Implementation Takes Advantage of Other Open Source Tools
• GRNsight uses the Data-Driven Documents (D3) JavaScript library to generate a graph derived from input network data.
• D3 dynamically manipulates HTML and Scalable Vector Graphics (SVG) to form the elements of the graph.
• D3 also allows for the fine tuning of Cascading Style Sheets (CSS), the code that styles web pages.
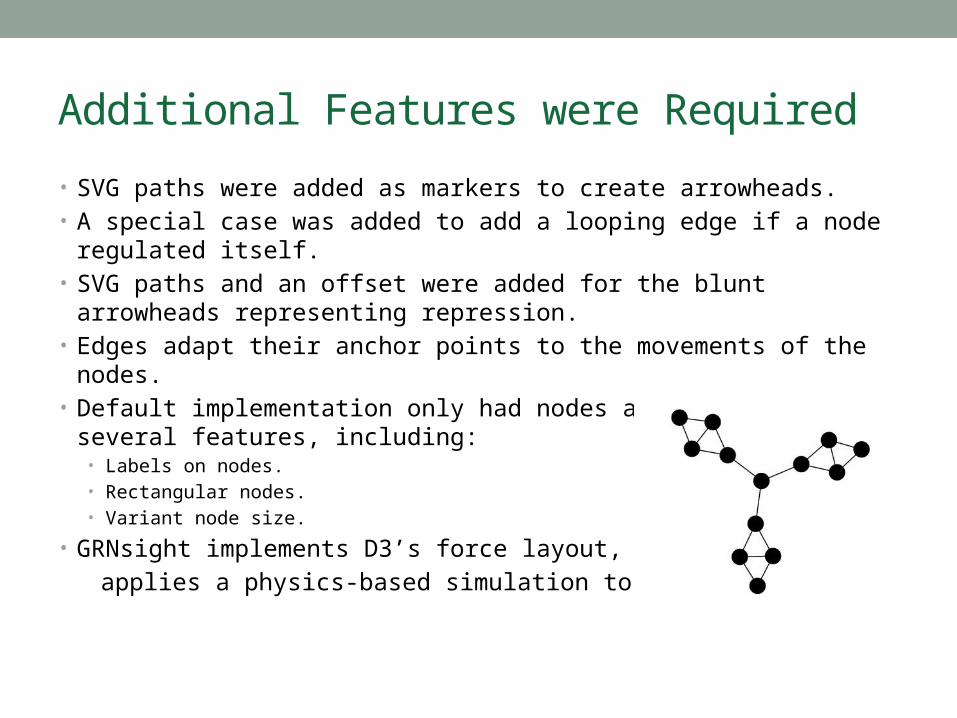
Additional Features were Required
• SVG paths were added as markers to create arrowheads.• A special case was added to add a looping edge if a node regulated itself.• SVG paths and an offset were added for the blunt arrowheads representing
repression.• Edges adapt their anchor points to the movements of the nodes. • Default implementation only had nodes and edges. We added several
features, including:• Labels on nodes.• Rectangular nodes.• Variant node size.
• GRNsight implements D3’s force layout, which
applies a physics-based simulation to the graph.
GRNsight has a Service-Oriented Architecture
• GRNsight has two pieces: a server and a web client.
• The server is responsible for receiving and parsing the spreadsheet.
• The web client receives data from the server and generates the graph visualization.
• GRNsight code is open source and available on GitHub.

The User Interface is Compatible with Firefox and Chrome Browsers• File upload via simple HTML form element• Nodes displayed as interactive SVG elements• Advanced users can utilize setting sliders to refine the visualization
• The link distance determines the minimum distance maintained between nodes.
• Nodes have a charge, which repels or attracts other nodes.• The charge distance determines at what range a node’s charge
will affect other nodes.
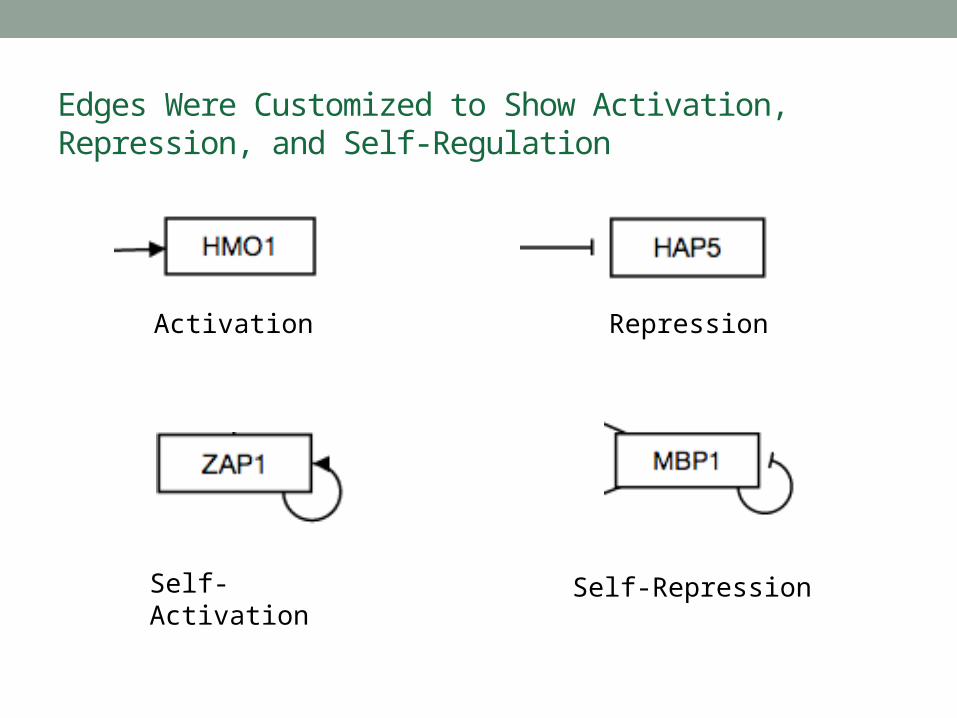
Edges Were Customized to Show Activation, Repression, and Self-Regulation
Self-Activation
RepressionActivation
Self-Repression
Accomplishments to Date• GRNsight allows the user to upload a spreadsheet and
generate a graph.• The user can drag nodes to customize their view of the
network.• The graph is able to represent the different types of edges
(activation, repression, and self-regulation). • The sliders allow the user to customize the force
parameters of the graph.• Customized the style of the nodes.• Hosted on dondi.github.io/GRNsight/demo
Demonstration
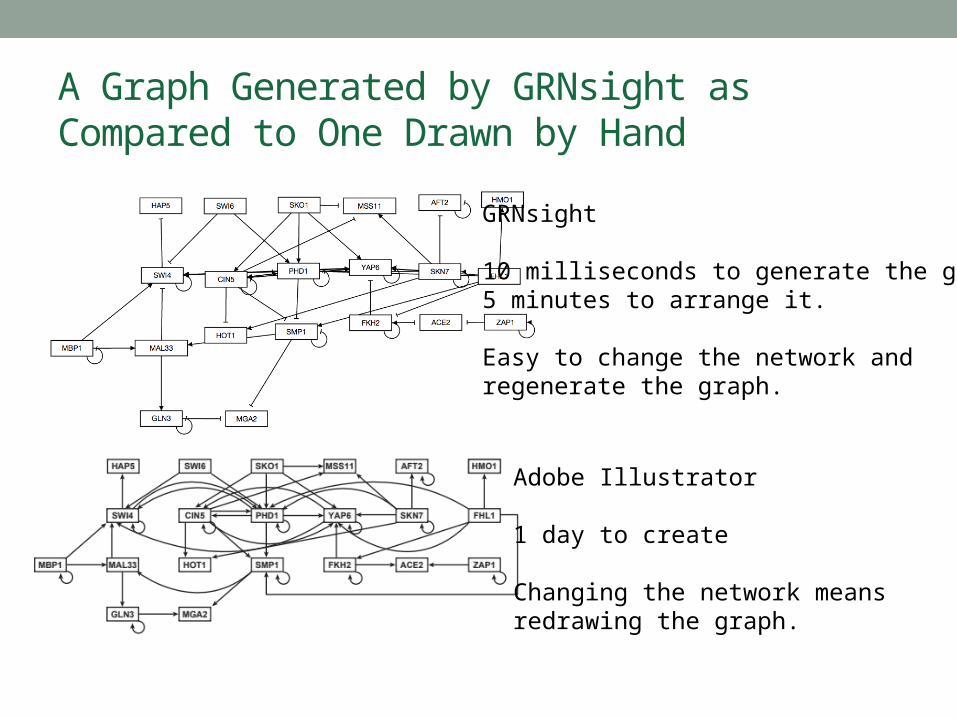
A Graph Generated by GRNsight as Compared to One Drawn by Hand
GRNsight
10 milliseconds to generate the graph5 minutes to arrange it.
Easy to change the network andregenerate the graph.
Adobe Illustrator
1 day to create
Changing the network means redrawing the graph.
Future Goals• Vary the thickness of edges based on magnitude of
weight.• Vary the color of edges based on type of relation
(activation or repression).• Change the background color of nodes based on the
expression data.• Snapping nodes to a rough grid would improve the
organization of the graph.• Implementing edges that curve around other nodes would
increase the readability of the graph.
Summary
• Transcription factors interact with each other in a complex network of activation and repression.
• GRNmap , a network modeling and simulation application, does not generate a visualization of the network.
• GRNsight is an open source tool to create network graphs from the Excel spreadsheets used by GRNmap.
• Implementation consists of a web client for visualization and a server for reading uploaded spreadsheets.
• Future enhancements to GRNsight aim to include more GRN information in the graph visualization.
Thanks
• Dr. Kam Dahlquist• Dr. John Dionisio• Dr. Ben Fitzpatrick• Katrina Sherbina• Masao Kitamura