screen time infographic: are we addicted to technology?
TRANSCRIPT
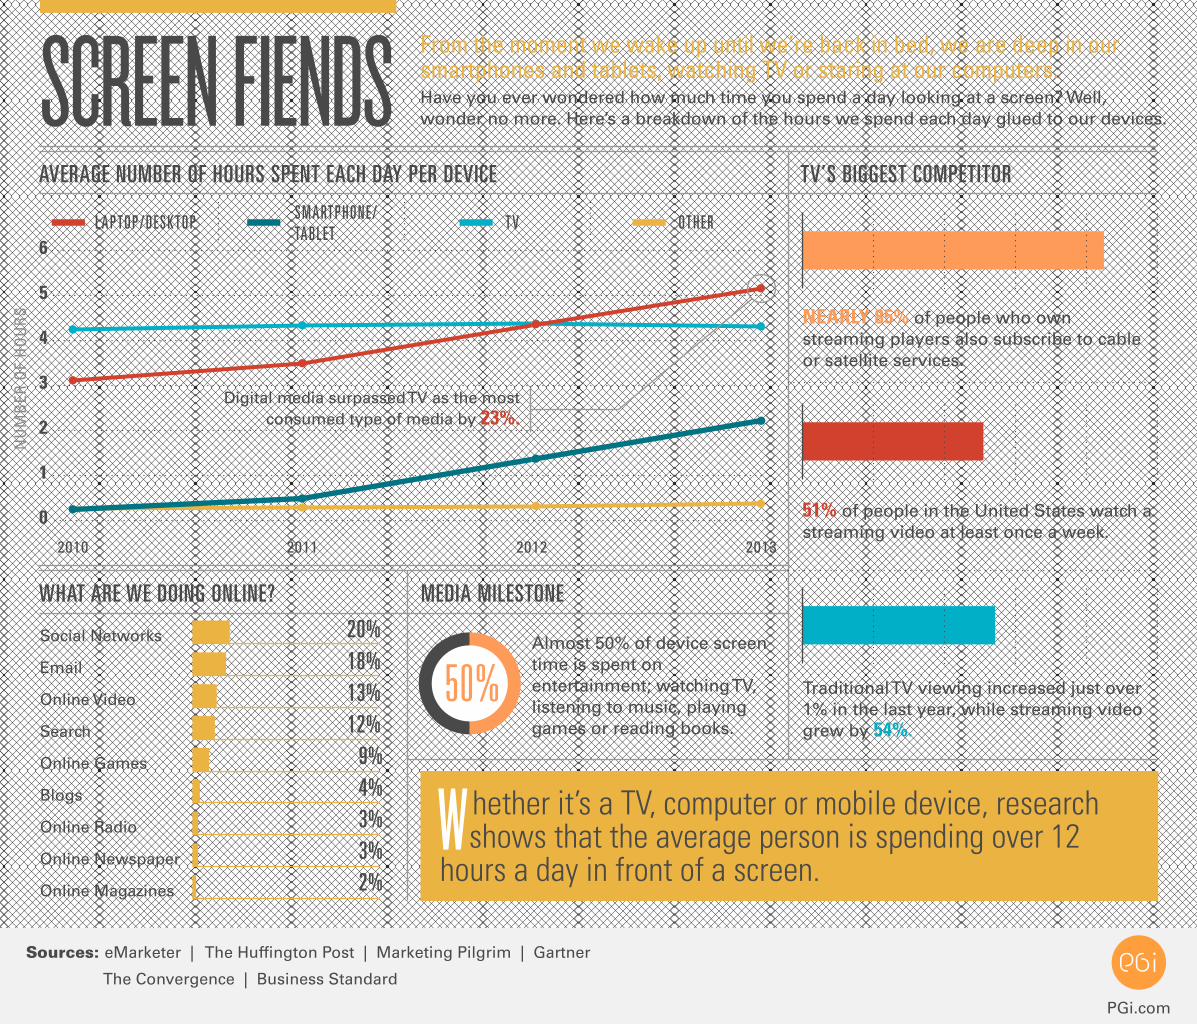
From the moment we wake up until we’re back in bed, we are deep in our smartphones and tablets, watching TV or staring at our computers. Have you ever wondered how much time you spend a day looking at a screen? Well, wonder no more. Here’s a breakdown of the hours we spend each day glued to our devices.
0
1
2
3
4
5
6
2013201220112010
SCREEN FIENDS
W
T VS M A RT P H O N E /TA B L E T
L A P T O P / D E S K T O P
AVERAGE NUMBER OF HOURS SPENT EACH DAY PER DEVICE
O T H E R
NU
MB
ER O
F H
OU
RS
Online Video
Search
Online Games
Blogs
Online Radio
Online Newspaper
Online Magazines
Social Networks 20%18%13%12%
9%4%3%3%2%
hether it’s a TV, computer or mobile device, research shows that the average person is spending over 12
hours a day in front of a screen.
MEDIA MILESTONEWHAT ARE WE DOING ONLINE?
TV’S BIGGEST COMPETITOR
Almost 50% of device screen time is spent on entertainment; watching TV, listening to music, playing games or reading books.
50% Traditional TV viewing increased just over 1% in the last year, while streaming video grew by 54%.
NEARLY 85% of people who own streaming players also subscribe to cable or satellite services.
51% of people in the United States watch a streaming video at least once a week.
Sources: eMarketer | The Huffington Post | Marketing Pilgrim | Gartner
The Convergence | Business Standard
Digital media surpassed TV as the most consumed type of media by 23%.
PGi.com