mlo -.17 23 a
TRANSCRIPT

MLO »T/Ü -.17 23 A ^ -< - .&3-^
FORCING FONCTIONS IN GREENHOUSE CLIMATE
AND THEIR EFFECT ON TRANSPIRATION OF CROPS
Cecilia Stanghellini
ABSTRACT
The effect of various climatic factors on transpiration rates is shown. Incoming
shortwave radiation is shown to have a predominant influence only in late spring
and summer and on clear winter days.
Pipe heating plays a very important role in all other conditions: transpiration
rates appear to adapt swiftly (more swiftly than temperatures) to an increased
energy supply from the heating system.
Natural ventilation can be very important in some cases, when ventilation induces
a large decrease in vapour content inside the house. Transpiration rates are
shown to react immediately to artificial irradiation at night and in correspon
ding radiation to reach swiftly a level comparable to diurnal levels. Although
the presence of a screen is sure to play a role in vapour management in green
houses, the properties of the screen tested as well as the lack of a control,
only allow the conclusion that the presence of a screen appears to affect vapour
transfer coefficients not only for the greenhouse as a whole, but also in the
screened compartment.
A short experimental run was also performed in order to detect second-order fluc
tuations in transpiration rates caused by rhythmus in stomatal openings induced by
climatic variations, but the set-up used only allows the conclusion that, if
this effect is present, it occurs at levels deemed irrelevant for the present
research.
CENTRALE LANDBOUWCATALOGUS ~ * ~
0000 0935 5781


CONTENTS
Page
Abstract 1
Symbols 4
1. Introduction 5
2. Materials and methods 10
2.1. Experimental set-up 10
2.2. Collection and processing of transpiration data 12
3. Results 17
3.1. Incoming shortwave radiation 17
3.2. Pipe heating 25
3.3. Natural ventilation 32
3.4. Artificial irradiation at night 37
3.5. Screens 40
3.6. Possible rhythms in stomatal opening 46
4. Conclusions 50
Acknowledgements 51
References 52
3 -

SYMBOLS
Only the symbols used more than once are shown here.
—2
A = energy output from the heating system Wm — 3
C = vapour concentration in the air gm va
— 3
C = vapour concentration at the evaporating surface gm
e = drag coefficient
E = evaporation rate kg m s
E0 = potential evaporation kg m s-1
E = evaporation rate from vegetation kg m s — 2
G = flux of heat into the soil Wm
g = acceleration due to gravity
H = sensible heat flux Wm 2
a = sensible heat flux from the heating system Wm
L = latent heat of vaporization of water J kg
LAI = leaf area index
I = leaf area density m 1
P = LE/S — 2
R = radiative heat flux from the heating system Wm R = net radiation Wm 2
n _i
r„ = resistance to heat transfer in the air s m Ha
v = resistance to vapour transfer in the air s m va
r = resistance to vapour and water transfer in the plant s m VP _2
S = shortwave radiation flux on a horizontal surface Wm
u = air velocity ms
W = weight kg
p = density of air kg m
4 -

1. INTRODUCTION
Vapour production is a large sink for energy in greenhouses. During an important
part of the growing season, some of that energy is artificially supplied by a
heating system. Excessive release of water vapour by plants causes additional
difficulties, as well as being a waste of energy, in new greenhouses that are
designed to minimize energy losses to the external environment. The design
criteria of these greenhouses involve both the use of insulating techniques
and the reduction of air leakages. Thus less vapour condenses because of the
higher minimum temperatures of greenhouse components, and less vapour can be
removed by natural ventilation, so that in such greenhouses a grower has to
deal with a humidity that is much too high, which is known to be deleterious
for plant growth.
It appears that more needs to be known about the effectiveness of both natural
and artificial forcing functions on crop transpiration in greenhouses, for two
reasons :
- if a grower is to be able to reduce energy waste from transpiration, the
relevant independent variables and their relationship with transpiration
must be identified.
- for the most efficient use of climate control techniques, the interrelation
between different forcing functions and the rate of vapour production should
be known.
Note that the grower may also have to take action to boost transpiration to the
level required by the expected crop growth rate. The appraisal of the many
interrelated effects on transpiration in greenhouses could contribute to a more
sound management of greenhouse climate.
The sum of transpiration (i.e. vapour lost to the surrounding air via the plant)
and evaporation from the underlying ground is usually termed évapotranspiration.
The potential évapotranspiration (E 0) of a canopy is the rate at which water
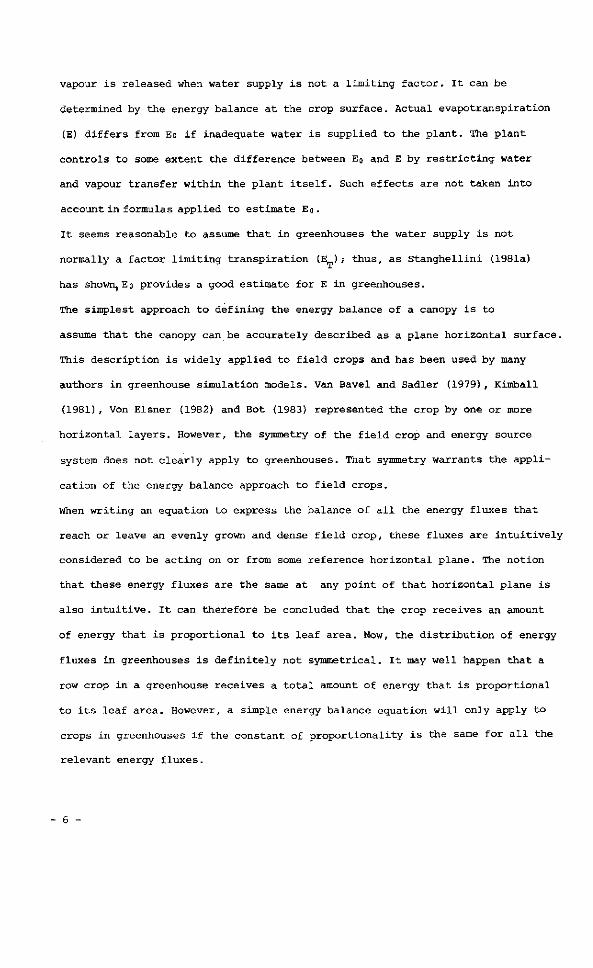
vapour is released when water supply is not a limiting factor. It can be
determined by the energy balance at the crop surface. Actual évapotranspiration
(E) differs from Eo if inadequate water is supplied to the plant. The plant
controls to some extent the difference between Eo and E by restricting water
and vapour transfer within the plant itself. Such effects are not taken into
account in formulas applied to estimate Eo.
It seems reasonable to assume that in greenhouses the water supply is not
normally a factor limiting transpiration (EL); thus, as Stanghellini (1981a)
has shown, Eo provides a good estimate for E in greenhouses.
The simplest approach to defining the energy balance of a canopy is to
assume that the canopy can be accurately described as a plane horizontal surface.
This description is widely applied to field crops and has been used by many
authors in greenhouse simulation models. Van Bavel and Sadler (1979) , Kimball
(1981), Von Eisner (1982) and Bot (1983) represented the crop by one or more
horizontal layers. However, the symmetry of the field crop and energy source
system does not clearly apply to greenhouses. That symmetry warrants the appli
cation of the energy balance approach to field crops.
When writing an equation to express the balance of all the energy fluxes that
reach or leave an evenly grown and dense field crop, these fluxes are intuitively
considered to be acting on or from some reference horizontal plane. The notion
that these energy fluxes are the same at any point of that horizontal plane is
also intuitive. It can therefore be concluded that the crop receives an amount
of energy that is proportional to its leaf area. Now, the distribution of energy
fluxes in greenhouses is definitely not symmetrical. It may well happen that a
row crop in a greenhouse receives a total amount of energy that is proportional
to its leaf area. However, a simple energy balance equation will only apply to
crops in greenhouses if the constant of proportionality is the same for all the
relevant energy fluxes.
This contention is supported by Stanghellini's (1981a) observation of an agreement
between measured actual transpiration and values calculated by a simple combina
tion formula for Eo.
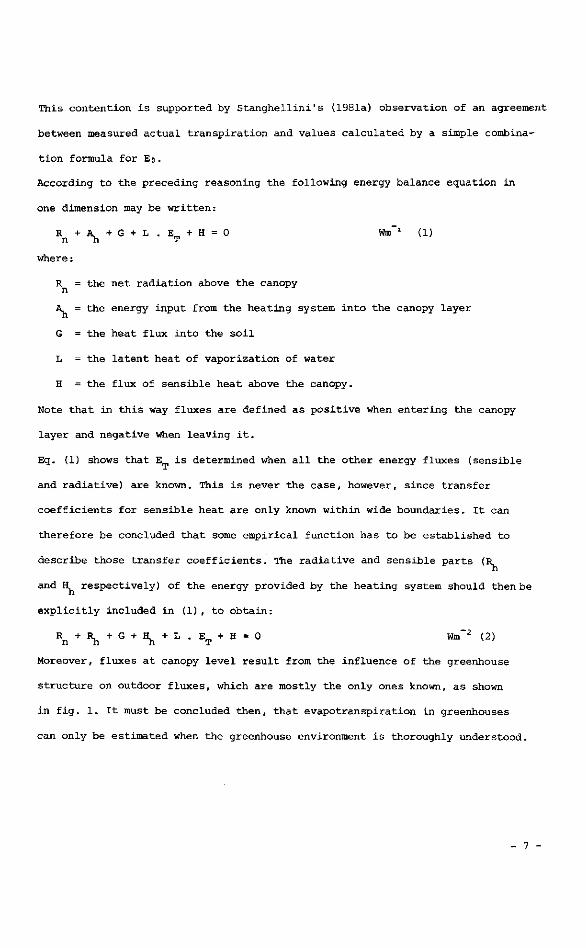
According to the preceding reasoning the following energy balance equation in
one dimension may be written:
R + A + G + L . E + H = 0 Wm~2 (1)
n h T where :
R = the net radiation above the canopy n
A, = the energy input from the heating system into the canopy layer
G = the heat flux into the soil
L = the latent heat of vaporization of water
H = the flux of sensible heat above the canopy.
Note that in this way fluxes are defined as positive when entering the canopy
layer and negative when leaving it.
Eq. (1) shows that E is determined when all the other energy fluxes (sensible
and radiative) are known. This is never the case, however, since transfer
coefficients for sensible heat are only known within wide boundaries. It can
therefore be concluded that some empirical function has to be established to
describe those transfer coefficients. The radiative and sensible parts (R
and H respectively) of the energy provided by the heating system should then be
explicitly included in (1), to obtain:
R + R + G + a + L . E + H = 0 Wm~2 (2)
Moreover, fluxes at canopy level result from the influence of the greenhouse
structure on outdoor fluxes, which are mostly the only ones known, as shown
in fig. 1. It must be concluded then, that évapotranspiration in greenhouses
can only be estimated when the greenhouse environment is thoroughly understood.
7 -

Ft radiation
H sensible heat
A absorption
ET évapotranspiration
R re f lect ion
Fig . 1 - Schematic r ep re sen ta t ion of energy f luxes in a greenhouse. C i rc led numbers
give the approximate po s i t i on of ins t ruments used in t he p resen t experiment
(for i ns t ruments , see f i g . 2 ) . Items 3 , 4 , 5 and 6 were i n s t a l l e d a t var ious
l o ca t i ons and a t va r ious l e v e l s in t he greenhouse.

10
1
THERMOCOUPLES
HEAT FLUX PLATES
SOLARIMETERS
NET RADIOMETERS
AIR MOVEMENT METERS
PSYCHROMETERS
CO2 METER
WINDOW-OPENING METER
INFRARED THERMOMETER
> LYSIMETER
APPLE MICRO COMPUTER
WATER GIFT
DATA LOGGER
• / t s —>| FOR SOIL
VALUES
DATA LOGGER
FOR
CLIMATE
Fig. 2 - The connections between the various instruments and the data logger
systems. An extensive study of soil properties was part of a sub-project
and two data loggers were installed to allow for quite different scanning
intervals (30 min. for soil values). The lysimeter output was fed to a
microcomputer which, after high frequency filtering and differentiation,
provided the data logger with the E value. It also governed water gift to
the weighed plants.
- 9

2. MATERIALS AND METHODS
An experiment was set up in one of the greenhouses of the IMAG to study the
relationship between the energy balance of the crop and E , according to eq. (2).
The experiment was the result of co-operation between IMAG and the Department of
Physics and Meteorology of the Agricultural University in Wageningen.
2.1. Experimental set-up
The greenhouse is a single-glass, Venlo type, with eight spans oriented E-W.
Heating is provided by hot-water pipes (two pipes, a few centimetres above
ground level for each crop row, and one pipe at gutter level for each span);
natural ventilation takes place through roof ventilators. Measurements were
carried out in two successive years with tomato crops (cv. Sonatine and cv.
Marathon) grown on rockwool. Both soil and rockwool were covered with plastic
sheets, so that no evaporation could take place. Accordingly, when reference
is made to measured values, only transpiration is considered.
In the second year a screen consisting of transparent-lamellae was
erected in the house. A complete description of the experiment is given in
Stanghellini (1981b) and in Van 't Ooster (1983), and the instruments used are
indicated in fig. 2 and their position in the greenhouse is shown by the corres
ponding numbers on fig. 1. Some of the measurements indicated in fig. 2 were
taken at different positions in the greenhouse. Air dry and wet bulb tempera
tures, incoming shortwave radiation and net radiation were measured at five
levels within the glasshouse, and air velocity at four. Most of the measuring
devices were situated near the centre of the greenhouse, where E was also
measured,using a weighing lysimeter developed by the Technical University of
Twente (NL) (see fig. 3). That lysimeter has a maximum allowed load of 100 kg
and can measure weights with an accuracy of 0.1 g in a laboratory environment.
10

«,^r
Fig. 3 - The lysimeter, as installed, supporting a tray with 4 young plants.
The difference in weight charged over the two cylinders could be measured
with a lab. accuracy of 0.1 g (see text). Water was provided automatically,
when decrease of^ plant-side weight exceeded a fixed amount. The plants
were supported by a high frame, the lowest part of which can be seen on
the photo. Both tray and frame were constructed from aluminium, to ensure
minimal weight.
- 11 -

In the greenhouse set-up, actual accuracy did not exceed 0.3 g, because of
some influence of air movement (see § 2.2). The lysimeter was working on the
vent-out principle, in order to avoid the temperature-related problems encoun
tered in many previous experiments in greenhouses.
The lysimecter was placed in a pit dug in the ground, and supported a section
of a crop row that was in this way kept in line and at the same height as the
rest of the row. A complete description of the lysimeter and its set-up has been
given by Bot et al. (1983) and Dormans (1983).
The output provided by all the instruments was scanned by two dataloggers at
intervals of 1, 3 or 10 minutes - 30 minutes for soil values - (refer to fig. 2
with numbers to indicate a specific instrument) and stored on disc for further
processing. A micro-computer was installed between the lysimeter and the corres
ponding datalogger; this in addition to the high frequency (> 0.2 Hz) filtering
of the direct output signal of the lysimeter, also checked for cumulative trans
piration in order to provide the necessary water gift automatically (Reinders,
1982). A summary of transpiration results for the first season (January to July
1981) can be found in Stanghellini (1982a). Comparisons between measured and
estimated values of soil heat fluxes are summarized in Stanghellini (1981c) and
De Bruin (1983).
2.2. Collection and processing of transpiration data
There are two classes of lysimeters that work on quite different principles:
non-weighing and weighing. In general, it can be said that non-weighing
lysimeters are boxes for which every term of the water balance can be
measured so that evaporated water can be calculated from the water balance
equation :
E = p + I - D ± A W kg n f 2 t i m e _ 1 (3)
12 -

where :
p = precipitation
I = irrigation
D = drainage
Aw = variation in water content of the box.
Such lysimeters can provide accurate estimates of E for periods of time of
and exceeding 24 hours (Aboukhaled et al., 1982).
Weighing lysimeters directly measure E by the change in weight of the container,
when the amount and time of occurrence of water gift and drainage are known and
dry matter accumulated in the container is ignored.
In principle, the minimum interval of time between sampling only depends on
the accuracy of the weighing mechanism itself.
However, as Van Bavel and Myers (1962) pointed out, weighing lysimeters are
sensitive to the drag forces applied by the wind on the exposed surface. The mag
nitude of such forces can be estimated if it is assumed that the variation in
kinetic energy of a unit volume of air must be equal to the pressure exerted
on the leaf area contained in the same volume, multiplied by a drag coefficient,
generally less than 1.
f =AEk = ad . ip (u\ - u\) kg m 2 s - 2 (4)
where :
F = the force exerted on the leaf area contained in a unit volume.
A R = the variation in kinetic energy of the air contained in the same
volume, between time to and t \ .
a, = a drag coefficient
p = the air mass contained in a unit volume
U\ and Un are air velocity at times ti and to, respectively
- 13

of variations of air velocity 0.01 ms 1, around a mean value of 0.1 — 1
The corresponding variation in measured weight W is then F divided by
the acceleration of gravity g :
AW = cd i p | (ul - ul) kg (5)
if one takes a s 0.5 (Monteith, 1975), 1 = 5 (one fully grown tomato plant has
a total leaf area of circa 1.5-2 m2 and occupies circa 0.35 m 3 ) , and semi-amplitude
ms
eq. (5) yields Aw=0.6 g. Then (in the given set-up) it can indeed be assumed
that air movement imposes a limit on the accuracy of evaporation measurements,
which is not related to the accuracy of the balance itself (0.1 g, as said in
§ 2.1).
In the present set-up, measurements were only taken when no water was given
(when this occurred the microcomputer fed a flag value to the scanner) and no
drainage was allowed. In this case E is derived from:
E = Wp - Wi ± AWo ± AWj _j (to,*i) *l - *o k<3 s (6)
where :
(t0,ii) i s t h e évapotranspiration occurring in the time period from to to t\
W„, W. are the measured weights at instants t0 and tx, respectively
AW0, AWx are the errors on each weight measurement.
Note that systematic errors of the weighing device can be neglected. The
relative error is then:
A E AWoI + AWi Wo - Wi
(7)
and since AW is given (eq. 5) the only way to reduce the relative error is to
have larger W 0 - Wl f either by increasing the expected evaporation rate (larger
container, more plants) or increasing the length of the time periods. In the
present experiment, containers with 4, 6 or 8 plants were used, as well as
14 -

time periods of 1, 3 and 10 minutes. If one takes, as an example, a very
low E rate: 3.6 g . plant . hour (as measured in the present experiment
during some nights with young tomato plants), and |AWo| + |AWi| = 0.6 g (eq. 5 ) ,
it follows from (7) that the relative error in this case could rise from
12.5% (8 plants, 10 minutes) up to 250% (4 plants, 1 minute).
For this reason, the number of plants on the lysimeter, the scan interval
and the corresponding accuracy estimated by (5) will henceforth be given for
each result mentioned.
Transpiration rates will be given in power units (W.m 2 ) , i.e. measured weight
loss multiplied by L = 2.451.10 J.kg (latent heat of vaporization of water
at 20°C) and divided by an effective lysimeter area defined as follows. Since
no evaporation could take place from the covered soil surface, the area corres
ponding to the number of plants on the lysimeter, with the plant density of
2 m as used, was assumed to be the effective lysimeter area.
- 15

•o £ 17 18
hours
Fig. 4 - Incoming shortwave radiation measured during a bright winter day, above
the house, and above and below the canopy, respectively. The graph of each
variable is shown by a particular type of line. The name of each variable,
underlined by its appropriate line, is given near the y-axis (Stanghellini,
1982b) .
The crop had been planted one month previously, and was still very open.
Note the poor relationship between radiation as measured outside and as
picked up by a sensor below the roof. Transmissivity exceeding 100% in early
afternoon could be due to reflection from the aluminium structure of the
roof.
16

3. RESULTS
The data collected are still being analysed and therefore no final conclusions
can yet be drawn. Accordingly, only some experimental runs will be presented
and discussed below. The purpose of the present report is to provide a prelimi
nary insight into the level and pattern of transpiration rates during short
periods of time and of the obvious relationship between transpiration and green
house climate. The effect of the various parameters that affect the transpiration
rate will be analysed and, as far as possible, the effect of each parameter will
be studied independently. The discussion will be focused on the direct or indirect
effect on transpiration rates, of variations in the parameters that are most
commonly either the triggers or targets of climate control procedures.
3.1. Incoming shortwave radiation
The strict relationship between E and incoming shortwave radiation is well
established. It is a consequence of the fact that even in winter and at high
latitudes sun radiation is the largest single term in the daily energy balance
of a greenhouse, with the consequence that R is the most important term in the
left-hand side of (1).
It is apposite to note that incoming shortwave radiation is here understood to
be the radiation at the top of the canopy. Thus in the calculations it would
be correct to use the amount of radiation measured there. A single sensor,
or a few sensors directly below the roof, however, are scarcely representative
of a whole canopy, because of the effects of shadows and reflections, as fig. 4
shows. The most common procedure is to measure incoming solar radiation above
the roof and to correct it for the average transmissivity of the house. This
was done in the present investigation.
Morris et al. (1957), Lake et al. (1966), Stanhill and Schölte Albers (1974),
- 17 -

_2 Table I Summary of measured values for some 1981 runs. LE is in Wm and
S is shortwave radiation inside the house. Daytime is defined as
-2 measured shortwave radiation outside the house exceeding 3 Wm
Transpiration in the last column is shown per unit ground area (and
not leaf area) to facilitate comparison with literature.
Date L.E /LAI L.E /S.LAI L.E /S night time day time 24 hours
0.35 0.35
0.21 0.20
0.16 0.20
0.21 0.23
0.33 0.41
0.25 0.24
0.52 0.57
0.51 0.81
0.32 0.44
0.30 0.43
0.34 0.36
0.33 0.31
0.48 0.77
0.26 0.38
0.36 0.45
0.33 0.49
0.23 0.30
0.28 0.40
0.28 0.38
0.42 0.53
0.55 0.76
31.1.1981
11.2
20.2
24.2
27.2
1.3
5 .3
13.3
14.3
24.3
27.3
28.3
3.4
4 . 4
10.4
11.4
16.4
17.4
12.5
3 .7
10.7
3.83
6.07
6.76
5.21
6.99
4.02
14.55
8.51
9.20
6.95
6.56
4.89
6.75
7.83
4.36
3.31
5.54
6 . 2
4.92
4.66
6.28
- 18

de Graaf and v.d. Ende (1981) presented évapotranspiration values measured
daily or weekly. These authors used measurements to derive experimental
relationships between E and the shortwave radiation received during a corres
ponding time period in the form:
L E = as + b Wm~2 (8)
where :
S = shortwave radiation received inside the house
a,b = regression coefficients
b can be thought as the amount of E that does not depend on sun radiation, while
a is some "efficiency of use" of radiation for E. The coefficient a has been
reported to increase with soil cover; in some cases reported by Morris et al.
(1957) it even exceeded 1. Their experiment, however, was performed on a few,
tall tomato plants, almost free from any surrounding canopy, with the result
that the leaf area exposed was greater than the corresponding ground area
considered in calculating E per unit area. Thus it can be concluded that the
representativeness of (1) for energy exchanges at canopy level, i.e. whether
the plane symmetry applies or not, must always be checked. Generally speaking,
a higher correlation is to be expected when the amount of available radiation
increases: the more radiation there is, the smaller the role of the other energy
fluxes in the behaviour of E.
A quantity also commonly used in literature is the ratio P between E and sun
radiation inside the house S (i.e. a in (8) if b = 0 ) . The measured average
transmissivity of the greenhouse of 67% (v.d. Kieboom, 1981) can be used to
evaluate P for the present experiment. Values of P for the 1981 runs are shown
in Table I against leaf area index (LAI). The latter was estimated with the method
described by v.d. Varst and Postel (1972) . Most of the values of P in Table I are
lower than comparable values found in literature; see, for instance, a review
19 -

500
Si 400
300 •
E
c o
200
100
10 I l 12 13 14 21 FEB 1981
16 17 18 hours
Fig. 5 - Transpiration, incoming shortwave radiation outside the house and
temperature of heating pipes for a bright, cold winter day. Units
for each variable must be read from the axis near which its name is
shown; note that transpiration values are multiplied by 10, to be
comparable with radiation values. Two of the four troughs in
transpiration occurred in the first valid scan after water gift:
it is very possible that some drops fell on the lysimeter even
after the valve was closed. The set-up here (as in the whole 1981
experiment) was 4 plants with a 10-minute interval between scans.
This corresponds to an accuracy of 1.2 Wm~2. LAI was 0.97, canopy
height was 73 cm. Temperature and moisture functions inside the
house for the same day are given in fig. 10.
- 20

E i 500
Bi
§1 400
300
200 •
100 -
transpiration induced " '. by solar radiation
' V ' \ "\. X-A
\ \
x
* r " ~ . .A A "-•
A>ta ^ A / Sw v l
r-^yj \ 1 J 1 \l l i* ' " / \ M
*—' / V _A
T — " ^ 1 1 f 1 1 f 1
heating-induced
transpiration
_./"\ .y'~ \
! \ ! \ ! \
,'V" \ \
\ ' .
1 s ^ / 1
' r\
1 vv , ! 1 -—=^T
50
40
30
20
7 8 9 10 II 12 13 14 15 16 17 18
10
Si è!
0 ÜÜ
û-i
28 FEB 1981 hour«
Fig. 6 - The same as fig. 5 but for a cloudy day, one week later. LAI was
0.85, canopy height 92 cm. Air temperature and moisture functions
inside the house for the same day are given in fig. 12.
21 -

provided by Stanhill and Schölte Albers (1974). This may be because the soil was
covered in the present set-up (E and not E was measured), and/or because the
plant density was lower than in other experiments: Morris et al. (1957) for
example, worked with a plant density for tomatoes of 4 m .An unsatisfactory
development of the crop, possibly resulting from a low irradiation in early
stages coupled with a poor climate control within the house, definitely plays
a role. Much higher values for the P ratio were obtained in the early growth
stages of the second crop.
Transpiration data measured on two cold winter days are shown with corresponding
incoming shortwave radiation outside the house in fig. 5 (sunny) and fig. 6
(cloudy). It should be observed that although the measured radiation was nearly
3 times higher on the sunny day, the ratio between transpiration and radiation
remains approximately 0.1 for both days for the whole time that pipe heating was
off. Heating, however, played a very important role during the afternoon of the
cloudy day, when heating-induced transpiration almost equalled the transpiration
induced by radiation at noon.
The relation between E and incoming shortwave radiation outside the house is
shown in fig. 7, for the sunny day. The best-fit linear regression is:
L . E = 0.07 S + 11.36 Wm~2 (9)
with a correlation coefficient r = 0.89.
The low value of the coefficient of radiation (<z in (8)) is largely attributable
to the soil cover being incomplete : the crop had been transplanted one month
before. However, the large positive offsetb shows that on a cold, even sunny, day
much transpiration takes place independently from sun radiation. This is confirmed
by the wild scattering of the values of P in Table I.
Values measured on a warm spring day with scattered cloud are shown in fig. 8.
Here heating remained off, except for some heat provided around 04.00 h, and
22

<M E
N 3
Z O H I -< a. H o. w z < et
45
40
35 -
30
25
20 •
15 •
10
»>i<
E T = 0 .07S +11.36
r = 0 .89
— i 1 1 1 1 — 100 200 300
21 FEB 1981
400 500 OUT.RADIATION W/m2
Fig . 7 - Transpirat ion vs r ad i a t ion for the same day as in f i g . 5, from
07.30 h . t o 18.10 h . The b e s t f i t i s g iven. I f co r rec t ion for t r a n s -
miss iv i ty i s taken i n to account, the r e su l t i ng equation i s
T = 0.10 R. . , + 11.36. ins ide
23 -

65
60
55
50
45
40
35 g |
<i 30 S;
10 11 12 13
12 APRIL 1981
16 17 hours
25
20
Fig. 8 - Transpiration (multiplied by 5) and incoming shortwave radiation
outside the house during a warm, spring day with scattered cloud.
LAI was 1.40, canopy height was 1.95 m. Pipe temperature is shown
as a reference: no heating was provided.
- 24

transpiration closely follows fluctuations in radiation. The phase shift
(transpiration lags behind radiation) is quite clear here: it could be
observed in figs. 5 and 6, as well as in figs. 16, 17 and 18 of Morris et
al. (1957) . Kuiper (1961) found that the stomata of cut bean and tomato leaves
took much longer to open than to close (ca. 20 minutes compared with 5 minutes)
after the leaves had been transferred from strong light to lower light intensity
and vice versa. The lag in the response of transpiration rates to decrea
sing radiation levels, must then be explained not by slow stomatal closure but
by a temperature effect. Leaves cool down more slowly than air, and the resulting
large disparity between the vapour concentration of leaf cuticles and the surroun
ding air forces transpiration to continue. This question will be discussed further
in § 3.4.
3.2. Pipe heating
It is widely recognized that pipe heating plays an important role in stimulating
évapotranspiration in greenhouses. It is generally acknowledged that the posi
tive offset found by many authors in eq. (8) does indeed compensate for nocturnal
E, which is by no means negligible in areas (such as The Netherlands) where cold
and long nights characterize the winter growing season. De Graaf and v.d. Ende
(1981) showed that in January and February the nocturnal E of various recently
planted crops does exceed 40% (sometimes 50%) of E over 24 hours. Since in
such conditions the main energy input in the greenhouse comes from the heating
system, it seems logical to relate E to some parameter of the heat input. The
lack of more detailed knowledge on this subject must be ascribed to the inade
quacy of the instruments used: at best, total nocturnal E for 1 night could be
measured. From these preliminary results, however, it can be inferred that
although heating plays an important role in nocturnal E, the latter cannot be
explained solely in terms of the energy demand of the house: the nocturnal E of
- 25

0 2
20-21 FEB 1981
6 8 hours
50
40
30
20 H !
.e a »!
.1 T. UJ
Fig. 9 - Transpiration, average pipe temperature as measured near the lysi-
meter, and air temperature outside the house for a cloudless winter
night. LAI and canopy height, see fig. 5. Inside air temperature and
moisture functions, see fig. 10. Accuracy was, as for the whole 1981
experiment, 1.2 Wm 2.
26 -
ÜJ û H CO
H
< UJ
I -< ÜJ û. s; u
25
20
15 •
10 •
5 •
* A !\ A A f> A/
v •••' \' V v V v i ,,.
vv\ t»
• \ >
—i 1 1 1 i 1 1 1 1 r 1 r 1 1 1 1 1 r -
18 20 22 4 6 8
20 -2 ) FEB 1981
10 12 14 16 18 hours
0 Si e
25
20
1b
H
() H li l i l û
H <t CO
10
Ol
I <l
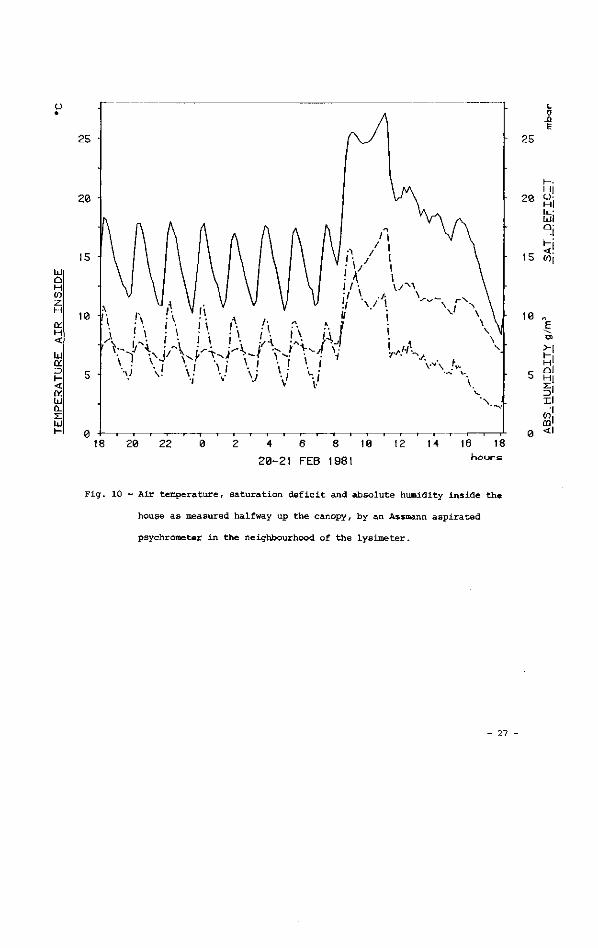
Fig. 10 - Air temperature, saturation deficit and absolute humidity inside the
house as measured halfway up the canopy, by an Assmann aspirated
psychrometer in the neighbourhood of the lysimeter.
- 27 -

a winter crop of cucumber was still found to be increasing after the canopy had
fully developed, even with decreasing energy demand (De Graaf and v.d. Ende, 1981).
Data from the present experiment shown in Table I appear to support this conclu
sion.
However, as shown in fig. 9, transpiration fluctuates over periods of a few
minutes, depending much on pipe heating. The figure refers to a cold, cloudless
winter night. The temperature in the glasshouse was controlled by a thermostat:
corresponding air temperature, absolute humidity and saturation deficit are shown
in fig. 10. Certain features in fig. 9 deserve attention: the reaction of trans
piration rate to an increase in pipe temperature was immediate (as far as can be
seen from a 10-minute period of scanning, see § 3.4) and impressive.
On average, it can be said that transpiration decreased during the first hours
after dusk, when the energy stored in the house in daytime dissipated, and
increased during the second part of the night. Actually, since the general trend
for each warming/cooling period was for air temperature to fall steadily outside
the house (fig. 9 ) , whereas not inside (fig. 10), the energy output per peak from
the heating system had to increase. In fact, total heat trasnfer coefficient (for
both radiation and convection) from the pipe network grew from 8.66 Wm 2.K to
11.17 Wm .K 1, and the energy gift from the heating system accordingly grew from
68.4 Wm 2 (ground area) for the first peak, to 113.9 Wm 2 for the last. These
calculations were done following the method described in Stanghellini, 1983.
It must also be mentioned that many authors have observed some pre-dawn stomatal
opening (see a review in Meidner and Mansfield, 1965) that could also be a
reason for the observed increase in transpiration rates.
It is interesting to compare fig. 9 with fig. 11, where measured values are given,
for a night one week later when a more sophisticated climate control was succeeding
in maintaining a fairly constant, though rather low, air temperature inside the
house (see fig. 12). Pipe temperature also fluctuated less, except for a large
28

increase around 06.30 h. to adapt to the day-time temperature set-point.
Transpiration followed strictly the same pattern, keeping at a steadier
level but approximately the same average as fig.9, despite the large diffe
rences in climate (figs. 10 and 12). Here also, the steady increase in trans
piration rate during the night should be noted.
Unfortunately, no canopy temperatures are available for either night, but it
is possible to infer that the canopy had to be warmer than the surrounding
air during the second night (figs. 11 and 12) if it was to release vapour to
an almost saturated environment. The following argument can give an idea of
the magnitude of the difference in temperature. If it is assumed that resis
tance to heat (r ) and vapour (r ) transport in the air are similar and
Ha va
resistance to water and vapour transfer within the plant is ignored (r ^ 0 ) ,
transpiration can be estimated by:
E m = — (C - C ) Wm~2 (10) T r„ vs va
Ha
where :
E„ is written per unit leaf area and C and C are the vapour concentration T vs va
(absolute humidity) at the evaporating surface of the plant and in the air,
respectively. If r as calculated by Stanghellini (1983) is used, (10) yields: Ha
C ^ 1 0 gm~3 (11) vs
If it is assumed that air at the evaporating surface of the leaves is saturated,
(11) is consistent with a canopy temperature of approximately 11°C, i.e. the
canopy was about 1°C warmer than the air.
On the other hand, the same reasoning leads to the conclusion that the canopy
had to be cooler than the air, during the night illustrated in figs. 9 and 10.
In this case it is more difficult to quantify this statement since it is
probable that resistances within the plant cannot be ignored. In fact, the
- 29

50
40
co,
30 ft| u-I
20 » 3
10
UJ o: i-< ui o.
2 3 4
27 -28 FEB 1982
Fig. 11 - Transpiration, average pipe temperature, as measured near the lysi-
meter, and air temperature outside, for a winter night. LAI and canopy
height values, see fig. 6. Inside air temperature and moisture functions,
see fig. 12. The low transpiration rates at 04.20 h. and 05.40 h. were
measured after water gift and could be explained as in fig. 5.
The trough (two scans long) around 01.00 h. was probably caused by drops
falling on the lysimeter from the roof, since, as fig. 12 clearly shows,
there was condensed moisture on the roof the whole night.

UI û H CO
H
< Ui
a < ce. ui CL
Ul t -
25
20 •
15 •
10 •
/ • \ A
/ v./^ --
V - — . - ' • V - - N . „ .
—i 1 1 T ^ 'i 1 1 1 1 1 1 1 1 1 1 1 1 1 1 r~
22 0 2 4 6 8 10 12 14 16 18 20 27 -28 FEB 1981 h o , j r s
25 L o e
20
15
H.
Ö! H| Uli Û i CO|
10
H Ql
l ! <i
Fig. 12 See f i g . 10

larger driving force for evaporation (larger supply of energy and saturation
deficit) was not matched by the measured transpiration rate. Moreover, the
shape of the peaks in transpiration rate shows that the water supply to the
evaporating surface was inhibited somehow. In fact, transpiration did respond
immediately to the higher energy supply, but fell soon thereafter to levels
that were not consistent with the still large driving force, i.e. when the
turgor of the leaves was depleted, water supply no longer fulfilled the
demand.
It is interesting to realize that, in both nights, actual vapour content in
the greenhouse air was practically constant, i.e. all the vapour produced
was removed either by condensation on the glass surfaces or by air exchange
with the outside. Condensation was probably the main removal mechanism in the
second night (the air itself was almost saturated, see fig. 12), while air
exchange was probably more important during the first, cold night, because of
the large gradients of vapour concentration and temperature with the outside
(circa 5 g.m and 20°C, respectively). An instructive feature of fig. 12 is
that the "heat-burst" at dawn did not significantly raise the saturation
deficit within the house: transpiration rate adjusted immediately to match
the increased demand (fig. 12).
3.3. Natural ventilation
Ventilation is mostly provided by climate control systems in order to lower
inside air temperature when it exceeds a certain level. Some systems also
provide ventilation when water vapour or C02 content reach intolerable levels:
too high or too low, respectively. The system as installed during the present
experiment actually only used air temperature as a parameter for ventilation
(only natural ventilation, as stated in § 2.1). The amount of opening, as a
percentage of the maximum possible, was calculated as depending on how much
32

29 MAY 1982 hour«
Fig. 13 - Incoming shortwave radiation as measured above the glasshouse roof.
Scan interval was 3 minutes and points displayed here (as in fig. 14
and 15) are progressive means over 3 scans.
33

û H V) Z H
a. H < Lu QC
< LU CL X. Lu
25
20 -
15
10 -
5 - / V \ "•VV v» t .-J\
... / - J i / V V-J' , J
v. / ï
* vy\ >..rM\ i\ 11; Y V
10 12 14
29 MAY 1982
16 20 22 h o u r s
O _Q E
25
20
15
ü1 H I Lu' Lui
S! Crt|
Si 5i ri <l
Fig. 14 - Temperature, saturation deficit and absolute humidity of air inside
the glasshouse as measured by an Assmann aspirated psychrometer in the
neighbourhood of the lysimeter, halfway up the canopy. For scan inter
val see fig. 13. Set-point of ventilation was 20°C (+ 3°C for high
radiation) at day, and 17°C at night. See fig. 15 for ventilation during
the same day.

12 14 29 MAY 1982
Fig. 15 - Window opening (% of maximum angle of 11°) and transpiration on the
same day as figs. 13 and 14. There were 6 plants on the lysimeter and
points displayed here are the progressive means of 3 scans, each 3
minutes apart. The corresponding accuracy is 0.9 Wm . LAI was 1.95,
canopy height was 1.95 m (plant tips had already bent over).
35

the actual air temperature inside the house exceeded the set-point of ventilation
(Van Meurs, 1983). An allowance was made for an increase in the set-point,
depending on cumulative incoming shortwave radiation.
In fact, ventilation always affects many more climate parameters than those
it is intended to control, so that it is advisable to investigate its effect,
although indirect, on transpiration.
An example is given referring to a late spring day, with scattered cloud.
Radiation pattern as measured above the house is shown in fig. 13; temperature,
saturation deficit and absolute humidity inside the glasshouse are shown in
fig. 14, while transpiration and window opening can be seen in fig. 15. The
figures do not allow clear conclusions to be drawn, since incoming radiation
outside the house is ultimately the driving force behind all the variables,
i.e. radiation influences temperature, which determines ventilation rates,
which in turn affect the vapour content of the air and air velocity. In fact,
one could expect transpiration rates to be influenced by each one of these
variables, thus the close coupling between each fluctuation in figs. 13, 14 and
15 is not surprising. However, when the control system switched from the diurnal
to the lower nocturnal set-points, the windows were wide open at sunset. A large
decrease in absolute humidity suddenly took place, accompanied by an impressive
—2 rise - to 78 Wm - in transpiration, which had already stabilized on the
—2
20 Wm rate observed at dawn.
It will not be discussed here if this is a meaningful way of disposing of the
energy stored in the house during the day, however, it must be conceded that
it is an efficient way: as fig. 14 shows, latent heat losses averaged 30 Wm 2
over a 20-minute period after opening, while average sensible heat losses
were approximately 10 Wm 2 in the same period.
- 36

3.4. artificial irradiation at night
A few experimental runs.were performed at night using artificial light.
An example is given, referring to a run when a set of four lamps (each 160 W,
blended light, type Philips MLR red-infrared) installed around the lysimeter••-
a few centimetres above ground and pointing upwards - were alternately switched
on and off for periods of one hour. To avoid undesirable interferences, pipe hea
ting was switched off and the greenhouse air steadily cooled from 16.5° to 11.0°C
during the run. Fig. 16 shows net radiation (positive upwards) as measured among
the plants on the lysimeter, while in fig. 17 transpiration and canopy tempera
ture are shown superimposed on a black graph of the light periods. The ratio
between transpiration and net radiation indicates a complete stomatal opening:
100 Wm 2 were often measured at daytime by such a net radiometer, when the
shortwave radiation outside the house was 200-250 Wm 2. The latter figure
yields, for a comparable development of the crop (see figs. 13 and 15) circa
40 Wm 2 in transpiration. This is a very rough estimate, since the energy
distribution in the spectrum emitted by the lamps used is very different from
sunlight energy distribution. However, Meidner and Mansfield (1965) , also
quoting previous results, pointed out that:
a) red light (660 ran) of 11.866 Wm 2 was enough to produce full opening
of the stomata of some plants and
b) the energy required to obtain similar degrees of stomatal opening in
light falling directly on to stomatal guard cells was one-ninth to
one-tenth of the energy required if the light passed first through the
leaf tissue (note that tomatoes are hypostomatous).
It must be said, however, that no appreciable differences were observed in
transpiration rates in a similar set-up but with lamps above the canopy.
On the other hand, the speed at which the stomata opened, is more remarkable
than the opening itself (cf. § 3.1) and it should be noted that the transpiration
37

(M 1 1 0 E
S
100
90
80
70
O H I -< H û <
UJ Z
50
40
30 -
vw rlAjw Ai l^M
20 : ^ jUv^
10
21 22
>*W
23 0 1 2
23-24 APR 82
ffalt^
1 1 0 <M E
S
100
90
WK*~
5 6 h o u r s
80
70
60
50
40
30
20
10
0
Fig . 16 - Net r a d i a t i on (pos i t ive upwards) a s measured wi thin the canopy by a
Schenk ne t - rad iomete r , when lamps i n s t a l l e d a t ground l eve l were
switched on and off (see t e x t ) .
- 38 -

OM 1 1 0 E
S.
100
90
80
70
50
/ X
•••"•"••i
16
14
O o
UJi
o:! 12 ^
<i Bi èi
i0 [ui
>i è!
8 0|
?! §! i-i s !
23-24 APR 1982
Fig. 17 - Transpiration and canopy temperature as measured by a Heiman infrared
thermometer shown superimposed on a block graph of the light periods.
There were six plants on the lysimeter and a complete measurement was
taken every minute. The points displayed here have been smoothed with
a progressive mean over three values. LAI was 2.23, canopy height was
1.95 m. The accuracy of transpiration here is 2.7 Wm 2 .
39

rates rose faster than the canopy temperature.
Although the present research was not intended to thoroughly investigate stomatal
behaviour, nor did the set-up allow this, it is interesting to observe that the
inferences drawn above are supported in the literature:
a. Kuiper, 1961, observed that the opening of the stomata of cut bean leaves
upon a shift from darkness to light was faster in normal air than in
air free from C02 . He did not, however, do trials with above-normal concen
trations of C02. In the present experiment, the nocturnal concentration of
C02 in the glasshouse was always found to increase steadily from 300 vpm
(dusk) to 700-800 vpm (dawn).
b. Meidner and Mansfield (1965), quoting also previous findings of Mansfield,
stated that red and far red regions of the light spectrum were most effective
in shifting or interrupting the plant's own cycle in stomatal opening.
c. Woo et al. (1966) described a model for stomatal control mechanism as
dependent on turgor pressure. They showed that the time taken to respond
to changing light intensity is at a minimum when turgor of leaves is at a
maximum. This could well be the case after a dark period in which transpi
ration rates have been low. This does not usually apply at sunrise when
leaf turgor has already been depleted by high transpiration rates induced
by pre-dawn pipe heating.
As already stated, no physiological study is to be attempted here : however,
the above results indicate that more must be known about the ways transpi
ration can be induced and forced at night, if any hope of controlling it is
to be retained.
3.5. Screens
The lack of a reference compartment and the unsatisfactory performance of the
screen used, did not enable us to draw clear conclusions about the screen's
40 -

influence on the climate inside the house and then on transpiration rates. As an
example, data referring to two consecutive nights (the screen was closed during
the first night and openedat 22.00 h. during the second night) are shown here.
External conditions were by no means the same, the second night being warmer but
more windy. Moreover, the climate control system did not maintain the same air
temperature within the house: the average was approximately 2°C higher when the
screen was open (see figs. 18 and 19). Features that could be ascribed to the
presence of the screen could thus well be due to other factors, and therefore
no judgement of the efficiency of the screen is attempted here.
However, some discussion of transpiration rates and their apparent relationships
is worthwhile. When reference is made to the central part of both nights -
01.00 h. to 05.00 h., say - characterized by quasi-stationary conditions, it must
be noted that, despite the different temperatures of the heating system and of
the air, transpiration rates, as well as canopy temperature, were similar: figs.
20 and 21.
The larger supply of energy (more radiation from heating pipes and more sensible
heat from air), had to be used by the canopy to feed higher radiative emission
to the roof when the screen was open (roof temperature averaged 5°C while the
average temperature of the screen, the previous night had been 13°C).
The data shown can be used to estimate the resistance to vapour transport in air
for either night. If, as in § 3.2 the following assumptions are made:
- r =r> va Ha
- the internal resistance of the plant to water and vapour transfer is
much, smaller than the resistance of vapour transfer in air
- air at the evaporating surface of the plant is saturated, i
eq. (10) yields r i 4 10 si for the night with the screen closed and r ^ 2 102 sm 1 with the screen open. As stated, factors other than the screen
va "
- 41

screen closed
I! <l « I
Û H OT Z H
a: H <
a r-< a ÜJ z: U h-
\ y ' N \y ^ " ^ / - V / - " 1 ^
2 0 OT e
18
16
14
12
10
H
6
4
2
r i H > J> JL.
(0 m <
, m
• Q
6
ii M Û
H
25
22 23 2 3 4 5
8 - 9 MARCH 1982
7 8 hours
Fig. 18 - Temperature, sa turat ion d e f i c i t and absolute humidity of greenhouse a i r
near the lysimeter. Canopy temperature was measured by a Heiman infrared
thermometer pointing a t halfway up the canopy. A t ransparent lamellae
screen was closed during the whole run.
42

screen open
ÜJ et h-< u CL T. ld h-
4 • /Vr\../V\,
"./'*
23 1 2 3 4 5
9 -10 MARCH 1982
7 8 h o u r s
6
4
2
Si < >; H I 1' i M 1
Û I
t-i <f-Ml
Fig. 19 - The same as f i g . 18, the next n igh t . The screen was opened a t 22.00 h .
a f ter being closed the whole day (and previous n i gh t ) .
- 43

M 80 E
70
60
50
40
30
20
10
s c r e e n c l o s e d ,~"\
' \ ' M \ ' ^ \ ' N / N ' * "
22 23 2 3 4
8 - 9 MARCH 1982
50
40
30
20 W|
g <l
ie H "!
H
a û-l
hour e
Fig. 20 - Pipe temperature and transpiration as measured below a closed screen
(see fig. 18). There were 8 weighed plants and the scan interval was
3 minutes. Corresponding accuracy of transpiration values is 2.0 Wm~2.
LAI was 1.30, canopy height 189 cm.

e •s 3
80
70
60
screen open
. A A/vVv\
2 3 4 5
9-10 MARCH 1982
50
7 8 hour«
Fig. 21 - The same as fig. 20. The measuring run began just after the screen was
opened, see fig. 19.
- 45 -

probably also play a role in this difference, but it can safely be concluded
that the presence of a screen does drastically reduce transfer coefficients in
a greenhouse.
3.6. Possible rhythms in stomatal opening
The large increase in amplitude of oscillations in transpiration rates (figs. 20
and 21) during both nights in the hours preceding dawn is noteworthy. It could
be due to some failure of the cumbersome lysimeter set-up as well as to entrained
cycles in stomatal opening. Such cycles have been observed by many authors in the
leaves of various plants (a good review can be found in Hopmans, 1971). Previous
attempts to observe cycles in tomatoes failed (Hopmans, 1982) but it has to be
acknowledged that the lysimeter used in the present experiment is much more
sensitive than instruments used in previous research: it is possible that cycles
in stomatal opening occur in tomato leaves on a scale too small to be previously
detected.
Indeed, very small fluctuations in transpiration rates were observed under various
conditions during the present experiment. It was therefore decided to use leaf-air
temperature difference (Hopmans, 1971) as a parameter of transpiration rates,
i.e. as a check for the lysimeter. The experiment was performed on a third crop
in late autumn. Climatic shocks to possibly stimulate cycles at night were pro
vided by suddenly raising the temperature of heating pipes by approximately
15°C, thus increasing the saturation deficit by circa 200%, see fig. 22.
Corresponding leaf-air temperature difference was measured with a series of two
0.1 mm thick thermo couples: the reference junctions were in the air, 2 to 3 cm
from the leaf, the others were kept touching the leaf surface by means of a clip.
The mean temperature difference measured for five leaves on one plant is shown
in fig. 23. The differences were almost all smaller than those measured with the
Heiman infrared thermometer in the previous set-up (see figs. 18 and 19): this
46

1 2 3 4
29 -29 OCT 1982
7 hour«
35
m e s 09
30 > ) - ' •
H-Q: H :
25 g I : m-m:
20 < :
is E
Si H !
ie fci
3i
Fig. 22 - Climate in the greenhouse provided in an attempt to stimulate cycles
in stomatal opening. Points shown are progressive means over three scans
(one scan per minute).
47 -

o «
24 4> e o
22
28
18
16
14
12
10 I 1
6 &
2 3 28-29 OCT 1982
7 hours
Fig. 23 - Air-leaf temperature difference and air movement as measured within the
canopy, in response to the climate as shown in fig. 22. A complete scan
was performed each minute. Points shown have been smoothed with a 7-value
progressive mean. Temperature difference as shown, is the average of five
leaves on one plant. The crop had been transplanted in mid-July.

could have resulted from a poor contact between the thermocouple junction and
the leaf surface. However, only the trend and not its actual level was of impor
tance here. The expected pattern of a cooling of the leaves caused by the rise
in transpiration rate that was induced by the increase in energy supply can
easily be observed, as can an oscillating trend back to the values experienced
before the shock. However, the presence of a similar trend in air movement, as
measured within the canopy (fig. 23), is intriguing. It appears that large eddies
of warm air leave the pipes and rise with a frequency comparable to the one of
the expected cycle ; it can be inferred that convective heat transfer takes place
in much the same way.
Spectral analysis of the air velocity and of the temperature difference confirmed
this inference, showing that all the relevant characteristic frequencies were
superimposed. From this it can be concluded that leaf-air temperature difference
cannot, in such conditions, be considered a good indicator of transpiration
rates. Anyhow, as stated in § 2.2 the lysimeter itself should be sensitive to
such fluctuations in air movement, although some of the measured oscillations
in transpiration rates were larger than can be explained by (5). Moreover, the
absence of detectable fluctuations in vapour concentration in the air (fig. 22)
seems to support the conclusion that there are no rhythms in stomatal opening
in tomato plants - at least not at a rate relevant for the present research.
- 49

4. CONCLUSIONS
The results shown in the present paper, although preliminary, show that energy
supply and moisture content of the air influence transpiration rates independently.
The effect of sun radiation is most important in late spring and summer, and in
winter only on very bright days. In all other conditions (nights included), there
appears to be a strict coupling between the heating regime and transpiration rates.
The influence of heating is both direct (radiation from heating elements falling
on leaves) and indirect (air temperature, relative humidity, air movement).
For the results to be expressed more mathematically, more must be known about the
mechanism of heat and vapour transport in greenhouses and about the possible rela
tion between leaf area and intercepted radiation from the sun and from the heating
elements. These are the two trails along which the research is now proceeding.
50

ACKNOWLEDGEMENTS
I wish to acknowledge gratefully the financial support of the Dutch Ministry
of Agriculture, as well as the stimulating encouragement of Ir. W.P. Mulder.
The collaboration with Ir. G.P.A. Bot has always been pleasant, fruitful and
instructive for me. The experimental work was made possible by the enthusiasm
and skill put into it by F. Dormans, A. van 't Ooster and J.E. Reinders,
students of the Agricultural University in Wageningen. My husband Dr. M. Menenti,
provided his knowledge and his help in various circumstances throughout the whole
research. I am grateful to Ir. D. Bokhorst for his comments on this work. I
learned much from discussions with many colleagues and I would like to mention
here explicitly Dr.Ir. P.A.M. Hopmans, Ing. A.M.G. v.d. Kieboom, Ir. C.J. v.d. Post
and Dipl.Phys. J.A. Stoffers. D.H. Pasman and H. Schouwink gave much help with'
the experimental set-up and J.B. Koenderink with the drawings.
- 51

REFERENCES
Aboukhaled, A.; A. Alfaro and M. Smith, 1982
Lysimeters.
FAO Irrigation and Drainage paper no. 39, pp 9-20
Bavel, C.H.M, van and L.E. Myers, 1962.
An automatic weighing lysimeter.
Agric. Engng. 43: 580-583, 586-588.
Bavel, C.H.M. van and E.J. Sadler, 1979
SG 79: A computer simulation program for analyzing energy transfor
mations in a solar greenhouse
Texas A and M University report, 75 pp
Bot, G.P.A., 1983
Greenhouse climate.
Ph.D. thesis, Agricultural University, Wageningen. In preparation.
Bot, G.P.A., J. Meyer, C M . Stanghellini,and A.J. Udink ten Cate, 1983
Development and application of a high precision weighing lysimeter.
Submitted to J. Agric. Engng. Res.
Bruin, R.B. de, 1983
Meting en berekening van de warmtestroom en temperatuur in de bodem
van een kas.
Doctoral thesis. Agricultural University, Wageningen.
Dormans, F.J.S.M., 1983
Metingen aan en simulatie van de gewasverdamping in een geschermde
kas.
Doctoral thesis. Agricultural University, Wageningen. In preparation.
Eisner, B. van, 1982
Das Kleinklima und der Wärmeverbrauch von geschlossenen Gewächs
häusern. Gartenbau-technische Informationen, Heft 12, Institut für
Technik im Gartenbau und Landwirtschaft, Universität Hannover, 211 pp.
52

Graaf, R. de and J. v.d. Ende, 1981
Transpiration and évapotranspiration of glasshouse crops.
Acta Horticulture, 119: 147-158
Hopmans, P.A.M., 1971
Rhythms in stomatal opening of bean leaves.
Mededelingen Landbouwhogeschool Wageningen, 71-3: 88 pp.
Hopmans, P.A.M., 1982
Personal communication
Kieboom, A.M.J, v.d., 1981
Personal communication
Kimball, B.A., 1981
A versatile model for simulating many types of solar greenhouses.
Paper no. 81-4038 American Society of Agricultural Engineers, 42 pp.
Kuiper, P.J.C., 1961
The effects of environmental factors on the transpiration of leaves
with special reference to stomatal light response.
Mededelingen Landbouwhogeschool Wageningen 61-7. 49 pp.
Lake, J.V., J.D. Postlethwaite, G. Slack and R.T. Edwards, 1966
Seasonal variation in the transpiration of glasshouse plants.
Agric. Meteorol. 3: 187-196
Meidner, H. and T.A. Mansfield, 1965
Stomatal response to illumination.
Biol. Rev. 40: 483-509
Meurs, W.Th. van, 1983
Personal communication
Monteith, J.L., 1975
Principles of Environmental Physics
Edward Arnold, London pp: 82-85
Morris, L.G., F.E. Neale, J.D. Postlethwaite, 1957
The transpiration of glasshouse crops and its relationship to the
incoming solar radiation.
J. Agric. Engng. Res. 2: 111-122
- 53

Ooster, A. van 't, 1983
Metingen aan en simulatie van het klimaat in geschermde kas.
Doctoral thesis, Agricultural University Wageningen, 2 vols.
Reinders, J.E.M., 1982
De metingen van transpiratie en sapstroom in planten.
Doctoral thesis, Agricultural University Wageningen, 1-19
Stangheilini, C M . , 1981a
Estimation of energy requirement for evaporation in greenhouses.
Acta Horticulture ,115: 693-699
Stangheilini, C M . , 1981b
Evapotranspiration and energy consumption in greenhouses.
Acta Horticulture 119: 273-279
Stangheilini, C M . , 1981c
A first analysis of ground temperature and heat fluxes in and
around a greenhouse
IMAG report Xnr. 7648, 6 pp
Stanghellini, C M . , 1982a
Verdamping en energiegebruik in kassen
IMAG Jaarverslag 1981. Tuinbouw en Recreatie: 62-66
Stanghellini, C M . , 1982b
An interactive program to draw plots on the 4662 tektronic plotter.
IMAG report dec. 1982: 18 pp.
Stanghellini, C M . , 1983
Calculation of the amount of energy released by heating pipes in
a greenhouse and its allocation between convection and radiation.
IMAG, research report 83-3
Stanhill, G. and J. Schölte Albers, 1974
Solar radiation and water loss from glasshouse roses.
J. Amer. Soc. Hort. Sei. 99(2): 107-110
- 54

Varst, P.G.I, v.d. and J.d.G. Postel, 1972
Bepaling bladoppervlak van tomatenplanten.
Instituut voor Tuinbouwtechniek Wageningen, report 46: 36 pp
Woo, K.B., L.N. Stone and L. Boersma, 1966
A conceptual model of stomatal control mechanism.
Water Res. Res. 2(1): 71-84
55 -
