merchandise assortment planning a blue print for · pdf filemerchandise assortment planning a...
TRANSCRIPT
MerchandiseAssortment Planning
A Blue Print for Success
Annual Catalog Conference
June 4-7, 2001
Presented by:
George J. Mollo, Jr.
GJM Associates

“Adopting a well grounded merchandising plan is far and away the single most important thing a company must do for
success.”
“The key to growing sales and profits, providing better direction to the merchants invariably results in better
product selection.”

“More and better products lead to increased response rates, which in turn expand the
universe of names that can be mailed profitably, increasing
circulation and sales.”
Planning Process OverviewPlanning Process Overview
Take A Simple & General Approach
Improve majority of items - Don’t try for 100% accuracy on all items
“ALMOST” Right NOW is better than…“EXACTLY” Right Later !
Reduce exceptions
Use Historical Analysis
Start (at least) 9-12+ months in advance

RELATIONSHIPS!RELATIONSHIPS!

Planning Process OverviewPlanning Process Overview
Item Counts (based on pages/density)
New vs. Repeat Item relationships
Space Allocation
Margin Targets & Price Points
Average Price Offered vs. Sold
Vendor Performance History
Estimated Item Profitability

Planning Process OverviewPlanning Process Overview
Identify “Season/Horizon” To Be Planned
Identify “Comparable Season/Horizon”
Establish Initial Demand Plan (Season & Campaign)
Validate Demand Goals
Produce “Category” Goals (Campaign & Season)

Planning Process OverviewPlanning Process Overview
Produce “Sub-Category” Goals (Campaign & Season)
Distribute “Sub-Category” to Items (Campaign & Season)
• Repeat & New Items
Allocate “Color/Size” Percents
What Are Key Issues to Consider - That May Impact the Approach to the “Top Level”Campaign and/or Category
Plan?
The Planning ProcessThe Planning Process
General General ““Top LevelTop Level””
InformationInformation
Campaign Dates
Circulation
• Quantity• List Productivity (vs. LY)• List Profile

General General ““Top LevelTop Level””
InformationInformation
Historical Page Counts
• Selling vs. Editorial• Calculations of Editorial (included or not?)
Catalog Costs
Market Trends
Special Merchandise Focus

Top Level Top Level ““ControlControl”” EntryEntry
Item Count (for AII)
Demand
Profit Statistics
• Margins• Catalog Costs• NMVOE (% of Sales)• Fixed Expense (% of Sales)• Cost of -- Returns, Overstock Provision
Marketing Plan
Obtain LY Comparable “Horizon”(Season)
• Demand by Season & Campaign• LY Plan vs. LY Actual
Set TY targets
• Demand by Season & Campaign
Validate Targets (Reasonableness)
Confidence Factor (Comps < 100% done)

The Category / Sub-Category Plan
What Category Goals (Factors) Should Be Considered?
Demand ($, share %)
Item Count
Margin
Price Points (Offered vs. Sold)
Category Productivity*

What Category Goals (Factors) Should Be Considered?
Page Counts (Space Allocated)
Density
Sell Ratio
Return Rates
Fill Rates
Profitability

Definitions (Relationship Indices)
Performance Index = (% of demand / % of items) -- (Category AII)
Category Space Index = (% of demand / % of space) – (Space AII)
Sell Ratio = (Item percent of page *
cost per page) / Projected item $$
demand in Offer
AII = (Projected Item $$ Demand in Campaign/ Number of items) / Average Item Demand

Performance Index:
(% of demand / % of items) --
(a.k.a. - Category AII)

This Year This Year TY TY
Description Items % Demand % Avg. Perf.
Spring 00
TOTAL DROP: 218 100.0% 5500.0 100.0% 25,229 1.00
GIFTS 43 19.7% 1204.5 21.9% 28,012 1.11
HOME 54 24.8% 1353.0 24.6% 25,056 0.99
APPAREL 50 22.9% 1743.5 31.7% 34,870 1.38
ACCESSORIES 71 32.6% 1199.0 21.8% 16,887 0.67
Performance Index

Category Space Index:
% of demand / % of space
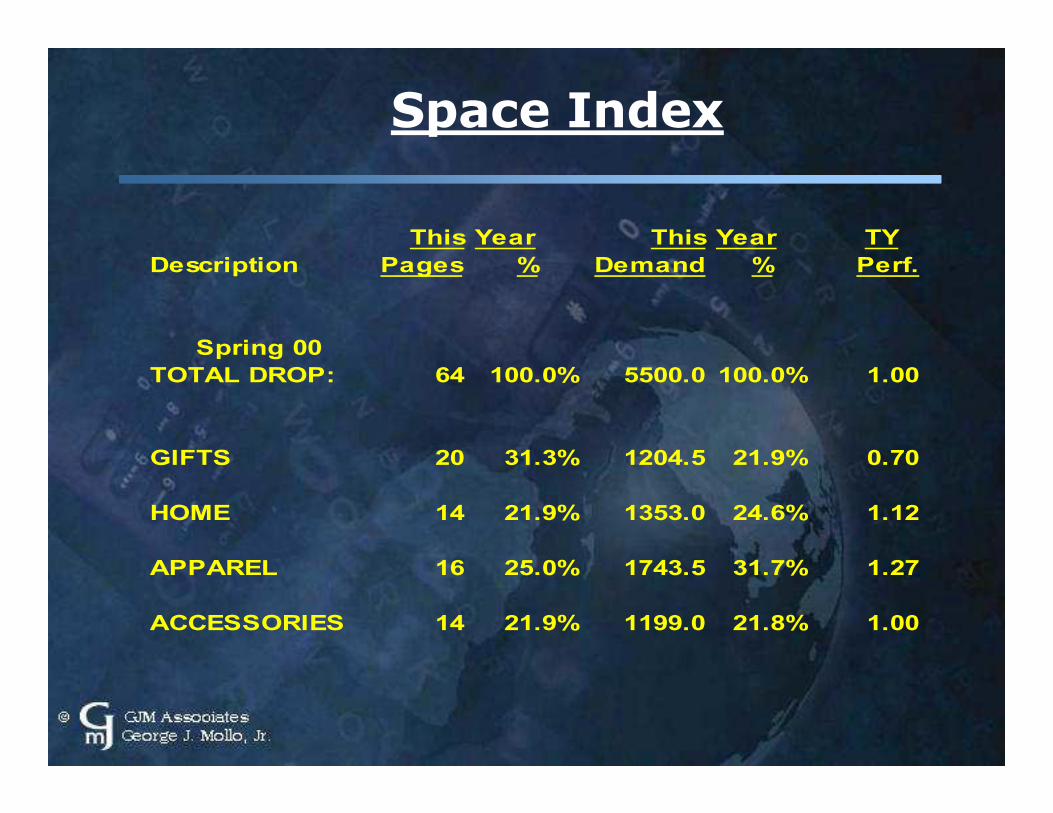
Space Index
This Year This Year TY
Description Pages % Demand % Perf.
Spring 00
TOTAL DROP: 64 100.0% 5500.0 100.0% 1.00
GIFTS 20 31.3% 1204.5 21.9% 0.70
HOME 14 21.9% 1353.0 24.6% 1.12
APPAREL 16 25.0% 1743.5 31.7% 1.27
ACCESSORIES 14 21.9% 1199.0 21.8% 1.00

Sell Ratio:
(Item percent of page * cost
per page) / Projected item $$
demand in Offer

Sell Ratio
Projected Catalog Demand: $5,000.0
Total Pages: 64
Total Selling Costs: $1,370.0
(Creative, Paper, Printing, Postage, List Rental)
Selling Cost Per Page: (Editorial ?) $21,406
Item A = 25% of Page ($30k Demand) 17.7%
Item B = 25% of Page ($20k Demand) 26.5% Sell Ratios
Item C = 25% of Page ($14k Demand) 38.0%
(25% page = $5351.5 Ad Cost)

AII (Average Item Index)
AII = Projected Item $$
Demand ÷÷÷÷ (Projected $$ demandin Offer/ Number of items)

AII (Average Item Index)
Projected Catalog Demand: $5,000.0
Total # of Items: 250
Average Item: $20,000
Item A = $ 30000 1.5
Item B = $ 20000 1.0
Item C = $ 14000 0.7

Sub-Category
The same analysis – only at the sub-category level

Relationships!!
How Many Use These Measures -- Yet Independent of Each Other ??
• Item Count• Page Space• Demand• Page or Spread Average
• Etc…...

Relationships!!
Multiple Measures (or Indices) Used Together - Will Strengthen the Analysis
For example:• Performance Index with Space Index• Space & Item Demand with Sell Ratio• Average Item with Item Count (and Demand)

Product Planning
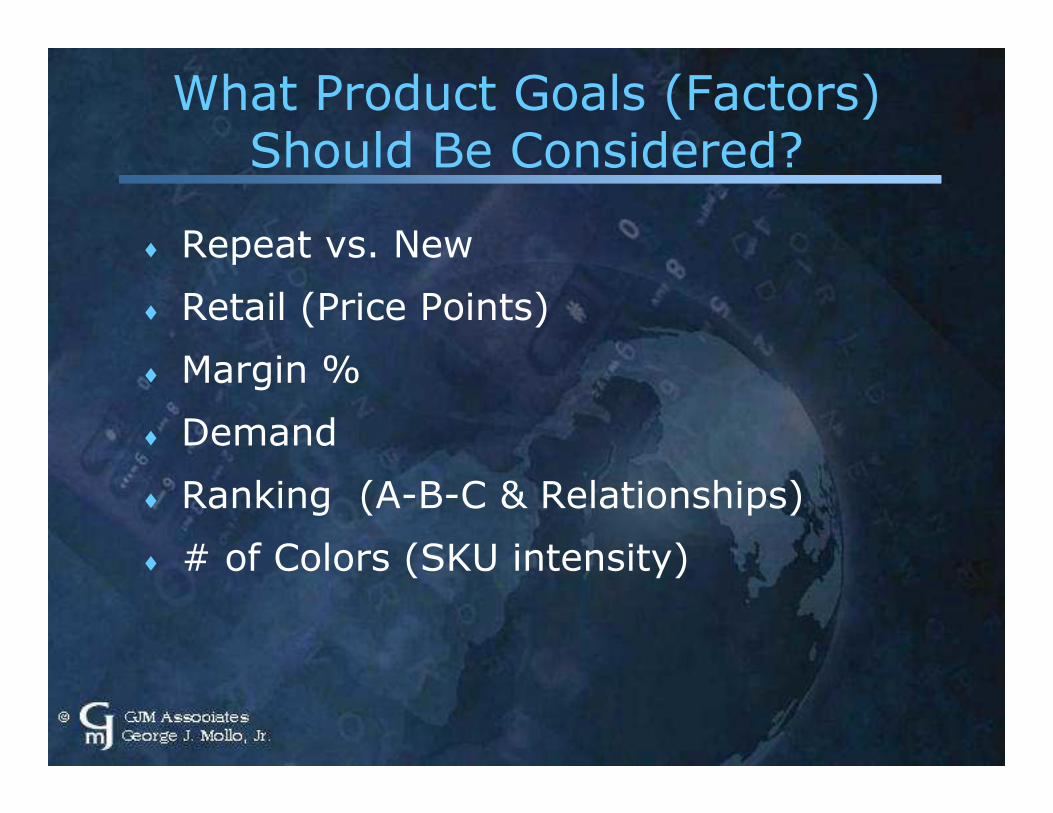
What Product Goals (Factors) Should Be Considered?
Repeat vs. New
Retail (Price Points)
Margin %
Demand
Ranking (A-B-C & Relationships)
# of Colors (SKU intensity)
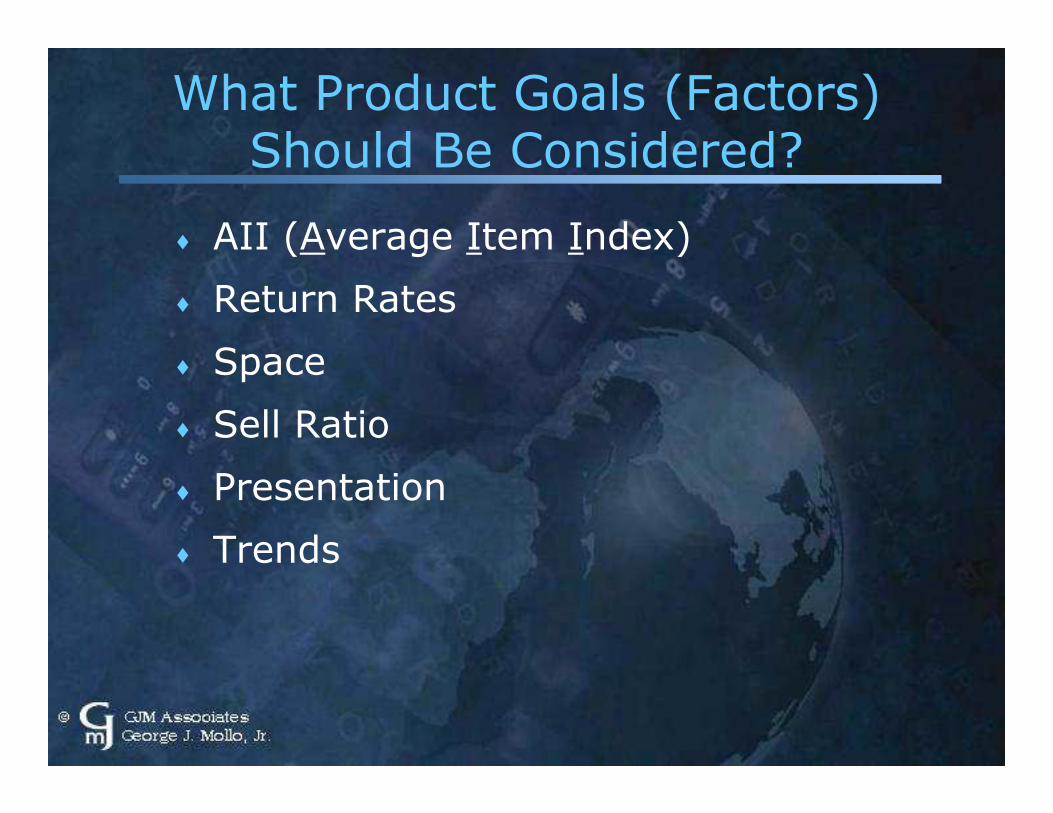
What Product Goals (Factors) Should Be Considered?
AII (Average Item Index)
Return Rates
Space
Sell Ratio
Presentation
Trends

Summary of Planning/Forecasting Factors
Demand History
Item Counts
Space
Circulation
Competition (Internal & External)
Item Relationships (Ranking A - B - C)
Price Points
Creative Factors
Presentation
Location in Catalog
Space Costs (Sell Ratio)
Seasonality
Indices

Department View
Average item 25,229
Page Cost: 11,983
Description Cost Retail MU Dmd AII % Sell
% $$ space Ratio
l/s Shirt 7.50 18.00 58.3% 15.7 0.62 0.25 19.1%
s/s shirt 5.50 12.00 54.2% 22.7 0.90 0.25 13.2%
plaid shirt 7.80 20.00 61.0% 11.4 0.45 0.25 26.3%
henley shirt 8.00 22.00 63.6% 37.0 1.47 0.50 16.2%
pique polo 10.00 32.00 68.8% 32.2 1.28 0.40 14.9%
interlock polo 10.00 32.00 68.8% 25.3 1.00 0.25 11.8%
denim shirt 9.15 27.00 66.1% 18.5 0.73 0.25 16.2%
chambray shirt 15.00 38.00 60.5% 16.7 0.66 0.25 17.9%
dress shirt 17.75 40.00 55.6% 20.2 0.80 0.25 14.8%
Department Totals: 199.7 2.65 15.9%
Avg Price Offrd 26.78
Avg Price Sold 23.65 62.6%

Item # Description drop 1 drop 2 drop 3 drop 4 drop 5 drop 6
Item A l/s shirt 2.0 1.8 1.6 1.3
Item B s/s shirt 0.4 1.4 2.0 5.0 2.5 1.8
Item C plaid shirt 1.0 0.8 1.0
Item D henley shirt 0.9 1.0 1.0
Item E pique polo 2.0 2.0 2.2 2.1 2.1 2.0
Item F interlock polo 2.0 1.9 1.8 1.9 1.9 1.9
Average Item Index

Planning Factors
Life of Item (> 1 Campaign)• Stresses Importance for Horizon/Season Plans
Realistic Estimating
• Based on Demand NOT on Availability
Maintain Relationship to Buy Plan
• Don’t Spend $$ Twice
The Assortment Plan is the CONTROL
• This process virtually eliminates a Merchants’concerns re: product selection and DOES ALLOW change while providing control and greater bottom line profits
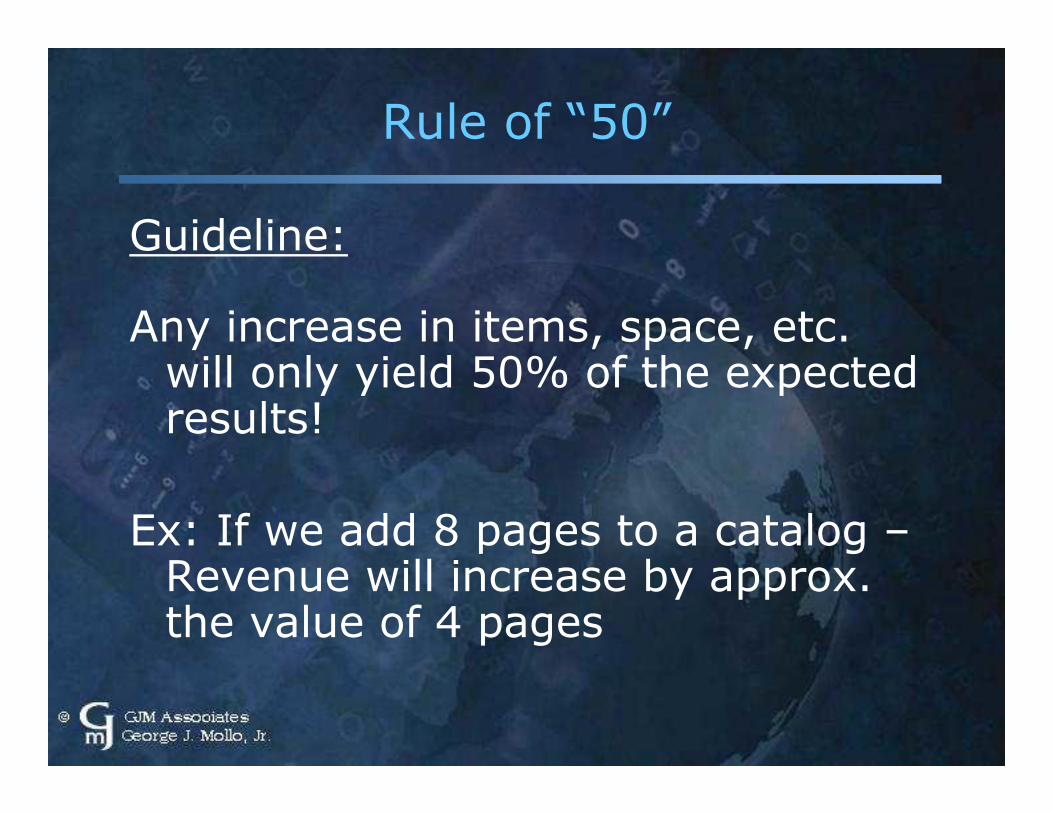
Rule of “50”
Guideline:
Any increase in items, space, etc. will only yield 50% of the expected results!
Ex: If we add 8 pages to a catalog –Revenue will increase by approx. the value of 4 pages
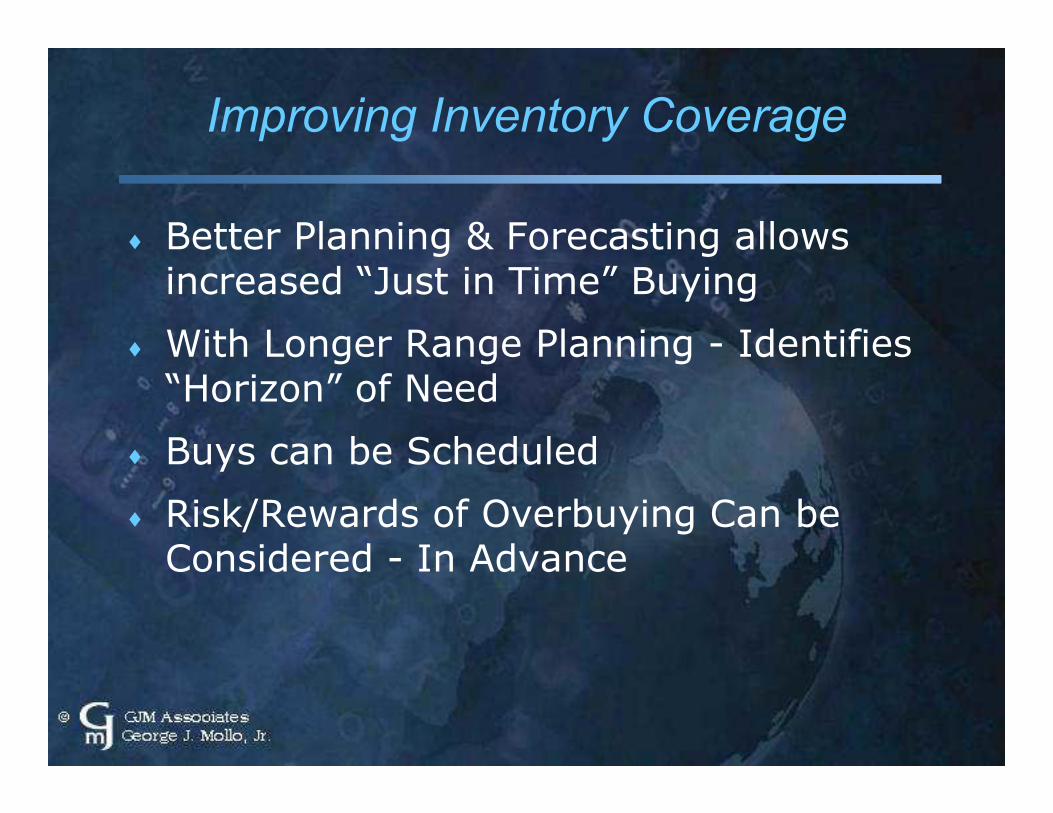
Improving Inventory Coverage
Better Planning & Forecasting allows increased “Just in Time” Buying
With Longer Range Planning - Identifies “Horizon” of Need
Buys can be Scheduled
Risk/Rewards of Overbuying Can be Considered - In Advance

Planning New Items
Identify Similar Items
Varying Rules -- New Items should be > 20% of average
Review Relationships to other product
Consider competition (Internal & External)
Profit Projections (Is the item justified?)

Planning Repeat Items
Identify Similar Items
Consider “Wear Out” factors
Review Relationships to other product (especially competing new product)
Profit Projections (Is the item stilljustified?)

Timing - When Should You Start?
Based on Product Lead Times (Generally 9-12 months in advance, maybe longer)
Plan by “Horizon/Season” not by Drop

Benefits to Other Areas (Positive Profit Impacts)
Creative costs can be substantially reduced
DC supplied forecasts for bin “profiling”and setup
Last minute exceptions - handled more efficiently
Benefits to Other Areas (Positive Profit Impacts)
Inventory Buying can be “Scheduled”on a “Horizon” (and allow for less costly changes)
Dramatic positive impacts to cash flow
Reduced backorders & reduced overstock
Higher fill rates (both initial and final)
Increased “Bottom Line”
Planning for the Internet
New Medium/Channel
Standard Catalog Benchmarks?
• Demand, Response Rates?
How to Measure?
• Hits, Click-thru, Traffic, Actual Sales?

Planning for the Internet
Approach similar to Retail
Plan Assortment
Plan Sell-Thru
Constantly Move the Floor Adapting to Sales (Pull items on/off the Web Page)
Possible Approach • Combination of Retail & Catalog – (ratio of days/views offered to sell-thru/sales at base level??)
Summary
Take A Simple & General Approach
Improve majority of items
“ALMOST” Right NOW is better than…“EXACTLY” Right Later !
Reduce exceptions
Let the Assortment Plan be the CONTROL !!!

MerchandiseAssortment Planning
A Blue Print for Success
Annual Catalog Conference
June 4-7, 2001
Presented by:
George J. Mollo, Jr.
GJM Associates