mercer capital's value focus: medical device industry | q1 2016
TRANSCRIPT

VALUE FOCUS
Medical Device Industry
First Quarter 2016
www.mercercapital.com
Stock Market Performance 1
Venture Capital Funding & Exit Activity 3
Transaction Summary 6
Select Operating Metrics 8
Public Medical Device Companies 9
About Mercer Capital 15

© 2016 Mercer Capital // www.mercercapital.com 1
Mercer Capital’s Value Focus: Medical Device Industry First Quarter 2016
Total investor returns across major medical device sectors, excluding orthopedic, implants and prosthetics, exceeded S&P 500
performance over 2015. Overall, in-vitro diagnostic (IVD) and cardiovascular companies saw the largest YOY returns. With the
exception of the orthopedic, implants and prosthetics group, multiples expanded across all sectors compared to 3Q15.
» IVD companies followed a disappointing 3Q15 with a strong fourth quarter, gaining 16.6% over the period.
YOY, the sector gained 6.1% compared to a 0.7% decline for the S&P 500. Significant movers for the quarter
included Illumina (22.1%) and Bruker (48.8%).
» Cardiovascular companies returned a collective 14.7% over the year to 4Q15, but only 1.4% over the quarter.
Significant stock movers YOY within the group included Abiomed (137.2%), Edward Lifesciences Corporation
(24.0%), and Vascular Solutions (26.6%).
» The orthopedic, implants and prosthetics sector saw sharp declines in late 3Q15 and early 4Q15, but
recovered through year-end. Overall, the sector declined 3.7% YOY, while returning 9.3% gains in the fourth
quarter. Zimmer Biomet Holdings saw a 9.5% decline YOY. At its low, Zimmer was off nearly 25% from
its 2015 highs, although it recovered 9.2% in the fourth quarter. Wright Medical also had a strong 4Q15,
increasing 17.0% over the period.
» The larger diversified companies generally moved in step with the broader market, seeing a slightly more
favorable 1.0% increase YOY compared to the small decline observed in the S&P 500. Johnson & Johnson
saw its stock fall 2.9% over the year, while gaining 10.3% in the fourth quarter.
Stock Market Performance

© 2016 Mercer Capital // www.mercercapital.com 2
Mercer Capital’s Value Focus: Medical Device Industry First Quarter 2016
Total Shareholder Returns
-20%
-15%
-10%
-5%
0%
5%
10%
15%
20%
25%
30%
35%
Dec 31, 2014 Mar 31, 2015 Jun 30, 2015 Sep 30, 2015 Dec 31, 2015
S&P 500 Large, Diversified IV and Life Sciences Cardiovascular Ortho, Implants and Prosthetics
Represents market capitalization weighted index for each group. Source: Bloomberg, Mercer Capital analysis
Represents market capitalization weighted index for each group. Source: Bloomberg, Mercer Capital analysis
EV/EBITDA Multiples
Median EBITDA multiples from each MCM group. Data source: Bloomberg
0.0
2.5
5.0
7.5
10.0
12.5
15.0
17.5
20.0
Large, Diversified IVD Cardiovascular Ortho Other
Q4 2014 Q3 2015 Q4 2015
Median EBITDA multiples from each MCM group. Data source: Bloomberg

© 2016 Mercer Capital // www.mercercapital.com 3
Mercer Capital’s Value Focus: Medical Device Industry First Quarter 2016
Venture Capital funding in the medical device industry for 4Q15 totaled $589.3 million, a nearly 30% decline from 3Q15 and 22%
decrease YOY. Deal volume was flat from the prior quarter (77 in 4Q15 vs. 78 in 3Q15), while declining 16.3% from 4Q14 (92). This
decline followed the decline in total investment activity over the same period.1
» VC investments in medical device companies accounted for 5.2% of all VC investments during 4Q15, up from
5.0% in 3Q15 and 4.8% during 4Q14. While higher than the previous quarters, this still is 2.0% below the five-year
average (7.2%).
» Total VC funding for 4Q15 was $11.3 billion, down 27.6% compared to 4Q14. Life Science investment funding
(including biotechnology and medical devices) totaled a record high $2.0 billion in 4Q15, down 26.9% from 4Q14.
» Average deal size for medical device deals was $7.7 million, down from $10.7 million in 4Q15 and $8.2 million
in 4Q14.
1 Data compiled in the MoneyTree™ report, Online, Available, https://www.pwcmoneytree.com, Accessed March 2016.
Venture Capital Funding & Exit Activity

© 2016 Mercer Capital // www.mercercapital.com 4
Mercer Capital’s Value Focus: Medical Device Industry First Quarter 2016
Venture Capital Investments in Medical Devices
Data Source: MoneyTree Report; PwC/NVCA, Thomson Reuters, Mercer Capital analysis
0.0%
2.0%
4.0%
6.0%
8.0%
10.0%
12.0%
14.0%
16.0%
$0.0
$0.2
$0.4
$0.6
$0.8
$1.0
$1.2
$1.4
$1.6
Q1 1995
Q1 96 Q1 97 Q1 98 Q1 99 Q1 2000
Q1 01 Q1 02 Q1 03 Q1 04 Q1 05 Q1 06 Q1 07 Q1 08 Q1 09 Q1 10 Q1 11 Q1 12 Q1 13 Q1 14 Q1 15
Billions
Medical Devices & Equipment Medical Device % of Total VC Investments
2 “Seventy-Seven Venture –Backed Companies Went Public in 2015,” Online, Available, http://nvca.org/pressreleases/seventy-seven-venture-backed-companies-went-public-in-2015/, Accessed March 19, 2016.
3 Ibid.
Exit activity for venture-backed companies was down in 4Q15 compared to 3Q15.
» During 4Q15, seven IPOs of venture-backed life science companies (biotechnology and medical device /
healthcare) raised $681.0 million, compared to $1.3 billion raised in 3Q15. 2
» Eight venture-backed life science companies entered into strategic M&A transactions during 4Q15. Aggregate
transaction value for the ten deals with disclosed values totaled $922.4 million, a sharp decline from the previous
quarter ($1.6 billion). 3
Venture Capital Funding & Exit Activity (continued)

© 2016 Mercer Capital // www.mercercapital.com 5
Mercer Capital’s Value Focus: Medical Device Industry First Quarter 2016
Recent Financing
Company Amount ($M) Round Founded Notes
Endogastric Solutions Inc $50 Later Stage 2002 Develops orifice surgical products to treat gastrointestinal diseases
Nxthera Inc $40 Expansion 2008 Develops a medical device for men's healthcare
Axonics Modulation Technologies Inc $39 Early Stage 2012 Develops implantable neuromodulation technology
Fractyl Laboratories Inc $37 Expansion 2011 Develops medical device-based therapies for the treatment of chronic diseases
BAROnova Inc $37 Later Stage 2006Clinical-stage medical device company focused on developing non-surgical, non-pharmacologic devices to induce weight loss
Liris Biomedical Inc $32 Early Stage NA Develops therapeutics for the treatment of bladder diseases
NinePoint Medical Inc $31 Expansion NA Develops medical devices that enable in-vivo imaging
Cohera Medical Inc $30 Later Stage NA Develops surgical adhesives and sealants for application and procedures in surgery
Eargo Inc $25 Expansion 2013 Offers Eargo, a hearing aid product
Conventus Orthopaedics Inc $23 Expansion 2009 Provider of a range of orthopedic and sports medicine services
Cardionomic Inc $22 Early Stage NA Engages in the treatment of acute decompensated heart failure
GLYSENS INC $20 Early Stage 1998 Developing fully-implanted continuous glucose monitoring system
Crinetics Pharmaceuticals Inc $18 Early Stage 2008 Develops drugs to treat specialty endocrine disorders
Avedro Inc $17 Later Stage 2007 Developing science and technology relating to corneal cross-linking
Vapotherm Inc $15 Later Stage 1999 Develops and manufactures respiratory devices
BionX Medical Technologies Inc $11 Later Stage 2007 Developing the PowerFoot One, an ankle-foot device providing active amputees with near-normal gait
Neural Analytics Inc $10 NA 2013 Addressing the traumatic brain injuries through data science
Portal Instruments Inc $10 Early Stage 2012 Developing technology platform to transform the delivery of medicines
VITTAMED Corp $10 Early Stage 2006 Developing ultrasound-based, non-invasive neuro diagnostic equipment
Select Venture Funding Deals
Data Source: MoneyTree Report, PwC/NVCA, Thomson Reuters; and, CrunchBase [http://www.crunchbase.com/] at TechCrunch.com. Medical Devices and Equipment funding rounds over $10 million during 4Q15.

© 2016 Mercer Capital // www.mercercapital.com 6
Mercer Capital’s Value Focus: Medical Device Industry First Quarter 2016
Medical Devices Select Transactions Summary($Millions)
Implied Enterprise Value
Acquirer TargetAnnounce
DateImplied
EV EBIT EBITDA Revenue Sector
Shire Pharmaceuticals International Dyax Corp. 11/2/2015 6,230.9 NM NM 63.9x Biotechnology
Astellas US Holding, Inc. Ocata Therapeutics, Inc. 11/10/2015 339.6 NM NM NM Biotechnology
Smith & Nephew plc Blue Belt Technologies, Inc. 10/29/2015 275.0 NA NA NA Healthcare Equipment
Sinocare Inc. Nipro Diagnostics, Inc. (nka:Trividia Health, Inc.) 10/27/2015 272.5 NA NA NA Healthcare Equipment
Prestige Brands Holdings, Inc. DenTek Oral Care, Inc. 11/21/2015 225.0 NA NA 3.8x Healthcare Supplies
Endologix Inc. TriVascular Technologies, Inc. 10/26/2015 201.5 NM NM 5.6x Healthcare Equipment
Ligand Pharmaceuticals Incorporated Open Monoclonal Technology, Inc. 12/17/2015 178.0 NA NA NA Biotechnology
Valiant Co., Ltd. MP Biomedicals, LLC 10/19/2015 142.3 18.2x NA 2.3xLife Sciences Tools and Services
Novartis International AG Admune Therapeutics LLC 10/16/2015 140.0 NA NA NA Biotechnology
AtriCure, Inc. nContact, Inc. 10/4/2015 132.2 NA NA NA Healthcare Equipment
Only deals with available deal size information shown. | Data Source: Bloomberg and Capital IQ

© 2016 Mercer Capital // www.mercercapital.com 7
Mercer Capital’s Value Focus: Medical Device Industry First Quarter 2016
Implied Enterprise Value
Acquirer TargetAnnounce
DateImplied
EV EBIT EBITDA Revenue Sector
Ervington Investments Limited Neothetics, Inc. 12/4/2015 131.7 NM NM NA Biotechnology
CryoLife Inc. On-X Life Technologies Inc. 12/22/2015 128.5 NA NA 3.9x Healthcare Equipment
Brooks Automation, Inc. BioStorage Technologies, Inc. 11/4/2015 127.0 NA NA 3.2xLife Sciences Tools and Services
Medtronic plc Aircraft Medical Limited 11/18/2015 110.0 NA NA NA Healthcare Equipment
CFS 915 LLC Cardiac Science Corporation 10/19/2015 82.7 NA NA NA Healthcare Equipment
SciVac Therapeutics Inc. VBI Vaccines Inc 10/26/2015 80.1 NM NM 206.1x Biotechnology
ICU Medical, Inc. Excelsior Medical Corporation 10/5/2015 59.5 NA NA NA Healthcare Supplies
ALPHAEON Corporation LENSAR, Inc. 11/15/2015 59.0 NA NA NA Healthcare Equipment
Abcam Plc AxioMx Inc. 11/11/2015 45.0 NA NA NA Biotechnology
Agenus Inc. PhosImmune Inc. 12/23/2015 44.9 NA NA NA Biotechnology
Only deals with available deal size information shown. | Data Source: Bloomberg and Capital IQ
Medical Devices Select Transactions Summary (continued)($Millions)

© 2016 Mercer Capital // www.mercercapital.com 8
Mercer Capital’s Value Focus: Medical Device Industry First Quarter 2016
Median measures for each group. | Data Source: Bloomberg
Gross Margin EBITDA Margin Operating Margin R&D / Revenue
Segment Q4 2015 Q3 2015 Q4 2015 Q3 2015 Q4 2015 Q3 2015 Q4 2015 Q3 2015
Large, Diversified 66.0% 66.0% 26.8% 26.9% 14.1% 14.0% 7.6% 7.7%
IVD & Life Sciences 58.3% 57.6% 14.8% 15.3% 8.6% 6.9% 9.6% 10.3%
Cardiovascular 66.8% 66.6% 17.2% 18.7% 6.9% 8.1% 12.2% 11.8%
Ortho, Implants & Prosthetics 70.0% 72.9% 16.7% 17.6% 7.8% 7.6% 6.7% 6.4%
Other 52.6% 53.4% 4.6% 4.0% 1.4% 1.7% 7.8% 7.8%
All Companies 58.3% 58.9% 15.6% 16.5% 8.5% 7.7% 7.8% 7.7%
Historical Rev Growth LT Fwd Op Earn Grwth Debt / EV Debt / EBITDA
Segment Quarterly Annual Q4 2015 Q3 2015 Q4 2015 Q3 2015 Q4 2015 Q3 2015
Large, Diversified 1.0% 1.6% 10.5% 10.7% 18.8% 21.3% 2.6 2.6
IVD & Life Sciences 0.8% 4.5% 13.1% 14.5% 5.9% 8.5% 1.4 1.5
Cardiovascular 1.8% 5.3% 17.4% 15.1% 7.3% 7.2% 0.8 0.6
Ortho, Implants & Prosthetics 1.9% 5.0% 13.8% 14.0% 19.8% 16.3% 1.9 2.1
Other 1.8% 6.1% 15.0% 16.0% 2.0% 3.2% 0.2 0.2
All Companies 1.5% 5.2% 14.1% 15.0% 7.1% 8.1% 0.9 0.9
Select Operating Metrics

© 2016 Mercer Capital // www.mercercapital.com 9
Mercer Capital’s Value Focus: Medical Device Industry First Quarter 2016
Price ∆ Stock Price EV TTM RevTTM
EBITDA FWD EBITDAEV /
SalesEV /
EBITDAEV /
FWD EBITDA
Q4 2015 Q3 2015 Q4 2014 Qtrly Annual Q4 2015 Q4 2015 Q4 2015 FY 2016 FY 2017 Q4 2015 Q4 2015 2016 2017
Large, Diversified
Abbott Laboratories $44.91 $39.50 $45.69 13.7% -1.7% $69,869.1 $20,405.0 $4,840.0 $5,148.9 $5,612.5 3.42 14.4 13.6 12.4
Baxter $38.15 $32.69 $40.21 16.7% -5.1% $20,027.7 $12,747.0 $2,532.0 $1,731.1 $1,934.9 1.57 7.9 11.6 10.4
Becton, Dickinson and Company $154.09 $130.89 $139.93 17.7% 10.1% $43,908.7 $11,216.0 $3,100.0 $3,499.7 $3,769.8 3.91 14.2 12.5 11.6
Boston Scientific Corporation $18.44 $16.00 $13.37 15.3% 37.9% $30,163.4 $7,477.0 $1,945.0 $2,239.3 $2,464.1 4.03 15.5 13.5 12.2
Medtronic, Inc. $76.92 $66.37 $73.07 15.9% 5.3% $126,709.5 $28,570.0 $7,978.0 $9,098.9 $10,272.0 4.44 15.9 13.9 12.3
Johnson & Johnson $102.72 $93.04 $105.36 10.4% -2.5% $265,705.5 $70,074.0 $23,046.0 $25,079.5 $26,463.1 3.79 11.5 10.6 10.0
Stryker Corporation $92.94 $93.23 $95.56 -0.3% -2.7% $34,844.0 $9,946.0 $2,668.0 $2,961.5 $3,329.7 3.50 13.1 11.8 10.5
IVD & Life Sciences
Affymetrix, Inc. $10.09 $8.50 $9.99 18.7% 1.0% $792.2 $359.8 $49.4 $70.8 $76.7 2.20 16.0 11.2 10.3
Bio-Rad Laboratories, Inc. $138.66 $133.19 $121.96 4.1% 13.7% $3,002.1 $2,019.4 $304.7 $281.5 $306.5 1.49 9.9 10.7 9.8
Bruker Corporation $24.27 $16.46 $19.92 47.4% 21.8% $3,873.4 $1,623.8 $247.7 $289.9 $314.4 2.39 15.6 13.4 12.3
Enzo Biochem, Inc. $4.50 $3.12 $4.50 44.2% 0.0% $173.3 $99.4 ($6.5) ($6.3) ($5.0) 1.74 nm nm nm
GenMark Diagnostics, Inc. $7.76 $7.51 $13.60 3.3% -42.9% $293.8 $39.4 ($38.1) ($49.0) ($42.1) 7.45 nm nm nm
Haemonetics Corporation $32.24 $33.50 $38.58 -3.8% -16.4% $1,957.3 $893.0 $194.2 $206.8 $215.6 2.19 10.1 9.5 9.1
Hologic, Inc. $38.69 $37.86 $26.92 2.2% 43.7% $13,927.7 $2,747.4 $993.4 $1,055.0 $1,126.7 5.07 14.0 13.2 12.4
Illumina, Inc. $191.95 $169.82 $186.29 13.0% 3.0% $27,803.5 $2,219.8 $750.5 $811.2 $966.7 12.53 37.0 34.3 28.8
Luminex Corporation $21.39 $16.75 $18.78 27.7% 13.9% $780.6 $237.7 $52.3 $59.3 $64.1 3.28 14.9 13.2 12.2
OraSure Technology $6.44 $4.69 $10.17 37.3% -36.7% $262.4 $119.7 $13.8 $15.5 $21.6 2.19 19.1 16.9 12.1
Quidel Coporation $21.20 $18.82 $28.40 12.6% -25.4% $667.2 $195.4 $28.5 $36.8 $51.0 3.41 23.4 18.1 13.1
TECHNE Corporation $90.00 $90.83 $93.40 -0.9% -3.6% $3,399.8 $465.1 $186.2 $197.7 $211.7 7.31 18.3 17.2 16.1
Trinity Biotech $11.76 $11.43 $16.80 2.9% -30.0% $267.2 $100.2 $0.0 $21.5 $24.4 2.67 nm 12.4 11.0
Vermillion, Inc. $1.80 $2.00 $1.93 -10.0% -6.7% $69.6 $3.4 ($13.9) nm nm 20.57 nm nm nm
($Millions, except per share figures)
Data Source: Bloomberg
Public Medical Device Companies
© 2016 Mercer Capital // www.mercercapital.com 10
Mercer Capital’s Value Focus: Medical Device Industry First Quarter 2016
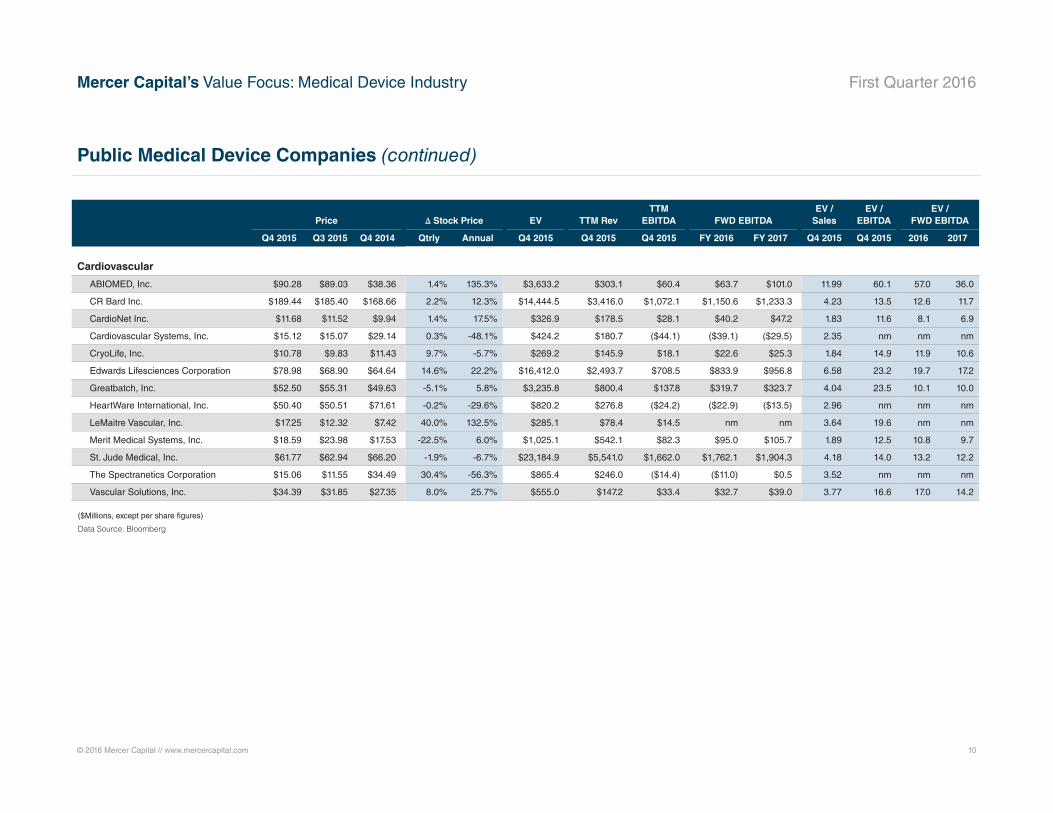
Public Medical Device Companies (continued)
Price ∆ Stock Price EV TTM RevTTM
EBITDA FWD EBITDAEV /
SalesEV /
EBITDAEV /
FWD EBITDA
Q4 2015 Q3 2015 Q4 2014 Qtrly Annual Q4 2015 Q4 2015 Q4 2015 FY 2016 FY 2017 Q4 2015 Q4 2015 2016 2017
Cardiovascular
ABIOMED, Inc. $90.28 $89.03 $38.36 1.4% 135.3% $3,633.2 $303.1 $60.4 $63.7 $101.0 11.99 60.1 57.0 36.0
CR Bard Inc. $189.44 $185.40 $168.66 2.2% 12.3% $14,444.5 $3,416.0 $1,072.1 $1,150.6 $1,233.3 4.23 13.5 12.6 11.7
CardioNet Inc. $11.68 $11.52 $9.94 1.4% 17.5% $326.9 $178.5 $28.1 $40.2 $47.2 1.83 11.6 8.1 6.9
Cardiovascular Systems, Inc. $15.12 $15.07 $29.14 0.3% -48.1% $424.2 $180.7 ($44.1) ($39.1) ($29.5) 2.35 nm nm nm
CryoLife, Inc. $10.78 $9.83 $11.43 9.7% -5.7% $269.2 $145.9 $18.1 $22.6 $25.3 1.84 14.9 11.9 10.6
Edwards Lifesciences Corporation $78.98 $68.90 $64.64 14.6% 22.2% $16,412.0 $2,493.7 $708.5 $833.9 $956.8 6.58 23.2 19.7 17.2
Greatbatch, Inc. $52.50 $55.31 $49.63 -5.1% 5.8% $3,235.8 $800.4 $137.8 $319.7 $323.7 4.04 23.5 10.1 10.0
HeartWare International, Inc. $50.40 $50.51 $71.61 -0.2% -29.6% $820.2 $276.8 ($24.2) ($22.9) ($13.5) 2.96 nm nm nm
LeMaitre Vascular, Inc. $17.25 $12.32 $7.42 40.0% 132.5% $285.1 $78.4 $14.5 nm nm 3.64 19.6 nm nm
Merit Medical Systems, Inc. $18.59 $23.98 $17.53 -22.5% 6.0% $1,025.1 $542.1 $82.3 $95.0 $105.7 1.89 12.5 10.8 9.7
St. Jude Medical, Inc. $61.77 $62.94 $66.20 -1.9% -6.7% $23,184.9 $5,541.0 $1,662.0 $1,762.1 $1,904.3 4.18 14.0 13.2 12.2
The Spectranetics Corporation $15.06 $11.55 $34.49 30.4% -56.3% $865.4 $246.0 ($14.4) ($11.0) $0.5 3.52 nm nm nm
Vascular Solutions, Inc. $34.39 $31.85 $27.35 8.0% 25.7% $555.0 $147.2 $33.4 $32.7 $39.0 3.77 16.6 17.0 14.2
($Millions, except per share figures)
Data Source: Bloomberg

© 2016 Mercer Capital // www.mercercapital.com 11
Mercer Capital’s Value Focus: Medical Device Industry First Quarter 2016
Price ∆ Stock Price EV TTM RevTTM
EBITDA FWD EBITDAEV /
SalesEV /
EBITDAEV /
FWD EBITDA
Q4 2015 Q3 2015 Q4 2014 Qtrly Annual Q4 2015 Q4 2015 Q4 2015 FY 2016 FY 2017 Q4 2015 Q4 2015 2016 2017
Ortho, Implants and Prosthetics
Alphatech Holdings $0.30 $0.32 $1.33 -6.2% -77.4% $122.8 $185.3 $13.2 $22.8 NM 0.66 9.3 5.4 nm
Exactech, Inc. $18.15 $17.77 $23.44 2.1% -22.6% $258.8 $241.8 $40.4 $44.1 $47.4 1.07 6.4 5.9 5.5
Globus Medical, Inc. $27.82 $20.98 $24.08 32.6% 15.5% $1,655.1 $544.8 $188.4 $207.8 $227.6 3.04 8.8 8.0 7.3
Intergra LifeSciences Holdings $67.78 $59.47 $54.38 14.0% 24.6% $3,173.5 $945.3 $194.1 $233.3 $257.5 3.36 16.4 13.6 12.3
NuVasive, Inc. $54.11 $46.69 $48.10 15.9% 12.5% $2,562.7 $811.1 $182.8 $227.1 $262.4 3.16 14.0 11.3 9.8
Orthofix International N.V. $39.21 $32.68 $30.64 20.0% 28.0% $677.0 $396.5 $44.6 $69.8 $84.8 1.71 15.2 9.7 8.0
RTI Surgical Inc. $3.97 $5.47 $5.24 -27.4% -24.2% $352.8 $282.3 $43.8 $39.3 $42.5 1.25 8.1 9.0 8.3
Wright Medical Group, Inc. $24.18 $20.34 $25.70 18.9% -5.9% $2,922.0 $423.2 ($2.6) $26.2 $61.5 6.90 nm 111.7 47.5
Zimmer Holdings, Inc. $102.59 $93.79 $114.57 9.4% -10.5% $30,837.9 $5,997.8 $2,089.2 $3,030.0 $3,212.6 5.14 14.8 10.2 9.6
($Millions, except per share figures)
Data Source: Bloomberg
Public Medical Device Companies (continued)

© 2016 Mercer Capital // www.mercercapital.com 12
Mercer Capital’s Value Focus: Medical Device Industry First Quarter 2016
Price ∆ Stock Price EV TTM RevTTM
EBITDA FWD EBITDAEV /
SalesEV /
EBITDAEV /
FWD EBITDA
Q4 2015 Q3 2015 Q4 2014 Qtrly Annual Q4 2015 Q4 2015 Q4 2015 FY 2016 FY 2017 Q4 2015 Q4 2015 2016 2017
Cosmetics
Cutera, Inc. $12.79 $13.07 $9.96 -2.1% 28.4% $117.0 $94.8 ($2.8) $5.2 $4.6 1.23 nm 22.4 25.4
Cynosure, Inc. $44.67 $30.05 $27.87 48.7% 60.3% $850.5 $339.5 $53.3 $60.0 $79.9 2.51 16.0 14.2 10.7
PhotoMedex, Inc. $0.45 $0.48 $1.57 -7.0% -71.3% $6.7 $104.9 ($8.2) nm nm 0.06 nm nm nm
Dental
Align Technology, Inc. $65.85 $55.91 $56.36 17.8% 16.8% $4,555.8 $845.5 $206.6 $249.0 $310.0 5.39 22.0 18.3 14.7
DENTSPLY International $60.85 $50.52 $53.34 20.4% 14.1% $9,389.6 $2,674.3 $592.2 $1,024.5 $1,195.3 3.51 15.9 9.2 7.9
Sirona Dental Systems, Inc. $109.57 $94.03 $88.68 16.5% 23.6% $5,702.3 $1,172.5 $337.1 $375.8 $409.3 4.86 16.9 15.2 13.9
Obesity Treatment
EnteroMedics Inc. $0.13 $0.24 $1.38 -46.0% -90.6% ($11.3) $0.3 ($26.2) nm nm nm 0.4 nm nm
ZELTIQ Aesthetics, Inc. $28.53 $30.95 $27.68 -7.8% 3.1% $1,065.1 $255.4 $6.1 $30.4 $60.5 4.17 174.1 35.0 17.6
Pediatric Medical Devices
Natus Medical Incorporated $48.05 $38.24 $35.73 25.7% 34.5% $1,504.2 $375.9 $77.0 $84.1 $92.7 4.00 19.5 17.9 16.2
Surgery and Life Support Devices
AtriCure $22.44 $20.65 $19.21 8.7% 16.8% $702.5 $129.8 ($17.4) ($15.1) ($9.8) 5.41 nm nm nm
Intuitive Surgical, Inc. $546.16 $455.47 $525.91 19.9% 3.9% $18,847.5 $2,384.4 $842.7 $1,020.0 $1,143.9 7.90 22.4 18.5 16.5
Misonix, Inc. $9.40 $10.95 $12.42 -14.2% -24.3% $63.7 $23.4 ($1.5) nm nm 2.73 nm nm nm
NxStage Medical, Inc. $21.91 $16.44 $18.23 33.3% 20.2% $1,357.6 $336.1 $16.1 $25.4 $36.2 4.04 84.4 53.5 37.5
Stereotaxis, Inc. $0.74 $1.02 $1.59 -27.1% -53.2% $28.9 $37.7 ($3.1) nm nm 0.77 nm nm nm
SurModics Inc. $20.27 $21.86 $22.40 -7.3% -9.5% $219.7 $64.2 $25.1 $19.0 $25.2 3.42 8.8 11.6 8.7
Teleflex, Inc. $131.45 $123.75 $116.22 6.2% 13.1% $6,196.3 $1,809.7 $434.7 $521.7 $597.3 3.42 14.3 11.9 10.4
($Millions, except per share figures)
Data Source: Bloomberg
Public Medical Device Companies (continued)

© 2016 Mercer Capital // www.mercercapital.com 13
Mercer Capital’s Value Focus: Medical Device Industry First Quarter 2016
Price ∆ Stock Price EV TTM RevTTM
EBITDA FWD EBITDAEV /
SalesEV /
EBITDAEV /
FWD EBITDA
Q4 2015 Q3 2015 Q4 2014 Qtrly Annual Q4 2015 Q4 2015 Q4 2015 FY 2016 FY 2017 Q4 2015 Q4 2015 2016 2017
General Hospital Devices and Supplies
CONMED Corporation $44.05 $47.09 $44.97 -6.5% -2.0% $1,418.7 $719.2 $119.3 $127.3 $137.7 1.97 11.9 11.1 10.3
Digirad Corporation $5.79 $3.65 $4.25 58.6% 36.2% $93.3 $60.8 $6.5 $17.4 $18.5 1.53 14.4 5.4 5.0
Dynatronics Corporation $2.96 $3.08 $3.75 -4.0% -21.1% $13.8 $29.5 ($0.3) nm nm 0.47 nm nm nm
FONAR Corporation $17.26 $12.42 $9.78 39.0% 76.5% $99.0 $70.0 $17.1 nm nm 1.42 5.8 nm nm
Intuitive Surgical, Inc. $546.16 $455.47 $525.91 19.9% 3.9% $18,847.5 $2,384.4 $842.7 $1,020.0 $1,143.9 7.90 22.4 18.5 16.5
Masimo Corporation $41.51 $37.61 $26.43 10.4% 57.1% $2,141.2 $630.1 $116.9 $120.6 $168.0 3.40 18.3 17.8 12.7
Opko Health, Inc. $10.05 $8.42 $9.85 19.4% 2.0% $5,344.7 $491.7 ($41.8) $66.1 $279.3 10.87 nm 80.9 19.1
STERIS Corporation $75.34 $64.38 $65.84 17.0% 14.4% $7,873.8 $2,050.1 $423.3 $472.5 $554.0 3.84 18.6 16.7 14.2
Varian Medical Systems, Inc. $80.80 $73.25 $88.01 10.3% -8.2% $8,484.7 $3,118.4 $622.7 $666.1 $700.1 2.72 13.6 12.7 12.1
Home Health and Consumer Devices
Invacare Corporation $17.39 $14.57 $16.94 19.4% 2.7% $534.2 $1,142.3 $11.4 $22.2 $54.1 0.47 46.9 24.1 9.9
Mine Safety Appliances Company $43.47 $38.69 $53.85 12.4% -19.3% $1,985.8 $1,129.5 $172.1 $200.5 $211.3 1.76 11.5 9.9 9.4
ResMed Inc. $53.69 $50.62 $56.74 6.1% -5.4% $7,240.6 $1,741.7 $502.5 $535.3 $616.9 4.16 14.4 13.5 11.7
Span-America Medical Systems, Inc. $19.65 $17.25 $17.12 13.9% 14.8% $58.4 $70.0 $6.7 nm nm 0.83 8.8 nm nm
Syneron Medical Ltd. $7.71 $7.01 $9.31 10.0% -17.2% $196.7 $277.9 $7.1 nm nm 0.71 27.7 nm nm
($Millions, except per share figures)
Data Source: Bloomberg
Public Medical Device Companies (continued)

© 2016 Mercer Capital // www.mercercapital.com 14
Mercer Capital’s Value Focus: Medical Device Industry First Quarter 2016
Price ∆ Stock Price EV TTM RevTTM
EBITDA FWD EBITDAEV /
SalesEV /
EBITDAEV /
FWD EBITDA
Q4 2015 Q3 2015 Q4 2014 Qtrly Annual Q4 2015 Q4 2015 Q4 2015 FY 2016 FY 2017 Q4 2015 Q4 2015 2016 2017
Other Medical Device
Accuray Incorporated $6.75 $4.98 $7.53 35.5% -10.4% $590.1 $397.8 $10.9 $22.2 $39.0 1.48 54.0 26.5 15.1
Allied Healthcare Products, Inc. $1.12 $1.15 $1.51 -2.8% -26.0% $7.3 $34.9 ($1.0) nm nm 0.21 nm nm nm
Arrhythmia Research Technology, Inc. $5.48 $6.20 $7.95 -11.6% -31.1% $19.6 $21.5 $1.0 nm nm 0.91 19.7 nm nm
Dehaier Medical Systems Limited $2.26 $1.44 $2.72 57.1% -16.8% $13.2 $8.3 $0.0 nm nm 1.59 nm nm nm
Escalon Medical Corp. $1.06 $1.15 $1.46 -7.8% -27.4% $7.1 $12.6 ($1.1) nm nm 0.57 nm nm nm
Hansen Medical, Inc. $2.33 $3.71 $0.56 -37.2% 316.1% $48.6 $17.1 ($36.8) nm nm 2.84 nm nm nm
IRIDEX Corporation $9.29 $7.16 $8.41 29.7% 10.5% $82.4 $41.8 $0.2 nm nm 1.97 438.3 nm nm
Navidea Biopharmaceuticals, Inc. $1.33 $2.26 $1.83 -41.2% -27.3% $257.0 $11.2 ($19.9) nm nm 23.04 nm nm nm
ThermoGenesis Corp. $0.18 $0.58 $1.04 -68.8% -82.5% ($2.5) $13.9 ($10.9) nm nm nm 0.2 nm nm
Congentix Medical, Inc. $1.29 $1.10 $0.76 17.3% 69.7% $55.0 $43.6 ($2.4) nm nm 1.26 nm nm nm
Other Diversified Cos with Med-Tech Components
Agilent Technologies, Inc. $41.81 $33.74 $41.37 23.9% 1.1% $13,690.1 $4,040.0 $889.0 $909.2 $1,015.5 3.39 15.4 15.1 13.5
Danaher Corporation $92.88 $83.21 $86.24 11.6% 7.7% $75,728.9 $20,908.6 $4,830.0 $5,409.1 $5,863.6 3.62 15.7 14.0 12.9
General Electric $31.15 $24.57 $25.57 26.8% 21.8% $386,835.7 $125,456.0 $19,244.5 $18,029.0 $18,676.0 3.08 20.1 21.5 20.7
PerkinElmer, Inc. $53.57 $45.29 $44.08 18.3% 21.5% $6,769.7 $2,262.4 $428.8 $462.8 $494.8 2.99 15.8 14.6 13.7
Thermo Fisher Scientific Inc. $141.85 $119.84 $126.61 18.4% 12.0% $68,686.7 $16,965.4 $4,184.2 $4,443.1 $4,736.3 4.05 16.4 15.5 14.5
($Millions, except per share figures)
Data Source: Bloomberg
Public Medical Device Companies (continued)
Copyright © 2015 Mercer Capital Management, Inc. All rights reserved. It is illegal under Federal law to reproduce this publication or any portion of its contents without the publisher’s permission. Media quotations with source attribution are encouraged.
Reporters requesting additional information or editorial comment should contact Barbara Walters Price at 901.685.2120. Mercer Capital’s Industry Focus is published quarterly and does not constitute legal or financial consulting advice. It is offered as an
information service to our clients and friends. Those interested in specific guidance for legal or accounting matters should seek competent professional advice. Inquiries to discuss specific valuation matters are welcomed. To add your name to our mailing list
to receive this complimentary publication, visit our web site at www.mercercapital.com.
BUSINESS VALUATION & FINANCIAL ADVISORY SERVICES
Mercer CapitalMedical Device Industry Services
Mercer Capital provides valuation services to start ups, larger public and private companies, and private equity and venture capital funds.
Mercer Capital’s expertise in the medical device industry spans the following segments:
• Cardiovascular
• Orthopedic & Spinal
• Dental
• Diagnostics Equipment
• Biologics
Our services include:
• Equity compensation valuation for 409a compliance
• Portfolio valuation for LP reporting
• Purchase price allocations
• Impairment testing
• Transaction and valuation advisory
Contact a Mercer Capital professional to discuss your needs in confidence.
Contact Us Sujan Rajbhandary, [email protected]
Travis W. Harms, CFA, CPA/[email protected]
Atticus [email protected]
MERCER CAPITAL
Memphis5100 Poplar Avenue, Suite 2600Memphis, Tennessee 38137901.685.2120
Dallas12201 Merit Drive, Suite 480Dallas, Texas 75251214.468.8400
Nashville102 Woodmont Blvd., Suite 231Nashville, Tennessee 37205615.345.0350
www.mercercapital.com