mercer capital's value focus: fintech industry | q3 2014 | segment: payments
TRANSCRIPT

VALUE FOCUSFinTech Industry
FinTech Industry OverviewPublic Market Indicators 1FinTech Indices vs. S&P 500 1Median Total Return 1Valuation Multiples 2Industry Articles of Note 2
Segment Focus: PaymentsM&A Activity Overview 3Venture Capital Overview 4Venture Capital Case Study:
Gyft, Inc. 6
Publicly Traded FinTech CompaniesTechnology 9Solutions 10Payments 12
About Mercer Capital 14
Q1: Technology Q2: SolutionsQ3: Payments Q4: Technology
Segment Focus: Payments 2014

© 2014 Mercer Capital // www.mercercapital.com 1
Mercer Capital’s Value Focus: FinTech Industry Third Quarter 2014
100 !
105 !
110 !
115 !
120 !
125 !
130 !
135 !
Sept
embe
r 3, 2
013
= 10
0!
MCM FinTech Indices vs. S&P 500 for LTM Period
FinTech - Solutions! S&P 500!FinTech - Payments! FinTech - Technology!
Mercer Capital FinTech Indices vs. S&P 500for LTM Period
Source: SNL Financial
Median Total Returnas of September 3, 2014
Segment Month-to-Date Year-to-Date Last 12 Months
FinTech - Payments 2.0% -2.1% 21.4%
FinTech - Solutions 2.9% 1.3% 20.1%
FinTech - Technology 5.9% -0.7% 18.2%
S&P 500 4.0% 10.3% 24.7%
Source: SNL Financial
Public Market IndicatorsThe FinTech Industry has performed largely in-line with the S&P 500 in the trailing twelve months through 8/31/2014.
• FinTech sector outperformed broader markets in late 2013 but has underperformed both broader markets as well as technology sector year-to-date.
• Small- and mid-cap stocks, of which a number of FinTech companies would be classified, have generally underperformed both broader markets as well as large-caps year-to-date.
Market performance of FinTech companies has gyrated as investors weigh:
• Threats of new entrants
• Continued technological change
• Emerging risks including regulatory and business model
© 2014 Mercer Capital // www.mercercapital.com 2
Mercer Capital’s Value Focus: FinTech Industry Third Quarter 2014
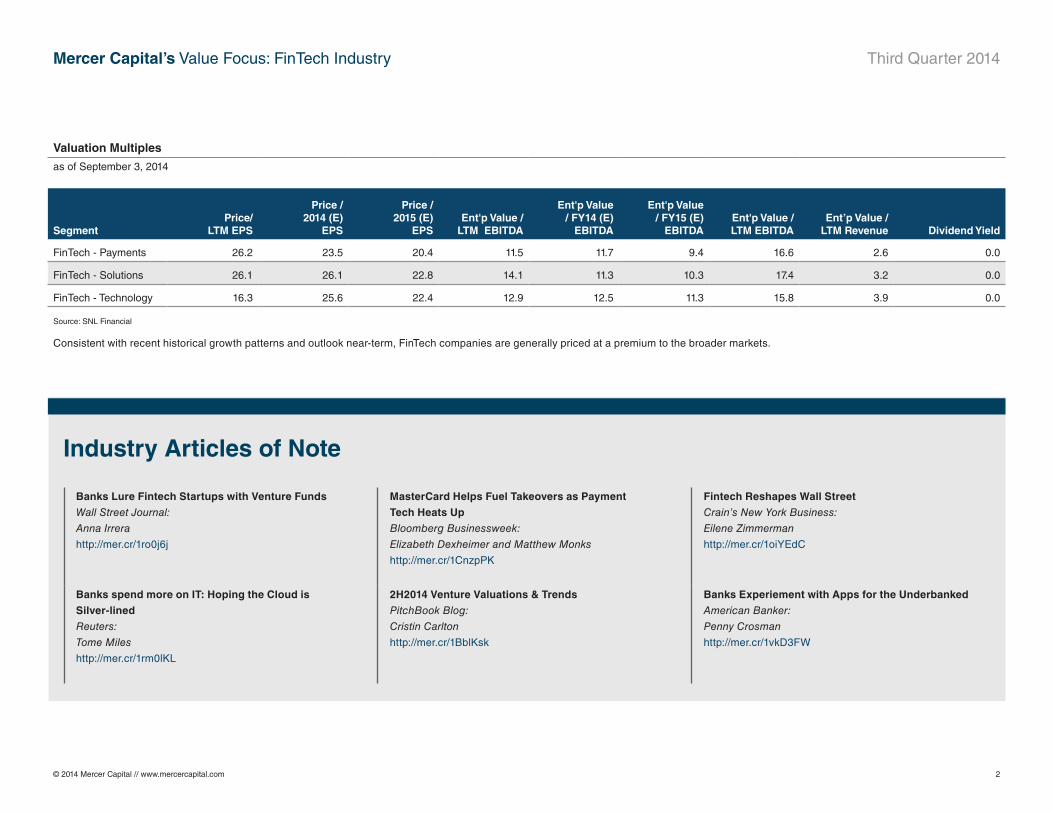
Valuation Multiples
as of September 3, 2014
SegmentPrice/
LTM EPS
Price / 2014 (E)
EPS
Price / 2015 (E)
EPSEnt'p Value /
LTM EBITDA
Ent'p Value / FY14 (E)
EBITDA
Ent'p Value / FY15 (E)
EBITDAEnt'p Value / LTM EBITDA
Ent’p Value / LTM Revenue Dividend Yield
FinTech - Payments 26.2 23.5 20.4 11.5 11.7 9.4 16.6 2.6 0.0
FinTech - Solutions 26.1 26.1 22.8 14.1 11.3 10.3 17.4 3.2 0.0
FinTech - Technology 16.3 25.6 22.4 12.9 12.5 11.3 15.8 3.9 0.0
Source: SNL Financial
Consistent with recent historical growth patterns and outlook near-term, FinTech companies are generally priced at a premium to the broader markets.
Industry Articles of Note
Banks Lure Fintech Startups with Venture Funds
Wall Street Journal:
Anna Irrera
http://mer.cr/1ro0j6j
MasterCard Helps Fuel Takeovers as Payment
Tech Heats Up
Bloomberg Businessweek:
Elizabeth Dexheimer and Matthew Monks
http://mer.cr/1CnzpPK
Fintech Reshapes Wall Street
Crain’s New York Business:
Eilene Zimmerman
http://mer.cr/1oiYEdC
Banks spend more on IT: Hoping the Cloud is
Silver-lined
Reuters:
Tome Miles
http://mer.cr/1rm0lKL
2H2014 Venture Valuations & Trends
PitchBook Blog:
Cristin Carlton
http://mer.cr/1BblKsk
Banks Experiement with Apps for the Underbanked
American Banker:
Penny Crosman
http://mer.cr/1vkD3FW
© 2014 Mercer Capital // www.mercercapital.com 3
Mercer Capital’s Value Focus: FinTech Industry Third Quarter 2014
Acquirer TargetAnnounce
Date
Deal Value
($MM) Description of Target’s Business
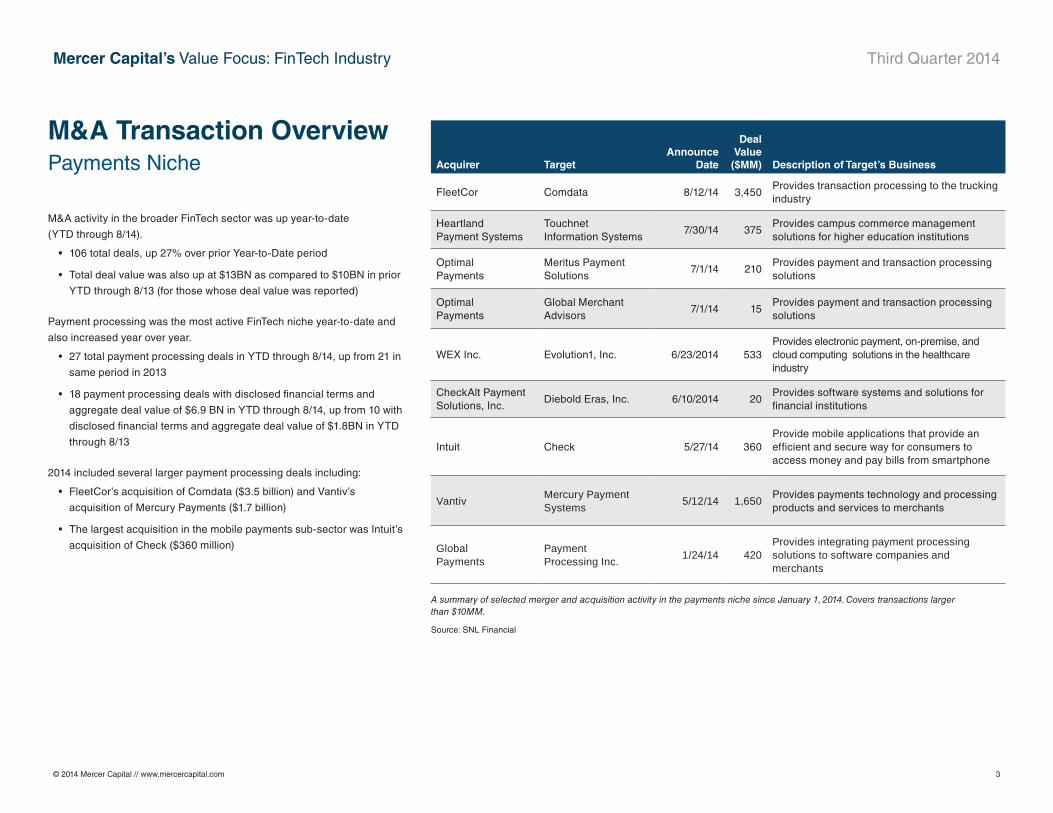
FleetCor Comdata 8/12/14 3,450 Provides transaction processing to the trucking industry
Heartland Payment Systems
Touchnet Information Systems
7/30/14 375 Provides campus commerce management solutions for higher education institutions
Optimal Payments
Meritus Payment Solutions
7/1/14 210 Provides payment and transaction processing solutions
Optimal Payments
Global Merchant Advisors
7/1/14 15 Provides payment and transaction processing solutions
WEX Inc. Evolution1, Inc. 6/23/2014 533Provides electronic payment, on-premise, and cloud computing solutions in the healthcare industry
CheckAlt Payment Solutions, Inc.
Diebold Eras, Inc. 6/10/2014 20Provides software systems and solutions for financial institutions
Intuit Check 5/27/14 360 Provide mobile applications that provide an efficient and secure way for consumers to access money and pay bills from smartphone
VantivMercury Payment Systems
5/12/14 1,650 Provides payments technology and processing products and services to merchants
Global Payments
Payment Processing Inc.
1/24/14 420 Provides integrating payment processing solutions to software companies and merchants
A summary of selected merger and acquisition activity in the payments niche since January 1, 2014. Covers transactions larger than $10MM.
Source: SNL Financial
M&A Transaction OverviewPayments Niche
M&A activity in the broader FinTech sector was up year-to-date
(YTD through 8/14).
• 106 total deals, up 27% over prior Year-to-Date period
• Total deal value was also up at $13BN as compared to $10BN in prior
YTD through 8/13 (for those whose deal value was reported)
Payment processing was the most active FinTech niche year-to-date and
also increased year over year.
• 27 total payment processing deals in YTD through 8/14, up from 21 in
same period in 2013
• 18 payment processing deals with disclosed financial terms and
aggregate deal value of $6.9 BN in YTD through 8/14, up from 10 with
disclosed financial terms and aggregate deal value of $1.8BN in YTD
through 8/13
2014 included several larger payment processing deals including:
• FleetCor’s acquisition of Comdata ($3.5 billion) and Vantiv’s
acquisition of Mercury Payments ($1.7 billion)
• The largest acquisition in the mobile payments sub-sector was Intuit’s
acquisition of Check ($360 million)
© 2014 Mercer Capital // www.mercercapital.com 4
Mercer Capital’s Value Focus: FinTech Industry Third Quarter 2014
CompanyAmount
($M) Company Description Website
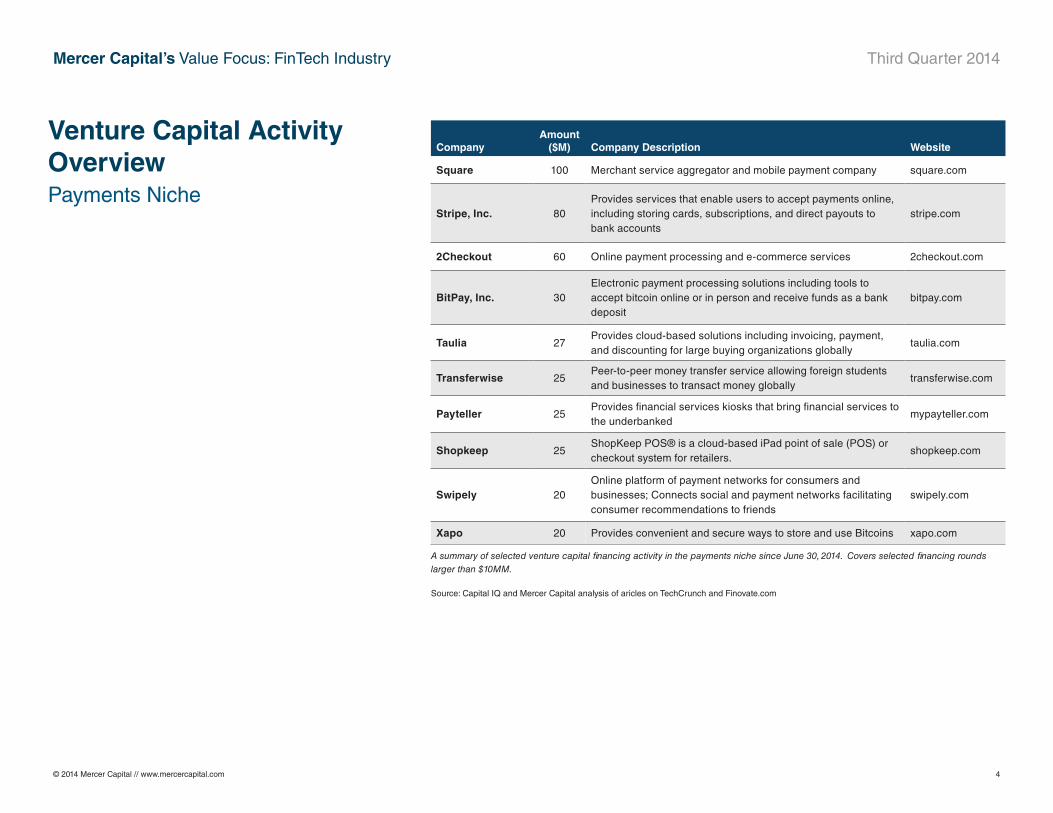
Square 100 Merchant service aggregator and mobile payment company square.com
Stripe, Inc. 80Provides services that enable users to accept payments online, including storing cards, subscriptions, and direct payouts to bank accounts
stripe.com
2Checkout 60 Online payment processing and e-commerce services 2checkout.com
BitPay, Inc. 30Electronic payment processing solutions including tools to accept bitcoin online or in person and receive funds as a bank deposit
bitpay.com
Taulia 27Provides cloud-based solutions including invoicing, payment, and discounting for large buying organizations globally
taulia.com
Transferwise 25Peer-to-peer money transfer service allowing foreign students and businesses to transact money globally
transferwise.com
Payteller 25Provides financial services kiosks that bring financial services to the underbanked
mypayteller.com
Shopkeep 25ShopKeep POS® is a cloud-based iPad point of sale (POS) or checkout system for retailers.
shopkeep.com
Swipely 20Online platform of payment networks for consumers and businesses; Connects social and payment networks facilitating consumer recommendations to friends
swipely.com
Xapo 20 Provides convenient and secure ways to store and use Bitcoins xapo.com
Venture Capital Activity Overview Payments Niche
A summary of selected venture capital financing activity in the payments niche since June 30, 2014. Covers selected financing rounds larger than $10MM.
Source: Capital IQ and Mercer Capital analysis of aricles on TechCrunch and Finovate.com

© 2014 Mercer Capital // www.mercercapital.com 5
Mercer Capital’s Value Focus: FinTech Industry Third Quarter 2014
© 2014 Mercer Capital // www.mercercapital.com // Data Source: Bloomberg 5
CompanyAmount
($M) Company Description Website
Ondot Systems, Inc.
18Develops and operates value-added mobile card service plat-forms that bring user preferences and real-time communication to payment processing
ondotsystems.com
One, Inc. 17Web/cloud based software for property and casualty insurers, including a payment processing solution
oneincsystems.com
Circle Internet Financial Inc.
17Offers a suite of products enabling ease-of-use in online and in person payments
circle.com
WePay 15 Offers online payment collection solutions wepay.com
Traxpay 15 Online payment platform for business-to-business segment traxpay.com
Itz Cash Card 15 Offers prepaid cards in India ltzcash.com
SumUp 13Mobile point-of-sale technology, enabling debit and credit card payments through smart phones or tablets
sumup.com
Zooz 12Develops smart payment technology that enables enterprise retailers to increase their e-commerce revenues and payments flexibility
zooz.com
Transactis 11Software-as-a-Service company that provides digital bill pre-sentment and payments solution to banks and corporations
transactis.com
Motionsoft 10Provides management software and billing solutions to fitness clubs
motionsoft.net
Plastiq 10Provides an online platform enabling consumers to use their credit cards for payments from any internet-enabled device
plastiq.com
A summary of selected venture capital financing activity in the payments niche since June 30, 2014. Covers selected financing rounds larger than $10MM.
Source: Capital IQ and Mercer Capital analysis of aricles on TechCrunch and Finovate.com
Venture Capital Activity Overview (continued)Payments Niche

© 2014 Mercer Capital // www.mercercapital.com 6
Mercer Capital’s Value Focus: FinTech Industry Third Quarter 2014
Venture Capital Case Study
“As a part of First Data’s suite of innovation-powered products,
Gyft will be added to a portfolio of technology-driven gift solu-
tions that link advanced consumer-engagement technology with
point-of-sale business solutions,”
“Gyft, with its mobile gifting platform, and First Data, with its
global scale and distribution network, together will accelerate the
growth of virtual prepaid with powerful new tools for merchants
of all sizes to deepen their relationships with their customers”
“This means that the same robust toolset deployed by big
box retailers will be coming soon to small- to mid-sized
businesses, perfectly synched with our mission to offer
innovative solutions to help our clients grow.”
Quotes from Vinny Lingham, CEO of Gyft, Inc., and
Guy Chiarello, President of First Data, Inc.
Press Releases preceding and following acquisition of Gyft

© 2014 Mercer Capital // www.mercercapital.com 7
Mercer Capital’s Value Focus: FinTech Industry Third Quarter 2014
Venture Capital Case StudyGyft, Inc.
Gyft offers mobile gift card app that allows customers to buy, store, send
and redeem gift cards conveniently from their mobile device.
Mobile application allows users to:
• Upload and check mobile gift card balances
• Earn rewards points for using gift card, purchasing with Bitcoin, or
PayPal
• Purchase and send gift cards and send electronically to friends or
family
Timeline Significant Corporate Events
2012
• Company founded in January and originally focused on developing an Iphone app that allowed users to buy, give, and share gift cards
• Received first round of seed funding of $1.3 M from South African investor in June
• Announced integration with Apple’s Passbook, including over 200 different retail gift cards
• Received second round of seed funding of $1.3M in September following being a finalist at TechCrunch Disrupt SF
2013
• Expanded application to web and Android
• Reported to have around 200,000 plus gift cards with $10M uploaded to platform and offering over 300 retail cards
• Received $5M of Series A funding (September)
• Introduced features like re-gifting, Bitcoin support, and a registry option
2014
• Tried to expand internationally and introduced a card-swapping option
• Announced its new mobile gift card solution for small to mid-sized businesses, named Gyft Cloud
• Gyft partnered with Clover, a First Data subsidiary company that offers an innovative all-in-one POS payment and business solution for small to mid-sized businesses
July 30, 2014
• First Data, a global leader in payment technology and solutions, announces deal to acquire Gyft
• Exact details on the transaction have not been disclosed
Sources: Techcrunch.com; Check company website; Numerous articles including:
• “First Data Acquires Mobile Gift Card Platform Gift” TechCrunch
• “Payments giant First Data acquires Gyft in an effort to bring digital gift cards to the masses” Pando.com
• “Gyft Announces Launch of First Cloud-based Mobile Gift Card Solution for Small to Mid-Sized Businesses” Reuters
• “Digital gift card platform Gyft raises $5M” Vato.com
• “Digital Gift Card Platform Gyft Raises $5 Million Series A” TechCrunch
• “Gyft Brings Gift Cards Over 200 Retailers to Apple’s Passbook” TechCrunch
© 2014 Mercer Capital // www.mercercapital.com 8
Mercer Capital’s Value Focus: FinTech Industry Third Quarter 2014
Venture Capital Case Study Gyft, Inc.
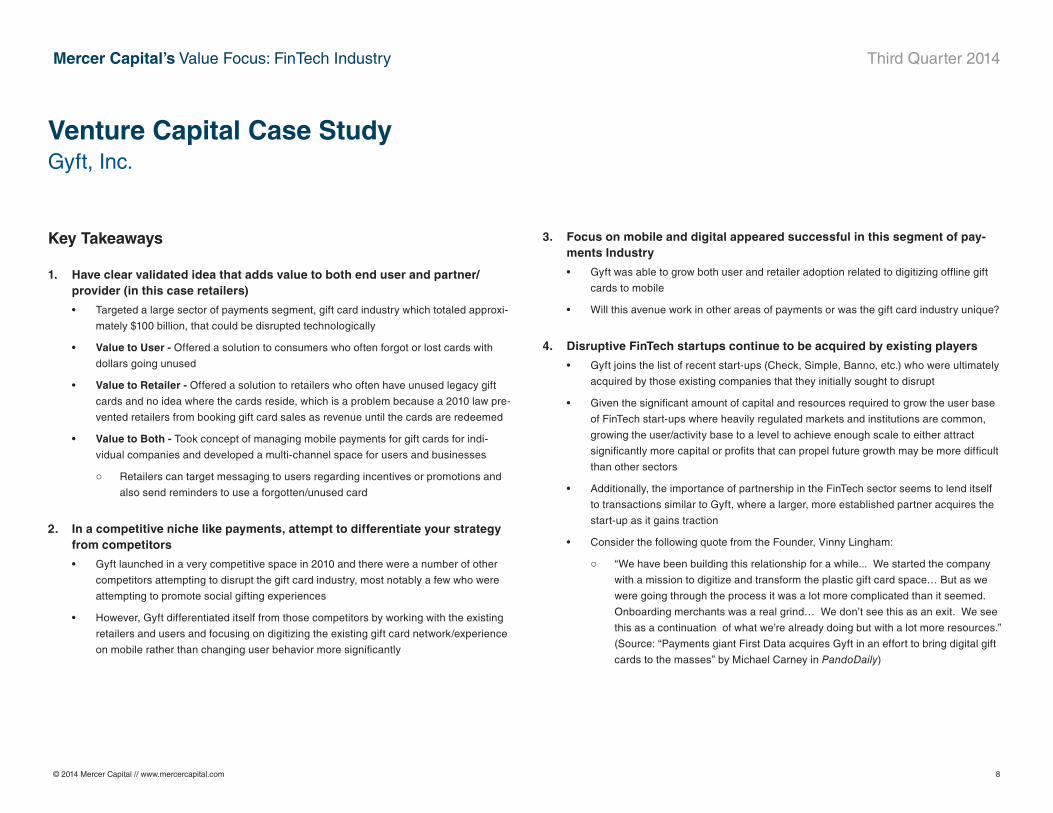
1. Have clear validated idea that adds value to both end user and partner/provider (in this case retailers)
• Targeted a large sector of payments segment, gift card industry which totaled approxi-
mately $100 billion, that could be disrupted technologically
• Value to User - Offered a solution to consumers who often forgot or lost cards with
dollars going unused
• Value to Retailer - Offered a solution to retailers who often have unused legacy gift
cards and no idea where the cards reside, which is a problem because a 2010 law pre-
vented retailers from booking gift card sales as revenue until the cards are redeemed
• Value to Both - Took concept of managing mobile payments for gift cards for indi-
vidual companies and developed a multi-channel space for users and businesses
○ Retailers can target messaging to users regarding incentives or promotions and
also send reminders to use a forgotten/unused card
2. In a competitive niche like payments, attempt to differentiate your strategy from competitors
• Gyft launched in a very competitive space in 2010 and there were a number of other
competitors attempting to disrupt the gift card industry, most notably a few who were
attempting to promote social gifting experiences
• However, Gyft differentiated itself from those competitors by working with the existing
retailers and users and focusing on digitizing the existing gift card network/experience
on mobile rather than changing user behavior more significantly
3. Focus on mobile and digital appeared successful in this segment of pay-ments Industry
• Gyft was able to grow both user and retailer adoption related to digitizing offline gift
cards to mobile
• Will this avenue work in other areas of payments or was the gift card industry unique?
4. Disruptive FinTech startups continue to be acquired by existing players
• Gyft joins the list of recent start-ups (Check, Simple, Banno, etc.) who were ultimately
acquired by those existing companies that they initially sought to disrupt
• Given the significant amount of capital and resources required to grow the user base
of FinTech start-ups where heavily regulated markets and institutions are common,
growing the user/activity base to a level to achieve enough scale to either attract
significantly more capital or profits that can propel future growth may be more difficult
than other sectors
• Additionally, the importance of partnership in the FinTech sector seems to lend itself
to transactions similar to Gyft, where a larger, more established partner acquires the
start-up as it gains traction
• Consider the following quote from the Founder, Vinny Lingham:
○ “We have been building this relationship for a while... We started the company
with a mission to digitize and transform the plastic gift card space… But as we
were going through the process it was a lot more complicated than it seemed.
Onboarding merchants was a real grind… We don’t see this as an exit. We see
this as a continuation of what we’re already doing but with a lot more resources.”
(Source: “Payments giant First Data acquires Gyft in an effort to bring digital gift
cards to the masses” by Michael Carney in PandoDaily)
Key Takeaways

© 2014 Mercer Capital // www.mercercapital.com 9
Mercer Capital’s Value Focus: FinTech Industry Third Quarter 2014
© 2014 Mercer Capital // www.mercercapital.com // Source: Bloomberg 9
Ticker Name9/2/14Price
1 Yr. Tot Ret
(%)
Market Cap
($MM)
Ent’p Val
($MM)
Price / Earnings Ent’p Value / EBITDA Ent’p Value/LTM
Yield
LTM
2014 EBITDALTM FY14E FY15E LTM FY14E FY15E EBIT Rev. Revenue EBITDA Margin Net Inc.
Banking Technology
TRAKDealertrack Technologies, Inc.
44.22 11.69 2,383 2,984 (218.08) (221.10) 201.00 30.06 15.89 12.97 2,114.95 4.70 0.0% 634,268 99,289 15.7% (10,928) 187,800
ELLI Ellie Mae, Inc. 34.78 19.77 985 NA 97.38 108.69 70.26 NM NM NM NM NM 0.0% 135,518 22,706 16.8% 10,116 41,350
EPIQ Epiq Systems, Inc. 14.79 23.78 532 814 (372.34) 77.84 19.99 12.37 7.75 6.84 51.33 1.65 2.4% 493,448 65,821 13.3% (1,430) 105,045
JKHYJack Henry & Associates, Inc.
58.13 18.27 4,795 4,733 23.84 24.74 22.36 11.28 11.29 10.68 15.17 3.91 1.4% 1,210,053 419,770 34.7% 201,136 419,100
PFMT Performant Financial Corp. 9.47 (12.56) 461 497 12.97 33.82 21.04 6.07 9.89 8.29 7.06 1.96 0.0% 252,827 81,833 32.4% 35,581 50,221
Median 18.27 985 1,899 12.97 33.82 22.36 11.82 10.59 9.48 33.25 2.94 0.00 493,448 81,833 0.17 10,116 105,045
Insurance/Healthcare Technology
ATHN athenahealth, Inc. 145.15 37.60 5,511 5,671 1,344.69 (853.82) 1,612.78 62.94 41.71 33.96 618.78 8.44 $0.00 672,063 90,092 13.4% 4,098 135,951
CRVL CorVel Corporation 40.96 24.35 854 807 25.06 NM NM 11.14 NM NM 14.43 1.66 0.0% 485,067 72,442 14.9% 34,082 NA
CRD.B Crawford & Company 9.30 24.84 479 629 11.58 11.63 8.86 5.72 5.46 4.71 8.50 0.52 $0.02 1,216,587 110,028 9.0% 41,347 115,232
EBIX Ebix, Inc. 15.30 36.53 580 589 10.11 10.27 9.94 7.30 7.03 6.86 8.34 2.89 1.0% 204,020 80,723 39.6% 57,384 83,810
GWRE Guidewire Software, Inc. 45.82 (0.30) 3,141 2,993 213.39 (916.40) (610.93) 118.09 47.84 43.04 160.96 NM $0.00 350,246 25,347 7.2% 14,721 62,564
HMSY HMS Holdings Corp. 22.61 (9.52) 1,984 2,085 62.00 88.67 39.67 17.76 18.49 13.46 33.69 4.47 0.0% 466,614 117,395 25.2% 31,992 112,800
MGLNMagellan Health Services, Inc.
54.95 (2.24) 1,571 1,419 16.29 25.56 19.73 6.74 6.05 5.18 11.01 0.38 $0.00 3,736,297 210,397 5.6% 96,429 234,320
SLH Solera Holdings, Inc. 62.01 21.46 4,254 5,677 (472.77) 885.86 67.04 21.46 13.61 11.88 39.90 5.75 1.1% 987,259 264,535 26.8% (8,999) 417,000
SR Standard Register Co. 6.05 (42.11) 56 344 (2.06) NM NM 15.72 NM NM (25.25) 0.38 $0.00 895,134 21,874 2.4% (27,076) NA
Median 21.46 1,571 1,419 16.29 11.63 19.73 15.72 13.61 11.88 14.43 2.28 0.0% 672,063 90,092 7.2% 31,992 173,560
Investment Technology
ADVS Advent Software, Inc. 32.76 21.88 1,689 1,928 38.10 36.60 33.26 19.40 14.24 13.11 25.09 4.92 0.4% 391,520 99,368 25.4% 44,337 135,370
DST DST Systems, Inc. 92.46 31.27 3,674 3,932 8.77 17.65 15.65 4.99 8.68 8.18 6.08 1.47 1.3% 2,682,400 787,900 29.4% 419,100 452,750
ENV Envestnet, Inc. 46.42 68.01 1,632 1,569 187.34 132.63 69.28 49.96 29.40 20.81 118.57 5.10 0.0% 307,646 31,396 10.2% 8,714 53,350
LIQDLiquid Holdings Group, Inc.
1.73 (76.93) 104 68 (3.03) (2.66) (5.09) NM (3.41) (4.44) NM 15.21 0.0% 4,465 NA NM (34,282) (19,945)
MSCI MSCI Inc. 46.58 24.18 5,428 5,543 18.71 26.43 23.77 12.91 13.61 12.72 15.80 5.44 0.0% 1,019,774 429,321 42.1% 290,182 407,300
Median 24.18 1,689 1,928 18.71 26.43 23.77 16.16 13.61 12.72 20.45 5.10 0.0% 391,520 264,345 27.4% 44,337 135,370
Source: SNL Financial
Publicly Traded Technology Companies
© 2014 Mercer Capital // www.mercercapital.com 10
Mercer Capital’s Value Focus: FinTech Industry Third Quarter 2014
Ticker Name9/2/14Price
1 Yr. Tot Ret
(%)
Market Cap
($MM)
Ent’p Val
($MM)
Price / Earnings Ent’p Value / EBITDAEnt’p Value/
LTM
Yield
LTM
2014 EBITDALTM FY14E FY15E LTM FY14E FY15E EBIT Rev. Revenue EBITDA Margin Net Inc.
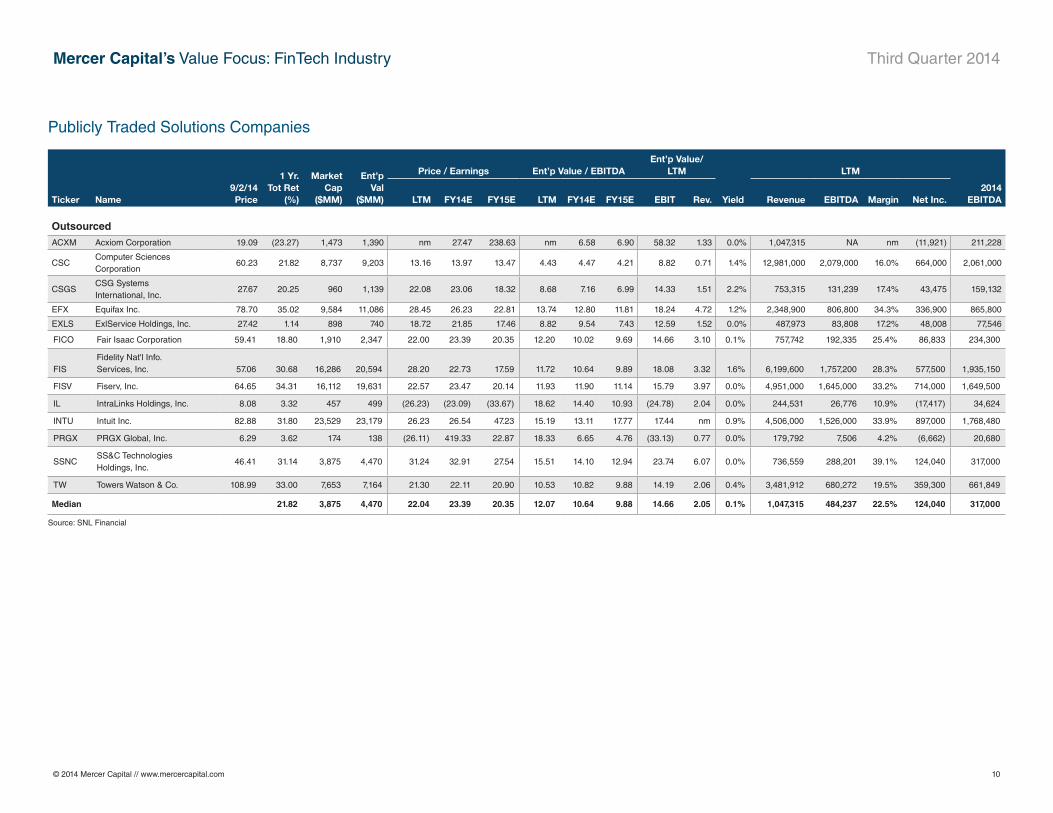
OutsourcedACXM Acxiom Corporation 19.09 (23.27) 1,473 1,390 nm 27.47 238.63 nm 6.58 6.90 58.32 1.33 0.0% 1,047,315 NA nm (11,921) 211,228
CSCComputer Sciences Corporation
60.23 21.82 8,737 9,203 13.16 13.97 13.47 4.43 4.47 4.21 8.82 0.71 1.4% 12,981,000 2,079,000 16.0% 664,000 2,061,000
CSGSCSG Systems International, Inc.
27.67 20.25 960 1,139 22.08 23.06 18.32 8.68 7.16 6.99 14.33 1.51 2.2% 753,315 131,239 17.4% 43,475 159,132
EFX Equifax Inc. 78.70 35.02 9,584 11,086 28.45 26.23 22.81 13.74 12.80 11.81 18.24 4.72 1.2% 2,348,900 806,800 34.3% 336,900 865,800
EXLS ExlService Holdings, Inc. 27.42 1.14 898 740 18.72 21.85 17.46 8.82 9.54 7.43 12.59 1.52 0.0% 487,973 83,808 17.2% 48,008 77,546
FICO Fair Isaac Corporation 59.41 18.80 1,910 2,347 22.00 23.39 20.35 12.20 10.02 9.69 14.66 3.10 0.1% 757,742 192,335 25.4% 86,833 234,300
FISFidelity Nat'l Info. Services, Inc. 57.06 30.68 16,286 20,594 28.20 22.73 17.59 11.72 10.64 9.89 18.08 3.32 1.6% 6,199,600 1,757,200 28.3% 577,500 1,935,150
FISV Fiserv, Inc. 64.65 34.31 16,112 19,631 22.57 23.47 20.14 11.93 11.90 11.14 15.79 3.97 0.0% 4,951,000 1,645,000 33.2% 714,000 1,649,500
IL IntraLinks Holdings, Inc. 8.08 3.32 457 499 (26.23) (23.09) (33.67) 18.62 14.40 10.93 (24.78) 2.04 0.0% 244,531 26,776 10.9% (17,417) 34,624
INTU Intuit Inc. 82.88 31.80 23,529 23,179 26.23 26.54 47.23 15.19 13.11 17.77 17.44 nm 0.9% 4,506,000 1,526,000 33.9% 897,000 1,768,480
PRGX PRGX Global, Inc. 6.29 3.62 174 138 (26.11) 419.33 22.87 18.33 6.65 4.76 (33.13) 0.77 0.0% 179,792 7,506 4.2% (6,662) 20,680
SSNCSS&C Technologies Holdings, Inc.
46.41 31.14 3,875 4,470 31.24 32.91 27.54 15.51 14.10 12.94 23.74 6.07 0.0% 736,559 288,201 39.1% 124,040 317,000
TW Towers Watson & Co. 108.99 33.00 7,653 7,164 21.30 22.11 20.90 10.53 10.82 9.88 14.19 2.06 0.4% 3,481,912 680,272 19.5% 359,300 661,849
Median 21.82 3,875 4,470 22.04 23.39 20.35 12.07 10.64 9.88 14.66 2.05 0.1% 1,047,315 484,237 22.5% 124,040 317,000
Source: SNL Financial
Publicly Traded Solutions Companies
© 2014 Mercer Capital // www.mercercapital.com 11
Mercer Capital’s Value Focus: FinTech Industry Third Quarter 2014
Ticker Name9/2/14Price
1 Yr. Tot Ret
(%)
Market Cap
($MM)
Ent’p Val
($MM)
Price / Earnings Ent’p Value / EBITDAEnt’p Value/
LTM
Yield
LTM
2014 EBITDALTM FY14E FY15E LTM FY14E FY15E EBIT Rev. Revenue EBITDA Margin Net Inc.
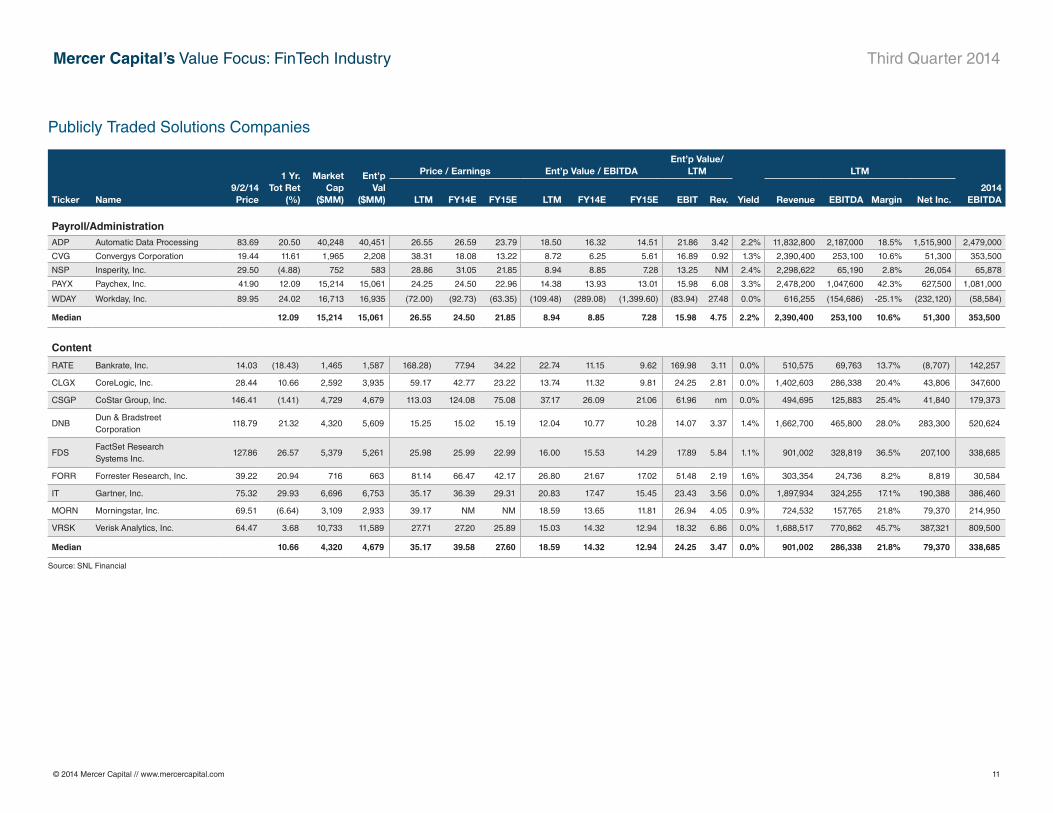
Payroll/AdministrationADP Automatic Data Processing 83.69 20.50 40,248 40,451 26.55 26.59 23.79 18.50 16.32 14.51 21.86 3.42 2.2% 11,832,800 2,187,000 18.5% 1,515,900 2,479,000
CVG Convergys Corporation 19.44 11.61 1,965 2,208 38.31 18.08 13.22 8.72 6.25 5.61 16.89 0.92 1.3% 2,390,400 253,100 10.6% 51,300 353,500
NSP Insperity, Inc. 29.50 (4.88) 752 583 28.86 31.05 21.85 8.94 8.85 7.28 13.25 NM 2.4% 2,298,622 65,190 2.8% 26,054 65,878
PAYX Paychex, Inc. 41.90 12.09 15,214 15,061 24.25 24.50 22.96 14.38 13.93 13.01 15.98 6.08 3.3% 2,478,200 1,047,600 42.3% 627,500 1,081,000
WDAY Workday, Inc. 89.95 24.02 16,713 16,935 (72.00) (92.73) (63.35) (109.48) (289.08) (1,399.60) (83.94) 27.48 0.0% 616,255 (154,686) -25.1% (232,120) (58,584)
Median 12.09 15,214 15,061 26.55 24.50 21.85 8.94 8.85 7.28 15.98 4.75 2.2% 2,390,400 253,100 10.6% 51,300 353,500
Content
RATE Bankrate, Inc. 14.03 (18.43) 1,465 1,587 168.28) 77.94 34.22 22.74 11.15 9.62 169.98 3.11 0.0% 510,575 69,763 13.7% (8,707) 142,257
CLGX CoreLogic, Inc. 28.44 10.66 2,592 3,935 59.17 42.77 23.22 13.74 11.32 9.81 24.25 2.81 0.0% 1,402,603 286,338 20.4% 43,806 347,600
CSGP CoStar Group, Inc. 146.41 (1.41) 4,729 4,679 113.03 124.08 75.08 37.17 26.09 21.06 61.96 nm 0.0% 494,695 125,883 25.4% 41,840 179,373
DNBDun & Bradstreet Corporation
118.79 21.32 4,320 5,609 15.25 15.02 15.19 12.04 10.77 10.28 14.07 3.37 1.4% 1,662,700 465,800 28.0% 283,300 520,624
FDSFactSet Research Systems Inc.
127.86 26.57 5,379 5,261 25.98 25.99 22.99 16.00 15.53 14.29 17.89 5.84 1.1% 901,002 328,819 36.5% 207,100 338,685
FORR Forrester Research, Inc. 39.22 20.94 716 663 81.14 66.47 42.17 26.80 21.67 17.02 51.48 2.19 1.6% 303,354 24,736 8.2% 8,819 30,584
IT Gartner, Inc. 75.32 29.93 6,696 6,753 35.17 36.39 29.31 20.83 17.47 15.45 23.43 3.56 0.0% 1,897,934 324,255 17.1% 190,388 386,460
MORN Morningstar, Inc. 69.51 (6.64) 3,109 2,933 39.17 NM NM 18.59 13.65 11.81 26.94 4.05 0.9% 724,532 157,765 21.8% 79,370 214,950
VRSK Verisk Analytics, Inc. 64.47 3.68 10,733 11,589 27.71 27.20 25.89 15.03 14.32 12.94 18.32 6.86 0.0% 1,688,517 770,862 45.7% 387,321 809,500
Median 10.66 4,320 4,679 35.17 39.58 27.60 18.59 14.32 12.94 24.25 3.47 0.0% 901,002 286,338 21.8% 79,370 338,685
Source: SNL Financial
Publicly Traded Solutions Companies
© 2014 Mercer Capital // www.mercercapital.com 12
Mercer Capital’s Value Focus: FinTech Industry Third Quarter 2014
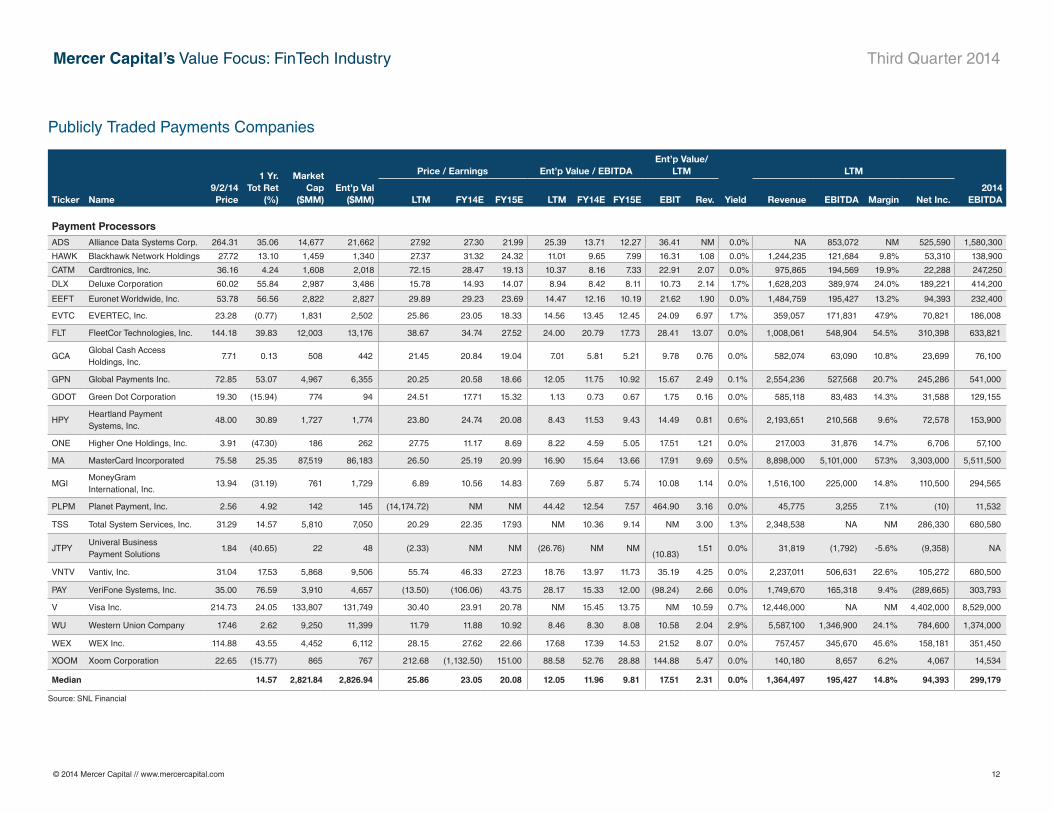
Publicly Traded Payments Companies
Ticker Name9/2/14Price
1 Yr. Tot Ret
(%)
Market Cap
($MM) Ent’p Val
($MM)
Price / Earnings Ent’p Value / EBITDAEnt’p Value/
LTM
Yield
LTM
2014 EBITDALTM FY14E FY15E LTM FY14E FY15E EBIT Rev. Revenue EBITDA Margin Net Inc.
Payment ProcessorsADS Alliance Data Systems Corp. 264.31 35.06 14,677 21,662 27.92 27.30 21.99 25.39 13.71 12.27 36.41 NM 0.0% NA 853,072 NM 525,590 1,580,300
HAWK Blackhawk Network Holdings 27.72 13.10 1,459 1,340 27.37 31.32 24.32 11.01 9.65 7.99 16.31 1.08 0.0% 1,244,235 121,684 9.8% 53,310 138,900
CATM Cardtronics, Inc. 36.16 4.24 1,608 2,018 72.15 28.47 19.13 10.37 8.16 7.33 22.91 2.07 0.0% 975,865 194,569 19.9% 22,288 247,250
DLX Deluxe Corporation 60.02 55.84 2,987 3,486 15.78 14.93 14.07 8.94 8.42 8.11 10.73 2.14 1.7% 1,628,203 389,974 24.0% 189,221 414,200
EEFT Euronet Worldwide, Inc. 53.78 56.56 2,822 2,827 29.89 29.23 23.69 14.47 12.16 10.19 21.62 1.90 0.0% 1,484,759 195,427 13.2% 94,393 232,400
EVTC EVERTEC, Inc. 23.28 (0.77) 1,831 2,502 25.86 23.05 18.33 14.56 13.45 12.45 24.09 6.97 1.7% 359,057 171,831 47.9% 70,821 186,008
FLT FleetCor Technologies, Inc. 144.18 39.83 12,003 13,176 38.67 34.74 27.52 24.00 20.79 17.73 28.41 13.07 0.0% 1,008,061 548,904 54.5% 310,398 633,821
GCAGlobal Cash Access Holdings, Inc.
7.71 0.13 508 442 21.45 20.84 19.04 7.01 5.81 5.21 9.78 0.76 0.0% 582,074 63,090 10.8% 23,699 76,100
GPN Global Payments Inc. 72.85 53.07 4,967 6,355 20.25 20.58 18.66 12.05 11.75 10.92 15.67 2.49 0.1% 2,554,236 527,568 20.7% 245,286 541,000
GDOT Green Dot Corporation 19.30 (15.94) 774 94 24.51 17.71 15.32 1.13 0.73 0.67 1.75 0.16 0.0% 585,118 83,483 14.3% 31,588 129,155
HPYHeartland Payment Systems, Inc.
48.00 30.89 1,727 1,774 23.80 24.74 20.08 8.43 11.53 9.43 14.49 0.81 0.6% 2,193,651 210,568 9.6% 72,578 153,900
ONE Higher One Holdings, Inc. 3.91 (47.30) 186 262 27.75 11.17 8.69 8.22 4.59 5.05 17.51 1.21 0.0% 217,003 31,876 14.7% 6,706 57,100
MA MasterCard Incorporated 75.58 25.35 87,519 86,183 26.50 25.19 20.99 16.90 15.64 13.66 17.91 9.69 0.5% 8,898,000 5,101,000 57.3% 3,303,000 5,511,500
MGIMoneyGram International, Inc.
13.94 (31.19) 761 1,729 6.89 10.56 14.83 7.69 5.87 5.74 10.08 1.14 0.0% 1,516,100 225,000 14.8% 110,500 294,565
PLPM Planet Payment, Inc. 2.56 4.92 142 145 (14,174.72) NM NM 44.42 12.54 7.57 464.90 3.16 0.0% 45,775 3,255 7.1% (10) 11,532
TSS Total System Services, Inc. 31.29 14.57 5,810 7,050 20.29 22.35 17.93 NM 10.36 9.14 NM 3.00 1.3% 2,348,538 NA NM 286,330 680,580
JTPYUniveral Business Payment Solutions
1.84 (40.65) 22 48 (2.33) NM NM (26.76) NM NM
(10.83) 1.51 0.0% 31,819 (1,792) -5.6% (9,358) NA
VNTV Vantiv, Inc. 31.04 17.53 5,868 9,506 55.74 46.33 27.23 18.76 13.97 11.73 35.19 4.25 0.0% 2,237,011 506,631 22.6% 105,272 680,500
PAY VeriFone Systems, Inc. 35.00 76.59 3,910 4,657 (13.50) (106.06) 43.75 28.17 15.33 12.00 (98.24) 2.66 0.0% 1,749,670 165,318 9.4% (289,665) 303,793
V Visa Inc. 214.73 24.05 133,807 131,749 30.40 23.91 20.78 NM 15.45 13.75 NM 10.59 0.7% 12,446,000 NA NM 4,402,000 8,529,000
WU Western Union Company 17.46 2.62 9,250 11,399 11.79 11.88 10.92 8.46 8.30 8.08 10.58 2.04 2.9% 5,587,100 1,346,900 24.1% 784,600 1,374,000
WEX WEX Inc. 114.88 43.55 4,452 6,112 28.15 27.62 22.66 17.68 17.39 14.53 21.52 8.07 0.0% 757,457 345,670 45.6% 158,181 351,450
XOOM Xoom Corporation 22.65 (15.77) 865 767 212.68 (1,132.50) 151.00 88.58 52.76 28.88 144.88 5.47 0.0% 140,180 8,657 6.2% 4,067 14,534
Median 14.57 2,821.84 2,826.94 25.86 23.05 20.08 12.05 11.96 9.81 17.51 2.31 0.0% 1,364,497 195,427 14.8% 94,393 299,179
Source: SNL Financial
© 2014 Mercer Capital // www.mercercapital.com 13
Mercer Capital’s Value Focus: FinTech Industry Third Quarter 2014
Ticker Name9/2/14Price
1 Yr. Tot Ret
(%)
Market Cap
($MM)
Ent’p Val
($MM)
Price / Earnings Ent’p Value / EBITDAEnt’p Value/
LTM
Yield
LTM
2014 EBITDALTM FY14E FY15E LTM FY14E FY15E EBIT Rev. Revenue EBITDA Margin Net Inc.
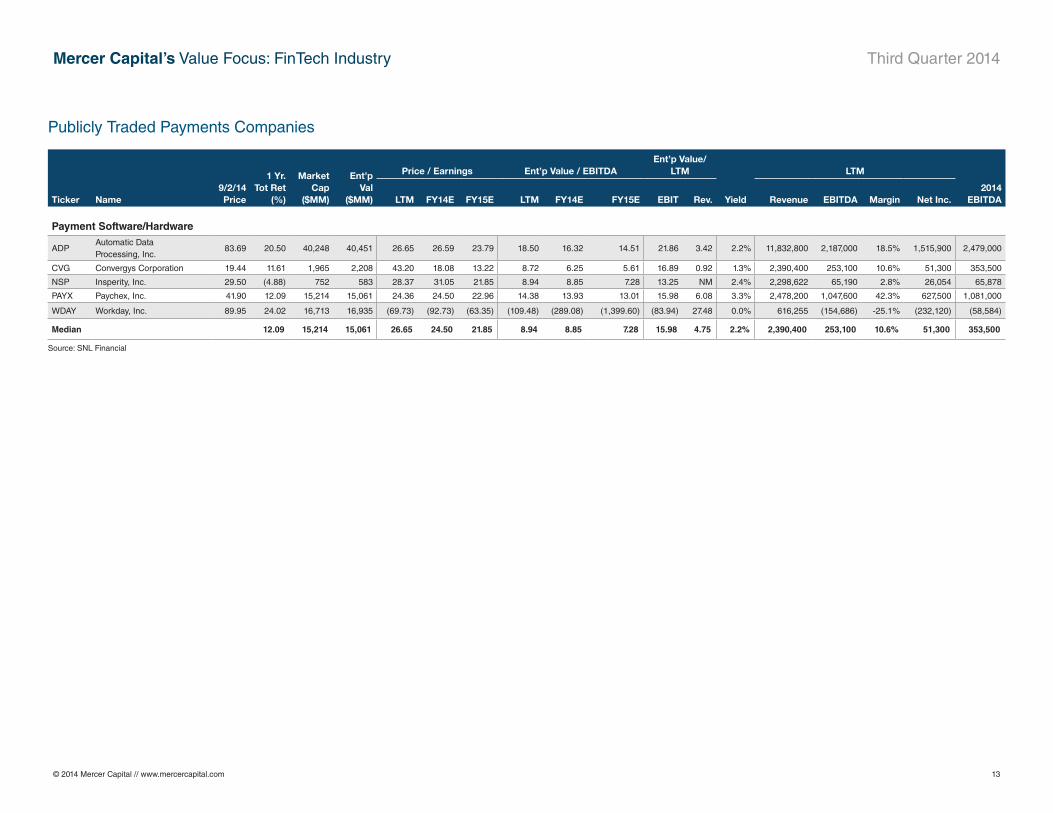
Payment Software/Hardware
ADPAutomatic Data Processing, Inc.
83.69 20.50 40,248 40,451 26.65 26.59 23.79 18.50 16.32 14.51 21.86 3.42 2.2% 11,832,800 2,187,000 18.5% 1,515,900 2,479,000
CVG Convergys Corporation 19.44 11.61 1,965 2,208 43.20 18.08 13.22 8.72 6.25 5.61 16.89 0.92 1.3% 2,390,400 253,100 10.6% 51,300 353,500
NSP Insperity, Inc. 29.50 (4.88) 752 583 28.37 31.05 21.85 8.94 8.85 7.28 13.25 NM 2.4% 2,298,622 65,190 2.8% 26,054 65,878
PAYX Paychex, Inc. 41.90 12.09 15,214 15,061 24.36 24.50 22.96 14.38 13.93 13.01 15.98 6.08 3.3% 2,478,200 1,047,600 42.3% 627,500 1,081,000
WDAY Workday, Inc. 89.95 24.02 16,713 16,935 (69.73) (92.73) (63.35) (109.48) (289.08) (1,399.60) (83.94) 27.48 0.0% 616,255 (154,686) -25.1% (232,120) (58,584)
Median 12.09 15,214 15,061 26.65 24.50 21.85 8.94 8.85 7.28 15.98 4.75 2.2% 2,390,400 253,100 10.6% 51,300 353,500
Source: SNL Financial
Publicly Traded Payments Companies

Mercer CapitalFinancial Technology Industry Services
Contact Us
Copyright © 2014 Mercer Capital Management, Inc. All rights reserved. It is illegal under Federal law to reproduce this publication or any portion of its contents without the publisher’s permission. Media quotations with source attribution are encouraged. Reporters
requesting additional information or editorial comment should contact Barbara Walters Price at 901.685.2120. Mercer Capital’s Industry Focus is published quarterly and does not constitute legal or financial consulting advice. It is offered as an information service to
our clients and friends. Those interested in specific guidance for legal or accounting matters should seek competent professional advice. Inquiries to discuss specific valuation matters are welcomed. To add your name to our mailing list to receive this complimentary
publication, visit our web site at www.mercercapital.com.
Mercer Capital provides the financial technology industry with corporate valuation, financial reporting, transaction advisory, and related services.
Contact a Mercer Capital professional to discuss your needs in confidence.
Jay D. Wilson, CFA, ASA, [email protected]
Matthew R. Crow, CFA, [email protected]
Jeff K. Davis, [email protected]
Mercer Capital5100 Poplar Avenue, Suite 2600Memphis, Tennessee 38137901.685.2120 (P)
www.mercercapital.com
BUSINESS VALUATION & FINANCIAL ADVISORY SERVICES
Industry Segments
• Payments – Includes companies who facilitate and/or support the transfer of money, particularly non-cash transactions
○ Processors – Provide solutions related to the transfer and processing of money
○ Software/Hardware – Provide software/hardware that primarily supports the transfer and processing of money
• Technology – Typically provide software and services to one of three different financial services subsectors, including:
○ Banking
○ Investments
○ Healthcare
• Solutions – Providers of technological solutions to assist consumers, businesses, and financial institutions with financial services
○ Outsourced – Third party providers
○ Payroll/Administrative – Typically improve human resources function through technology
○ Content – Typically provide content/research that supports financial services and decision-making
Services Provided
• Valuation of financial technology companies
• Transaction advisory for acquisitions and divestitures
• Valuations for purchase accounting and impairment testing
• Fairness and solvency opinions
• Litigation support for economic damages and valuation and shareholder disputes