mercer capital's value focus: fintech industry | second half 2016
TRANSCRIPT

www.mercercapital.com
VALUE FOCUS
FinTech Industry
Second Half 2016
2016 can be characterized as a cool down period for
FinTech. Valuation multiples of publicly traded Fin-
Tech companies remain elevated relative to broader
markets and financials. However, they did not ben-
efit as much as the financial sector from the post-
election stock market rally as certain potential policy
and regulatory changes could be headwinds for the Fin-
Tech sector.
Exit activity (both IPO and M&A) and venture funding
also slowed in 2016 after recent years of churning
higher. Consistent with the broader slowdown in
technology IPOs in 2016, FinTech IPOs slowed consid-
erably in 2016. FinTech M&A activity also struggled to
keep up with the highs of 2014 and 2015.
While interest in the sector remains high, the outlook
remains uncertain as competitive pressures, continuing
technological change, and regulatory/policy uncertainty
remain. Only time will tell if the FinTech cool down of
2016 persists or was a brief respite in the longer term
growth trajectory for FinTech.
Contact Us
BUSINESS VALUATION & FINANCIAL ADVISORY SERVICESFinTech Industry Services
Mercer Capital provides financial technology companies with valuation, financial
advisory, and consulting services.
Services Provided
• Valuation of financial technology companies
• Financial advisory/valuations for acquisitions and divestitures
• Valuations for purchase accounting and impairment testing
• Fairness and solvency opinions
• Litigation support for economic damages and valuation and shareholder disputes
• Consulting and board presentations for corporate and strategic planning
Jay D. Wilson, CFA, ASA, CBA
901.322.9725
Jeff K. Davis, CFA
615.345.0350
Daniel P. McLeod
901.322.9716
Learn More about Mercer Capital &
our FinTech Services at
http://mer.cr/1fiOndr
Copyright © 2017 Mercer Capital Management, Inc. All rights reserved. It is illegal under Federal law to reproduce this publication or any portion of its contents without the
publisher’s permission. Media quotations with source attribution are encouraged. Reporters requesting additional information or editorial comment should contact Barbara
Walters Price at 901.685.2120. Mercer Capital’s Industry Focus is published quarterly and does not constitute legal or financial consulting advice. It is offered as an informa-
tion service to our clients and friends. Those interested in specific guidance for legal or accounting matters should seek competent professional advice. Inquiries to discuss
specific valuation matters are welcomed. To add your name to our mailing list to receive this complimentary publication, visit our web site at www.mercercapital.com.
In This Issue
Follow Mercer Capital@MercerFinTech @MercerCapital Mercer Capital
Community Banks &
FinTech Partnerships: Robo-Advisors 2
Upcoming Book: Creating Strategic
Value through Financial Technology 3
FinTech Industry Overview
Public Market Indicators 6
Valuation Multiples 7
FinTech IPO Watch 8
FinTech M&A
2H16 vs. 2H15 10
2016 Largest FinTech M&A Overview 11
FinTech Venture Capital
Activity Overview 13
Venture Capital
Case Study: Lemonade 17
Publicly Traded
FinTech Companies 20
Payments 20
Solutions 22
Technology 24
View past issues and subscribe for future updates to the quarterly FinTech newsletter at mer.cr/1holYIf© 2017 Mercer Capital // Business Valuation & Financial Advisory Services // www.mercercapital.com
2
Mercer Capital’s Value Focus: FinTech IndustrySecond Half 2016
@MercerFinTech
Community Banks and FinTech Partnerships: Robo-Advisors by Jay D. Wilson, Jr., CFA, ASA, CBA
In late January 2017, Mercer Capital spoke at Bank Director’s Acquire or Be Acquired
(AOBA) conference. Having sponsored and participated in the event since 2009, this
annual gathering of community bankers is often focused heavily on traditional growth
strategies for banks like traditional bank acquisitions. During the 2015 AOBA conference,
I tweeted,
“With ZIRP, NIM compression, and efficiency ratios buzzing at #AOBA15, I
expect FinTech to be buzzing at future bank M&A events…”
While it took a couple of years, I think the 2017 AOBA conference had a distinct
buzz to it related to FinTech companies. There were a number of FinTech companies
presenting their latest innovations to bankers. In addition, several sessions highlighted
the importance of FinTech to banks and discussed strategies for acquiring and/or
partnering with FinTech companies. Bankers seemed especially eager to explore
FinTech opportunities but struggled with developing a framework for approaching
FinTech companies.
For FinTech companies, partnerships and acquisitions with traditional financial services
companies can be beneficial. 2016 saw a slowdown in the private FinTech markets in
the U.S. with slowdowns in both funding and exit acitivity (M&A and IPOs). Additionally,
a number of FinTechs are increasingly realizing the challenges and costs in achieving
sufficient scale and acquiring customers in a highly regulated and increasingly competitive
financial services industry.
Consequently, both FinTech companies and banks (large and small) may find themselves
increasingly exploring partnership and acquisition opportunities. One area within
FinTech where we already see partnerships form and where we expect to see continued
opportunities for both future acquisitions and partnerships is in the area of robo-advisory.
While there has been a race to partner and/or acquire robo-advisors by many of the larger
asset managers and banks, there have also been interesting partnerships with community
banks. One such partnership struck is between Cambridge Savings Bank, a $3.5 billion
bank located near Boston, and SigFig, a robo-advisor founded in 2007. While SigFig has
relationships with UBS and Wells Fargo, its partnership with Cambridge Savings is notable
because the two built a service called “ConnectInvest.” When announced in the spring of
2016, the partnership was described as the “first automated investment service integrated
and bundled directly into a retail bank’s product offerings in the U.S.” ConnectInvest, which
is available to Cambridge’s customers digitally (mobile and website), “allows customers to
easily open, fund, and manage an automated investment account tailored to their goals.”
Cambridge’s customers are interested in the offering and have started using it. The goal is
get up to 10% of its customer base using ConnectInvest.
The remainder of this article offers an overview of the robo-advisory space and presents
an excerpt from our upcoming book, Creating Strategic Value Through Financial
Technology, that discusses these topics in greater detail. In a future newsletter, we will
discuss how to evaluate the valuation benefits from partnering for FinTech companies.
View past issues and subscribe for future updates to the quarterly FinTech newsletter at mer.cr/1holYIf© 2017 Mercer Capital // Business Valuation & Financial Advisory Services // www.mercercapital.com
3
Mercer Capital’s Value Focus: FinTech IndustrySecond Half 2016
@MercerFinTech
An Overview of Robo-Advisors
Robo-advisors were noted by the CFA Institute as the FinTech innovation most likely to
have the greatest impact on the financial services industry in the short-term (one year) and
medium-term (five years). Robo-advisory has gained traction in the past several years as
a niche within the FinTech industry by offering online wealth management tools powered by
sophisticated algorithms that can help investors manage their portfolios at very low costs
and with minimal need for human contact or advice. Technological advances that make the
business model possible, coupled with a loss of consumer trust in the wealth management
industry in the wake of the financial crisis, have created a favorable environment for robo-
advisory startups to disrupt financial advisories, RIAs, and wealth managers. This growth
is forcing traditional incumbents to confront the new entrants by adding the service via
acquisition or partnership rather than dismiss it as a passing fad.
Robo-advisors have been successful for a number of reasons, though like many digital
products low-cost, convenience, and transparency are common attributes.
» Low Cost. Automated, algorithm-driven decision-making greatly lowers the
cost of financial advice and portfolio management.
» Accessible. As a result of the lowered cost of financial advice, advanced
investment strategies are more accessible to a wider customer base.
» Personalized Strategies. Sophisticated algorithms and computer systems
create personalized investment strategies that are highly tailored to the specific
needs of individual investors.
» Transparent. Through online platforms and mobile apps, clients are able to
view information about their portfolios and enjoy visibility in regard to the way
their money is being managed.
» Convenient. Portfolio information and management becomes available on-
demand through online platforms and mobile apps.
NEW BOOK COMING IN SPRING 2017
Creating Strategic Value Through Financial Technology
Learn More
While many bankers view FinTech as a potential
threat, FinTech offers the potential to improve the
health of community banks for those banks that
can selectively leverage FinTech to enhance per-
formance, customer satisfaction, and improve prof-
itability and returns. FinTech can also help level the
playing field for community banks to compete more
effectively with larger banks and non-bank lenders.
Creating Strategic Value Through Financial Tech-
nology illustrates the potential benefits of FinTech
to banks, both large and small, so that they can gain
a better understanding of FinTech and how it can
create value for their shareholders and enhance the
health and profitability of their institutions.
The book contains 13 chapters broken into three
sections. Section I introduces FinTech. Section II
explores FinTech niches such as bank technology,
alternative lending, payments, wealth management,
and insurance niches. Section III illustrates how
both community banks and FinTech companies can
create strategic value.
View past issues and subscribe for future updates to the quarterly FinTech newsletter at mer.cr/1holYIf© 2017 Mercer Capital // Business Valuation & Financial Advisory Services // www.mercercapital.com
4
Mercer Capital’s Value Focus: FinTech IndustrySecond Half 2016
@MercerFinTech
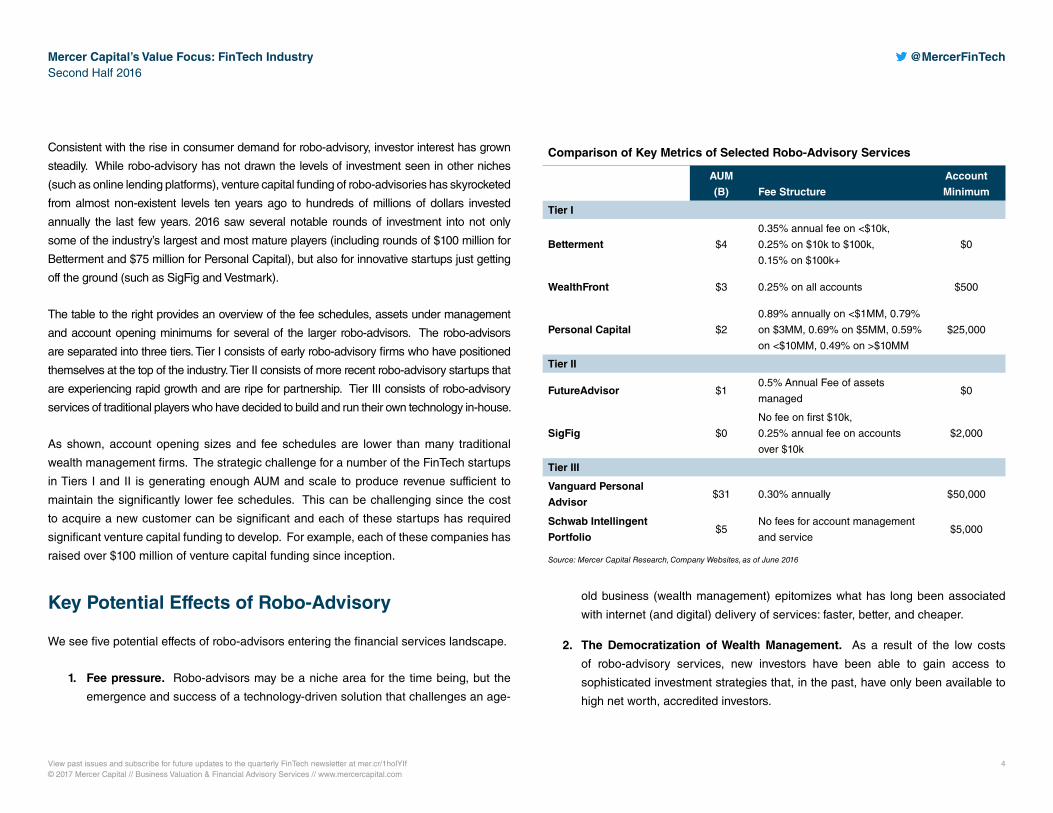
Consistent with the rise in consumer demand for robo-advisory, investor interest has grown
steadily. While robo-advisory has not drawn the levels of investment seen in other niches
(such as online lending platforms), venture capital funding of robo-advisories has skyrocketed
from almost non-existent levels ten years ago to hundreds of millions of dollars invested
annually the last few years. 2016 saw several notable rounds of investment into not only
some of the industry’s largest and most mature players (including rounds of $100 million for
Betterment and $75 million for Personal Capital), but also for innovative startups just getting
off the ground (such as SigFig and Vestmark).
The table to the right provides an overview of the fee schedules, assets under management
and account opening minimums for several of the larger robo-advisors. The robo-advisors
are separated into three tiers. Tier I consists of early robo-advisory firms who have positioned
themselves at the top of the industry. Tier II consists of more recent robo-advisory startups that
are experiencing rapid growth and are ripe for partnership. Tier III consists of robo-advisory
services of traditional players who have decided to build and run their own technology in-house.
As shown, account opening sizes and fee schedules are lower than many traditional
wealth management firms. The strategic challenge for a number of the FinTech startups
in Tiers I and II is generating enough AUM and scale to produce revenue sufficient to
maintain the significantly lower fee schedules. This can be challenging since the cost
to acquire a new customer can be significant and each of these startups has required
significant venture capital funding to develop. For example, each of these companies has
raised over $100 million of venture capital funding since inception.
Key Potential Effects of Robo-Advisory
We see five potential effects of robo-advisors entering the financial services landscape.
1. Fee pressure. Robo-advisors may be a niche area for the time being, but the
emergence and success of a technology-driven solution that challenges an age-
AUM
(B) Fee Structure
Account
Minimum
Tier I
Betterment $4
0.35% annual fee on <$10k,
0.25% on $10k to $100k,
0.15% on $100k+
$0
WealthFront $3 0.25% on all accounts $500
Personal Capital $2
0.89% annually on <$1MM, 0.79%
on $3MM, 0.69% on $5MM, 0.59%
on <$10MM, 0.49% on >$10MM
$25,000
Tier II
FutureAdvisor $1 0.5% Annual Fee of assets
managed$0
SigFig $0
No fee on first $10k,
0.25% annual fee on accounts
over $10k
$2,000
Tier III
Vanguard Personal
Advisor$31 0.30% annually $50,000
Schwab Intellingent
Portfolio$5
No fees for account management
and service$5,000
Source: Mercer Capital Research, Company Websites, as of June 2016
Comparison of Key Metrics of Selected Robo-Advisory Services
old business (wealth management) epitomizes what has long been associated
with internet (and digital) delivery of services: faster, better, and cheaper.
2. The Democratization of Wealth Management. As a result of the low costs
of robo-advisory services, new investors have been able to gain access to
sophisticated investment strategies that, in the past, have only been available to
high net worth, accredited investors.
View past issues and subscribe for future updates to the quarterly FinTech newsletter at mer.cr/1holYIf© 2017 Mercer Capital // Business Valuation & Financial Advisory Services // www.mercercapital.com
5
Mercer Capital’s Value Focus: FinTech IndustrySecond Half 2016
@MercerFinTech
3. Holistic Financial Life Management. As more people have access to financial
advice through robo-advisors, traditional financial advisors are being forced to
move away from return-driven goals for clients and pivot towards offering a more
complete picture of a client’s financial well-being as clients save for milestones
such as retirement, a child’s education, and a new house. This phenomenon has
increased the differentiation pressure on traditional financial advisors and RIAs,
as robo-advisors can offer a holistic snapshot in a manner that is comprehensive
and easy to understand
4. Drivers of the Changing Role of the Traditional Financial Advisor. The potential
shift away from return-driven goals could leave the role of the traditional financial
advisor in limbo. This raises the question of what traditional wealth managers will
look like going forward. One potential answer is traditional financial advisors will
tackle more complex issues, such as tax and estate planning, and leave the more
programmed decision-making to robo-advisors.
5. Build, Buy, Partner, or Wait and See. As the role of the financial advisor changes,
traditional incumbents like community banks are faced with determining what they
want their relationship with robo-advisory to look like. In short, incumbents are left
with four options: build their own robo-advisory in-house, buy a startup and adopt
its technology, create a strategic partnership with a startup, or stay in a holding
pattern in regard to robo-advisory and continue business as usual.
Robo-advisory is an exciting development for wealth managers and offers opportunities
potentially for bankers to expand or develop their offerings in this area. Similar to any
other growth strategy, the goal will ultimately be for the bank to enhance profitability and
shareholder value by adding desired customer services.
Additionally, we have a new book coming in the spring of 2017 – Creating Strategic
Value Through Financial Technology (see page 3). In this book, we illustrate the
potential benefits of FinTech to banks, both large and small, so that they can gain a better
understanding of FinTech and how it can create value for their shareholders and enhance
the health and profitability of their institutions.
Mercer Capital provides corporate valuation, financial reporting, transaction advisory,
and related services to both the FinTech and banking industries. As always, please do
not hesitate to contact us if we can help in any way.
Jay D. Wilson, Jr., CFA, ASA, CBA 901.322.9725
© 2017 Mercer Capital // www.mercercapital.com 6
Mercer Capital’s Value Focus: FinTech IndustrySecond Half 2016
@MercerFinTech
80
90
100
110
120
130
140
Sept
embe
r 30
, 201
6 =
100
S&P 500 FinTech - SolutionsFinTech - Payments FinTech - Technology
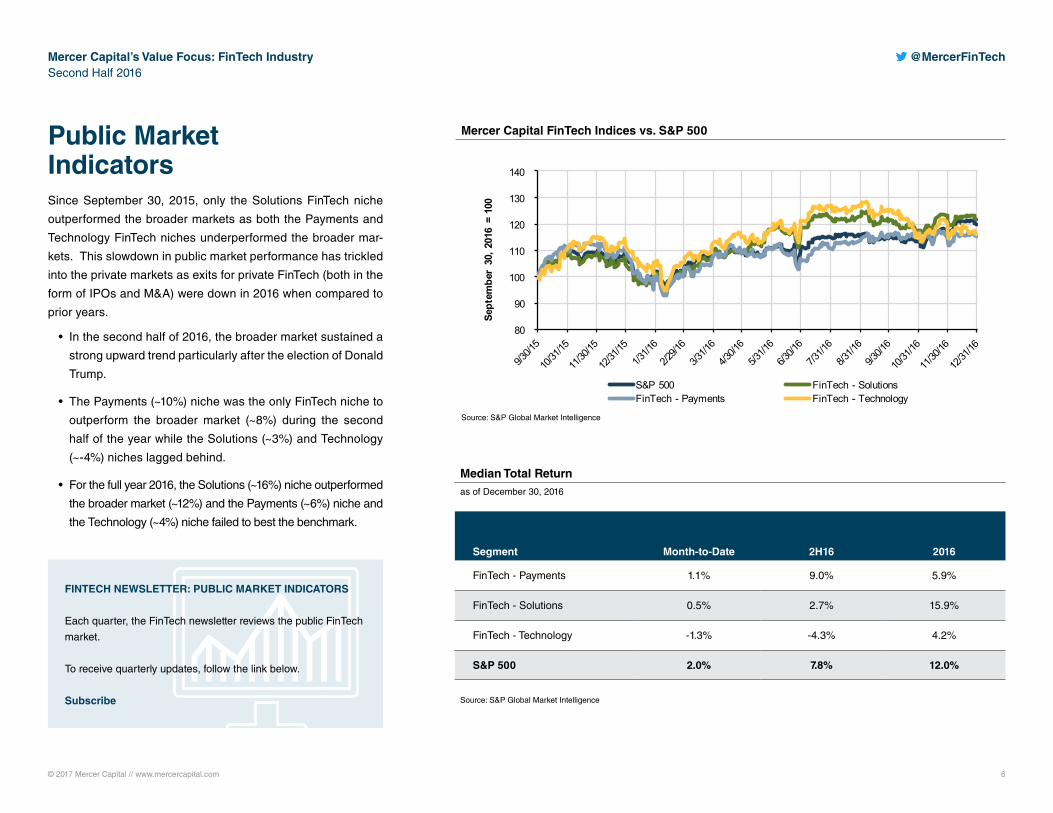
Public Market IndicatorsSince September 30, 2015, only the Solutions FinTech niche
outperformed the broader markets as both the Payments and
Technology FinTech niches underperformed the broader mar-
kets. This slowdown in public market performance has trickled
into the private markets as exits for private FinTech (both in the
form of IPOs and M&A) were down in 2016 when compared to
prior years.
• In the second half of 2016, the broader market sustained a
strong upward trend particularly after the election of Donald
Trump.
• The Payments (~10%) niche was the only FinTech niche to
outperform the broader market (~8%) during the second
half of the year while the Solutions (~3%) and Technology
(~-4%) niches lagged behind.
• For the full year 2016, the Solutions (~16%) niche outperformed
the broader market (~12%) and the Payments (~6%) niche and
the Technology (~4%) niche failed to best the benchmark.
Mercer Capital FinTech Indices vs. S&P 500
Source: S&P Global Market Intelligence
FINTECH NEWSLETTER: PUBLIC MARKET INDICATORS
Each quarter, the FinTech newsletter reviews the public FinTech
market.
To receive quarterly updates, follow the link below.
Subscribe
Median Total Returnas of December 30, 2016
Segment Month-to-Date 2H16 2016
FinTech - Payments 1.1% 9.0% 5.9%
FinTech - Solutions 0.5% 2.7% 15.9%
FinTech - Technology -1.3% -4.3% 4.2%
S&P 500 2.0% 7.8% 12.0%
Source: S&P Global Market Intelligence
© 2017 Mercer Capital // www.mercercapital.com 7
Mercer Capital’s Value Focus: FinTech IndustrySecond Half 2016
@MercerFinTech
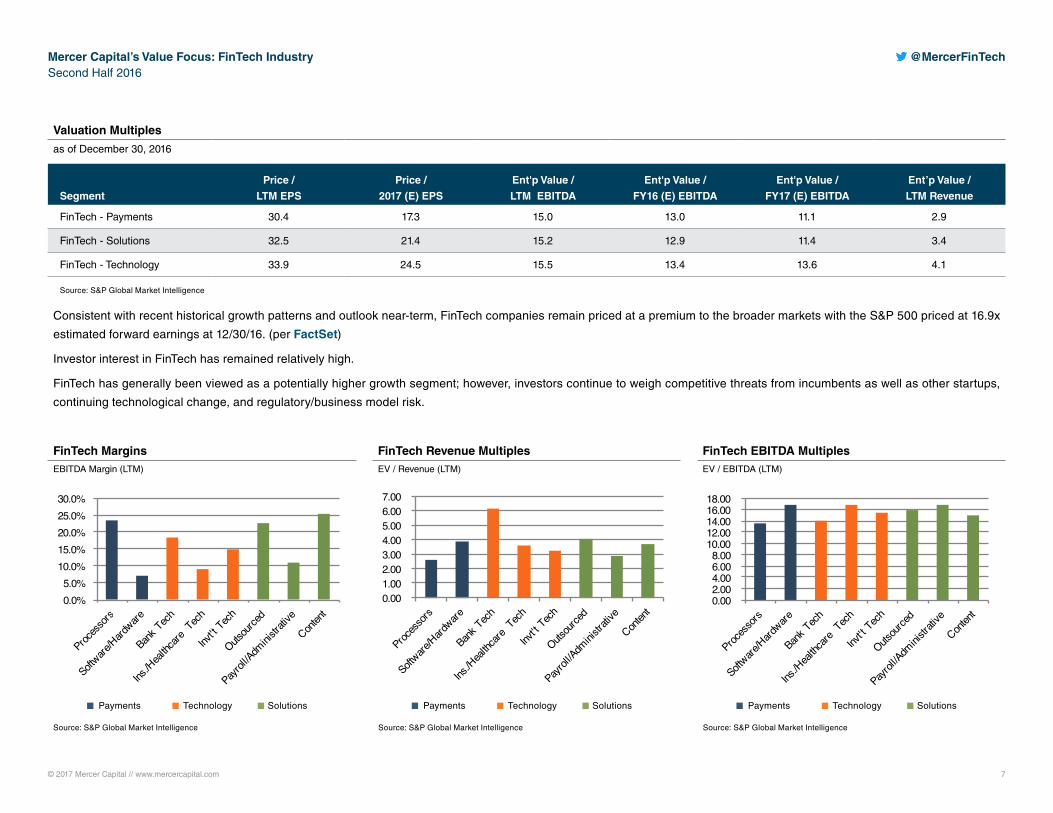
Valuation Multiples
as of December 30, 2016
Segment
Price /
LTM EPS
Price /
2017 (E) EPS
Ent'p Value /
LTM EBITDA
Ent'p Value /
FY16 (E) EBITDA
Ent'p Value /
FY17 (E) EBITDA
Ent’p Value /
LTM Revenue
FinTech - Payments 30.4 17.3 15.0 13.0 11.1 2.9
FinTech - Solutions 32.5 21.4 15.2 12.9 11.4 3.4
FinTech - Technology 33.9 24.5 15.5 13.4 13.6 4.1
Source: S&P Global Market Intelligence
Consistent with recent historical growth patterns and outlook near-term, FinTech companies remain priced at a premium to the broader markets with the S&P 500 priced at 16.9x
estimated forward earnings at 12/30/16. (per FactSet)
Investor interest in FinTech has remained relatively high.
FinTech has generally been viewed as a potentially higher growth segment; however, investors continue to weigh competitive threats from incumbents as well as other startups,
continuing technological change, and regulatory/business model risk.
FinTech MarginsEBITDA Margin (LTM)
FinTech Revenue MultiplesEV / Revenue (LTM)
FinTech EBITDA MultiplesEV / EBITDA (LTM)
0.00 2.00 4.00 6.00 8.00
10.00 12.00 14.00 16.00 18.00
0.00 1.00 2.00 3.00 4.00 5.00 6.00 7.00
0.0% 5.0%
10.0% 15.0% 20.0% 25.0% 30.0%
Source: S&P Global Market Intelligence Source: S&P Global Market Intelligence Source: S&P Global Market Intelligence
Payments Technology Solutions Payments Technology Solutions Payments Technology Solutions
© 2017 Mercer Capital // www.mercercapital.com 8
Mercer Capital’s Value Focus: FinTech IndustrySecond Half 2016
@MercerFinTech
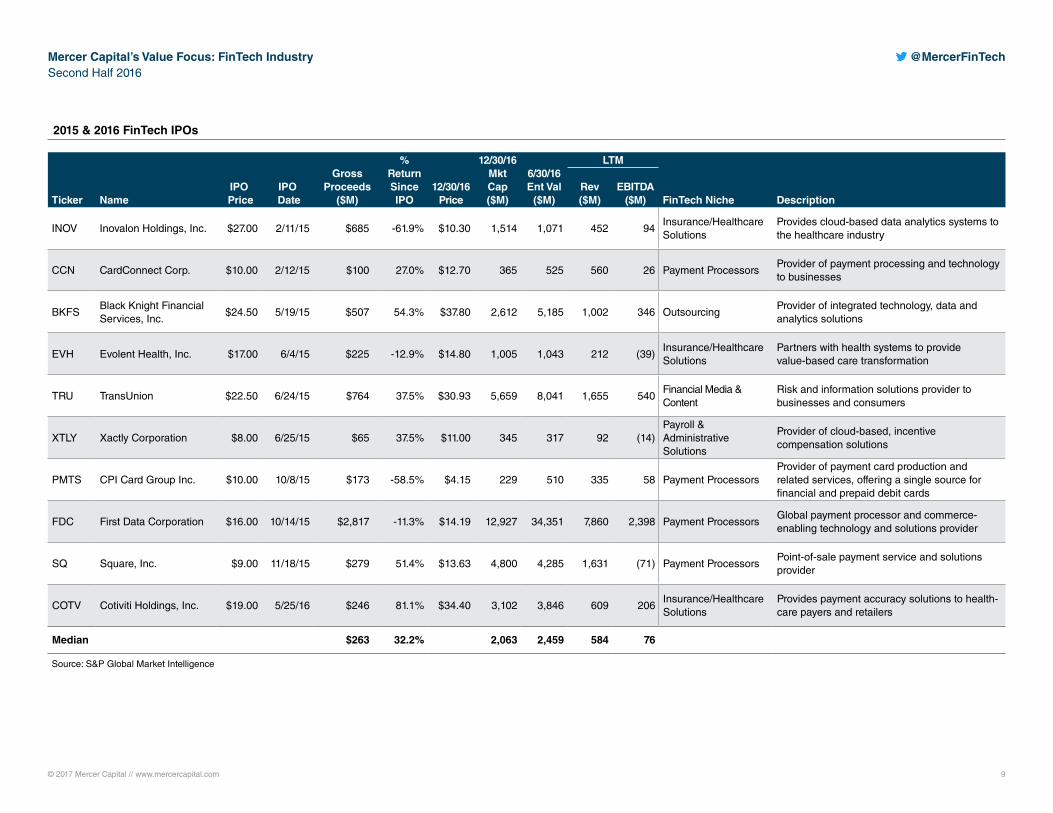
• IPO activity slowed in late 2015 and 2016 as market volatility, speculation about the future path of
interest rates, and risks and uncertainty abroad and in the U.S. weighed on markets.
• The FinTech IPO drought continued in the second half of 2016 with no IPOs. There has been only one
FinTech IPO in 2016, compared to nine FinTech IPOs in 2015 and 16 in 2014.
• Another factor weighing on recent activity is the performance of recent IPOs with three of the nine IPOs
in 2015 reporting a decline in pricing of greater than -30% since the IPO.
• Overall, though there have been notable and successful IPOs, within the median increase in the return
since IPO for FinTech IPOs in 2015 and 2016 was ~7%.
FinTech IPO Watch
What We’re Reading
Ensuring Cybersecurity in FinTech: Key Trends and Solutions
Cybersecurity in Fintech is vital to the industry’s success and understanding potential security threats is essential in developing adequate solutions.
FinTech Startups Face Dilemma on Banks: Are They Friend or Foe?
Startups are finding it difficult to decide whether or not to partner with traditional banks in their space. (subscription required)
FinTech’s Answer for Chilly IPO Market? DebtWhile Fintech firms are waiting for the IPO market to warm up, they are turning to debt capital to fuel business. (subscription required)
Banks Playing Growing Role in Funding FinTechAmerican Banker examines the changing landscape of funding for Fintech startups.
Private Funding for FinTech Firms Has Taken a TumbleCurrently, FinTech firms are failing to attract strong private funding, unlike years past.
Every Regulator Gets a Piece of FinTech Under Lawmaker’s PlanThis Bloomberg article provides insight on potential regulation that Fintech might face in the future.
Despite Questions, Trump Victory Could Benefit FinTechTrump’s distaste for regulation could prove to be advantageous for FinTech firms. (subscription required)
© 2017 Mercer Capital // www.mercercapital.com 9
Mercer Capital’s Value Focus: FinTech IndustrySecond Half 2016
@MercerFinTech
IPO Date
Gross Proceeds
($M)
% Return Since IPO
12/30/16 Price
12/30/16 Mkt Cap ($M)
6/30/16 Ent Val
($M)
LTM
Ticker NameIPO
Price Rev ($M)
EBITDA ($M) FinTech Niche Description
INOV Inovalon Holdings, Inc. $27.00 2/11/15 $685 -61.9% $10.30 1,514 1,071 452 94 Insurance/Healthcare Solutions
Provides cloud-based data analytics systems to the healthcare industry
CCN CardConnect Corp. $10.00 2/12/15 $100 27.0% $12.70 365 525 560 26 Payment ProcessorsProvider of payment processing and technology to businesses
BKFSBlack Knight Financial Services, Inc.
$24.50 5/19/15 $507 54.3% $37.80 2,612 5,185 1,002 346 OutsourcingProvider of integrated technology, data and analytics solutions
EVH Evolent Health, Inc. $17.00 6/4/15 $225 -12.9% $14.80 1,005 1,043 212 (39)Insurance/Healthcare Solutions
Partners with health systems to provide value-based care transformation
TRU TransUnion $22.50 6/24/15 $764 37.5% $30.93 5,659 8,041 1,655 540 Financial Media & Content
Risk and information solutions provider to businesses and consumers
XTLY Xactly Corporation $8.00 6/25/15 $65 37.5% $11.00 345 317 92 (14)Payroll & Administrative Solutions
Provider of cloud-based, incentive compensation solutions
PMTS CPI Card Group Inc. $10.00 10/8/15 $173 -58.5% $4.15 229 510 335 58 Payment ProcessorsProvider of payment card production and related services, offering a single source for financial and prepaid debit cards
FDC First Data Corporation $16.00 10/14/15 $2,817 -11.3% $14.19 12,927 34,351 7,860 2,398 Payment ProcessorsGlobal payment processor and commerce- enabling technology and solutions provider
SQ Square, Inc. $9.00 11/18/15 $279 51.4% $13.63 4,800 4,285 1,631 (71) Payment ProcessorsPoint-of -sale payment service and solutions provider
COTV Cotiviti Holdings, Inc. $19.00 5/25/16 $246 81.1% $34.40 3,102 3,846 609 206 Insurance/Healthcare Solutions
Provides payment accuracy solutions to health-care payers and retailers
Median $263 32.2% 2,063 2,459 584 76
Source: S&P Global Market Intelligence
2015 & 2016 FinTech IPOs
© 2017 Mercer Capital // www.mercercapital.com // Source: S&P Global Market Intelligence 10
Mercer Capital’s Value Focus: FinTech IndustrySecond Half 2016
@MercerFinTech
FinTech M&A
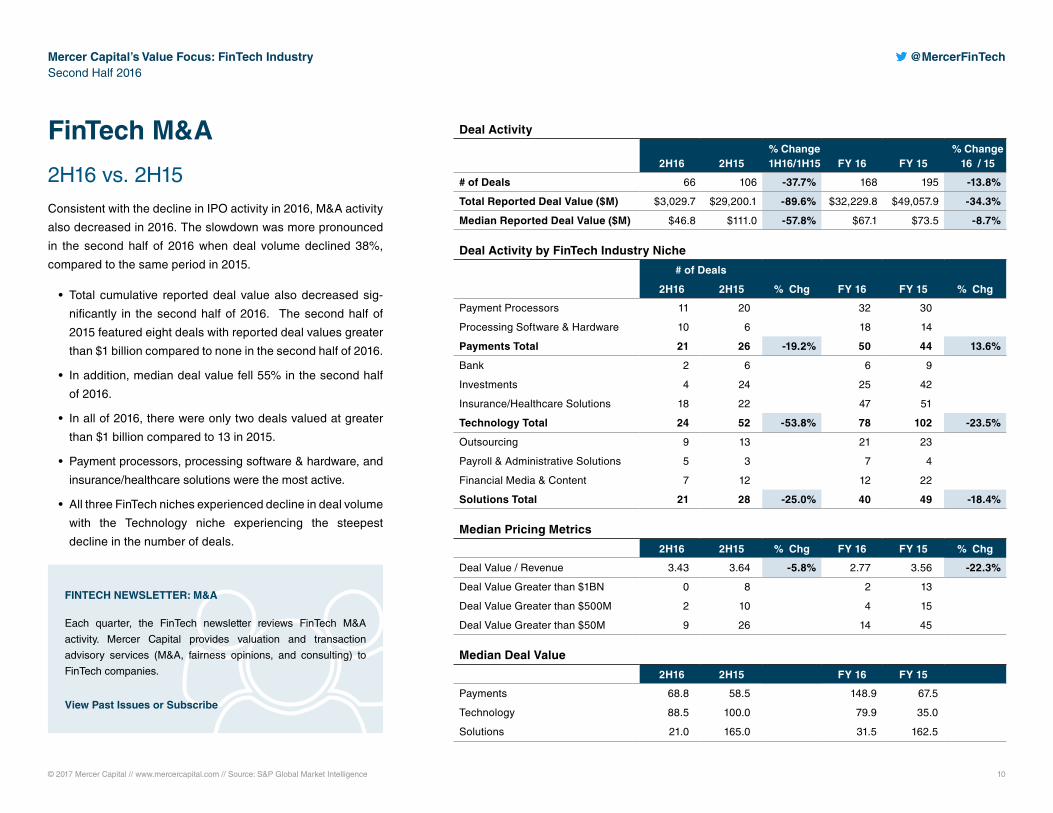
2H16 vs. 2H15Consistent with the decline in IPO activity in 2016, M&A activity
also decreased in 2016. The slowdown was more pronounced
in the second half of 2016 when deal volume declined 38%,
compared to the same period in 2015.
• Total cumulative reported deal value also decreased sig-
nificantly in the second half of 2016. The second half of
2015 featured eight deals with reported deal values greater
than $1 billion compared to none in the second half of 2016.
• In addition, median deal value fell 55% in the second half
of 2016.
• In all of 2016, there were only two deals valued at greater
than $1 billion compared to 13 in 2015.
• Payment processors, processing software & hardware, and
insurance/healthcare solutions were the most active.
• All three FinTech niches experienced decline in deal volume
with the Technology niche experiencing the steepest
decline in the number of deals.
Deal Activity
2H16 2H15% Change1H16/1H15 FY 16 FY 15
% Change16 / 15
# of Deals 66 106 -37.7% 168 195 -13.8%
Total Reported Deal Value ($M) $3,029.7 $29,200.1 -89.6% $32,229.8 $49,057.9 -34.3%
Median Reported Deal Value ($M) $46.8 $111.0 -57.8% $67.1 $73.5 -8.7%
Deal Activity by FinTech Industry Niche
# of Deals
% Chg FY 16 FY 15 % Chg 2H16 2H15
Payment Processors 11 20 32 30
Processing Software & Hardware 10 6 18 14
Payments Total 21 26 -19.2% 50 44 13.6%
Bank 2 6 6 9
Investments 4 24 25 42
Insurance/Healthcare Solutions 18 22 47 51
Technology Total 24 52 -53.8% 78 102 -23.5%
Outsourcing 9 13 21 23
Payroll & Administrative Solutions 5 3 7 4
Financial Media & Content 7 12 12 22
Solutions Total 21 28 -25.0% 40 49 -18.4%
Median Pricing Metrics
2H16 2H15 % Chg FY 16 FY 15 % Chg
Deal Value / Revenue 3.43 3.64 -5.8% 2.77 3.56 -22.3%
Deal Value Greater than $1BN 0 8 2 13
Deal Value Greater than $500M 2 10 4 15
Deal Value Greater than $50M 9 26 14 45
Median Deal Value
2H16 2H15 FY 16 FY 15
Payments 68.8 58.5 148.9 67.5
Technology 88.5 100.0 79.9 35.0
Solutions 21.0 165.0 31.5 162.5
FINTECH NEWSLETTER: M&A
Each quarter, the FinTech newsletter reviews FinTech M&A
activity. Mercer Capital provides valuation and transaction
advisory services (M&A, fairness opinions, and consulting) to
FinTech companies.
View Past Issues or Subscribe
© 2017 Mercer Capital // www.mercercapital.com 11
Mercer Capital’s Value Focus: FinTech IndustrySecond Half 2016
@MercerFinTech
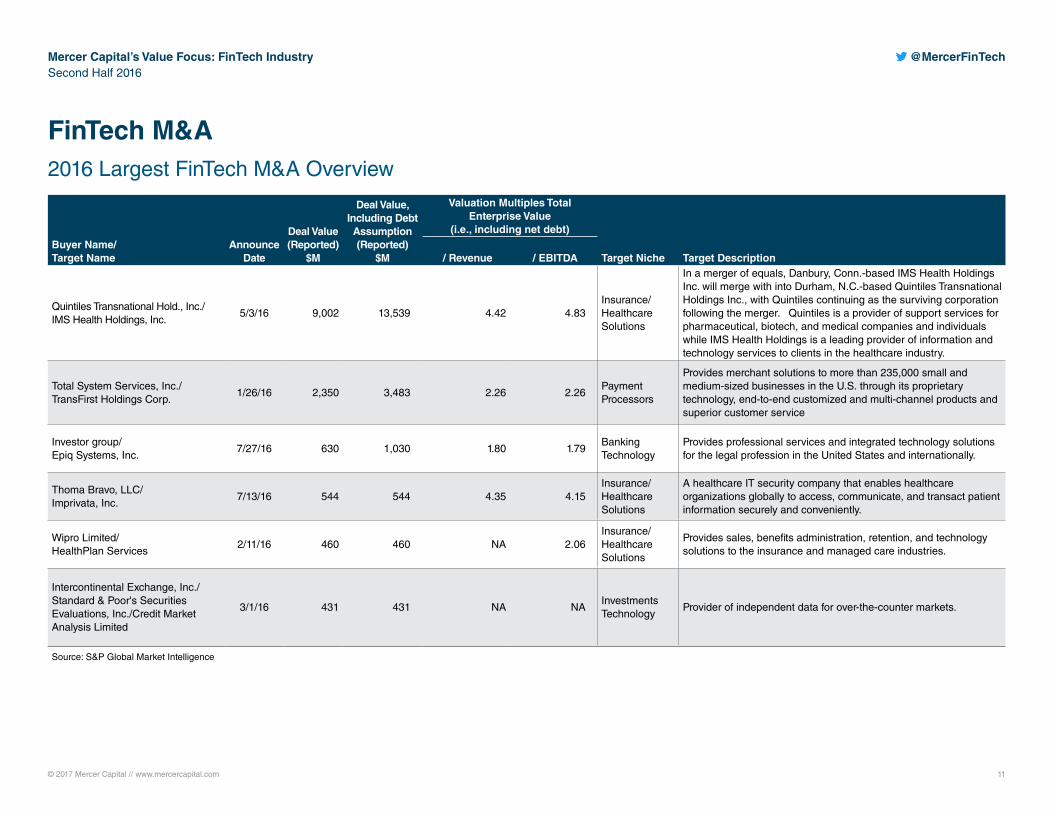
FinTech M&A 2016 Largest FinTech M&A Overview
Deal Value (Reported)
$M
Deal Value, Including Debt Assumption (Reported)
$M
Valuation Multiples Total Enterprise Value
(i.e., including net debt) Buyer Name/ Target Name
Announce Date / Revenue / EBITDA Target Niche Target Description
Quintiles Transnational Hold., Inc./ IMS Health Holdings, Inc.
5/3/16 9,002 13,539 4.42 4.83 Insurance/Healthcare Solutions
In a merger of equals, Danbury, Conn.-based IMS Health Holdings Inc. will merge with into Durham, N.C.-based Quintiles Transnational Holdings Inc., with Quintiles continuing as the surviving corporation following the merger. Quintiles is a provider of support services for pharmaceutical, biotech, and medical companies and individuals while IMS Health Holdings is a leading provider of information and technology services to clients in the healthcare industry.
Total System Services, Inc./ TransFirst Holdings Corp.
1/26/16 2,350 3,483 2.26 2.26 Payment Processors
Provides merchant solutions to more than 235,000 small and medium-sized businesses in the U.S. through its proprietary technology, end-to-end customized and multi-channel products and superior customer service
Investor group/ Epiq Systems, Inc.
7/27/16 630 1,030 1.80 1.79 Banking Technology
Provides professional services and integrated technology solutions for the legal profession in the United States and internationally.
Thoma Bravo, LLC/ Imprivata, Inc.
7/13/16 544 544 4.35 4.15 Insurance/Healthcare Solutions
A healthcare IT security company that enables healthcare organizations globally to access, communicate, and transact patient information securely and conveniently.
Wipro Limited/ HealthPlan Services
2/11/16 460 460 NA 2.06 Insurance/Healthcare Solutions
Provides sales, benefits administration, retention, and technology solutions to the insurance and managed care industries.
Intercontinental Exchange, Inc./ Standard & Poor's Securities Evaluations, Inc./Credit Market Analysis Limited
3/1/16 431 431 NA NA Investments Technology
Provider of independent data for over-the-counter markets.
Source: S&P Global Market Intelligence
© 2017 Mercer Capital // www.mercercapital.com 12
Mercer Capital’s Value Focus: FinTech IndustrySecond Half 2016
@MercerFinTech
Deal Value (Reported)
$M
Deal Value, Including Debt Assumption (Reported)
$M
Valuation Multiples Total Enterprise Value
(i.e., including net debt) Buyer Name/ Target Name
Announce Date / Revenue / EBITDA Target Niche Target Description
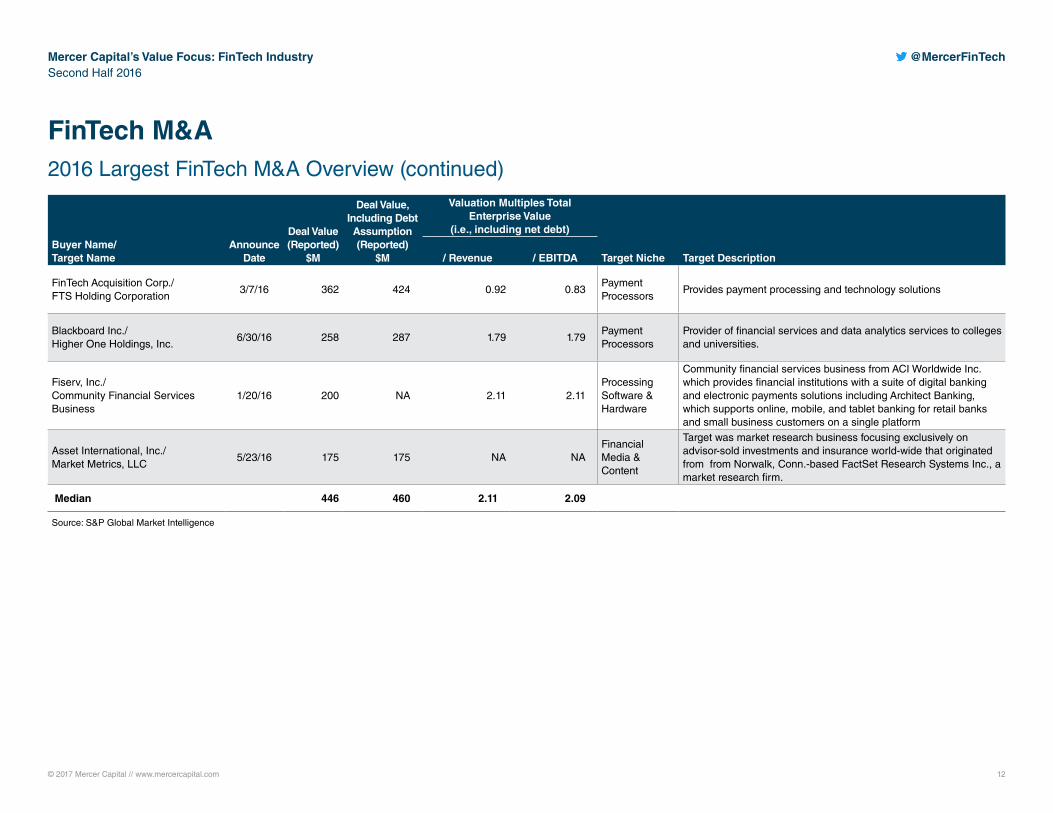
FinTech Acquisition Corp./ FTS Holding Corporation
3/7/16 362 424 0.92 0.83 Payment Processors
Provides payment processing and technology solutions
Blackboard Inc./ Higher One Holdings, Inc.
6/30/16 258 287 1.79 1.79 Payment Processors
Provider of financial services and data analytics services to colleges and universities.
Fiserv, Inc./ Community Financial Services Business
1/20/16 200 NA 2.11 2.11 Processing Software & Hardware
Community financial services business from ACI Worldwide Inc. which provides financial institutions with a suite of digital banking and electronic payments solutions including Architect Banking, which supports online, mobile, and tablet banking for retail banks and small business customers on a single platform
Asset International, Inc./ Market Metrics, LLC
5/23/16 175 175 NA NA Financial Media & Content
Target was market research business focusing exclusively on advisor-sold investments and insurance world-wide that originated from from Norwalk, Conn.-based FactSet Research Systems Inc., a market research firm.
Median 446 460 2.11 2.09
Source: S&P Global Market Intelligence
FinTech M&A 2016 Largest FinTech M&A Overview (continued)
© 2017 Mercer Capital // www.mercercapital.com 13
Mercer Capital’s Value Focus: FinTech IndustrySecond Half 2016
@MercerFinTech
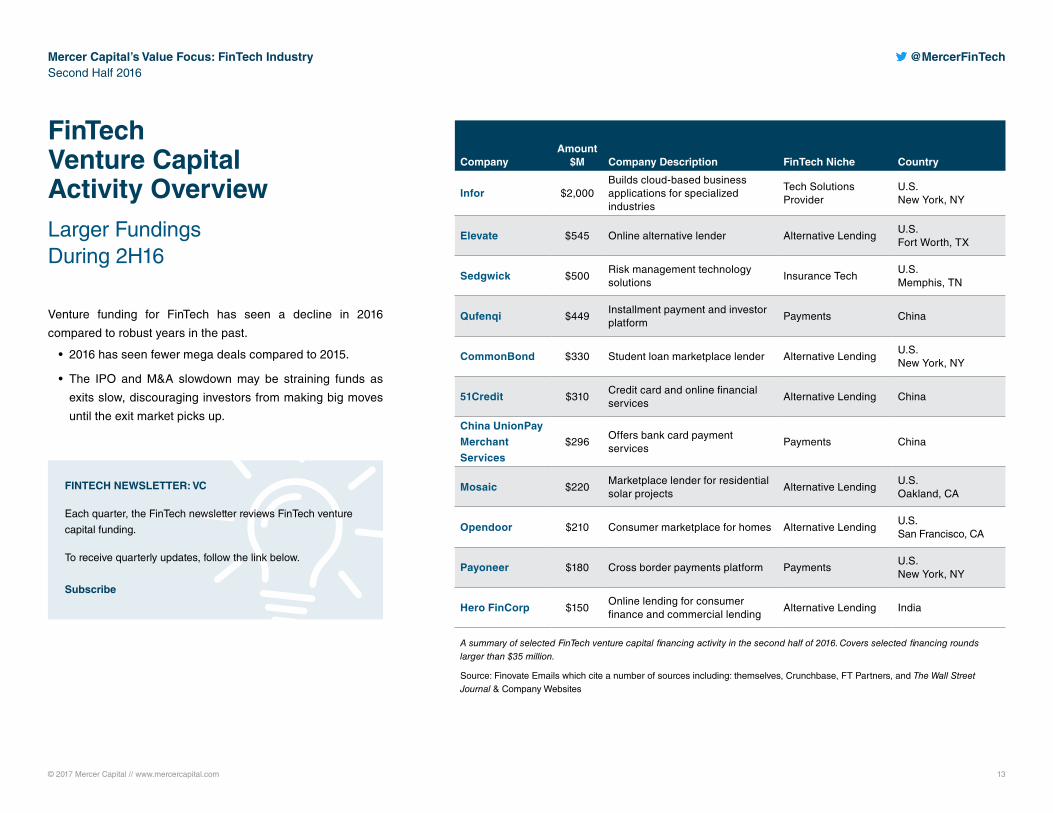
FinTech Venture Capital Activity OverviewLarger Fundings During 2H16
Venture funding for FinTech has seen a decline in 2016
compared to robust years in the past.
• 2016 has seen fewer mega deals compared to 2015.
• The IPO and M&A slowdown may be straining funds as
exits slow, discouraging investors from making big moves
until the exit market picks up.
CompanyAmount
$M Company Description FinTech Niche Country
Infor $2,000 Builds cloud-based business applications for specialized industries
Tech Solutions Provider
U.S. New York, NY
Elevate $545 Online alternative lender Alternative LendingU.S.Fort Worth, TX
Sedgwick $500 Risk management technology solutions
Insurance TechU.S. Memphis, TN
Qufenqi $449 Installment payment and investor platform
Payments China
CommonBond $330 Student loan marketplace lender Alternative LendingU.S. New York, NY
51Credit $310 Credit card and online financial services
Alternative Lending China
China UnionPay
Merchant
Services
$296 Offers bank card payment services
Payments China
Mosaic $220 Marketplace lender for residential solar projects
Alternative LendingU.S. Oakland, CA
Opendoor $210 Consumer marketplace for homes Alternative LendingU.S. San Francisco, CA
Payoneer $180 Cross border payments platform PaymentsU.S. New York, NY
Hero FinCorp $150 Online lending for consumer finance and commercial lending
Alternative Lending India
A summary of selected FinTech venture capital financing activity in the second half of 2016. Covers selected financing rounds larger than $35 million.
Source: Finovate Emails which cite a number of sources including: themselves, Crunchbase, FT Partners, and The Wall Street Journal & Company Websites
FINTECH NEWSLETTER: VC
Each quarter, the FinTech newsletter reviews FinTech venture
capital funding.
To receive quarterly updates, follow the link below.
Subscribe
© 2017 Mercer Capital // www.mercercapital.com 14
Mercer Capital’s Value Focus: FinTech IndustrySecond Half 2016
@MercerFinTech
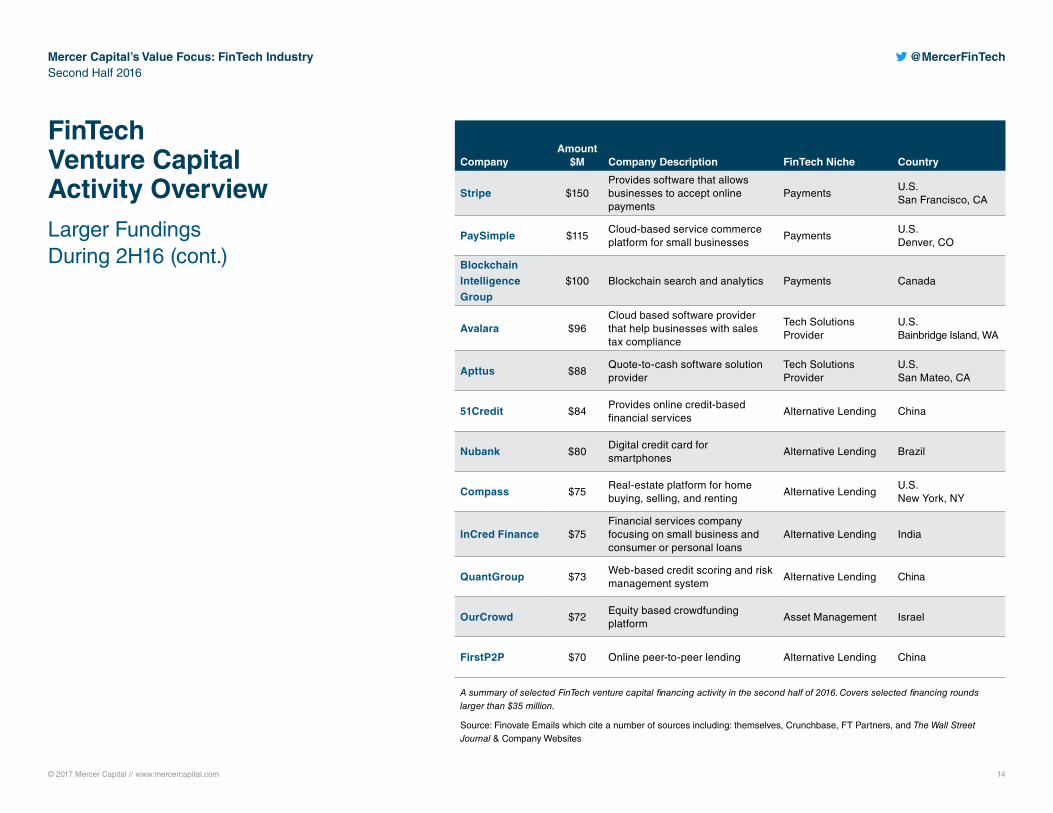
FinTech Venture Capital Activity OverviewLarger Fundings During 2H16 (cont.)
CompanyAmount
$M Company Description FinTech Niche Country
Stripe $150 Provides software that allows businesses to accept online payments
PaymentsU.S. San Francisco, CA
PaySimple $115 Cloud-based service commerce platform for small businesses
PaymentsU.S. Denver, CO
Blockchain
Intelligence
Group
$100 Blockchain search and analytics Payments Canada
Avalara $96 Cloud based software provider that help businesses with sales tax compliance
Tech Solutions Provider
U.S. Bainbridge Island, WA
Apttus $88 Quote-to-cash software solution provider
Tech Solutions Provider
U.S. San Mateo, CA
51Credit $84 Provides online credit-based financial services
Alternative Lending China
Nubank $80 Digital credit card for smartphones
Alternative Lending Brazil
Compass $75 Real-estate platform for home buying, selling, and renting
Alternative LendingU.S. New York, NY
InCred Finance $75 Financial services company focusing on small business and consumer or personal loans
Alternative Lending India
QuantGroup $73 Web-based credit scoring and risk management system
Alternative Lending China
OurCrowd $72 Equity based crowdfunding platform
Asset Management Israel
FirstP2P $70 Online peer-to-peer lending Alternative Lending China
A summary of selected FinTech venture capital financing activity in the second half of 2016. Covers selected financing rounds larger than $35 million.
Source: Finovate Emails which cite a number of sources including: themselves, Crunchbase, FT Partners, and The Wall Street Journal & Company Websites
© 2017 Mercer Capital // www.mercercapital.com 15
Mercer Capital’s Value Focus: FinTech IndustrySecond Half 2016
@MercerFinTech
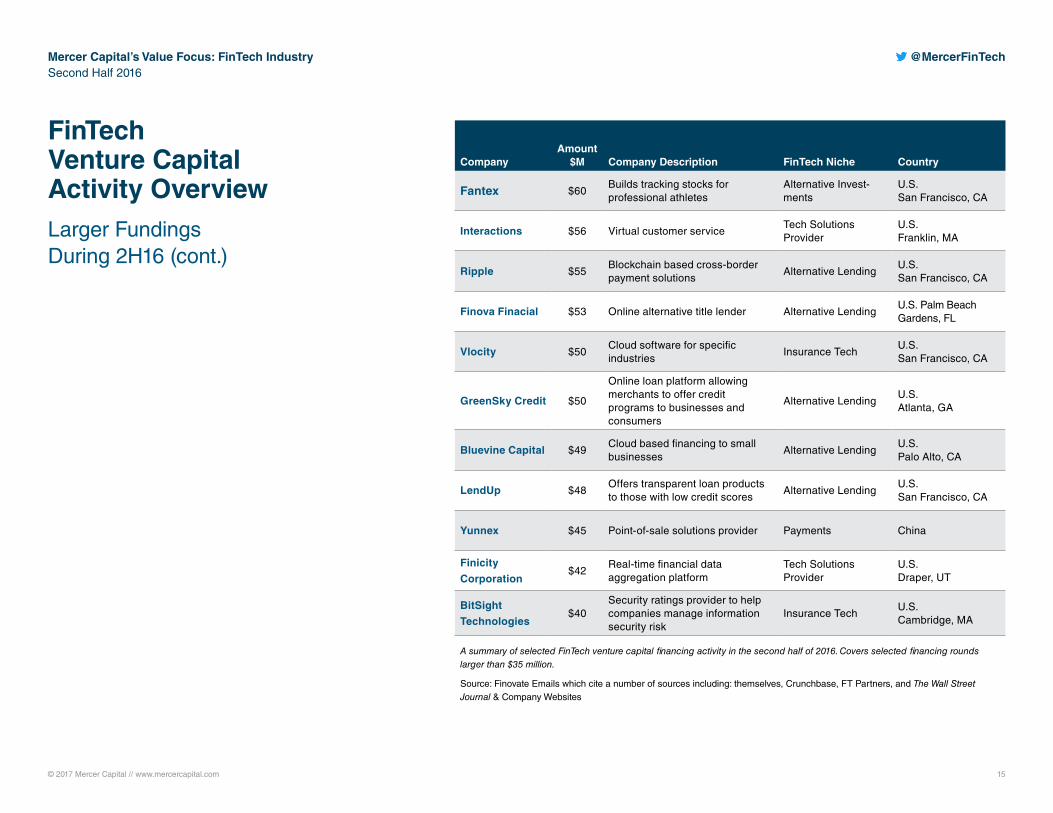
FinTech Venture Capital Activity OverviewLarger Fundings During 2H16 (cont.)
CompanyAmount
$M Company Description FinTech Niche Country
Fantex $60 Builds tracking stocks for professional athletes
Alternative Invest-ments
U.S. San Francisco, CA
Interactions $56 Virtual customer serviceTech Solutions Provider
U.S. Franklin, MA
Ripple $55 Blockchain based cross-border payment solutions
Alternative LendingU.S. San Francisco, CA
Finova Finacial $53 Online alternative title lender Alternative LendingU.S. Palm Beach Gardens, FL
Vlocity $50 Cloud software for specific industries
Insurance TechU.S. San Francisco, CA
GreenSky Credit $50
Online loan platform allowing merchants to offer credit programs to businesses and consumers
Alternative LendingU.S. Atlanta, GA
Bluevine Capital $49 Cloud based financing to small businesses
Alternative LendingU.S. Palo Alto, CA
LendUp $48 Offers transparent loan products to those with low credit scores
Alternative LendingU.S. San Francisco, CA
Yunnex $45 Point-of-sale solutions provider Payments China
Finicity
Corporation$42
Real-time financial data aggregation platform
Tech Solutions Provider
U.S. Draper, UT
BitSight
Technologies$40
Security ratings provider to help companies manage information security risk
Insurance TechU.S. Cambridge, MA
A summary of selected FinTech venture capital financing activity in the second half of 2016. Covers selected financing rounds larger than $35 million.
Source: Finovate Emails which cite a number of sources including: themselves, Crunchbase, FT Partners, and The Wall Street Journal & Company Websites
© 2017 Mercer Capital // www.mercercapital.com 16
Mercer Capital’s Value Focus: FinTech IndustrySecond Half 2016
@MercerFinTech
CompanyAmount
$M Company Description FinTech Niche Country
Cyence $40 Provides software to insurers to understand the impact of cyber risk
Tech Solutions Provider
U.S. San Mateo, CA
Mavenlink $39
Provides enterprise-class software as a service to unify all essential functions of services organizations
Tech Solutions Provider
U.S. Irvine, CA
Remitly $38 Person-to-person mobile payments service
PaymentsU.S. Seattle, WA
Nutmeg $38 Online investment management services
Asset Management London, U.K.
FINO PayTech $38 Online marketplace lender Alternative Lending India
Neogrowth $35 Alternative lender to small businesses
Alternative Lending India
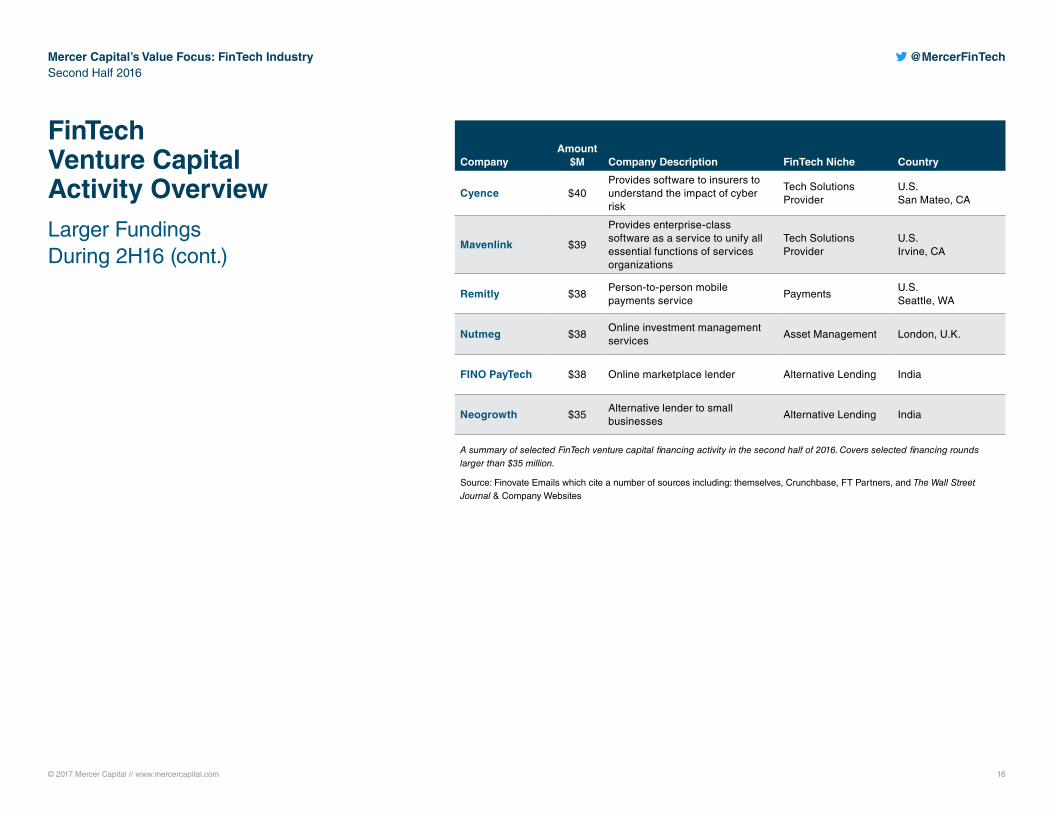
A summary of selected FinTech venture capital financing activity in the second half of 2016. Covers selected financing rounds larger than $35 million.
Source: Finovate Emails which cite a number of sources including: themselves, Crunchbase, FT Partners, and The Wall Street Journal & Company Websites
FinTech Venture Capital Activity OverviewLarger Fundings During 2H16 (cont.)
© 2017 Mercer Capital // www.mercercapital.com 17
Mercer Capital’s Value Focus: FinTech IndustrySecond Half 2016
@MercerFinTech
Venture Capital Case Study
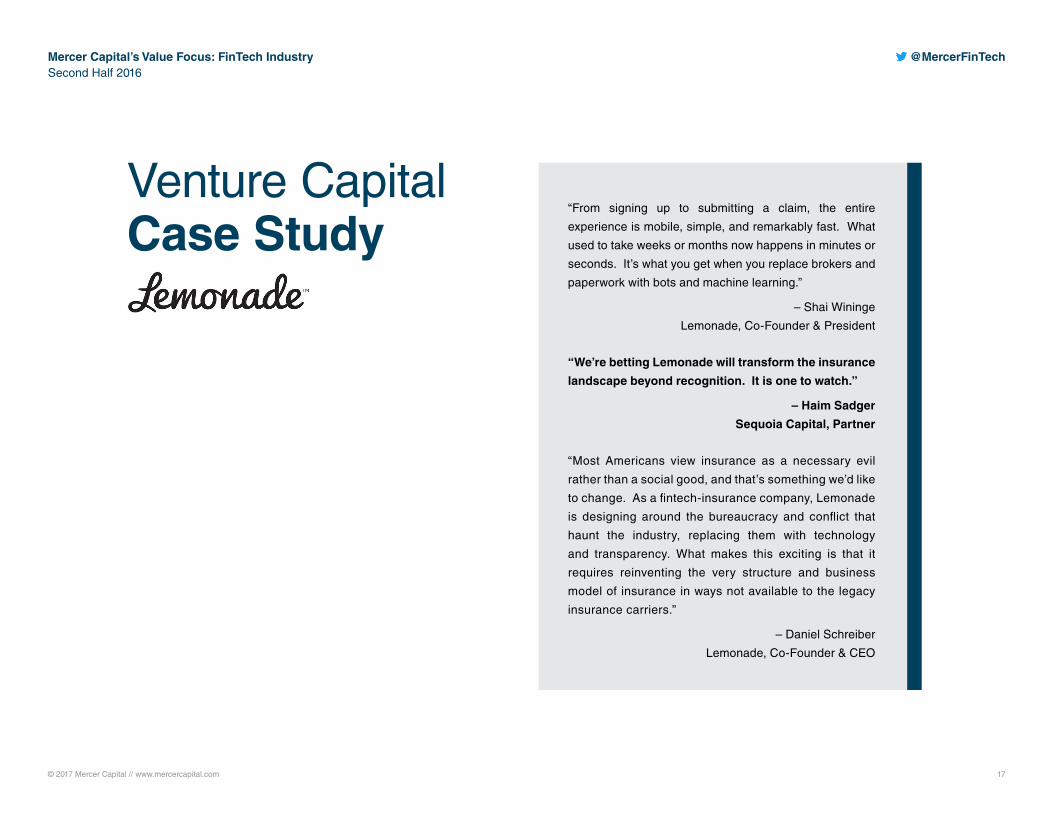
“From signing up to submitting a claim, the entire
experience is mobile, simple, and remarkably fast. What
used to take weeks or months now happens in minutes or
seconds. It’s what you get when you replace brokers and
paperwork with bots and machine learning.”
– Shai Wininge
Lemonade, Co-Founder & President
“We’re betting Lemonade will transform the insurance
landscape beyond recognition. It is one to watch.”
– Haim Sadger
Sequoia Capital, Partner
“Most Americans view insurance as a necessary evil
rather than a social good, and that’s something we’d like
to change. As a fintech-insurance company, Lemonade
is designing around the bureaucracy and conflict that
haunt the industry, replacing them with technology
and transparency. What makes this exciting is that it
requires reinventing the very structure and business
model of insurance in ways not available to the legacy
insurance carriers.”
– Daniel Schreiber
Lemonade, Co-Founder & CEO
© 2017 Mercer Capital // www.mercercapital.com 18
Mercer Capital’s Value Focus: FinTech IndustrySecond Half 2016
@MercerFinTech
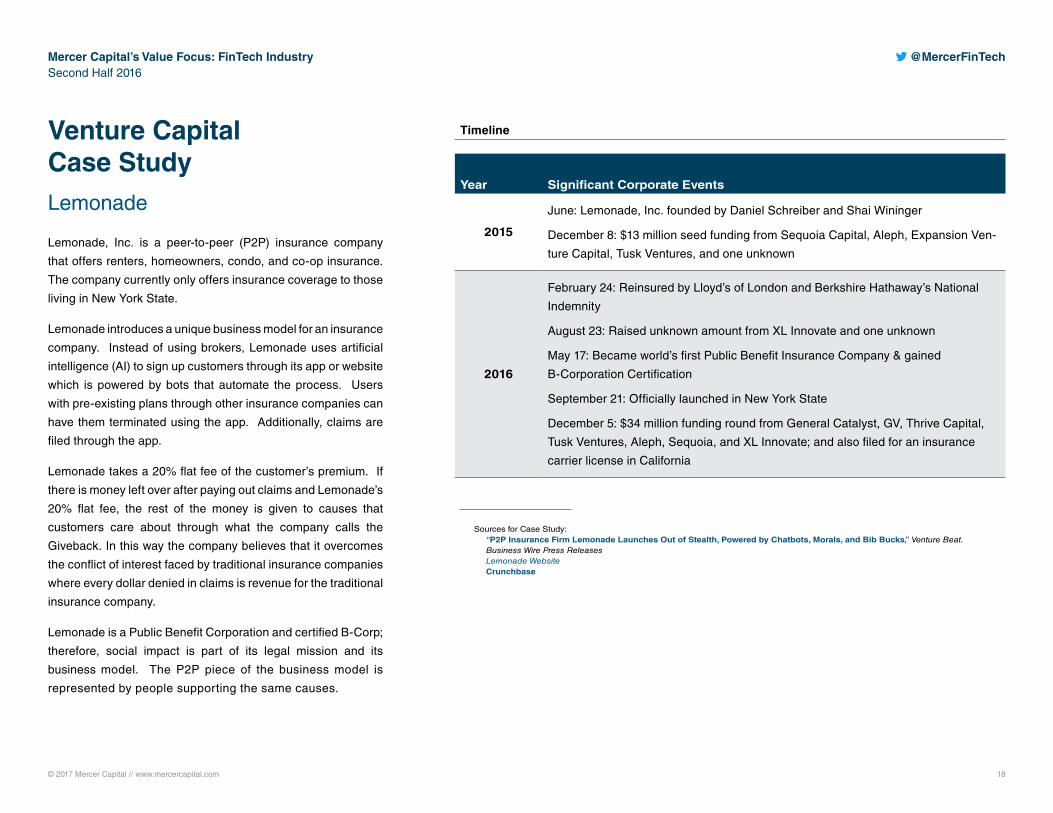
Venture Capital Case StudyLemonade
Lemonade, Inc. is a peer-to-peer (P2P) insurance company
that offers renters, homeowners, condo, and co-op insurance.
The company currently only offers insurance coverage to those
living in New York State.
Lemonade introduces a unique business model for an insurance
company. Instead of using brokers, Lemonade uses artificial
intelligence (AI) to sign up customers through its app or website
which is powered by bots that automate the process. Users
with pre-existing plans through other insurance companies can
have them terminated using the app. Additionally, claims are
filed through the app.
Lemonade takes a 20% flat fee of the customer’s premium. If
there is money left over after paying out claims and Lemonade’s
20% flat fee, the rest of the money is given to causes that
customers care about through what the company calls the
Giveback. In this way the company believes that it overcomes
the conflict of interest faced by traditional insurance companies
where every dollar denied in claims is revenue for the traditional
insurance company.
Lemonade is a Public Benefit Corporation and certified B-Corp;
therefore, social impact is part of its legal mission and its
business model. The P2P piece of the business model is
represented by people supporting the same causes.
Year Significant Corporate Events
2015
June: Lemonade, Inc. founded by Daniel Schreiber and Shai Wininger
December 8: $13 million seed funding from Sequoia Capital, Aleph, Expansion Ven-
ture Capital, Tusk Ventures, and one unknown
2016
February 24: Reinsured by Lloyd’s of London and Berkshire Hathaway’s National
Indemnity
August 23: Raised unknown amount from XL Innovate and one unknown
May 17: Became world’s first Public Benefit Insurance Company & gained
B-Corporation Certification
September 21: Officially launched in New York State
December 5: $34 million funding round from General Catalyst, GV, Thrive Capital,
Tusk Ventures, Aleph, Sequoia, and XL Innovate; and also filed for an insurance
carrier license in California
Timeline
Sources for Case Study:“P2P Insurance Firm Lemonade Launches Out of Stealth, Powered by Chatbots, Morals, and Bib Bucks,” Venture Beat. Business Wire Press ReleasesLemonade WebsiteCrunchbase
© 2017 Mercer Capital // www.mercercapital.com 19
Mercer Capital’s Value Focus: FinTech IndustrySecond Half 2016
@MercerFinTech
Venture Capital Case StudyLemonade
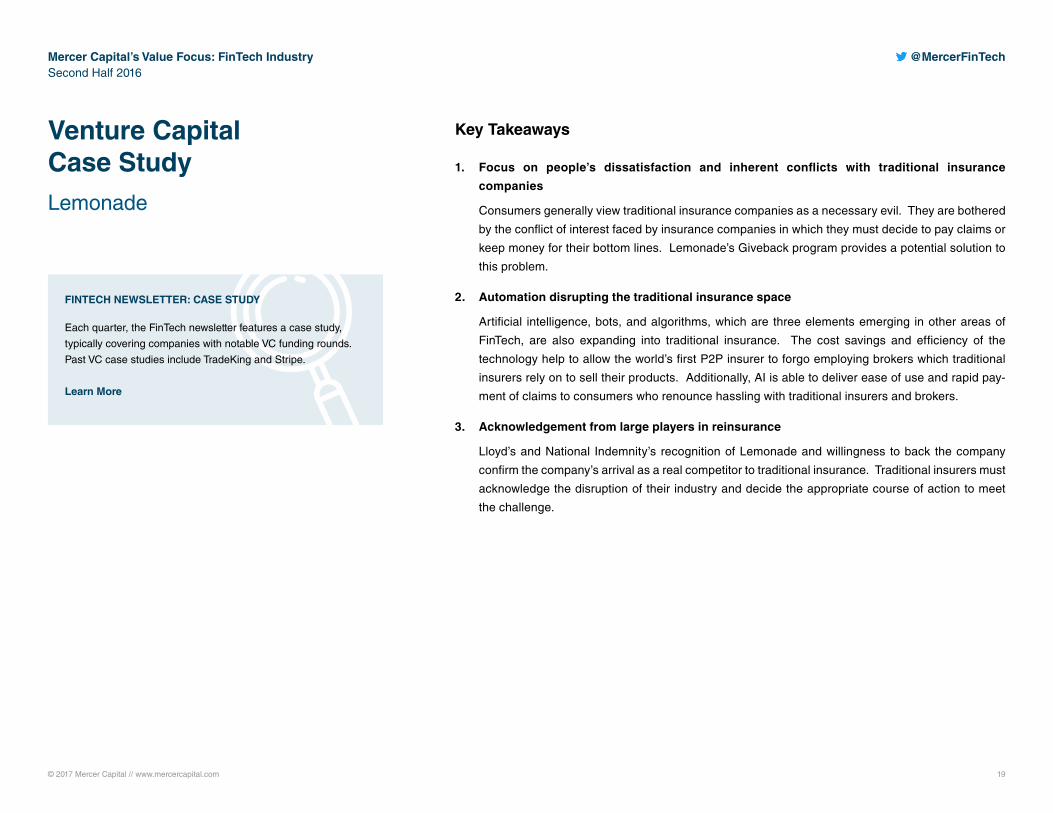
Key Takeaways
1. Focus on people’s dissatisfaction and inherent conflicts with traditional insurance
companies
Consumers generally view traditional insurance companies as a necessary evil. They are bothered
by the conflict of interest faced by insurance companies in which they must decide to pay claims or
keep money for their bottom lines. Lemonade’s Giveback program provides a potential solution to
this problem.
2. Automation disrupting the traditional insurance space
Artificial intelligence, bots, and algorithms, which are three elements emerging in other areas of
FinTech, are also expanding into traditional insurance. The cost savings and efficiency of the
technology help to allow the world’s first P2P insurer to forgo employing brokers which traditional
insurers rely on to sell their products. Additionally, AI is able to deliver ease of use and rapid pay-
ment of claims to consumers who renounce hassling with traditional insurers and brokers.
3. Acknowledgement from large players in reinsurance
Lloyd’s and National Indemnity’s recognition of Lemonade and willingness to back the company
confirm the company’s arrival as a real competitor to traditional insurance. Traditional insurers must
acknowledge the disruption of their industry and decide the appropriate course of action to meet
the challenge.
FINTECH NEWSLETTER: CASE STUDY
Each quarter, the FinTech newsletter features a case study,
typically covering companies with notable VC funding rounds.
Past VC case studies include TradeKing and Stripe.
Learn More
© 2017 Mercer Capital // www.mercercapital.com // Source: S&P Global Market Intelligence 20
Mercer Capital’s Value Focus: FinTech IndustrySecond Half 2016
@MercerFinTech
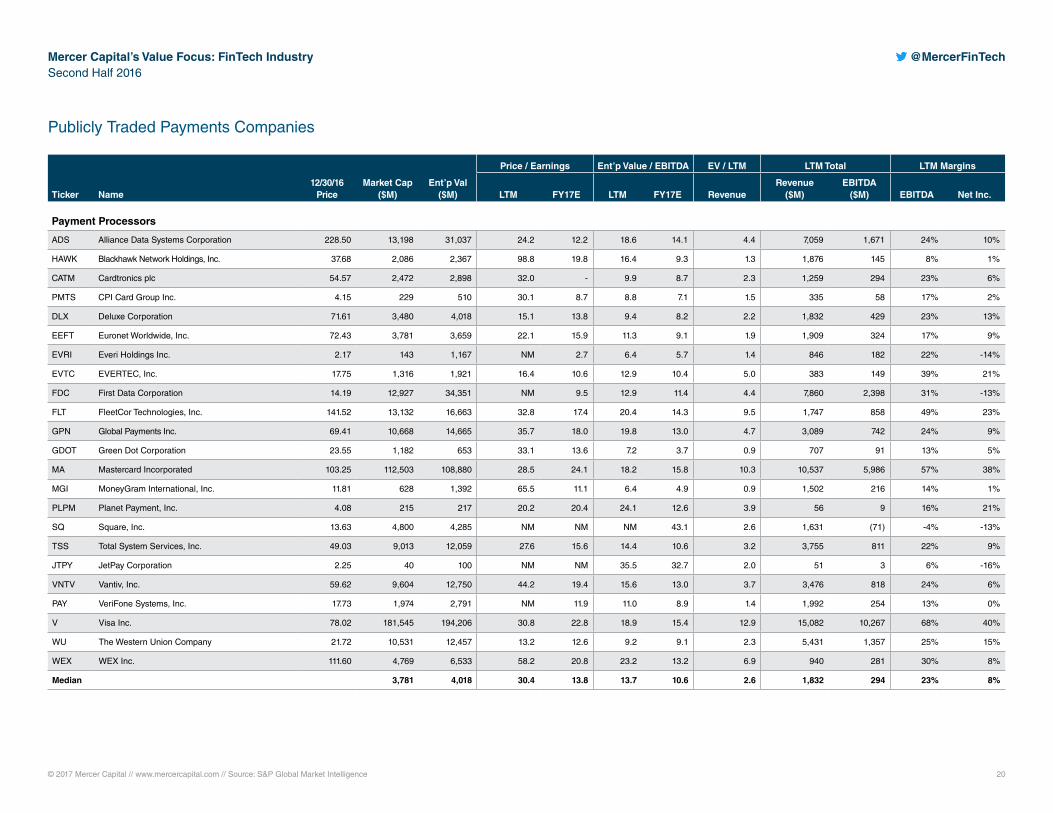
Publicly Traded Payments Companies
Ticker Name12/30/16
PriceMarket Cap
($M) Ent’p Val
($M)
Price / Earnings Ent’p Value / EBITDA EV / LTM LTM Total LTM Margins
LTM FY17E LTM FY17E RevenueRevenue
($M)EBITDA
($M) EBITDA Net Inc.
Payment Processors
ADS Alliance Data Systems Corporation 228.50 13,198 31,037 24.2 12.2 18.6 14.1 4.4 7,059 1,671 24% 10%
HAWK Blackhawk Network Holdings, Inc. 37.68 2,086 2,367 98.8 19.8 16.4 9.3 1.3 1,876 145 8% 1%
CATM Cardtronics plc 54.57 2,472 2,898 32.0 - 9.9 8.7 2.3 1,259 294 23% 6%
PMTS CPI Card Group Inc. 4.15 229 510 30.1 8.7 8.8 7.1 1.5 335 58 17% 2%
DLX Deluxe Corporation 71.61 3,480 4,018 15.1 13.8 9.4 8.2 2.2 1,832 429 23% 13%
EEFT Euronet Worldwide, Inc. 72.43 3,781 3,659 22.1 15.9 11.3 9.1 1.9 1,909 324 17% 9%
EVRI Everi Holdings Inc. 2.17 143 1,167 NM 2.7 6.4 5.7 1.4 846 182 22% -14%
EVTC EVERTEC, Inc. 17.75 1,316 1,921 16.4 10.6 12.9 10.4 5.0 383 149 39% 21%
FDC First Data Corporation 14.19 12,927 34,351 NM 9.5 12.9 11.4 4.4 7,860 2,398 31% -13%
FLT FleetCor Technologies, Inc. 141.52 13,132 16,663 32.8 17.4 20.4 14.3 9.5 1,747 858 49% 23%
GPN Global Payments Inc. 69.41 10,668 14,665 35.7 18.0 19.8 13.0 4.7 3,089 742 24% 9%
GDOT Green Dot Corporation 23.55 1,182 653 33.1 13.6 7.2 3.7 0.9 707 91 13% 5%
MA Mastercard Incorporated 103.25 112,503 108,880 28.5 24.1 18.2 15.8 10.3 10,537 5,986 57% 38%
MGI MoneyGram International, Inc. 11.81 628 1,392 65.5 11.1 6.4 4.9 0.9 1,502 216 14% 1%
PLPM Planet Payment, Inc. 4.08 215 217 20.2 20.4 24.1 12.6 3.9 56 9 16% 21%
SQ Square, Inc. 13.63 4,800 4,285 NM NM NM 43.1 2.6 1,631 (71) -4% -13%
TSS Total System Services, Inc. 49.03 9,013 12,059 27.6 15.6 14.4 10.6 3.2 3,755 811 22% 9%
JTPY JetPay Corporation 2.25 40 100 NM NM 35.5 32.7 2.0 51 3 6% -16%
VNTV Vantiv, Inc. 59.62 9,604 12,750 44.2 19.4 15.6 13.0 3.7 3,476 818 24% 6%
PAY VeriFone Systems, Inc. 17.73 1,974 2,791 NM 11.9 11.0 8.9 1.4 1,992 254 13% 0%
V Visa Inc. 78.02 181,545 194,206 30.8 22.8 18.9 15.4 12.9 15,082 10,267 68% 40%
WU The Western Union Company 21.72 10,531 12,457 13.2 12.6 9.2 9.1 2.3 5,431 1,357 25% 15%
WEX WEX Inc. 111.60 4,769 6,533 58.2 20.8 23.2 13.2 6.9 940 281 30% 8%
Median 3,781 4,018 30.4 13.8 13.7 10.6 2.6 1,832 294 23% 8%
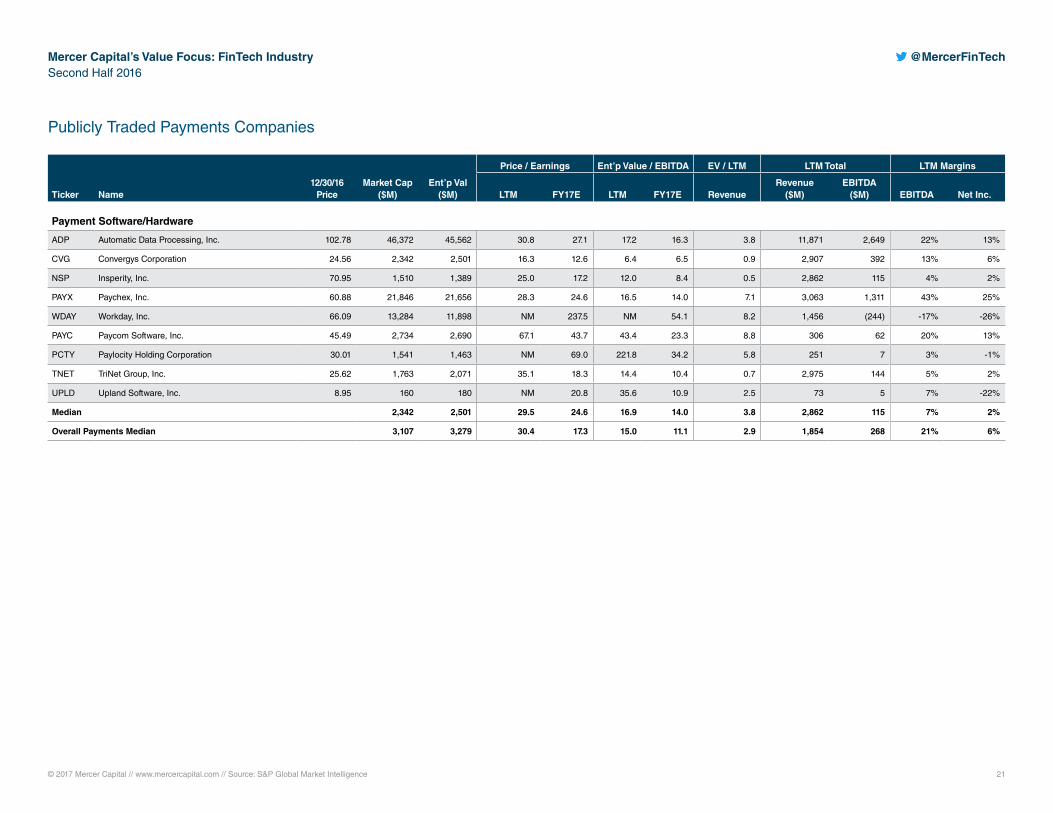
© 2017 Mercer Capital // www.mercercapital.com // Source: S&P Global Market Intelligence 21
Mercer Capital’s Value Focus: FinTech IndustrySecond Half 2016
@MercerFinTech
Publicly Traded Payments Companies
Ticker Name12/30/16
PriceMarket Cap
($M) Ent’p Val
($M)
Price / Earnings Ent’p Value / EBITDA EV / LTM LTM Total LTM Margins
LTM FY17E LTM FY17E RevenueRevenue
($M)EBITDA
($M) EBITDA Net Inc.
Payment Software/Hardware
ADP Automatic Data Processing, Inc. 102.78 46,372 45,562 30.8 27.1 17.2 16.3 3.8 11,871 2,649 22% 13%
CVG Convergys Corporation 24.56 2,342 2,501 16.3 12.6 6.4 6.5 0.9 2,907 392 13% 6%
NSP Insperity, Inc. 70.95 1,510 1,389 25.0 17.2 12.0 8.4 0.5 2,862 115 4% 2%
PAYX Paychex, Inc. 60.88 21,846 21,656 28.3 24.6 16.5 14.0 7.1 3,063 1,311 43% 25%
WDAY Workday, Inc. 66.09 13,284 11,898 NM 237.5 NM 54.1 8.2 1,456 (244) -17% -26%
PAYC Paycom Software, Inc. 45.49 2,734 2,690 67.1 43.7 43.4 23.3 8.8 306 62 20% 13%
PCTY Paylocity Holding Corporation 30.01 1,541 1,463 NM 69.0 221.8 34.2 5.8 251 7 3% -1%
TNET TriNet Group, Inc. 25.62 1,763 2,071 35.1 18.3 14.4 10.4 0.7 2,975 144 5% 2%
UPLD Upland Software, Inc. 8.95 160 180 NM 20.8 35.6 10.9 2.5 73 5 7% -22%
Median 2,342 2,501 29.5 24.6 16.9 14.0 3.8 2,862 115 7% 2%
Overall Payments Median 3,107 3,279 30.4 17.3 15.0 11.1 2.9 1,854 268 21% 6%
© 2017 Mercer Capital // www.mercercapital.com // Source: S&P Global Market Intelligence 22
Mercer Capital’s Value Focus: FinTech IndustrySecond Half 2016
@MercerFinTech
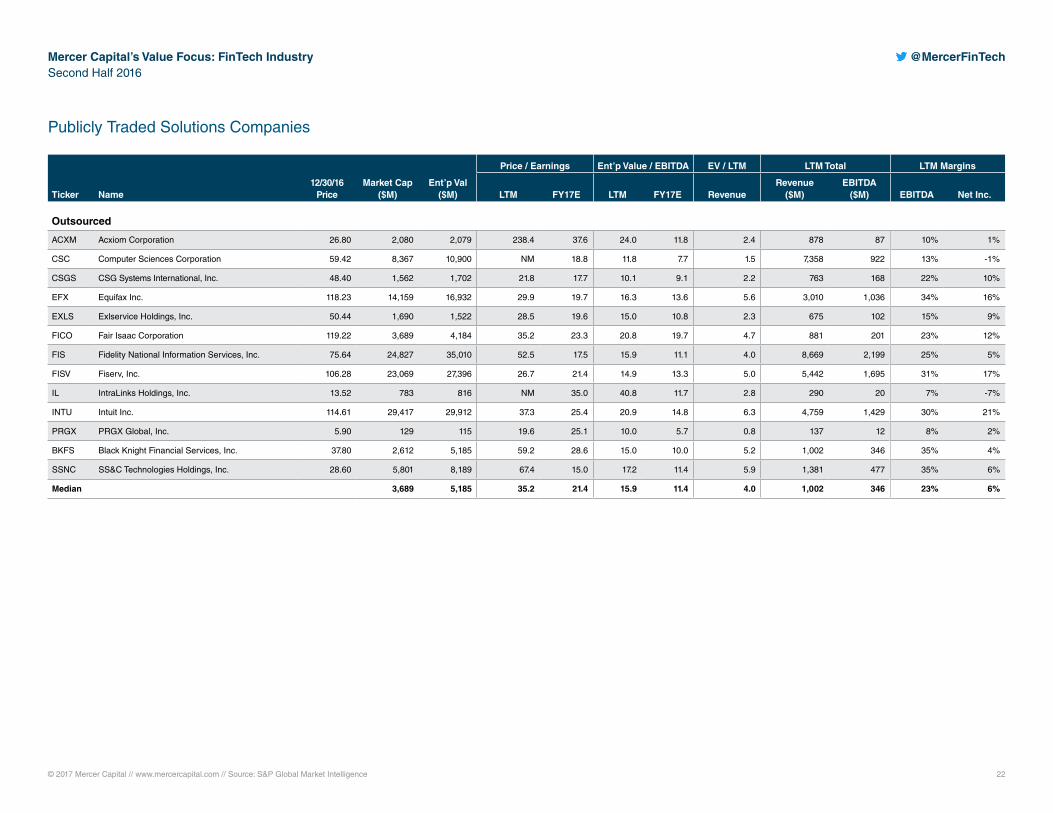
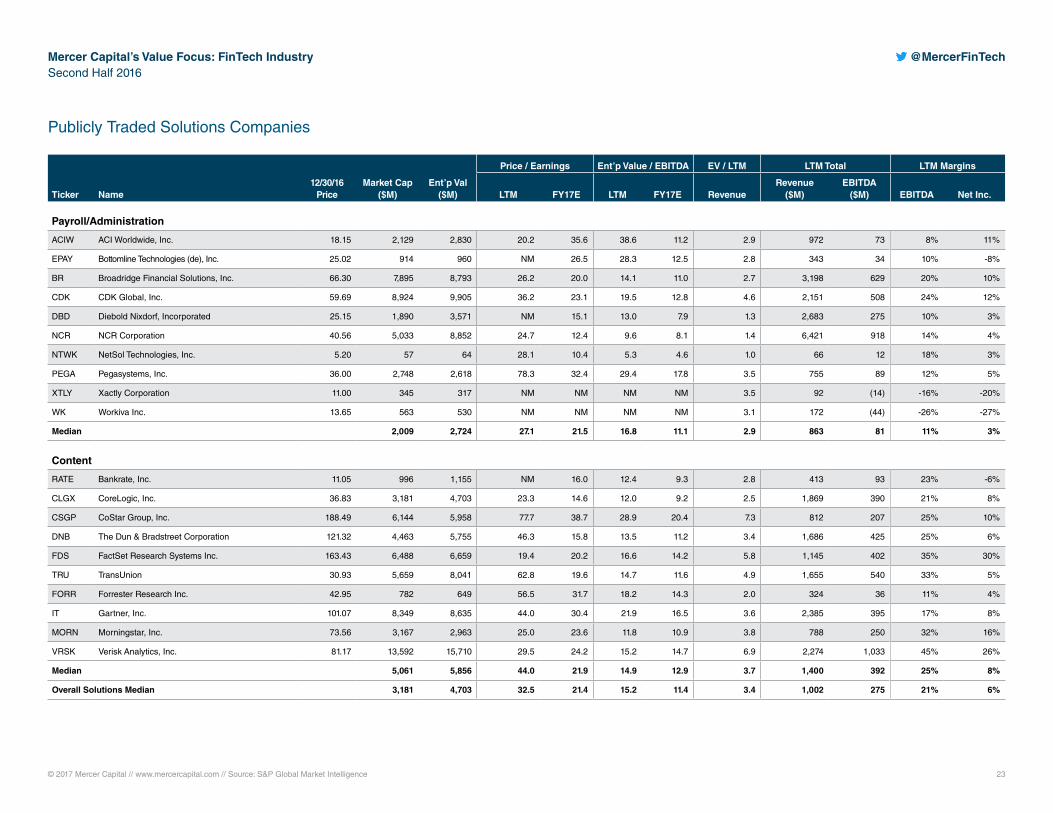
Publicly Traded Solutions Companies
Ticker Name12/30/16
PriceMarket Cap
($M) Ent’p Val
($M)
Price / Earnings Ent’p Value / EBITDA EV / LTM LTM Total LTM Margins
LTM FY17E LTM FY17E RevenueRevenue
($M)EBITDA
($M) EBITDA Net Inc.
Outsourced
ACXM Acxiom Corporation 26.80 2,080 2,079 238.4 37.6 24.0 11.8 2.4 878 87 10% 1%
CSC Computer Sciences Corporation 59.42 8,367 10,900 NM 18.8 11.8 7.7 1.5 7,358 922 13% -1%
CSGS CSG Systems International, Inc. 48.40 1,562 1,702 21.8 17.7 10.1 9.1 2.2 763 168 22% 10%
EFX Equifax Inc. 118.23 14,159 16,932 29.9 19.7 16.3 13.6 5.6 3,010 1,036 34% 16%
EXLS Exlservice Holdings, Inc. 50.44 1,690 1,522 28.5 19.6 15.0 10.8 2.3 675 102 15% 9%
FICO Fair Isaac Corporation 119.22 3,689 4,184 35.2 23.3 20.8 19.7 4.7 881 201 23% 12%
FIS Fidelity National Information Services, Inc. 75.64 24,827 35,010 52.5 17.5 15.9 11.1 4.0 8,669 2,199 25% 5%
FISV Fiserv, Inc. 106.28 23,069 27,396 26.7 21.4 14.9 13.3 5.0 5,442 1,695 31% 17%
IL IntraLinks Holdings, Inc. 13.52 783 816 NM 35.0 40.8 11.7 2.8 290 20 7% -7%
INTU Intuit Inc. 114.61 29,417 29,912 37.3 25.4 20.9 14.8 6.3 4,759 1,429 30% 21%
PRGX PRGX Global, Inc. 5.90 129 115 19.6 25.1 10.0 5.7 0.8 137 12 8% 2%
BKFS Black Knight Financial Services, Inc. 37.80 2,612 5,185 59.2 28.6 15.0 10.0 5.2 1,002 346 35% 4%
SSNC SS&C Technologies Holdings, Inc. 28.60 5,801 8,189 67.4 15.0 17.2 11.4 5.9 1,381 477 35% 6%
Median 3,689 5,185 35.2 21.4 15.9 11.4 4.0 1,002 346 23% 6%
© 2017 Mercer Capital // www.mercercapital.com // Source: S&P Global Market Intelligence 23
Mercer Capital’s Value Focus: FinTech IndustrySecond Half 2016
@MercerFinTech
Publicly Traded Solutions Companies
Ticker Name12/30/16
PriceMarket Cap
($M) Ent’p Val
($M)
Price / Earnings Ent’p Value / EBITDA EV / LTM LTM Total LTM Margins
LTM FY17E LTM FY17E RevenueRevenue
($M)EBITDA
($M) EBITDA Net Inc.
Payroll/Administration
ACIW ACI Worldwide, Inc. 18.15 2,129 2,830 20.2 35.6 38.6 11.2 2.9 972 73 8% 11%
EPAY Bottomline Technologies (de), Inc. 25.02 914 960 NM 26.5 28.3 12.5 2.8 343 34 10% -8%
BR Broadridge Financial Solutions, Inc. 66.30 7,895 8,793 26.2 20.0 14.1 11.0 2.7 3,198 629 20% 10%
CDK CDK Global, Inc. 59.69 8,924 9,905 36.2 23.1 19.5 12.8 4.6 2,151 508 24% 12%
DBD Diebold Nixdorf, Incorporated 25.15 1,890 3,571 NM 15.1 13.0 7.9 1.3 2,683 275 10% 3%
NCR NCR Corporation 40.56 5,033 8,852 24.7 12.4 9.6 8.1 1.4 6,421 918 14% 4%
NTWK NetSol Technologies, Inc. 5.20 57 64 28.1 10.4 5.3 4.6 1.0 66 12 18% 3%
PEGA Pegasystems, Inc. 36.00 2,748 2,618 78.3 32.4 29.4 17.8 3.5 755 89 12% 5%
XTLY Xactly Corporation 11.00 345 317 NM NM NM NM 3.5 92 (14) -16% -20%
WK Workiva Inc. 13.65 563 530 NM NM NM NM 3.1 172 (44) -26% -27%
Median 2,009 2,724 27.1 21.5 16.8 11.1 2.9 863 81 11% 3%
Content
RATE Bankrate, Inc. 11.05 996 1,155 NM 16.0 12.4 9.3 2.8 413 93 23% -6%
CLGX CoreLogic, Inc. 36.83 3,181 4,703 23.3 14.6 12.0 9.2 2.5 1,869 390 21% 8%
CSGP CoStar Group, Inc. 188.49 6,144 5,958 77.7 38.7 28.9 20.4 7.3 812 207 25% 10%
DNB The Dun & Bradstreet Corporation 121.32 4,463 5,755 46.3 15.8 13.5 11.2 3.4 1,686 425 25% 6%
FDS FactSet Research Systems Inc. 163.43 6,488 6,659 19.4 20.2 16.6 14.2 5.8 1,145 402 35% 30%
TRU TransUnion 30.93 5,659 8,041 62.8 19.6 14.7 11.6 4.9 1,655 540 33% 5%
FORR Forrester Research Inc. 42.95 782 649 56.5 31.7 18.2 14.3 2.0 324 36 11% 4%
IT Gartner, Inc. 101.07 8,349 8,635 44.0 30.4 21.9 16.5 3.6 2,385 395 17% 8%
MORN Morningstar, Inc. 73.56 3,167 2,963 25.0 23.6 11.8 10.9 3.8 788 250 32% 16%
VRSK Verisk Analytics, Inc. 81.17 13,592 15,710 29.5 24.2 15.2 14.7 6.9 2,274 1,033 45% 26%
Median 5,061 5,856 44.0 21.9 14.9 12.9 3.7 1,400 392 25% 8%
Overall Solutions Median 3,181 4,703 32.5 21.4 15.2 11.4 3.4 1,002 275 21% 6%
© 2017 Mercer Capital // www.mercercapital.com // Source: S&P Global Market Intelligence 24
Mercer Capital’s Value Focus: FinTech IndustrySecond Half 2016
@MercerFinTech
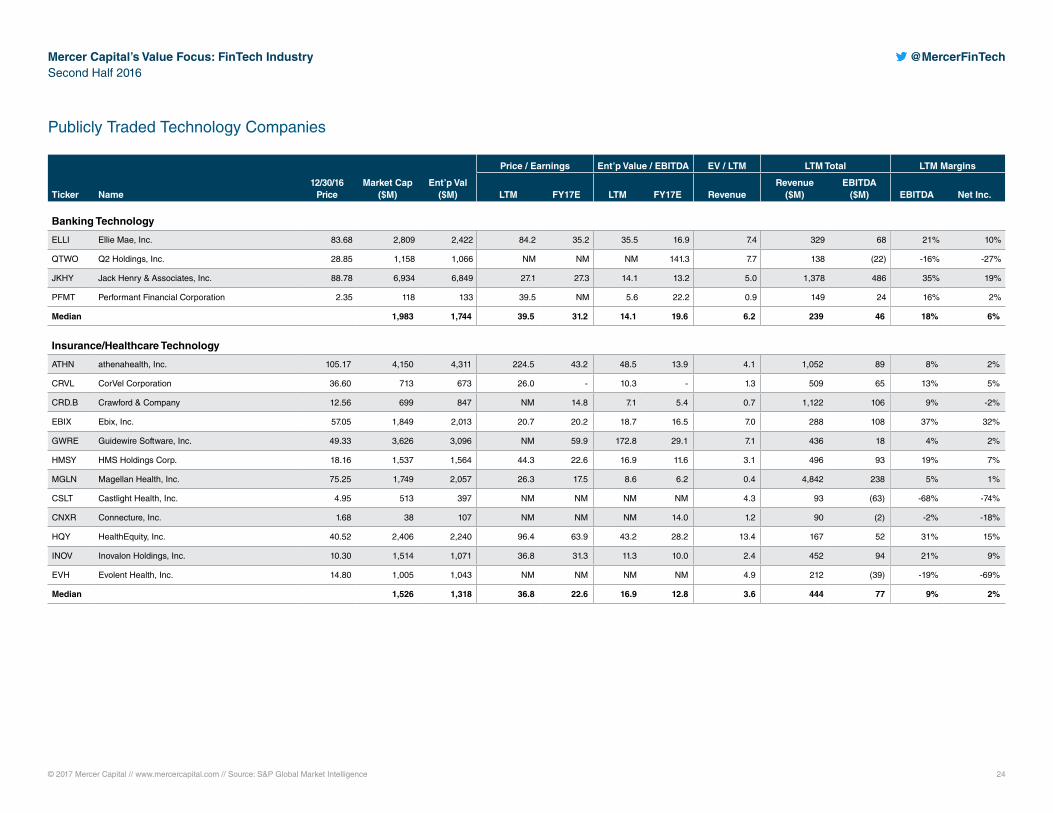
Publicly Traded Technology Companies
Ticker Name12/30/16
PriceMarket Cap
($M) Ent’p Val
($M)
Price / Earnings Ent’p Value / EBITDA EV / LTM LTM Total LTM Margins
LTM FY17E LTM FY17E RevenueRevenue
($M)EBITDA
($M) EBITDA Net Inc.
Banking Technology
ELLI Ellie Mae, Inc. 83.68 2,809 2,422 84.2 35.2 35.5 16.9 7.4 329 68 21% 10%
QTWO Q2 Holdings, Inc. 28.85 1,158 1,066 NM NM NM 141.3 7.7 138 (22) -16% -27%
JKHY Jack Henry & Associates, Inc. 88.78 6,934 6,849 27.1 27.3 14.1 13.2 5.0 1,378 486 35% 19%
PFMT Performant Financial Corporation 2.35 118 133 39.5 NM 5.6 22.2 0.9 149 24 16% 2%
Median 1,983 1,744 39.5 31.2 14.1 19.6 6.2 239 46 18% 6%
Insurance/Healthcare Technology
ATHN athenahealth, Inc. 105.17 4,150 4,311 224.5 43.2 48.5 13.9 4.1 1,052 89 8% 2%
CRVL CorVel Corporation 36.60 713 673 26.0 - 10.3 - 1.3 509 65 13% 5%
CRD.B Crawford & Company 12.56 699 847 NM 14.8 7.1 5.4 0.7 1,122 106 9% -2%
EBIX Ebix, Inc. 57.05 1,849 2,013 20.7 20.2 18.7 16.5 7.0 288 108 37% 32%
GWRE Guidewire Software, Inc. 49.33 3,626 3,096 NM 59.9 172.8 29.1 7.1 436 18 4% 2%
HMSY HMS Holdings Corp. 18.16 1,537 1,564 44.3 22.6 16.9 11.6 3.1 496 93 19% 7%
MGLN Magellan Health, Inc. 75.25 1,749 2,057 26.3 17.5 8.6 6.2 0.4 4,842 238 5% 1%
CSLT Castlight Health, Inc. 4.95 513 397 NM NM NM NM 4.3 93 (63) -68% -74%
CNXR Connecture, Inc. 1.68 38 107 NM NM NM 14.0 1.2 90 (2) -2% -18%
HQY HealthEquity, Inc. 40.52 2,406 2,240 96.4 63.9 43.2 28.2 13.4 167 52 31% 15%
INOV Inovalon Holdings, Inc. 10.30 1,514 1,071 36.8 31.3 11.3 10.0 2.4 452 94 21% 9%
EVH Evolent Health, Inc. 14.80 1,005 1,043 NM NM NM NM 4.9 212 (39) -19% -69%
Median 1,526 1,318 36.8 22.6 16.9 12.8 3.6 444 77 9% 2%
© 2017 Mercer Capital // www.mercercapital.com // Source: S&P Global Market Intelligence 25
Mercer Capital’s Value Focus: FinTech IndustrySecond Half 2016
@MercerFinTech
Publicly Traded Technology Companies
Ticker Name12/30/16
PriceMarket Cap
($M) Ent’p Val
($M)
Price / Earnings Ent’p Value / EBITDA EV / LTM LTM Total LTM Margins
LTM FY17E LTM FY17E RevenueRevenue
($M)EBITDA
($M) EBITDA Net Inc.
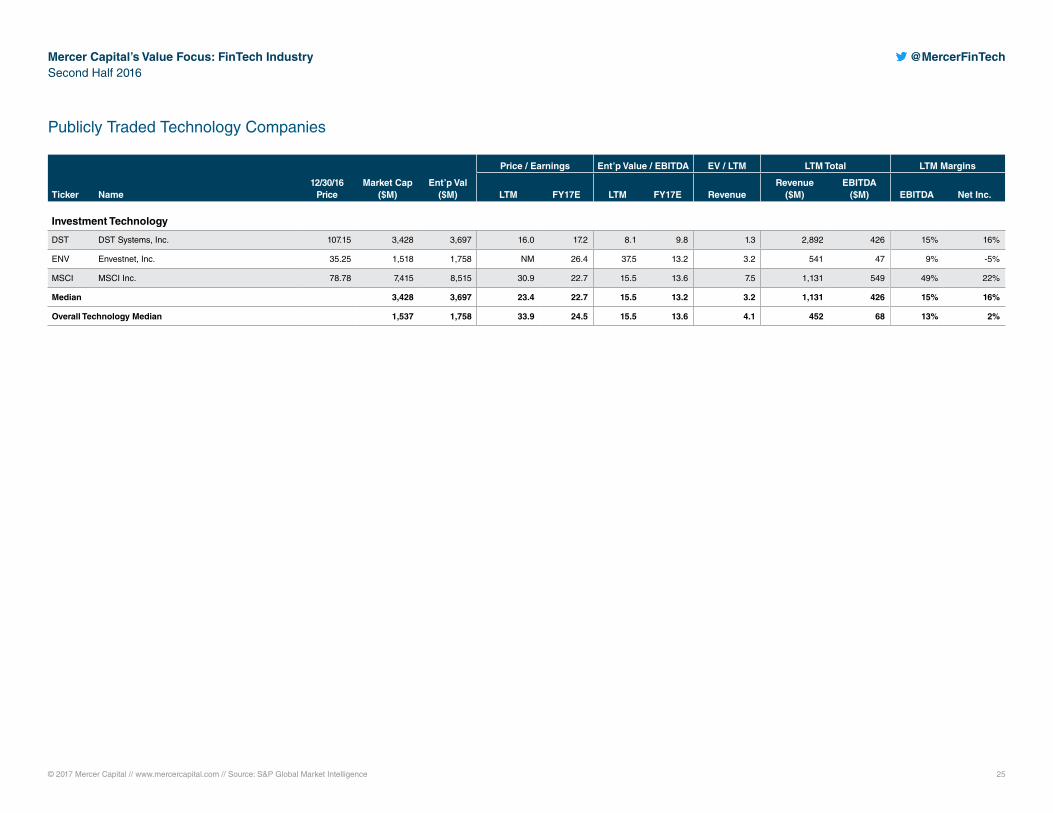
Investment Technology
DST DST Systems, Inc. 107.15 3,428 3,697 16.0 17.2 8.1 9.8 1.3 2,892 426 15% 16%
ENV Envestnet, Inc. 35.25 1,518 1,758 NM 26.4 37.5 13.2 3.2 541 47 9% -5%
MSCI MSCI Inc. 78.78 7,415 8,515 30.9 22.7 15.5 13.6 7.5 1,131 549 49% 22%
Median 3,428 3,697 23.4 22.7 15.5 13.2 3.2 1,131 426 15% 16%
Overall Technology Median 1,537 1,758 33.9 24.5 15.5 13.6 4.1 452 68 13% 2%