mercer capital's value focus: insurance industry | q2 2015
TRANSCRIPT
VALUE FOCUSInsurance Industry
www.mercercapital.com
Sector Overview & Commentary 1Property & Casualty 1Reinsurance 1Sector Overview & Commentary 2Life & Health 2Managed Care 2Brokers 2Claims, Tech & Services 2
Insurance M&A Highlights 3Insurance Underwriters 3Insurance Brokers 3
Conifer Holdings Proposes $55 Million IPO: First IPO Filing of 2015 4
Publicly Traded Insurance Companies 5Property & Casualty 5Reinsurance 8Multiline 8Life & Health 9Managed Care 10Brokers 11Third Party Claims, Tech & Services 11
About Mercer Capital 12
Erickson Partners Merges with Mercer Capital 13
Second Quarter 2015

© 2015 Mercer Capital // www.mercercapital.com 1
Mercer Capital’s Value Focus: Insurance Industry Second Quarter 2015
Sector Overview & CommentaryProperty & Casualty
• P&C stocks rose 1.3% for the quarter and 11.9% over the last twelve
months, led by specialty insurers and carriers emphasizing workers’
compensation products. For reference, the S&P 500 returned 0.3% and
7.4% over the same periods.
• Per MarketScout, aggregate commercial lines renewal pricing remained
flat during the quarter while personal lines rate renewals increased by
1% each month.
• According to SNL Financial, analysts anticipate elevated catastrophe
losses for the quarter compared to the prior year, although the severity
of weather-related events is expected to be lower than in peak years.
• Industrywide capacity continues to put pressure on rate renewals,
while historically low bond yields have depressed investment returns.
Investors rightly or wrongly are optimistic that Fed rate hikes of the
Fed Funds rate will lift rates across the Treasury and credit curves and
thereby create better reinvestment rates for insurers.
Reinsurance• Reinsurance stocks were up 3.6% on the quarter and 13.5% over the
last twelve months, in part due to consolidation speculation.
• Soft pricing trends are expected to continue given the influx of alter-
native capital and absence of a major weather-related event to spur
prices upward.
• In some instances, primary insurers are pushing back against reinsur-
ance rates, causing reinsurers to weaken exclusions or include other
lines at a discounted price in order to maintain their books of business.
Sector Pricing and Valuation Summary
Share Price Δ Price / Earnings Price / Book
LTM Return
on EquitySegment %YoY %2Q15 LTM FY15E FY16E P/B P/TB
Property & Casualty (all) 11.9% 1.3% 12.2x 14.1x 13.4x 1.23x 1.38x 10.4%
P&C - Commercial Lines 6.7% -0.9% 12.1x 12.6x 11.7x 1.07x 1.15x 8.6%
P&C - Personal Lines 12.6% -3.4% 12.0x 13.7x 10.7x 1.63x 1.63x 12.3%
P&C - Specialty 12.3% 3.5% 12.1x 16.2x 15.1x 1.18x 1.40x 10.4%
P&C - Workers' Comp 15.7% 1.8% 14.4x 14.1x 13.3x 1.93x 1.93x 13.1%
Reinsurance 13.5% 3.6% 9.6x 10.9x 9.9x 1.01x 1.06x 11.3%
Multi-line 4.1% -0.6% 14.9x 12.1x 10.7x 0.92x 1.11x 6.8%
Life & Health 1.6% 3.1% 13.1x 11.7x 10.8x 0.88x 0.97x 7.1%
Managed Care 52.5% 6.3% 22.8x 19.3x 17.3x 2.96x 4.48x 11.2%
Source: SNL Financial, Mercer Capital analysis. Median measures shown for segments.
Share Price Δ Enterprise Value / EBITDA EV / Revenue LTM Rev
GrowthSegment %YoY %2Q15 LTM FY15E FY16E LTM FY15E
Insurance Brokers 8.3% 1.1% 12.8x 11.6x 10.1x 2.70x 2.58x 3.8%
Claims, Tech, & Services -16.4% 1.6% 12.7x 10.6x 10.0x 4.39x 4.30x 11.4%
Source: SNL Financial, Mercer Capital analysis. Median measures shown for segments.

© 2015 Mercer Capital // www.mercercapital.com 2
Mercer Capital’s Value Focus: Insurance Industry Second Quarter 2015
Sector Overview & CommentaryLife & Health
• While some individual entities posted substantial returns, the median return of L&H stocks
was 3.1% in the second quarter and 1.6% for the last twelve months.
• Expectations for rising interest rates contributed to the increases, as investment portfolios
have been under pressure for many years. Estimated median ROE for 2016 is 11.0%, com-
pared to 7.1% in the last twelve months.
• Data compiled in the second quarter by SNL Financial shows that life insurance compa-
nies are increasingly ceding portions of their reinsured business to affiliates and captives,
despite increasing regulatory scrutiny.
Managed Care• Managed Care stocks climbed to a total of 6.3% on the quarter, following the Supreme
Court’s ruling in favor of the legality of federal tax credits for healthcare exchanges run by
the federal government under the Affordable Care Act.
• The Supreme Court’s ruling provides a more certain immediate future for the managed care
industry, and it encouraged M&A discussions among major players in the industry, many of
which were already underway prior to the ruling.
• Consolidation is expected to increase future earnings, as greater scale may give managed
care companies more influence in holding down hospital pricing.
Brokers• Broker stocks increased 1.1% on the quarter and 8.3% over the last twelve months.
• Stagnant insurance pricing may continue to pressure brokers’ bottom lines, although
organic revenue growth has remained positive for the large public brokers (+3.4% in 1Q15).
• Speaking at the Airmic risk management conference in June, Grahame Chilton, CEO of
Arthur J. Gallagher, stated that he expects the cyclical swing of rates in the insurance
industry to fall away, with the soft pricing environment becoming the new norm.
• Steve Hearn, Deputy CEO of Willis Group, echoed Chilton’s sentiment and added that the
industry needs to reinvest surplus capital into areas of growth outside of traditional product
classes if it hopes to remain successful.
Claims, Tech & Services• Ancillary service providers, such as TPAs and insurance software/technology firms,
reported mixed performance in the second quarter.
• Patriot National (PN), which provides technology-based outsourcing solutions in the
workers’ compensation marketplace, has increased 14.3% since its IPO in January.
• Stocks of software-as-a-service (SaaS) providers like Guidewire, Ebix, and Patriot
National performed favorably in the second quarter, with increases of 5.6%, 7.3%, and
26%, respectively.

© 2015 Mercer Capital // www.mercercapital.com // Source: SNL Financial 3
Mercer Capital’s Value Focus: Insurance Industry Second Quarter 2015
Insurance M&A Highlights
Insurance Underwriters
23 deals were announced in 2Q15, up from 15 in 2Q14. The largest deals
announced in 2Q15 include:
• Tokio Marine’s acquisition of HCC Insurance Holdings, a global spe-
cialty insurer with offices in the U.S., U.K., Spain, and Ireland.
○ $7.5 billion deal value represents 1.90x book value and 16.6x
LTM earnings. Announced price implied a 38% premium to
HCC’s stock price one day prior to announcement.
• Fosun International’s acquisition of the remaining 80% interest Iron-
shore Inc. it did not already own.
○ Deal value of $2.1 billion represents 1.43x reported book value
at 12/31/14. Ironshore is a global specialty commercial prop-
erty and casualty insurer that transacts business with more
than half of the Forbes Global 500.
Insurance Brokers
96 broker transactions were announced in 2Q15, up from 67 a year ago;
201 transactions YTD reflects a 38% increase over 2014. The largest deals
announced in 2Q15 include:
• Confie Serguros’ acquisition of the managing general agency busi-
ness of Affirmative Insurance Holdings.
○ Total announced deal value of $85 million, consisting of $60M in
upfront cash, $15M in deferred payments, and $10M in contingent
payments. Affirmative Insurance specializes in non-standard
automobile insurance. Deal multiples were not disclosed.
• National General Holding’s acquisition of Saddle Brook, N.J.-based
Assigned Risk Solutions.
○ Announced deal value of $47 million in cash and potential earn-out
payments. Additional deal terms were not disclosed. Assigned
Risk Solutions is a managing general agency that services
assigned risk, personal auto and commercial lines of business.
M&A Activity Recap: Insurance Brokers
Q1! Q2! Q3! Q4! YTD at 6/30!2012! 20 ! 26 ! 27 ! 20 ! 46 !2013! 24 ! 17 ! 25 ! 14 ! 41 !2014! 18 ! 15 ! 11 ! 23 ! 33 !2015! 12 ! 23 ! 0 ! 0 ! 35 !
0 !
20 !
40 !
60 !
Num
ber o
f Tra
nsac
tions!
M&A Activity Recap: Insurance Underwriters
Q1! Q2! Q3! Q4! YTD at 6/30!2012! 64 ! 75 ! 61 ! 146 ! 139 !2013! 41 ! 42 ! 56 ! 76 ! 83 !2014! 79 ! 67 ! 82 ! 84 ! 146 !2015! 105 ! 96 ! 0 ! 0 ! 201 !
0 !
50 !
100 !
150 !
200 !
250 !N
umbe
r of T
rans
actio
ns!
© 2015 Mercer Capital // www.mercercapital.com 4
Mercer Capital’s Value Focus: Insurance Industry Second Quarter 2015
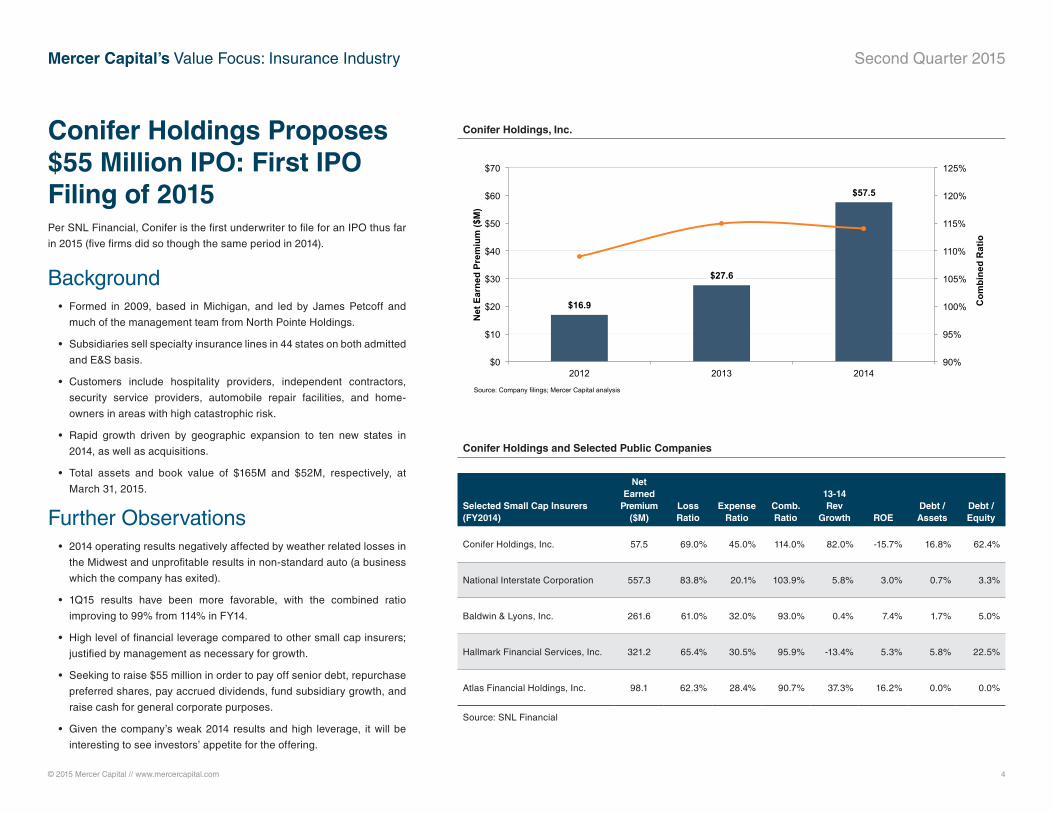
Conifer Holdings Proposes $55 Million IPO: First IPO Filing of 2015Per SNL Financial, Conifer is the first underwriter to file for an IPO thus far
in 2015 (five firms did so though the same period in 2014).
Background• Formed in 2009, based in Michigan, and led by James Petcoff and
much of the management team from North Pointe Holdings.
• Subsidiaries sell specialty insurance lines in 44 states on both admitted
and E&S basis.
• Customers include hospitality providers, independent contractors,
security service providers, automobile repair facilities, and home-
owners in areas with high catastrophic risk.
• Rapid growth driven by geographic expansion to ten new states in
2014, as well as acquisitions.
• Total assets and book value of $165M and $52M, respectively, at
March 31, 2015.
Further Observations• 2014 operating results negatively affected by weather related losses in
the Midwest and unprofitable results in non-standard auto (a business
which the company has exited).
• 1Q15 results have been more favorable, with the combined ratio
improving to 99% from 114% in FY14.
• High level of financial leverage compared to other small cap insurers;
justified by management as necessary for growth.
• Seeking to raise $55 million in order to pay off senior debt, repurchase
preferred shares, pay accrued dividends, fund subsidiary growth, and
raise cash for general corporate purposes.
• Given the company’s weak 2014 results and high leverage, it will be
interesting to see investors’ appetite for the offering.
Conifer Holdings, Inc.
Conifer Holdings and Selected Public Companies
$16.9
$27.6
$57.5
90%
95%
100%
105%
110%
115%
120%
125%
$0
$10
$20
$30
$40
$50
$60
$70
2012 2013 2014
Com
bine
d R
atio
Net
Ear
ned
Prem
ium
($M
)
Source: Company filings; Mercer Capital analysis
Selected Small Cap Insurers (FY2014)
Net Earned
Premium ($M)
Loss Ratio
Expense Ratio
Comb. Ratio
13-14 Rev
Growth ROEDebt / Assets
Debt / Equity
Conifer Holdings, Inc. 57.5 69.0% 45.0% 114.0% 82.0% -15.7% 16.8% 62.4%
National Interstate Corporation 557.3 83.8% 20.1% 103.9% 5.8% 3.0% 0.7% 3.3%
Baldwin & Lyons, Inc. 261.6 61.0% 32.0% 93.0% 0.4% 7.4% 1.7% 5.0%
Hallmark Financial Services, Inc. 321.2 65.4% 30.5% 95.9% -13.4% 5.3% 5.8% 22.5%
Atlas Financial Holdings, Inc. 98.1 62.3% 28.4% 90.7% 37.3% 16.2% 0.0% 0.0%
Source: SNL Financial

© 2015 Mercer Capital // www.mercercapital.com // Source: SNL FInancial 5
Mercer Capital’s Value Focus: Insurance Industry Second Quarter 2015
Publicly Traded Companies
Property & Casualty
6/30/15Price
Market Cap ($M)
Share Price %YOY
Share Price %Qtr
Price / Earnings Price / Book
Div Yield
Underwriting Ratios
Invest Yield
LTM ROETicker Name LTM FY15E FY16E P/B P/TB Loss Expense Comb.
Commercial Lines
AIG American International Group, Inc. 61.82 83,276 13.3% 12.8% 10.5x 12.6x 11.1x 0.77x 0.81x 0.91% 67.3% 34.8% 102.0% 4.91% 7.8%
ACE ACE Limited 101.68 33,258 -1.9% -8.8% 12.2x 11.0x 10.7x 1.12x 1.38x 2.33% 58.6% 29.4% 88.0% 3.15% 9.4%
TRV Travelers Companies, Inc. 96.66 30,806 2.8% -10.6% 9.4x 10.0x 10.1x 1.24x 1.47x 2.03% 57.9% 31.8% 89.8% 3.69% 13.8%
CB Chubb Corporation 95.14 21,859 3.2% -5.9% 11.3x 12.6x 12.2x 1.35x 1.39x 2.26% 56.9% 31.8% 88.7% 3.66% 12.4%
CNA CNA Financial Corporation 38.21 10,326 -5.5% -7.8% 11.4x 11.3x 10.7x 0.83x 0.84x 2.41% 63.6% 33.4% 97.0% 4.58% 7.1%
CINF Cincinnati Financial Corporation 50.18 8,245 4.5% -5.8% 14.7x 19.9x 19.2x 1.25x 1.25x 3.45% 64.3% 30.7% 95.0% 4.83% 8.8%
AFG American Financial Group, Inc. 65.04 5,716 9.2% 1.4% 16.1x 12.0x 11.5x 1.16x 1.22x 1.56% 64.9% 29.9% 94.7% 4.36% 7.5%
ORI Old Republic International Corporation 15.63 4,082 -5.5% 4.6% 13.8x 13.9x 14.4x 1.02x 1.08x 4.95% 51.9% 47.1% 98.9% 4.05% 8.1%
THG Hanover Insurance Group, Inc. 74.03 3,257 17.2% 2.0% 11.8x 12.9x 12.0x 1.12x 1.20x 2.26% 62.0% 34.6% 96.6% 3.86% 10.1%
SIGI Selective Insurance Group, Inc. 28.05 1,597 13.5% -3.4% 9.8x 11.9x 11.3x 1.21x 1.22x 1.93% 60.0% 34.2% 94.2% 3.52% 13.0%
EIG Employers Holdings, Inc. 22.78 726 7.6% -15.6% 7.1x 15.1x 12.9x 1.02x 1.09x 0.89% 64.6% 31.0% 95.6% 3.38% 15.8%
UFCS United Fire Group, Inc. 32.76 819 11.7% 3.1% 11.9x 15.2x 15.5x 0.97x 1.00x 2.52% 64.9% 30.5% 95.4% 3.35% 8.5%
EMCI EMC Insurance Group Inc. 25.07 515 22.2% 11.3% 12.9x 11.9x 14.2x 0.98x 0.98x 2.96% 68.1% 31.1% 99.2% 3.68% 8.0%
DGICA Donegal Group Inc. 15.23 413 -0.5% -3.1% 19.0x 12.2x 9.8x 0.97x 0.99x 3.35% 67.9% 32.3% 100.3% 2.85% 5.3%
AFH Atlas Financial Holdings, Inc. 19.83 238 30.8% 12.2% 13.6x 15.7x 10.6x 2.14x 2.26x 0.00% 60.3% 28.0% 88.3% 1.89% 17.7%
HALL Hallmark Financial Services, Inc. 11.38 219 5.9% 7.4% 15.4x 14.2x 14.2x 0.84x 1.09x 0.00% 65.6% 30.0% 95.6% 1.93% 5.7%
Median 3,670 6.7% -0.9% 12.1x 12.6x 11.7x 1.07x 1.15x 2.26% 64.0% 31.4% 95.5% 3.67% 8.6%

© 2015 Mercer Capital // www.mercercapital.com // Source: SNL FInancial 6
Mercer Capital’s Value Focus: Insurance Industry Second Quarter 2015
Publicly Traded Companies
Property & Casualty
6/30/15Price
Market Cap ($M)
Share Price %YOY
Share Price %Qtr
Price / Earnings Price / Book
Div Yield
Underwriting Ratios
Invest Yield
LTM ROETicker Name LTM FY15E FY16E P/B P/TB Loss Expense Comb.
Personal Lines
ALL Allstate Corporation 64.87 26,537 10.5% -8.9% 9.9x 12.1x 10.7x 1.30x 1.39x 1.69% 67.2% 26.5% 93.7% 5.02% 13.1%
PGR Progressive Corporation 27.83 16,345 9.7% 2.3% 13.1x 14.4x 14.0x 2.27x 2.27x 2.52% 72.2% 20.0% 92.1% 2.78% 18.3%
MCY Mercury General Corporation 55.65 3,069 18.3% -3.6% 23.3x 23.2x 20.6x 1.64x 1.71x 4.28% 71.4% 27.9% 99.3% 4.14% 6.9%
NGHC National General Holdings Corporation 20.83 1,948 19.7% 11.4% 17.4x 12.0x 9.9x 1.85x 2.71x 0.43% 64.7% 29.1% 93.8% 3.01% 11.5%
HMN Horace Mann Educators Corporation 36.38 1,496 16.3% 6.4% 14.0x 14.8x 13.5x 1.06x 1.10x 2.92% 68.4% 26.9% 95.3% 4.74% 8.5%
STFC State Auto Financial Corporation 23.95 982 2.2% -1.4% 9.5x 13.7x 13.0x 1.09x 1.09x 1.65% 70.5% 33.4% 103.9% 3.57% 12.3%
IPCC Infinity Property and Casualty Corp. 75.84 869 12.8% -7.6% 15.1x 17.7x 15.9x 1.23x 1.37x 2.10% 75.4% 19.5% 95.0% 2.51% 8.5%
UVE Universal Insurance Holdings, Inc. 24.20 860 86.6% -5.4% 10.5x 10.2x 9.1x 3.56x 3.59x 1.88% 36.4% NA NA 1.40% 42.3%
SAFT Safety Insurance Group, Inc. 57.71 871 12.3% -3.4% 76.9x 81.8x 14.6x 1.31x 1.31x 4.69% 78.0% 30.1% 108.1% 3.44% 1.7%
HRTG Heritage Insurance Holdings, Inc. 22.99 685 51.2% 4.5% 9.6x 7.6x 7.1x 2.38x 2.38x 0.00% 35.9% 29.3% 65.2% 1.31% 30.5%
UIHC United Insurance Holdings Corp. 15.54 334 -10.0% -30.9% 10.9x 13.7x 7.8x 1.53x 1.57x 0.89% 51.1% 37.9% 88.9% 1.65% 15.4%
SNC State National Companies, Inc. 10.83 482 NA 8.8% NA 11.2x 9.0x 1.91x 1.96x 0.40% NA NA NA 2.00% 10.4%
FNHC Federated National Holding Company 24.20 332 -5.1% -20.9% 8.2x 11.1x 9.0x 1.63x 1.63x 0.52% 49.0% NA NA 2.97% 22.9%
Median 871 12.6% -3.4% 12.0x 13.7x 10.7x 1.63x 1.63x 1.69% 67.8% 28.5% 94.4% 2.97% 12.3%

© 2015 Mercer Capital // www.mercercapital.com // Source: SNL FInancial 7
Mercer Capital’s Value Focus: Insurance Industry Second Quarter 2015
Publicly Traded Companies
Property & Casualty
6/30/15Price
Market Cap ($M)
Share Price %YOY
Share Price %Qtr
Price / Earnings Price / Book
Div Yield
Underwriting Ratios
Invest Yield
LTM ROETicker Name LTM FY15E FY16E P/B P/TB Loss Expense Comb.
Specialty Lines
MKL Markel Corporation 800.68 11,166 22.1% 4.1% 27.1x 24.7x 31.4x 1.42x 1.82x 0.00% 54.9% 37.7% 92.6% 2.20% 13.1%
ACGL Arch Capital Group Ltd. 66.96 8,354 16.6% 8.7% 9.7x 16.2x 16.2x 1.40x 1.43x 0.00% 54.2% 33.9% 88.1% 2.87% 18.3%
WRB W. R. Berkley Corporation 51.93 6,488 12.1% 2.8% 11.6x 14.9x 13.8x 1.42x 1.47x 0.87% 61.0% 32.8% 93.8% 4.75% 6.9%
HCC HCC Insurance Holdings, Inc. 76.84 7,366 57.0% 35.6% 16.3x 19.0x 18.5x 1.87x 2.47x 2.08% 57.6% 25.7% 83.3% 3.79% 11.5%
WTM White Mountains Insurance Group, Ltd. 654.94 3,924 7.6% -4.3% 13.2x 42.2x 35.5x 0.98x 1.08x 0.15% 58.5% 34.5% 93.0% 5.46% 8.5%
AWHAllied World Assurance Company Hold-
ings, AG43.22 4,125 13.7% 7.0% 9.8x 16.2x 15.5x 1.08x 1.18x 2.23% 56.2% 31.0% 87.2% 2.90% 12.3%
ENH Endurance Specialty Holdings Ltd. 65.70 2,964 27.4% 7.5% 9.2x 10.4x 10.1x 1.04x 1.10x 2.24% 52.0% 34.2% 86.2% 2.38% 8.5%
ESGR Enstar Group Limited 154.95 2,983 2.8% 9.2% 12.9x 14.1x 12.4x 1.28x 1.40x 0.00% NA NA NA 2.58% 42.3%
RLI RLI Corp. 51.39 2,220 12.3% -1.9% 16.4x 21.3x 22.8x 2.57x 2.81x 1.37% 44.1% 41.3% 85.4% 5.37% 1.7%
OB OneBeacon Insurance Group, Ltd. 14.51 1,382 -6.6% -4.6% 131.9x 19.8x 14.5x 1.32x NA 5.52% 70.0% 33.1% 103.1% 3.02% 30.5%
AGII Argo Group International Holdings, Ltd. 55.70 1,557 19.9% 11.1% 8.0x 15.6x 14.7x 0.94x 1.09x 1.38% 55.6% 40.1% 95.7% 4.37% 15.4%
NAVG Navigators Group, Inc. 77.56 1,116 15.7% -0.4% 12.1x 14.2x 13.9x 1.06x 1.07x 0.00% 57.1% 35.5% 92.6% 2.95% 10.4%
GBLI Global Indemnity plc 28.08 722 8.0% 1.2% 11.7x 20.0x 20.1x 0.78x 0.82x 0.00% 51.3% 40.0% 91.3% 3.87% 22.9%
JRVR James River Group Holdings, Ltd. 25.87 738 NA 9.9% NA 13.0x 11.8x 1.06x 1.55x 0.68% 60.3% 33.3% 93.6% NA 12.3%
NATL National Interstate Corporation 27.32 542 -2.5% -2.7% 53.6x 20.2x 17.1x 1.46x 1.50x 1.85% 84.3% 20.2% 104.4% 3.08% 17.7%
BWINB Baldwin & Lyons, Inc. 23.02 346 -11.3% -1.9% 11.6x 12.8x 13.5x 0.86x 0.87x 4.26% 61.3% 31.9% 93.2% 3.22% 5.7%
Median 2,592 12.3% 3.5% 12.1x 16.2x 15.1x 1.18x 1.40x 1.12% 57.1% 33.9% 92.6% 3.08% 8.6%
Workers’ Compensation Focus
AFSI AmTrust Financial Services, Inc. 65.51 5,395 56.7% 15.0% 10.9x 11.9x 10.9x 2.72x 4.43x 1.75% 65.7% 24.7% 90.4% 3.36% 26.0%
PRA ProAssurance Corporation 46.21 2,562 4.1% 0.7% 14.4x 17.3x 18.1x 1.20x 1.41x 2.70% 54.1% 30.0% 84.2% 3.36% 8.3%
AMSF AMERISAFE, Inc. 47.06 893 15.7% 1.8% 15.3x 14.1x 13.3x 1.93x 1.93x 1.30% 63.9% 22.1% 86.1% 2.57% 13.1%
Median 2,562 15.7% 1.8% 14.4x 14.1x 13.3x 1.93x 1.93x 1.75% 63.9% 24.7% 86.1% 3.36% 13.1%
Median All P&C Sub-Groups 1,772 11.9% 1.3% 12.2x 14.1x 13.4x 1.23x 1.38x 1.80% 61.2% 31.4% 93.7% 3.36% 10.4%

© 2015 Mercer Capital // www.mercercapital.com // Source: SNL FInancial 8
Mercer Capital’s Value Focus: Insurance Industry Second Quarter 2015
Publicly Traded Companies
Reinsurance
6/30/15Price
Market Cap ($M)
Share Price %YOY
Share Price %Qtr
Price / Earnings Price / Book
Div Yield
Underwriting Ratios
Invest Yield
LTM ROETicker Name LTM FY15E FY16E P/B P/TB Loss Expense Comb.
XL XL Group plc 37.20 9,549 13.7% 1.1% NM 12.2x 10.1x 0.93x 0.97x 1.74% 56.8% 31.2% 88.0% 3.22% -0.3%
RE Everest Re Group, Ltd. 182.01 8,083 13.4% 4.6% 6.8x 8.7x 9.4x 1.05x 1.06x 1.95% 56.4% 26.8% 83.2% 3.27% 16.6%
PRE PartnerRe Ltd. 128.50 6,125 17.7% 12.4% 6.9x 12.7x 13.6x 0.97x 1.07x 2.37% 55.6% 30.4% 86.0% 4.68% 14.2%
AXS AXIS Capital Holdings Limited 53.37 5,349 20.5% 3.5% 7.0x 12.3x 11.7x 1.00x 1.02x 2.17% 56.4% 35.7% 92.2% 2.81% 14.1%
RNR RenaissanceRe Holdings Ltd. 101.51 4,672 -5.1% 1.8% 7.7x 10.7x 10.8x 1.07x 1.14x 1.17% 20.1% 32.5% 52.6% 3.01% 14.0%
VR Validus Holdings, Ltd. 43.99 3,679 15.0% 4.5% 8.2x 9.1x 9.4x 1.00x 1.09x 2.90% 40.6% 34.7% 75.3% 1.16% 13.4%
AHL Aspen Insurance Holdings Limited 47.90 2,959 5.5% 1.4% 9.6x 11.1x 11.0x 1.02x 1.03x 1.69% 54.5% 37.4% 92.0% 2.91% 10.5%
MRH Montpelier Re Holdings Ltd. 39.50 1,730 23.6% 2.8% 10.5x 14.1x 13.6x 1.12x 1.12x 1.89% 32.9% 37.3% 70.2% 0.69% 11.2%
TPRE Third Point Reinsurance Ltd. 14.75 1,551 -3.3% 4.2% 26.3x 7.2x 5.6x 1.03x 1.03x 0.00% 63.9% 37.8% 101.7% 4.63% 4.2%
GLRE Greenlight Capital Re, Ltd. 29.17 1,095 -11.4% -8.3% 12.0x 18.8x 6.3x 0.96x 0.96x 0.00% 68.4% 35.2% 103.6% 3.80% 8.4%
MHLD Maiden Holdings, Ltd. 15.78 1,158 30.5% 6.4% 10.7x 9.4x 8.0x 1.20x 1.32x 3.24% 65.6% 32.5% 98.1% 3.16% 11.3%
BCRH Blue Capital Reinsurance Holdings Ltd. 17.97 157 -8.8% 3.8% 11.0x 9.8x 9.7x 0.89x NA 6.93% 39.3% 28.4% 67.7% 0.00% 8.1%
Median 3,319 13.5% 3.6% 9.6x 10.9x 9.9x 1.01x 1.06x 1.92% 56.0% 33.6% 87.0% 3.08% 11.3%
Multiline
6/30/15Price
Market Cap ($M)
Share Price %YOY
Share Price %Qtr
Price / Earnings Price / Book
Div Yield
Underwriting Ratios
Invest Yield
LTM ROETicker Name LTM FY15E FY16E P/B P/TB Loss Expense Comb.
AMP Ameriprise Financial, Inc. 124.93 22,712 4.1% -4.5% 14.9x 13.2x 11.4x 2.77x 3.66x 1.77% 93.1% 15.3% 108.4% 3.66% 19.5%
HIG Hartford Financial Services Group, Inc. 41.57 17,517 16.1% -0.6% 23.1x 10.9x 10.0x 0.92x 0.94x 1.72% 67.6% 30.5% 98.0% 4.01% 4.0%
AIZ Assurant, Inc. 67.00 4,574 2.2% 9.1% 12.7x 10.8x 9.9x 0.89x 1.15x 1.76% NA NA NA 4.35% 7.3%
ANAT American National Insurance Company 102.32 2,752 -10.4% 4.0% 9.3x NA NA 0.61x 0.61x 3.13% 68.6% 30.6% 99.2% 4.89% 6.8%
KMPR Kemper Corporation 38.55 1,998 4.6% -1.1% 21.9x 17.2x 14.6x 0.95x 1.11x 2.46% 70.6% 28.6% 99.2% 4.95% 4.4%
Median 4,574 4.1% -0.6% 14.9x 12.1x 10.7x 0.92x 1.11x 1.77% 69.6% 29.5% 99.2% 4.35% 6.8%

© 2015 Mercer Capital // www.mercercapital.com // Source: SNL FInancial 9
Mercer Capital’s Value Focus: Insurance Industry Second Quarter 2015
Publicly Traded Companies
Life & Health
6/30/15Price
Market Cap ($M)
Share Price %YOY
Share Price %Qtr
Price / Earnings Price / Book
Div.YieldInvest. Yield
ROE
Ticker Name LTM FY15E FY16E P/B P/TB LTM FY15E FY16E
MET MetLife, Inc. 55.99 62,392 0.8% 10.8% 9.1x 9.5x 9.0x 0.87x 1.01x 2.77% 4.64% 10.1% 11.1% 10.9%
PRU Prudential Financial, Inc. 87.52 39,692 -1.4% 9.0% 18.8x 8.6x 8.4x 0.88x 0.90x 2.89% 4.39% 5.2% 15.4% 13.9%
AFL Aflac Incorporated 62.20 26,981 -0.1% -2.8% 9.7x 10.4x 9.8x 1.45x NA 2.44% 3.18% 16.3% 16.5% 16.2%
PFG Principal Financial Group, Inc. 51.29 15,100 1.6% -0.2% 12.5x 11.7x 10.9x 1.53x 1.99x 2.80% 4.60% 12.3% 13.3% 13.2%
LNC Lincoln National Corporation 59.22 14,978 15.1% 3.1% 10.6x 9.8x 8.9x 0.92x 1.07x 1.39% 4.61% 9.6% 11.5% 11.6%
VOYA Voya Financial, Inc. 46.47 10,644 27.9% 7.8% 5.2x 13.8x 12.8x 0.66x 0.67x 0.09% 4.49% 14.7% 6.0% 6.2%
UNM Unum Group 35.75 8,919 2.8% 6.0% 23.4x 9.8x 9.1x 1.03x 1.05x 1.96% 4.77% 4.4% 10.8% 10.8%
TMK Torchmark Corporation 58.22 7,365 6.6% 6.0% 14.3x 13.6x 12.4x 1.51x 1.66x 0.98% 5.03% 11.6% 13.2% 13.4%
RGA Reinsurance Group of America, Inc. 94.87 6,303 20.2% 1.8% 9.8x 11.3x 10.2x 0.88x 0.88x 1.42% 4.99% 9.9% 10.7% 11.0%
GNW Genworth Financial, Inc. 7.57 3,765 -56.5% 3.6% NM 7.1x 6.6x 0.25x 0.25x 0.00% 4.17% -8.3% 4.5% 4.9%
CNO CNO Financial Group, Inc. 18.35 3,645 3.1% 6.6% 11.8x 13.3x 11.4x 0.77x 0.77x 1.39% 5.49% 7.0% 7.4% 8.2%
SFG StanCorp Financial Group, Inc. 75.61 3,190 18.1% 10.2% 14.9x 13.3x 12.8x 1.41x 1.45x 1.90% 4.39% 9.8% 10.8% 11.1%
SYA Symetra Financial Corporation 24.17 2,806 6.3% 3.0% 13.1x 13.8x 12.2x 0.79x 0.84x 1.88% 4.41% 6.3% 7.7% 8.0%
PRI Primerica, Inc. 45.69 2,356 -4.5% -10.2% 13.8x 12.5x 11.0x 1.90x 2.00x 1.26% 4.00% 14.1% 15.9% 16.2%
AELAmerican Equity Investment
Life Holding Company26.98 2,069 9.7% -7.4% 15.2x 11.0x 10.0x 0.89x 0.89x 0.69% 4.40% 7.1% 11.2% 11.2%
FFG FBL Financial Group, Inc. 57.72 1,431 25.5% -6.9% 13.1x 14.3x 13.3x 1.15x 1.16x 2.58% 5.13% 9.1% 10.3% 10.7%
FGL Fidelity & Guaranty Life 23.63 1,388 -1.3% 11.5% 14.2x 12.6x 10.8x 0.81x NA 1.23% 5.08% 5.9% 6.7% 7.5%
NWLI National Western Life Insurance Company 239.49 871 -4.0% -5.8% 7.9x NA NA 0.55x 0.55x 0.14% 5.04% 7.0% NA NA
KCLI Kansas City Life Insurance Company 45.71 493 0.5% -0.5% 16.2x NA NA 0.65x 0.65x 2.35% 4.59% 4.1% NA NA
CIA Citizens, Inc. 7.46 374 0.8% 21.1% NM NA NA 1.43x 1.53x 0.00% 3.89% -2.8% NA NA
IHC Independence Holding Company 13.19 229 -6.7% -2.9% 12.9x NA NA 0.77x 0.97x 0.52% 4.44% 6.2% NA NA
Median 3,645 1.6% 3.1% 13.1x 11.7x 10.8x 0.88x 0.97x 1.39% 4.59% 7.1% 10.8% 11.0%

© 2015 Mercer Capital // www.mercercapital.com // Source: SNL FInancial 10
Mercer Capital’s Value Focus: Insurance Industry Second Quarter 2015
Publicly Traded Companies
Managed Care
6/30/15Price
Market Cap ($M)
Share Price %YOY
Share Price %Qtr
Price / Earnings Price / Book
Div.YieldInvest. Yield
ROE
Ticker Name LTM FY15E FY16E P/B P/TB LTM FY15E FY16E
UNH UnitedHealth Group Incorporated 122.00 116,144 49.2% 3.1% 20.1x 19.3x 16.7x 3.64x NA 1.27% 2.59% 18.2% 17.1% 17.9%
ANTM Anthem, Inc. 164.14 43,482 52.5% 6.3% 17.0x 16.4x 14.9x 1.79x NA 1.62% 3.47% 11.2% 10.3% 10.7%
AET Aetna Inc. 127.46 44,509 57.2% 19.6% 21.1x 17.2x 15.6x 2.96x NA 0.94% 3.81% 14.7% 16.2% 17.1%
CI Cigna Corporation 162.00 41,728 76.1% 25.2% 20.4x 19.1x 17.3x 3.81x 8.49x 0.03% 5.22% 19.3% 19.2% 20.1%
HUM Humana Inc. 191.28 28,650 49.8% 7.4% 24.5x 24.1x 20.4x 2.85x 4.48x 0.63% 3.25% 12.2% 11.3% 13.4%
CNC Centene Corporation 80.40 9,559 112.7% 13.7% 32.4x 28.8x 24.6x 5.20x NA 0.00% 1.12% 18.6% 14.5% 15.3%
HNT Health Net, Inc. 64.12 4,940 54.4% 6.0% 35.2x 19.2x 15.7x 2.98x 4.54x 0.00% 1.77% 8.4% NA NA
WCG WellCare Health Plans, Inc. 84.83 3,736 13.6% -7.2% 101.0x 25.3x 17.3x 2.31x 2.98x 0.00% 1.97% 2.3% NA NA
MOH Molina Healthcare, Inc. 70.30 3,509 57.5% 4.5% 40.4x 27.2x 20.0x 3.37x 5.12x 0.00% 0.40% 8.9% 11.3% 13.9%
UAM Universal American Corp. 10.12 850 21.5% -5.2% NM 44.4x 35.9x 1.37x 1.55x 0.00% 1.72% -3.5% NA NA
GTS Triple-S Management Corporation 25.66 681 43.1% 29.1% 9.4x 18.3x 16.6x 0.79x 0.81x 0.00% 4.95% 8.6% NA NA
Median 9,559 52.5% 6.3% 22.8x 19.3x 17.3x 2.96x 4.48x 0.00% 2.59% 11.2% 14.5% 15.3%

© 2015 Mercer Capital // www.mercercapital.com // Source: SNL FInancial 11
Mercer Capital’s Value Focus: Insurance Industry Second Quarter 2015
Publicly Traded Companies
Brokers
6/30/15Price
Market Cap ($M)
Share Price %YOY
Share Price %Qtr
EV ($M)
EV / EBITDA EV / Revenue
Div.Yield
LTM EBITDA Margin
LTM Rev
Growth
Organic Rev Growth
Ticker Name LTM FY15E FY16E LTM FY15E 15Q1 14Q4
MMC Marsh & McLennan Companies, Inc. 56.70 30,528 9.4% 1.1% 33,313 12.5x 11.6x 10.7x 2.6x 2.5x 2.00% 20.6% 3.8% 3.0% 4.0%
AON Aon plc 99.68 28,083 10.6% 3.7% 33,381 12.8x 12.6x 11.9x 2.8x 2.7x 1.04% 21.9% 0.7% 4.0% 6.0%
WSHWillis Group Holdings
Public Limited Company46.90 8,420 8.3% -2.7% 10,222 13.5x 11.8x 10.1x 2.7x 2.6x 2.51% 20.0% 2.0% 3.4% 3.6%
AJG Arthur J. Gallagher & Co. 47.30 7,883 1.5% 1.2% 9,942 15.7x 10.8x 9.5x 2.7x 2.5x 3.17% 16.9% 30.5% 5.7% 5.6%
BRO Brown & Brown, Inc. 32.86 4,627 7.0% -0.8% 5,460 11.2x 10.2x 9.5x 3.4x 3.3x 1.33% 30.3% 16.1% 2.9% 4.4%
Median 8,420 8.3% 1.1% 10,222 12.8x 11.6x 10.1x 2.7x 2.6x 2.00% 20.6% 3.8% 3.4% 4.4%
Third Party Claims, Tech & Services
To6/30/15Price
Market Cap ($M)
Share Price %YOY
Share Price %Qtr
Total EV ($M)
EV / EBITDA EV / Revenue
Div.Yield
LTM EBITDA Margin
LTM Rev
GrowthLTM Rev.
($M)Ticker Name LTM FY15E FY16E LTM FY15E
GWRE Guidewire Software, Inc. 52.93 3,714 30.2% 5.6% 3,588 124.9x 53.1x 45.8x 9.7x 9.5x 0.00% 7.8% 17.2% 369
SLH Solera Holdings, Inc. 44.56 2,989 -33.6% -13.7% 4,877 12.7x 10.6x 10.0x 4.4x 4.3x 1.51% 34.6% 18.5% 1,112
EBIX Ebix, Inc. 32.61 1,150 127.9% 7.3% 1,260 13.8x 13.4x 12.2x 5.6x 4.9x 0.99% 40.4% 11.4% 227
CRVL CorVel Corporation 32.02 648 -29.1% -6.9% 606 9.5x NA NA 1.2x NA 0.00% 12.9% 2.9% 493
CRD.B Crawford & Company 8.43 466 -16.4% -2.4% 670 6.7x 6.6x 5.3x 0.5x 0.5x 2.31% 8.1% -0.1% 1,234
PN Patriot National, Inc. 16.00 422 NA 26.0% 460 NA 8.8x 6.3x NA 2.4x 0.00% NA NA NA
Median 899 -16.4% 1.6% 965 12.7x 10.6x 10.0x 4.4x 4.3x 0.49% 12.9% 11.4% 493

Mercer CapitalInsurance Industry Services
Contact Us
Copyright © 2015 Mercer Capital Management, Inc. All rights reserved. It is illegal under Federal law to reproduce this publication or any portion of its contents without the publisher’s permission. Media quotations with source attribution are encouraged.
Reporters requesting additional information or editorial comment should contact Barbara Walters Price at 901.685.2120. Mercer Capital’s Industry Focus is published quarterly and does not constitute legal or financial consulting advice. It is offered as an
information service to our clients and friends. Those interested in specific guidance for legal or accounting matters should seek competent professional advice. Inquiries to discuss specific valuation matters are welcomed. To add your name to our mailing list
to receive this complimentary publication, visit our web site at www.mercercapital.com.
Mercer Capital provides the insurance industry with corporate valuation, financial reporting, transaction advisory, and related services.
Industry Segments
Mercer Capital serves the following industry segments:
• Agencies
• Independent insurance brokers and agents
• Bank-owned agencies
• Retail, wholesale, and MGAs
• Ancillary
• Third-party administrators
• Claims adjusters and other service providers
Mercer Capital Experience
• Nationwide client base
• Agency clients range from single office agencies to top-10 public brokers
• Underwriter clients range from monoline privates to publicly traded multi-line carriers
Contact a Mercer Capital professional to discuss your needs in confidence.
Lucas M. Parris, CFA, [email protected]
Travis W. Harms, CFA, CPA/[email protected]
Mercer Capital5100 Poplar Avenue, Suite 2600Memphis, Tennessee 38137901.685.2120 (P)
www.mercercapital.com
• Underwriters
• P&C, life & health, and managed care
• Reinsurance
• Captives and risk retention groups
Special thanks to our summer
intern Hogan Bryant for
helping create this issue.
Erickson Partners Merges with Mercer Capital
Mercer Capital, a national business valuation and financial advisory firm specializing in Corporate Valuation, Litigation Support, Finan-cial Reporting Valuation, and Transaction Advisory Consulting, and Erickson Partners, Inc., a Texas-based Valuation and Litigation Support firm, announce their merger effective July 1, 2015.
Mercer Capital, with its strong presence throughout the Southeast and Midwest, and Erickson Partners, with its strong presence in Texas and Oklahoma, are a perfect fit.
Both firms maintain the highest standards of quality for financial analysis and client service and believe deeply in hiring and devel-oping the best professionals.
“The culture of both firms is so similar and that was important to us. The professionals of Erickson Partners are well-known in the valuation profession as some of the best and brightest. Their work product and reputation are stellar. This merger not only allows us to broaden our geographic reach but also our industry expertise,” said Matt Crow, President of Mercer Capital.
Erickson Partners enhances Mercer Capital’s broad base of indus-try concentrations with their exceptional history working with and knowledge of professional sports franchises and the energy sector.
“Over our 30 plus year history, Mercer Capital has developed sev-eral industry concentrations. By adding the knowledge, insight, and expertise of Don Erickson, Bryce Erickson, and the rest of the professionals of Erickson Partners, we now bring deep experience and insight to a broader range of industries than we could as sepa-rate firms,” said Chris Mercer, CEO of Mercer Capital.
“Combining with Mercer Capital, we will now be able to offer new or expanded services that complement our existing services, as well as additional industry expertise,” said Bryce Erickson, Managing
Director of Erickson Partners. “In addition to our sports franchise and energy industry concentrations, we will be able to offer deep industry concentrations in construction and building materials, agribusiness, manufacturing and financial institutions, which in-cludes depository institutions, insurance companies, fintech com-panies, asset management firms, and PE firms.”
“The combined firm will have over 40 valuation professionals po-sitioned in five markets throughout the southwest and southeast. Such a deep bench will provide us with a tremendous opportuni-ty to better serve the expanding needs of our clients,” said Don
Erickson, President of Erickson Partners. “Joining with Mercer Capital gives us national resources that will benefit our clients in Texas and beyond.”
About Mercer Capital
Mercer Capital is a national business valuation and financial advi-sory firm offering corporate valuation, litigation support, financial reporting valuation, and transaction advisory consulting services to a national client base. Clients include private and public oper-ating companies, financial institutions, asset holding companies, high-net worth families, and private equity/hedge funds.
About Erickson Partners, Inc.
Erickson Partners is a professional valuation and advisory firm spe-cializing in business valuation, litigation support, financial investiga-tions and strategic corporate advisory services. Founded by Don & Bryce Erickson, Erickson Partners has served large and small cli-ents by providing complex financial and economic analysis, leading to reasonable valuation opinions that withstand scrutiny.
CONTACT US
Z. Christopher Mercer, ASA, CFA, ABAR
901.685.2120
Matthew R. Crow, CFA, ASA
901.685.2120
Donald Erickson, ASA
214.468.8400
Bryce Erickson, ASA, MRICS
214.468.8400
MERCER CAPITAL
Headquarters
5100 Poplar Avenue, Suite 2600
Memphis, TN 38137
901.685.2120
Dallas
12201 Merit Drive, Suite 480
Dallas, TX 75251
214.468.2120
Nashville
102 Woodmont Blvd., Suite 231
Nashville, TN 37205
615.345.0350
www.mercercapital.com
COMBINING CULTURES OF EXCELLENCE
BUSINESS VALUATION & FINANCIAL ADVISORY SERVICES