mercer capital's value focus: refining | 2q16
TRANSCRIPT
BUSINESS VALUATION & FINANCIAL ADVISORY SERVICES
VALUE FOCUS
Refining
www.mercercapital.com
Refining Overview The refining industry is surrounded by uncertainty. Refiners’ inputs and products are both commodities, which means that the price they pay for inputs and the prices they receive for their products are generally determined by the market. Before the collapse of oil prices in July of 2014, refiners had become accustomed to low input prices and wide margins. The crude export ban allowed refiners to pay low prices for landlocked crude and sell their refined products to the global market where prices reflected the global oil and gas market. When the price of crude oil fell worldwide, the price of refined products followed a few months after.
Although the price of refined products has increased slightly over the last few months, the M&A market for downstream oil and gas is still at a standstill waiting to better understand the long term effects of the lifting of the export ban.
Second Quarter 2016
Legislation 1
Oil & Gas Market Overview 2
Refining & Marketing Refined Product Prices 3
Refined Product Volumes 3
Crack Spread 4
Refiner Market Margin 5
Operating & Idle Refineries 6
Market Valuations & Transaction Activity 8
Guideline Public Company Valuation Multiples 10
AppendicesWorld Demand 11
World Supply 12
Domestic Supply 13
Commodity Prices 14
Stock Performance 15
About Mercer Capital 16
© 2016 Mercer Capital // www.mercercapital.com 1
Mercer Capital’s Value Focus: Refining Second Quarter 2016
In early 2016, the crude oil export ban, which had been in place since 1975, was lifted. Industry experts thought that the lifting of the export ban would better align the production capabilities of U.S. refineries. Refiners, on the other hand, feared that the exportation of crude oil would increase crude prices, as the pressure on price in an oversupplied U.S. market gave way. Six months later, we do not know all the consequences, as the Brent-WTI spread is still insig-nificant. Once the spread widens — and it is cheaper for other countries to buy WTI and pay transportation costs than to buy Brent — the true effect will be understood. Until then, refiners should enjoy currently low input prices.
Adding to the uncertainty, the refining industry is heavily regulated. One of the newest rules, passed in December 2015, is the Petroleum Refinery Sector Risk and Technology Review (RTR) and the New Source Performance Stan-dards (NSPS) rule. The RTR & NSPS was passed in order to control air pollution from refineries and provide the public with information about refineries’ air pollution. These regulations range from fence line and storage tank monitoring to more complex requirements for key refinery processing units. The rule is expected to be fully imple-mented in 2018. However additional time has already been proposed by the EPA. The EIA estimates the rule will cost refineries a total of $40 million per year, while the American Petroleum Institute (API) argued that the annual cost would exceed $100 million.
Legislation
© 2016 Mercer Capital // www.mercercapital.com 2
Mercer Capital’s Value Focus: Refining Second Quarter 2016
Oil & Gas Market Overview
There are four main components to refined product prices: (1) crude oil prices, (2) wholesale margins, (3) retail distri-bution costs, and (4) taxes. Generally, input prices and wholesale margins drive fluctuations in product prices as the last two are relatively stable. Thus, in order to understand refined product prices, we consider the macroeconomic trends in the global oil and gas market which drive input prices.
Global oil production outpaced global crude demand for almost a year. An oversupply of crude caused downward pressure on the price of crude oil which for months benefited refiners as their product costs fell. A shortage of crude storage forced producers to sell crude at increasingly low prices to refiners, who then would earn substantial profits. But, as the market moved further into contango1, crude oil producers were more willing to hold crude than sell it to refiners at such low prices. As crude prices have risen over the last six months, refiners’ margins were originally squeezed. However, as the economy has continued to recover, more people began traveling, increasing the demand for and prices of gasoline.
1 Contango occurs when the future price of a commodity is higher than the spot price.
© 2016 Mercer Capital // www.mercercapital.com 3
Mercer Capital’s Value Focus: Refining Second Quarter 2016
Refining & Marketing
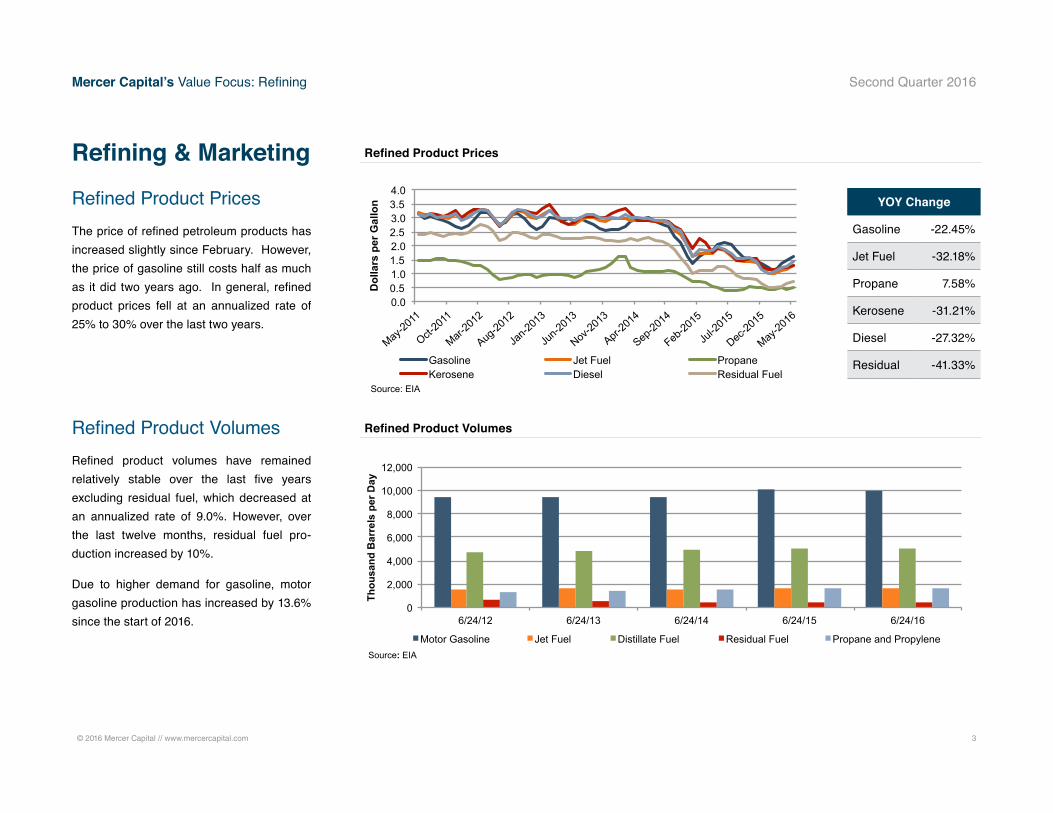
Refined Product Prices The price of refined petroleum products has increased slightly since February. However, the price of gasoline still costs half as much as it did two years ago. In general, refined product prices fell at an annualized rate of 25% to 30% over the last two years.
Refined Product VolumesRefined product volumes have remained relatively stable over the last five years excluding residual fuel, which decreased at an annualized rate of 9.0%. However, over the last twelve months, residual fuel pro-duction increased by 10%.
Due to higher demand for gasoline, motor gasoline production has increased by 13.6% since the start of 2016.
0.0 0.5 1.0 1.5 2.0 2.5 3.0 3.5 4.0
May-20
11
Oct-20
11
Mar-20
12
Aug-20
12
Jan-2
013
Jun-2
013
Nov-20
13
Apr-20
14
Sep-20
14
Feb-20
15
Jul-2
015
Dec-20
15
May-20
16
Dol
lars
per
Gal
lon
Gasoline Jet Fuel Propane Kerosene Diesel Residual Fuel
Source: EIA
0
2,000
4,000
6,000
8,000
10,000
12,000
6/24/12 6/24/13 6/24/14 6/24/15 6/24/16
Thou
sand
Bar
rels
per
Day
Motor Gasoline Jet Fuel Distillate Fuel Residual Fuel Propane and Propylene Source: EIA
Refined Product Prices
Refined Product Volumes
YOY Change
Gasoline -22.45%
Jet Fuel -32.18%
Propane 7.58%
Kerosene -31.21%
Diesel -27.32%
Residual -41.33%
© 2016 Mercer Capital // www.mercercapital.com 4
Mercer Capital’s Value Focus: Refining Second Quarter 2016
Refining & Marketing
Crack Spread
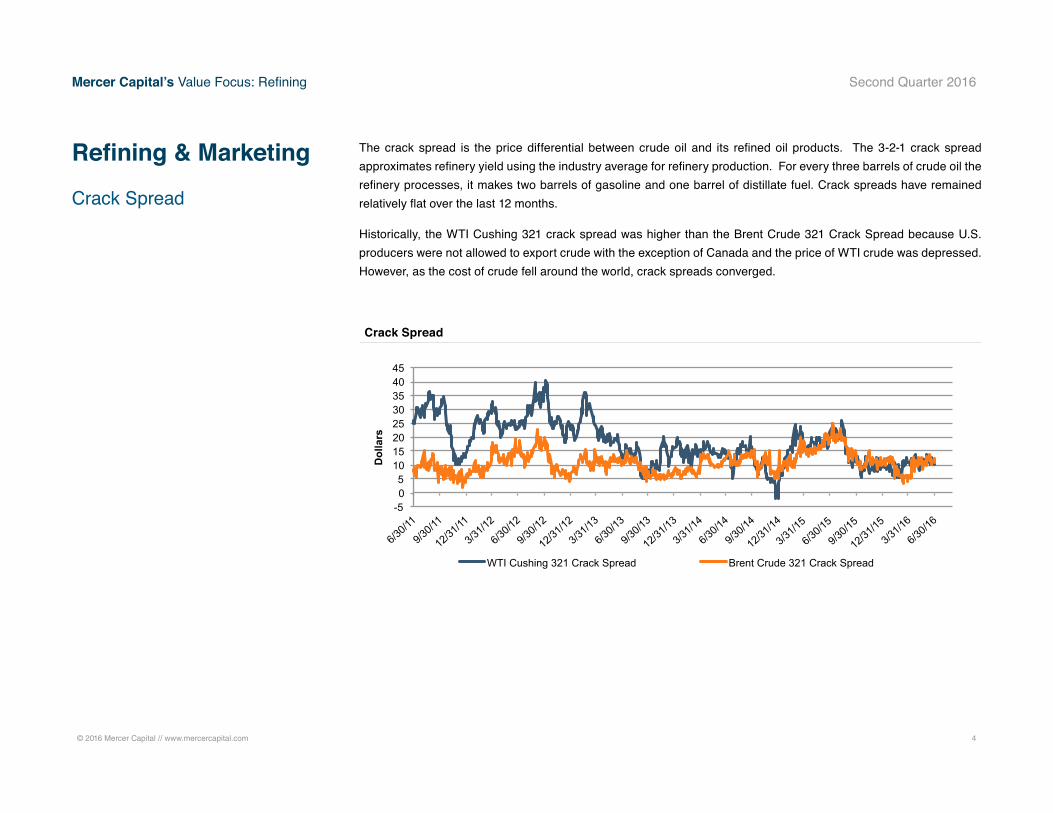
The crack spread is the price differential between crude oil and its refined oil products. The 3-2-1 crack spread approximates refinery yield using the industry average for refinery production. For every three barrels of crude oil the refinery processes, it makes two barrels of gasoline and one barrel of distillate fuel. Crack spreads have remained relatively flat over the last 12 months.
Historically, the WTI Cushing 321 crack spread was higher than the Brent Crude 321 Crack Spread because U.S. producers were not allowed to export crude with the exception of Canada and the price of WTI crude was depressed. However, as the cost of crude fell around the world, crack spreads converged.
-5 0 5
10 15 20 25 30 35 40 45
6/30/1
1
9/30/1
1
12/31
/11
3/31/1
2
6/30/1
2
9/30/1
2
12/31
/12
3/31/1
3
6/30/1
3
9/30/1
3
12/31
/13
3/31/1
4
6/30/1
4
9/30/1
4
12/31
/14
3/31/1
5
6/30/1
5
9/30/1
5
12/31
/15
3/31/1
6
6/30/1
6
Dol
lars
WTI Cushing 321 Crack Spread Brent Crude 321 Crack Spread
Crack Spread
© 2016 Mercer Capital // www.mercercapital.com 5
Mercer Capital’s Value Focus: Refining Second Quarter 2016
Refining & Marketing
Refiner Marker Margin
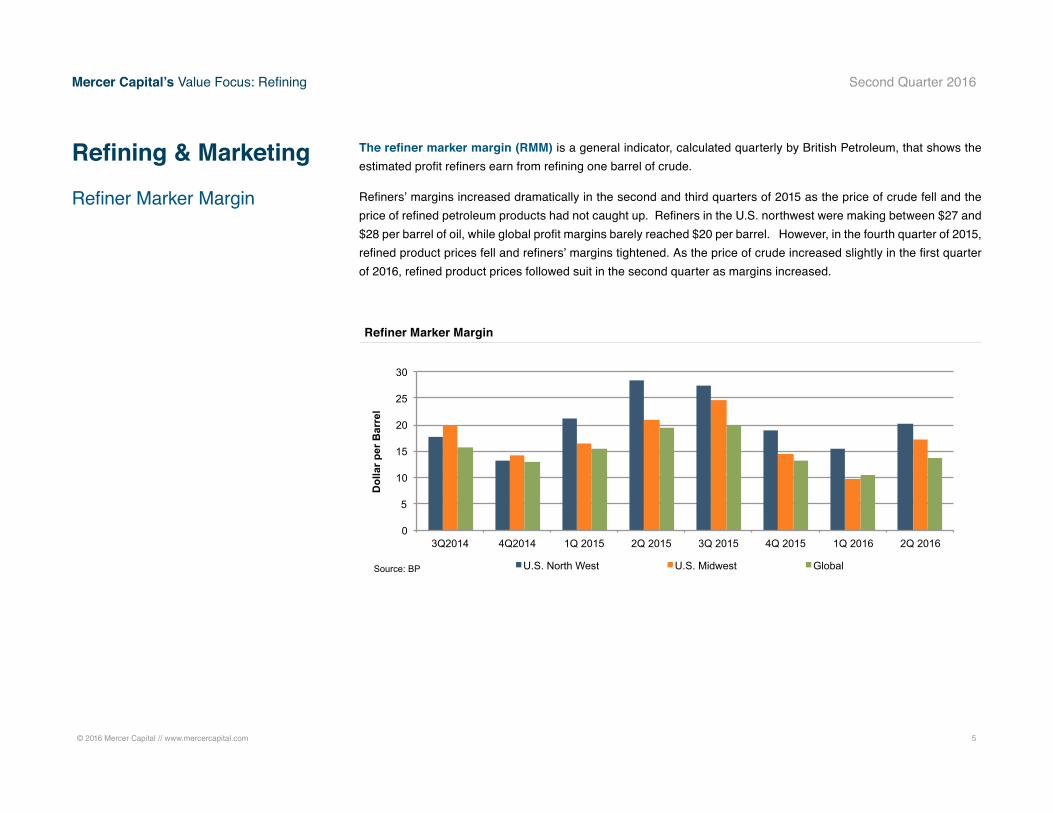
The refiner marker margin (RMM) is a general indicator, calculated quarterly by British Petroleum, that shows the estimated profit refiners earn from refining one barrel of crude.
Refiners’ margins increased dramatically in the second and third quarters of 2015 as the price of crude fell and the price of refined petroleum products had not caught up. Refiners in the U.S. northwest were making between $27 and $28 per barrel of oil, while global profit margins barely reached $20 per barrel. However, in the fourth quarter of 2015, refined product prices fell and refiners’ margins tightened. As the price of crude increased slightly in the first quarter of 2016, refined product prices followed suit in the second quarter as margins increased.
0
5
10
15
20
25
30
3Q2014 4Q2014 1Q 2015 2Q 2015 3Q 2015 4Q 2015 1Q 2016 2Q 2016
Dol
lar p
er B
arre
l
U.S. North West U.S. Midwest Global Source: BP
Refiner Marker Margin
© 2016 Mercer Capital // www.mercercapital.com 6
Mercer Capital’s Value Focus: Refining Second Quarter 2016
Refining & Marketing
Operating & Idle Refineries
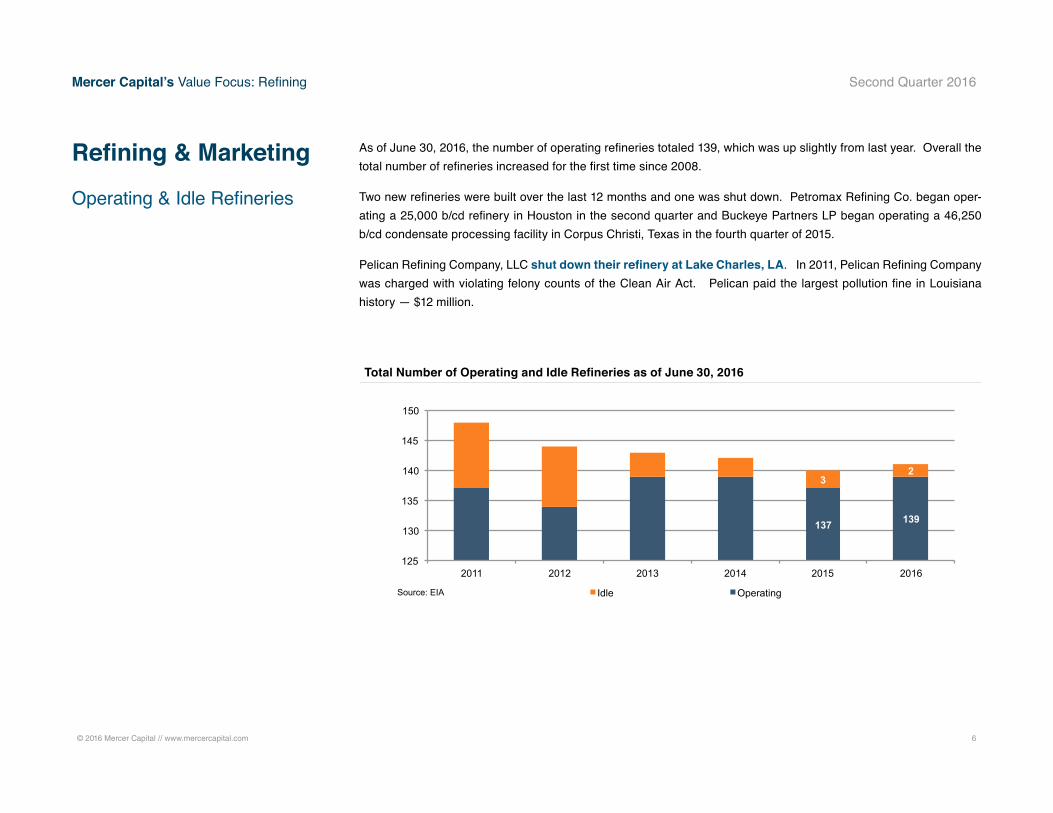
As of June 30, 2016, the number of operating refineries totaled 139, which was up slightly from last year. Overall the total number of refineries increased for the first time since 2008.
Two new refineries were built over the last 12 months and one was shut down. Petromax Refining Co. began oper-ating a 25,000 b/cd refinery in Houston in the second quarter and Buckeye Partners LP began operating a 46,250 b/cd condensate processing facility in Corpus Christi, Texas in the fourth quarter of 2015.
Pelican Refining Company, LLC shut down their refinery at Lake Charles, LA. In 2011, Pelican Refining Company was charged with violating felony counts of the Clean Air Act. Pelican paid the largest pollution fine in Louisiana history — $12 million.
137 139
3 2
125
130
135
140
145
150
2011 2012 2013 2014 2015 2016
Idle Operating Source: EIA
Total Number of Operating and Idle Refineries as of June 30, 2016
© 2016 Mercer Capital // www.mercercapital.com 7
Mercer Capital’s Value Focus: Refining Second Quarter 2016
Refining & Marketing
Operating & Idle Refineries (continued)
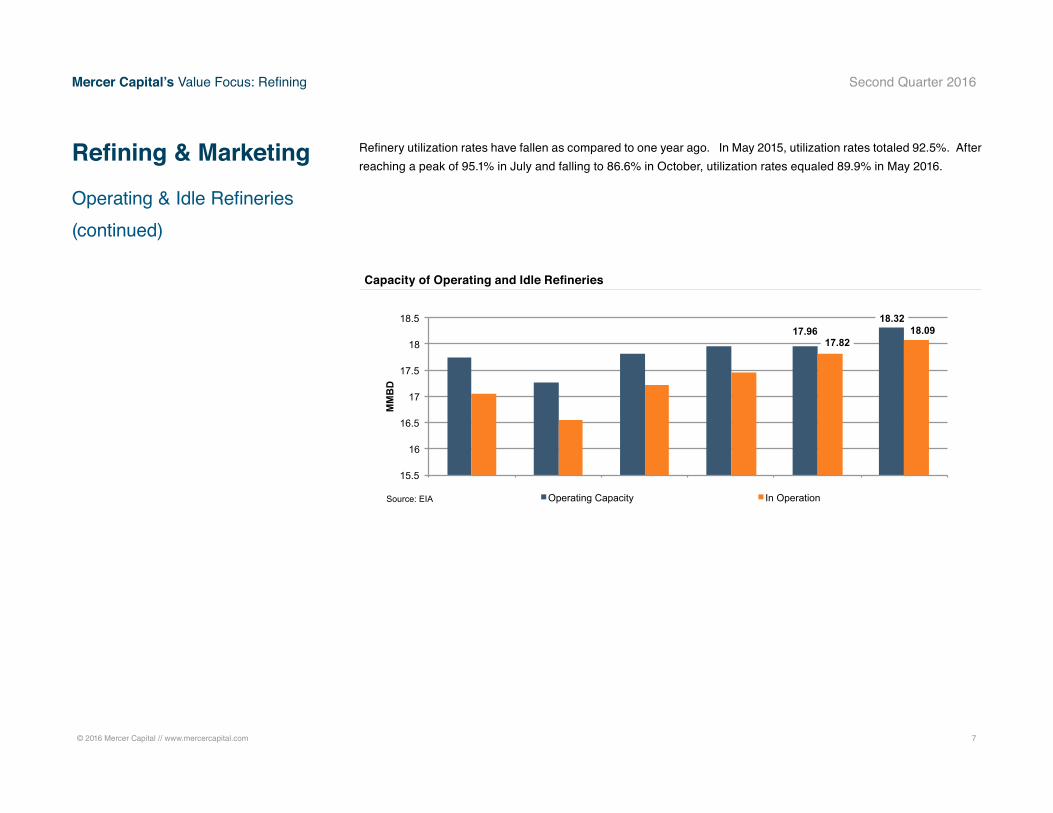
Refinery utilization rates have fallen as compared to one year ago. In May 2015, utilization rates totaled 92.5%. After reaching a peak of 95.1% in July and falling to 86.6% in October, utilization rates equaled 89.9% in May 2016.
17.96 18.32
17.82 18.09
15.5
16
16.5
17
17.5
18
18.5
MM
BD
Operating Capacity In Operation Source: EIA
Capacity of Operating and Idle Refineries
© 2016 Mercer Capital // www.mercercapital.com 8
Mercer Capital’s Value Focus: Refining Second Quarter 2016
Market Valuations & Transaction Activity
Uncertainty in the industry has led to a standstill in M&A activity.
While M&A activity in the exploration and production sector has picked up since the beginning of 2016, M&A in refining and marketing has remained sluggish. Over the last nine months, the majority of the transactions in refining and mar-keting were between chemical and lubricant refineries and renewable fuels refineries. Currently, investors are sticking with what they know — demand for renewable fuels will increase and chemical lubricants are still in high demand.
The few transactions that occurred with petroleum transportation product refineries had very little public information. Thus we look to the public market in order to understand valuation multiples.
© 2016 Mercer Capital // www.mercercapital.com 9
Mercer Capital’s Value Focus: Refining Second Quarter 2016
Market Valuations & Transaction Activity
(continued)
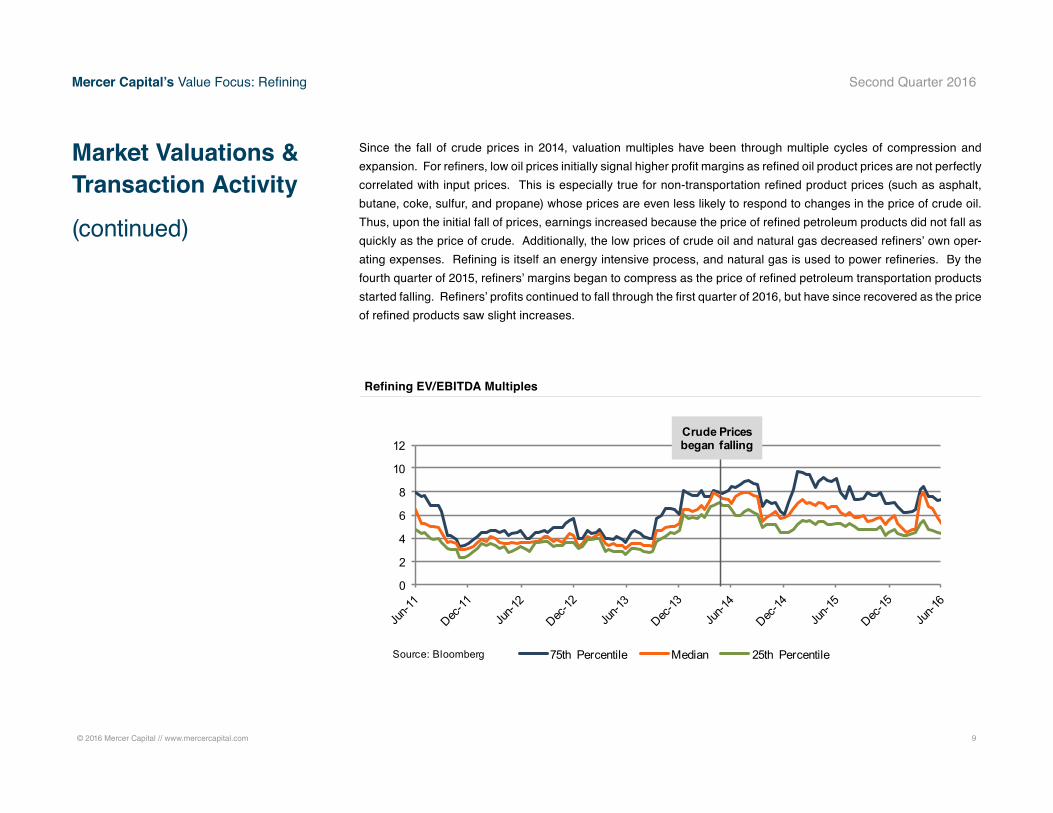
Since the fall of crude prices in 2014, valuation multiples have been through multiple cycles of compression and expansion. For refiners, low oil prices initially signal higher profit margins as refined oil product prices are not perfectly correlated with input prices. This is especially true for non-transportation refined product prices (such as asphalt, butane, coke, sulfur, and propane) whose prices are even less likely to respond to changes in the price of crude oil. Thus, upon the initial fall of prices, earnings increased because the price of refined petroleum products did not fall as quickly as the price of crude. Additionally, the low prices of crude oil and natural gas decreased refiners’ own oper-ating expenses. Refining is itself an energy intensive process, and natural gas is used to power refineries. By the fourth quarter of 2015, refiners’ margins began to compress as the price of refined petroleum transportation products started falling. Refiners’ profits continued to fall through the first quarter of 2016, but have since recovered as the price of refined products saw slight increases.
0
2
4
6
8
10
12
75th Percentile Median 25th PercentileSource: Bloomberg
Crude Prices began falling
Refining EV/EBITDA Multiples
© 2016 Mercer Capital // www.mercercapital.com 10
Mercer Capital’s Value Focus: Refining Second Quarter 2016
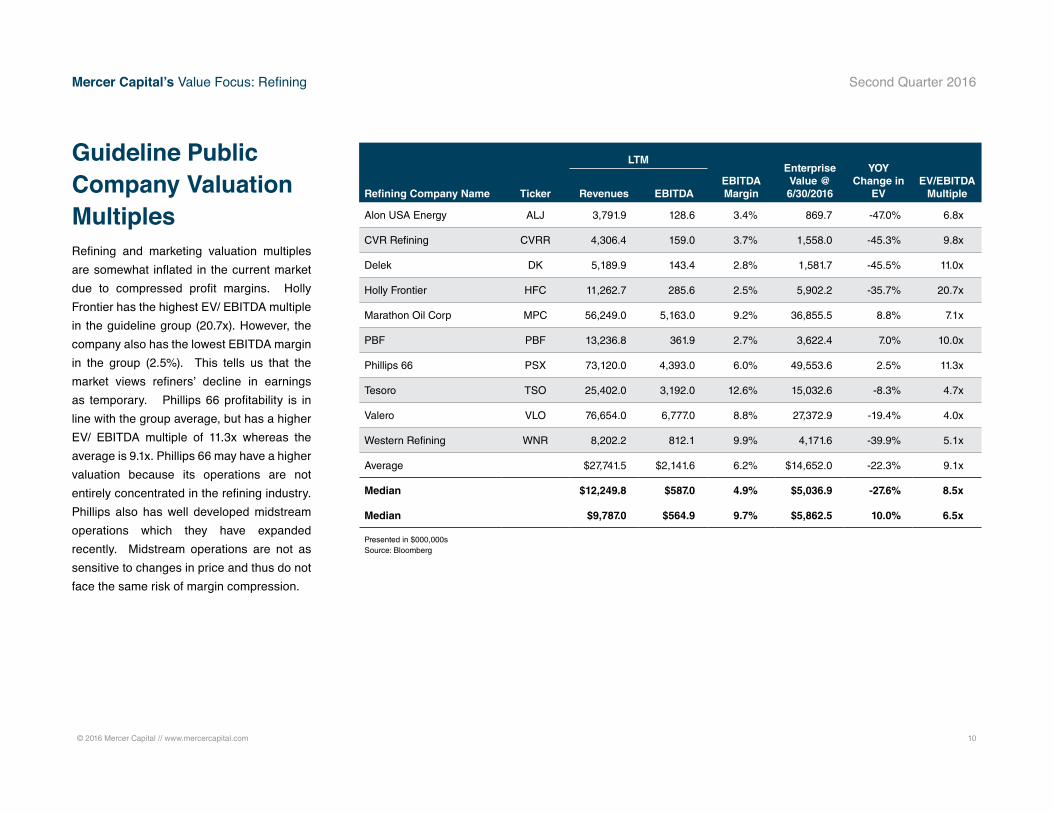
Guideline Public Company Valuation MultiplesRefining and marketing valuation multiples are somewhat inflated in the current market due to compressed profit margins. Holly Frontier has the highest EV/ EBITDA multiple in the guideline group (20.7x). However, the company also has the lowest EBITDA margin in the group (2.5%). This tells us that the market views refiners’ decline in earnings as temporary. Phillips 66 profitability is in line with the group average, but has a higher EV/ EBITDA multiple of 11.3x whereas the average is 9.1x. Phillips 66 may have a higher valuation because its operations are not entirely concentrated in the refining industry. Phillips also has well developed midstream operations which they have expanded recently. Midstream operations are not as sensitive to changes in price and thus do not face the same risk of margin compression.
LTM
EBITDA Margin
Enterprise Value @ 6/30/2016
YOY Change in
EVEV/EBITDA
MultipleRefining Company Name Ticker Revenues EBITDA
Alon USA Energy ALJ 3,791.9 128.6 3.4% 869.7 -47.0% 6.8x
CVR Refining CVRR 4,306.4 159.0 3.7% 1,558.0 -45.3% 9.8x
Delek DK 5,189.9 143.4 2.8% 1,581.7 -45.5% 11.0x
Holly Frontier HFC 11,262.7 285.6 2.5% 5,902.2 -35.7% 20.7x
Marathon Oil Corp MPC 56,249.0 5,163.0 9.2% 36,855.5 8.8% 7.1x
PBF PBF 13,236.8 361.9 2.7% 3,622.4 7.0% 10.0x
Phillips 66 PSX 73,120.0 4,393.0 6.0% 49,553.6 2.5% 11.3x
Tesoro TSO 25,402.0 3,192.0 12.6% 15,032.6 -8.3% 4.7x
Valero VLO 76,654.0 6,777.0 8.8% 27,372.9 -19.4% 4.0x
Western Refining WNR 8,202.2 812.1 9.9% 4,171.6 -39.9% 5.1x
Average $27,741.5 $2,141.6 6.2% $14,652.0 -22.3% 9.1x
Median $12,249.8 $587.0 4.9% $5,036.9 -27.6% 8.5x
Median $9,787.0 $564.9 9.7% $5,862.5 10.0% 6.5x
Presented in $000,000s Source: Bloomberg
© 2016 Mercer Capital // www.mercercapital.com 11
Mercer Capital’s Value Focus: Refining Second Quarter 2016
APPENDIX A
World Demand4.8%
20.6%
3.9%
12.4%
2.4%
55.8%
Former Soviet Union U.S. Japan China Germany Other
Source: Bloomberg M
MB
D
0
20
40
60
80
100
6/30/12 6/30/13 6/30/14 6/30/15 6/30/16
Japan Former Soviet Union U.S. China Other Germany
MM
BD
Source: Bloomberg
MM
BD
91.2 92.0 93.5 96.0 94.3
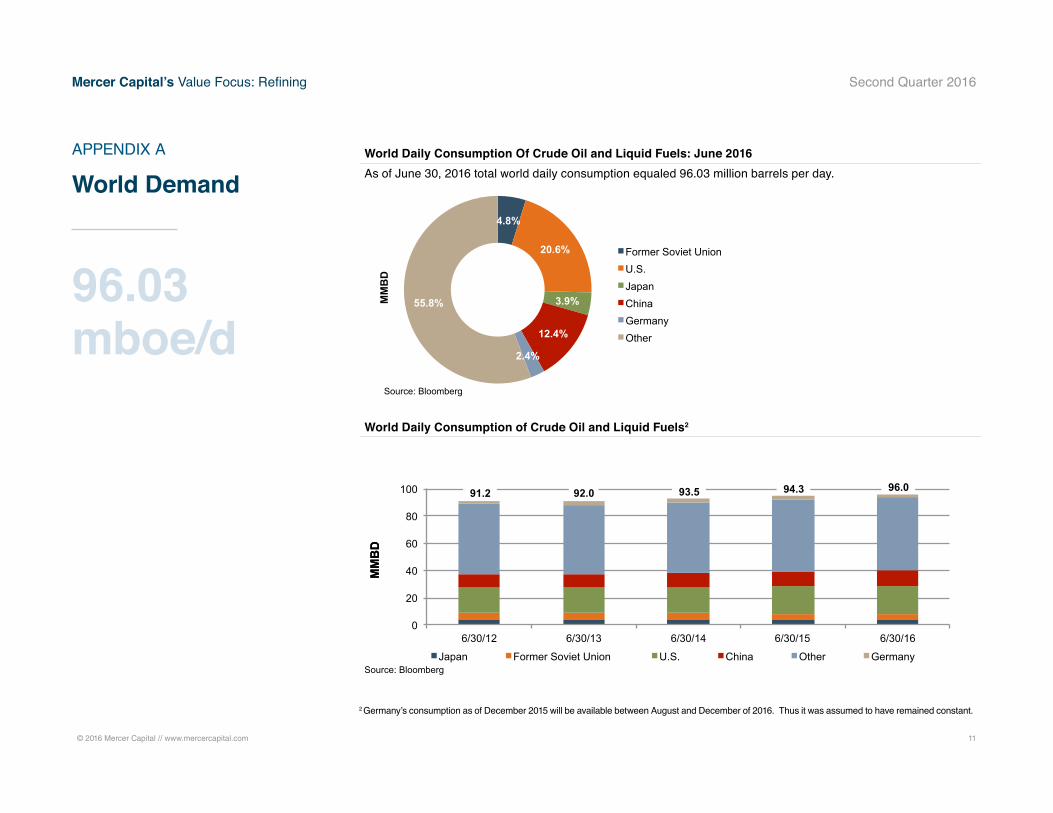
World Daily Consumption Of Crude Oil and Liquid Fuels: June 2016As of June 30, 2016 total world daily consumption equaled 96.03 million barrels per day.
World Daily Consumption of Crude Oil and Liquid Fuels2
2 Germany’s consumption as of December 2015 will be available between August and December of 2016. Thus it was assumed to have remained constant.
96.03 mboe/d
© 2016 Mercer Capital // www.mercercapital.com 12
Mercer Capital’s Value Focus: Refining Second Quarter 2016
APPENDIX B
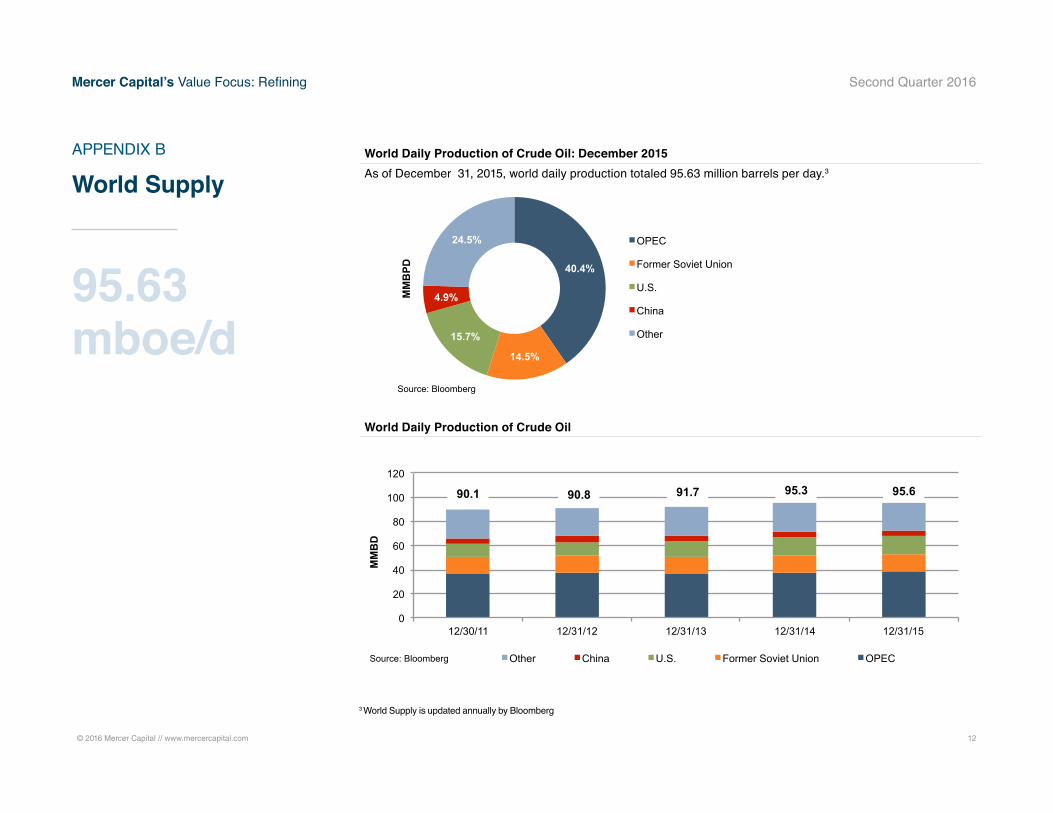
World Supply
40.4%
14.5%
15.7%
4.9%
24.5% OPEC
Former Soviet Union
U.S.
China
Other
MM
BPD
Source: Bloomberg
0
20
40
60
80
100
120
12/30/11 12/31/12 12/31/13 12/31/14 12/31/15
MM
BD
Other China U.S. Former Soviet Union OPEC Source: Bloomberg
90.1
95.6
95.3
91.7
90.8
World Daily Production of Crude Oil: December 2015 As of December 31, 2015, world daily production totaled 95.63 million barrels per day.3
World Daily Production of Crude Oil
3 World Supply is updated annually by Bloomberg
95.63 mboe/d
© 2016 Mercer Capital // www.mercercapital.com 13
Mercer Capital’s Value Focus: Refining Second Quarter 2016
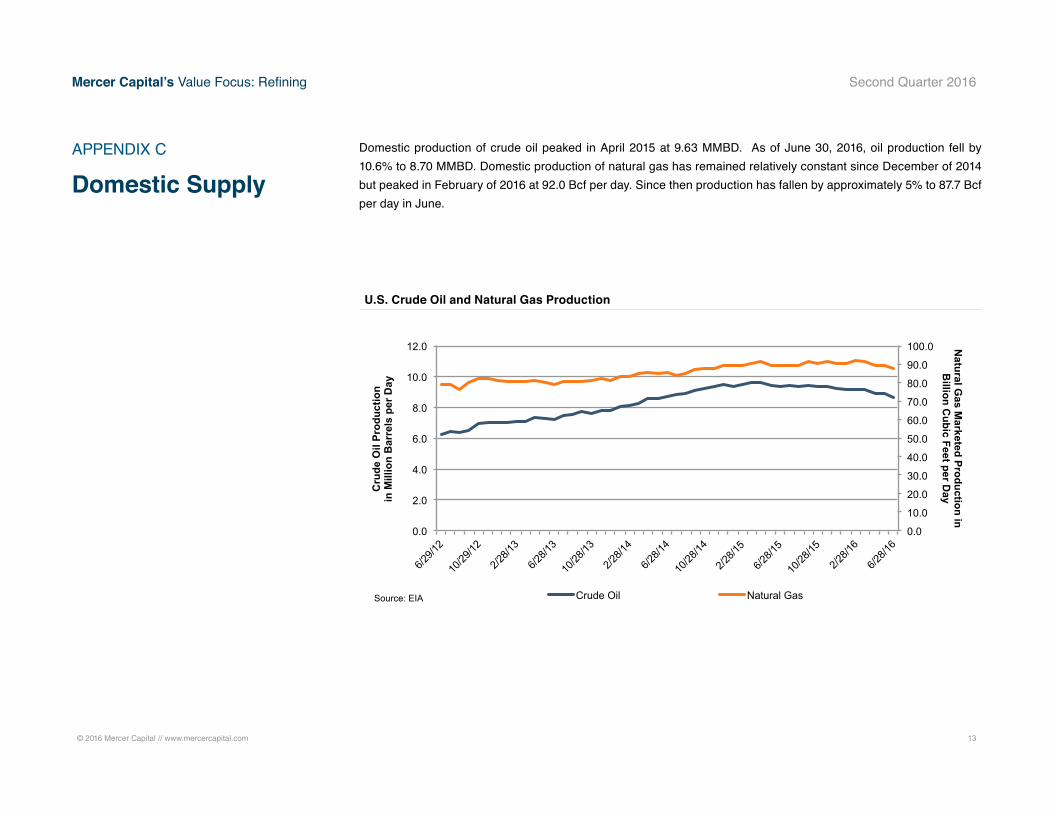
Domestic production of crude oil peaked in April 2015 at 9.63 MMBD. As of June 30, 2016, oil production fell by 10.6% to 8.70 MMBD. Domestic production of natural gas has remained relatively constant since December of 2014 but peaked in February of 2016 at 92.0 Bcf per day. Since then production has fallen by approximately 5% to 87.7 Bcf per day in June.
APPENDIX C
Domestic Supply
0.0
10.0
20.0
30.0
40.0
50.0
60.0
70.0
80.0
90.0
100.0
0.0
2.0
4.0
6.0
8.0
10.0
12.0
6/29/1
2
10/29
/12
2/28/1
3
6/28/1
3
10/28
/13
2/28/1
4
6/28/1
4
10/28
/14
2/28/1
5
6/28/1
5
10/28
/15
2/28/1
6
6/28/1
6
Natural G
as Marketed Production in
Billion C
ubic Feet per Day
Cru
de O
il Pr
oduc
tion
in
Mill
ion
Bar
rels
per
Day
Crude Oil Natural Gas Source: EIA
U.S. Crude Oil and Natural Gas Production
© 2016 Mercer Capital // www.mercercapital.com 14
Mercer Capital’s Value Focus: Refining Second Quarter 2016
APPENDIX D
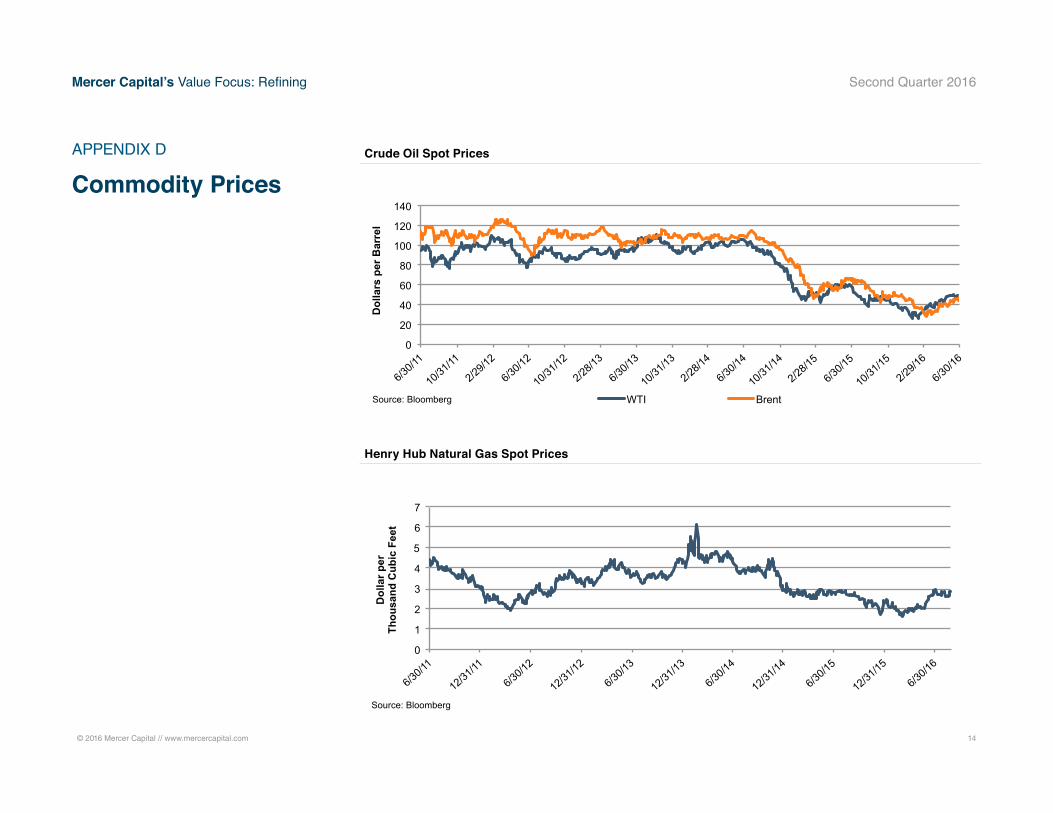
Commodity Prices
0
20
40
60
80
100
120
140
6/30/1
1
10/31
/11
2/29/1
2
6/30/1
2
10/31
/12
2/28/1
3
6/30/1
3
10/31
/13
2/28/1
4
6/30/1
4
10/31
/14
2/28/1
5
6/30/1
5
10/31
/15
2/29/1
6
6/30/1
6
Dol
lars
per
Bar
rel
WTI Brent Source: Bloomberg
0
1
2
3
4
5
6
7
6/30/1
1
12/31
/11
6/30/1
2
12/31
/12
6/30/1
3
12/31
/13
6/30/1
4
12/31
/14
6/30/1
5
12/31
/15
6/30/1
6
Dol
lar p
er
Thou
sand
Cub
ic F
eet
Source: Bloomberg
Crude Oil Spot Prices
Henry Hub Natural Gas Spot Prices
© 2016 Mercer Capital // www.mercercapital.com 15
Mercer Capital’s Value Focus: Refining Second Quarter 2016
APPENDIX E
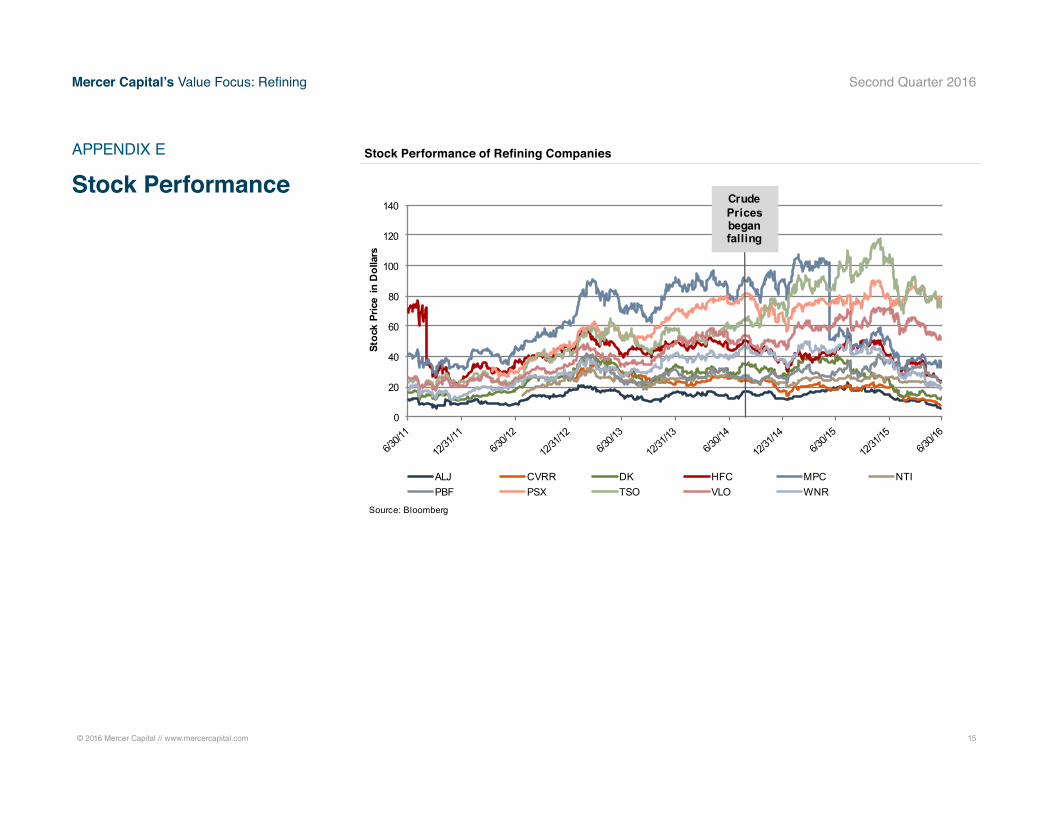
Stock Performance
0
20
40
60
80
100
120
140
Stoc
k Pr
ice
in D
olla
rs
ALJ CVRR DK HFC MPC NTIPBF PSX TSO VLO WNR
Crude Prices began falling
Source: Bloomberg
Stock Performance of Refining Companies
Contact Us
Copyright © 2016 Mercer Capital Management, Inc. All rights reserved. It is illegal under Federal law to reproduce this publication or any portion of its contents without the publisher’s permission. Media quotations with source attribution are encouraged. Reporters
requesting additional information or editorial comment should contact Barbara Walters Price at 901.685.2120. Mercer Capital’s Industry Focus is published quarterly and does not constitute legal or financial consulting advice. It is offered as an information service to
our clients and friends. Those interested in specific guidance for legal or accounting matters should seek competent professional advice. Inquiries to discuss specific valuation matters are welcomed. To add your name to our mailing list to receive this complimentary
publication, visit our web site at www.mercercapital.com.
BUSINESS VALUATION & FINANCIAL ADVISORY SERVICES
Services Provided
• Valuation of energy companies
• Transaction advisory for acquisitions and divestitures
• Valuations for purchase accounting and impairment
testing
• Fairness and solvency opinions
• Litigation support for economic damages and
valuation and shareholder disputes
Mercer CapitalEnergy Industry Services
Mercer Capital has expertise providing business valuation and financial advisory services to companies in the energy industry.
Industry Segments
Mercer Capital serves the following industry segments:
• Exploration & Production
• Oil Field Services
• Midstream Operations
• Alternative Energy
Contact a Mercer Capital professional to discuss your needs in confidence.
Bryce Erickson, ASA, MRICS
214.468.8400
Grant M. Farrell, ASA, CPA, ABV, CFF
214.468.8400
Don Erickson, ASA
214.468.8400
Taryn E. Burgess
901.322.9757
MERCER CAPITAL
Memphis
5100 Poplar Avenue, Suite 2600
Memphis, Tennessee 38137
901.685.2120
Dallas
12201 Merit Drive, Suite 480
Dallas, Texas 75251
214.468.8400
Nashville
102 Woodmont Blvd., Suite 231
Nashville, Tennessee 37205
615.345.0350
www.mercercapital.com