mercer capital's value focus: construction industry | q3 2015
TRANSCRIPT

BUSINESS VALUATION & FINANCIAL ADVISORY SERVICES
Construction Overview Construction & National GDP 1Construction & National Unemployment 2Value of Construction Put-in-Place 3
Sector Focus Roads, Bridges, & Highways 4
Government Funding for Highways and Local and State Government Investment 5Price of Cement 6Yield on 10-Year Treasury 7
Sector Round-up Residential Construction 8Building Materials 10Nonresidential 11
Mergers and Acquisitions 12
Bellwether Stocks & Industry Participants 13
About Mercer Capital 16
VALUE FOCUS
Third Quarter 2015
Construction & Building Materials
SEGMENT FOCUS Roads, Bridges, & Highways
EXECUTIVE INDUSTRY TRENDS
• Federal infrastructure funding is in the works as the House
passes 6 year, $340 billion bill
• Public funding has declined year-over-year, though this trend
should soon reverse with the passing of the new bill
• LafargeHolcim completes its merger, becoming the largest
player in the industry
• Falling treasury yields indicate low financing costs for new
construction projects
www.mercercapital.com
© 2015 Mercer Capital // www.mercercapital.com 1
Mercer Capital’s Value Focus: Construction & Building Materials Third Quarter 2015
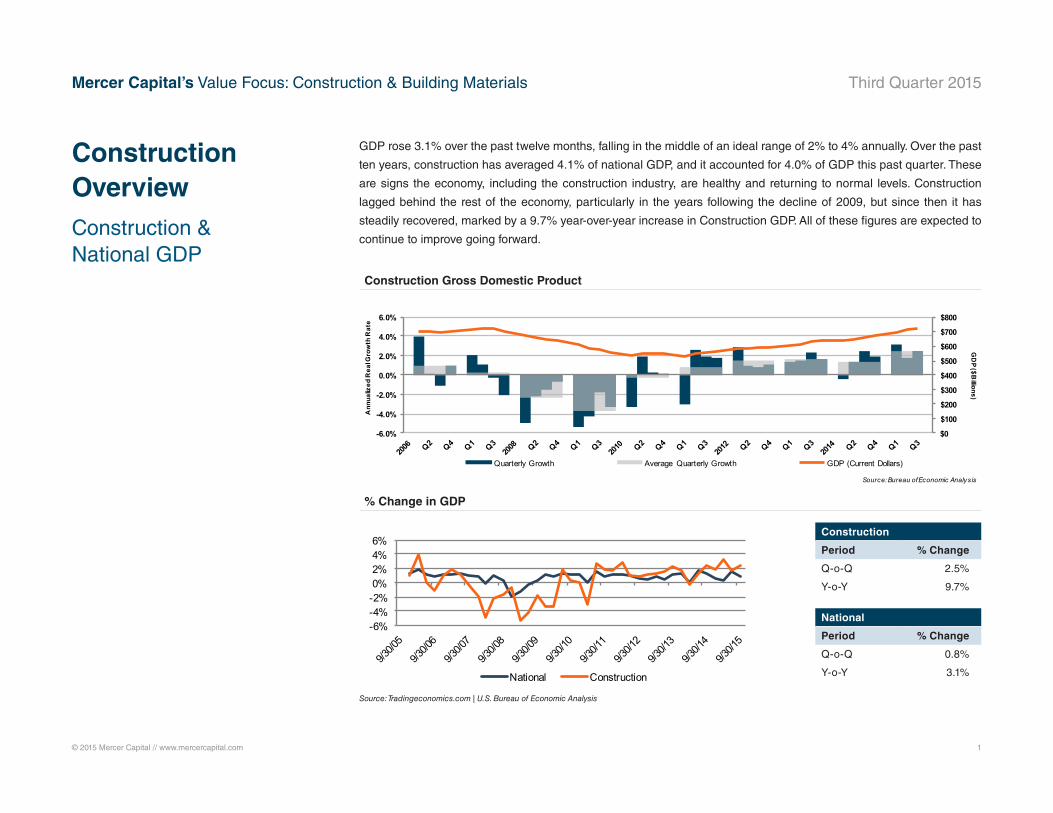
GDP rose 3.1% over the past twelve months, falling in the middle of an ideal range of 2% to 4% annually. Over the past
ten years, construction has averaged 4.1% of national GDP, and it accounted for 4.0% of GDP this past quarter. These
are signs the economy, including the construction industry, are healthy and returning to normal levels. Construction
lagged behind the rest of the economy, particularly in the years following the decline of 2009, but since then it has
steadily recovered, marked by a 9.7% year-over-year increase in Construction GDP. All of these figures are expected to
continue to improve going forward.
$0
$100
$200
$300
$400
$500
$600
$700
$800
-6.0%
-4.0%
-2.0%
0.0%
2.0%
4.0%
6.0%
GD
P ($Billions)
Ann
ualiz
ed R
eal G
row
th R
ate
Quarterly Growth Average Quarterly Growth GDP (Current Dollars)
Source: Bureau of Economic Analysis
-6%-4%-2%0%2%4%6%
National Construction
Construction OverviewConstruction & National GDP
Construction Gross Domestic Product
% Change in GDP
Source: Tradingeconomics.com | U.S. Bureau of Economic Analysis
Construction
Period % Change
Q-o-Q 2.5%
Y-o-Y 9.7%
National
Period % Change
Q-o-Q 0.8%
Y-o-Y 3.1%

© 2015 Mercer Capital // www.mercercapital.com 2
Mercer Capital’s Value Focus: Construction & Building Materials Third Quarter 2015
According to the Federal Reserve, a healthy economy typically has an unemployment rate between 4.5% and 6.0%. The
current level of 5.1% represents strength in the economy, after decreasing steadily from 6.0% a year ago.
Construction is a cyclical and seasonal industry, so its unemployment rate is more volatile. The major contributing
factor to the seasonal nature of the construction industry is the weather. Production of materials and projects in general
decrease during the cold, winter months. Construction unemployment is currently 5.5%, down from 7.0% a year ago.
This number will likely continue to fall during the fourth quarter before inevitably increasing during the cold first quarter
of next calendar year. Lower unemployment rates suggest an increase of activity within the industry.
0.0%
5.0%
10.0%
15.0%
20.0%
25.0%
30.0%
National Construction
Note: In the above graph, the national unemployment rate is seasonally adjusted, but the construction unemployment rate is not in order to show seasonality and recent trends. Source: U.S. Bureau of Labor Statistics
Construction OverviewConstruction & National Unemployment
Unemployment Rate

© 2015 Mercer Capital // www.mercercapital.com 3
Mercer Capital’s Value Focus: Construction & Building Materials Third Quarter 2015
The value of construction put-in-place is the total cost of construction on a job site for a particular period. The U.S.
Census Bureau tracks this data and reports the total monthly. These costs include, but are not limited to, the building
materials, labor, profit, engineering, interest, and taxes.
Year-over-year put-in-place construction has surged, up 21.8% for residential and 10.4% for nonresidential. Despite
rapid yearly growth, both seem to be slowing down this quarter with residential construction increasing by 3.5%, which
is still quite strong, and nonresidential construction increasing by just 0.9%. Higher levels of put-in-place construction
suggest an increase of activity within the industry.
Construction OverviewValue of Construction Put-in-Place
$0
$100
$200
$300
$400
$500
$600
$700
$800
$Billions
Residential Nonresidential
Source: U.S. Census Bureau
Value of Construction Put-in-Place
Residential
Period % Change
Q-o-Q 3.5%
Y-o-Y 21.8%
Nonresidential
Period % Change
Q-o-Q 0.9%
Y-o-Y 10.4%

© 2015 Mercer Capital // www.mercercapital.com 4
Mercer Capital’s Value Focus: Construction & Building Materials Third Quarter 2015
A long-awaited congressional bill for federal highway funding appears imminent, which should provide a boost to the
industry. There has been discussion for months about the potential for such a deal, yet it now seems more likely than
ever. The House passed a six year bill for about $340 billion in funding for highways. The Senate must now reconcile
a similar bill from June; while the bills are similar, funding over the life of the bill is a crucial detail to be finalized. One
potential source of funding is increased gas taxes, which typically fund transportation costs. In the current climate of
depressed oil prices, this seems increasingly palatable.
Duration will likely be a more important aspect of this bill than the final dollar amount. A long-term bill will finally allow
larger projects to be completed. Large, complex projects typically demand long-term funding to get off the ground. This
bill would alleviate pent-up demand and would jumpstart the road construction industry. It should also be noted that it
will take time for this bill to affect revenues. Jobs benefitting from this funding will be commissioned and enter companies’
backlogs, likely becoming revenue towards the latter half of 2016.
Despite the significant strides made for federal funding, local and state governments are taking it upon themselves to
do their part. Texas Proposition 7 is a particularly notable bill as it recently passed and will provide $3 billion annually to
Texas’ Department of Transportation. While the federal funds will help with larger jobs, Proposition 7 targets smaller jobs
focusing on areas where traffic congestion is common.
With funding playing such a critical role in the industry, companies focus a considerable amount of effort on future bids
and winning contracts. Contracts are won by the company who provides the lowest bid, and these projects get added
to their backlogs. This stimulates future revenue, so companies frequently point to their backlogs and pipeline of bids
as an indicator of future revenue as opposed to current revenue. While companies have experienced varying levels of
revenue recently, the outlook is positive for the whole industry as funding is increasing the amount of projects to bid on.
Despite the importance of future growth, companies are focused on current profitability, so they are not sacrificing
margins in order to drive up wins and backlogs. Especially, given the increase in projects to bid on, firms are willing
to lose some bids if it means maintaining margin expectations. It should be noted that larger projects typically build in
margin contingencies, which allows increases over the life of a project, given all goes according to plan. This means
margins stand to increase even further as these new projects entering the pipeline mature.
Sector FocusRoads, Bridges, & Highways

© 2015 Mercer Capital // www.mercercapital.com 5
Mercer Capital’s Value Focus: Construction & Building Materials Third Quarter 2015
Companies that build roads, bridges, and highways largely depend on public funding and clearly benefit from any
increases in public investment or spending. Most projects are funded through local and state governments which spend
their own money or use funds allocated to them by the federal government. Both government funding and local and state
investment are poised to increase moving forward, which represents a strengthening climate for companies in the road,
bridge, and highway construction industry.
Roads, Bridges, & HighwaysGovernment Funding for Highways and Local and State Government Investment
Government Funding for Highways
Local and State Government Investment
$0
$50
$100
$150
$200
$250
$300
$Billions
Source: IBIS World | Bureau of Economic Analysis
$0
$50
$100
$150
$200
$250
$300
$350
$400
$Billions
Source: IBIS World | Bureau of Economic Analysis
Government Funding
for Highways
Period % Change
Y-o-Y -2.1%
Local and State
Government Investment
Period % Change
Y-o-Y 2.6%

© 2015 Mercer Capital // www.mercercapital.com 6
Mercer Capital’s Value Focus: Construction & Building Materials Third Quarter 2015
Road contractors submit bids to local and state governments, and construction jobs are awarded to the lowest bidder.
Higher input costs, like cement, decrease both the volume of projects the government is willing to start and the profit
margins for contractors. Delivery is the most significant cost factor and proximity to a supplier plays a large role in price
because the product is relatively cheap and sold in large, heavy quantities, which makes it a regional product. Because
of these factors, cement, like other building materials, has largely avoided being commoditized. The U.S. Geological
Survey determines the trend of cement prices, and its increase represents a negative sign for the industry.
$0
$20
$40
$60
$80
$100
$120
$140
$ pe
r Ton
Roads, Bridges, & HighwaysPrice of Cement
Price of Cement
Price of Cement
Period % Change
Y-o-Y 5.0%
Source: IBIS World | U.S. Geological Survey

© 2015 Mercer Capital // www.mercercapital.com 7
Mercer Capital’s Value Focus: Construction & Building Materials Third Quarter 2015
The yield on 10-Year Treasury Bonds can indirectly affect the road contracting industry. Higher interest rates make
construction projects more expensive to undertake. When yields on the 10-Year Treasury are low and stable, the
construction industry experiences increased investments and volume. When interest rates are high, it is more expensive
for the public sector to finance industry projects such as road building. As seen in the chart below, the 10-Year yield
has decreased 36 basis points over the past year, more than half of which occurred in this quarter alone. This can
signal an increase in investment as projects remain relatively inexpensive to finance. Especially with an impending
congressional highway bill, all signs point to increased investment, which would greatly benefit the roadbuilding sector
of the construction industry.
0.0%
1.0%
2.0%
3.0%
4.0%
5.0%
6.0%
Source: St. Louis Fed | Board of Governors of the Federal Reserve (US)
Roads, Bridges, & HighwaysYield on 10-Year Treasury
Yield on 10-Year Treasury
Yield on 10-Year Treasury
Period % Change
Q-o-Q -19 BPS
Y-o-Y -36 BPS

© 2015 Mercer Capital // www.mercercapital.com 8
Mercer Capital’s Value Focus: Construction & Building Materials Third Quarter 2015
The National Association of Home Builders uses surveys to produce two indices on the confidence level within the
homebuilding industry. For both surveys, respondents are asked to rate market conditions, with 50 being the index
average. Both indices show clear declines due to the housing crisis, but they have both increased and have been above
50 for over a year. HMI growth has slowed and RMI has actually declined. Crucially, they have both remained above 50.
While fluctuations will continue going forward, it is a positive sign as long as these indices are above average.
0
10
20
30
40
50
60
70
80
90
100
HMI RMI
Note: RMI is measured quarterly and approximated for a monthly basis using a straight-line approach. Source: National Association of Home Builders
Sector Round-upResidential Construction
NAHB Housing Market and Remodeling Market Indices
NAHB HMI
Period % Change
Q-o-Q 1.7%
Y-o-Y 3.4%
NAHB RMI
Period % Change
Q-o-Q -3.3%
Y-o-Y -0.9%
© 2015 Mercer Capital // www.mercercapital.com 9
Mercer Capital’s Value Focus: Construction & Building Materials Third Quarter 2015
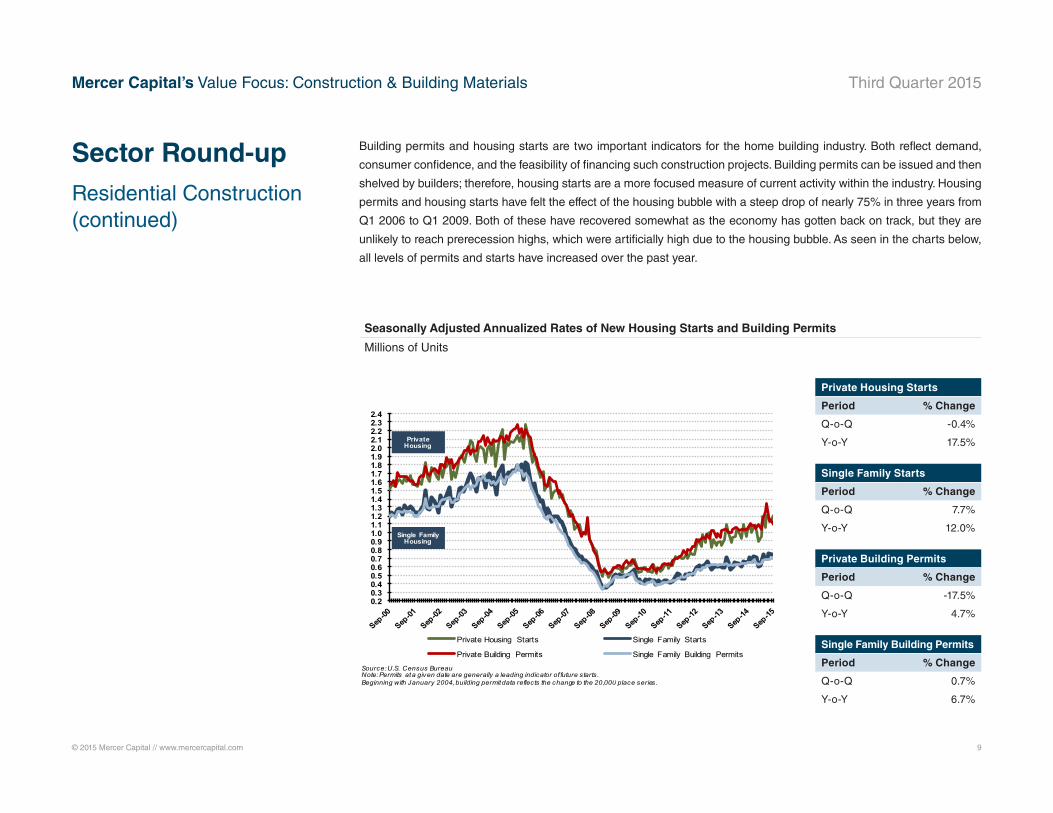
Building permits and housing starts are two important indicators for the home building industry. Both reflect demand,
consumer confidence, and the feasibility of financing such construction projects. Building permits can be issued and then
shelved by builders; therefore, housing starts are a more focused measure of current activity within the industry. Housing
permits and housing starts have felt the effect of the housing bubble with a steep drop of nearly 75% in three years from
Q1 2006 to Q1 2009. Both of these have recovered somewhat as the economy has gotten back on track, but they are
unlikely to reach prerecession highs, which were artificially high due to the housing bubble. As seen in the charts below,
all levels of permits and starts have increased over the past year.
Sector Round-upResidential Construction(continued)
Seasonally Adjusted Annualized Rates of New Housing Starts and Building Permits
Millions of Units
Private Housing Starts
Period % Change
Q-o-Q -0.4%
Y-o-Y 17.5%
Single Family Starts
Period % Change
Q-o-Q 7.7%
Y-o-Y 12.0%
Private Building Permits
Period % Change
Q-o-Q -17.5%
Y-o-Y 4.7%
Single Family Building Permits
Period % Change
Q-o-Q 0.7%
Y-o-Y 6.7%
0.20.30.40.50.60.70.80.91.01.11.21.31.41.51.61.71.81.92.02.12.22.32.4
Private Housing Starts Single Family Starts
Private Building Permits Single Family Building Permits
Source: U.S. Census BureauNote: Permits at a given date are generally a leading indicator of future starts. Beginning with January 2004, building permit data reflects the change to the 20,000 place series.
Private Housing
Single Family Housing

© 2015 Mercer Capital // www.mercercapital.com 10
Mercer Capital’s Value Focus: Construction & Building Materials Third Quarter 2015
Construction aggregates, asphalt, cement, and ready-mix concrete are all essential elements to building and maintaining
roads and highways. Companies that deal in building materials sell a sizeable amount of their products to publicly
funded projects. Therefore, government funding is an important driver for the industry, and companies benefit when
public spending increases. According to the chart below, GCI has increased modestly by 0.4% over the last quarter and
just 0.7% over the past year. If government spending remains low, the industry will feel the negative effects. This is not
expected to persist, however, with a large highway bill hopefully being completed soon.
$2,650
$2,700
$2,750
$2,800
$2,850
$2,900
$2,950
$3,000
$3,050
$3,100
$3,150
$Billions
Source: St. Louis Fed | U.S. Bureau of Economic Analysis
Sector Round-upBuilding Materials
Government Consumption and Investment
Government Consumption
and Investment
Period % Change
Q-o-Q 0.4%
Y-o-Y 0.7%
Source: St. Louis Fed | U.S. Bureau of Economic Analysis
© 2015 Mercer Capital // www.mercercapital.com 11
Mercer Capital’s Value Focus: Construction & Building Materials Third Quarter 2015
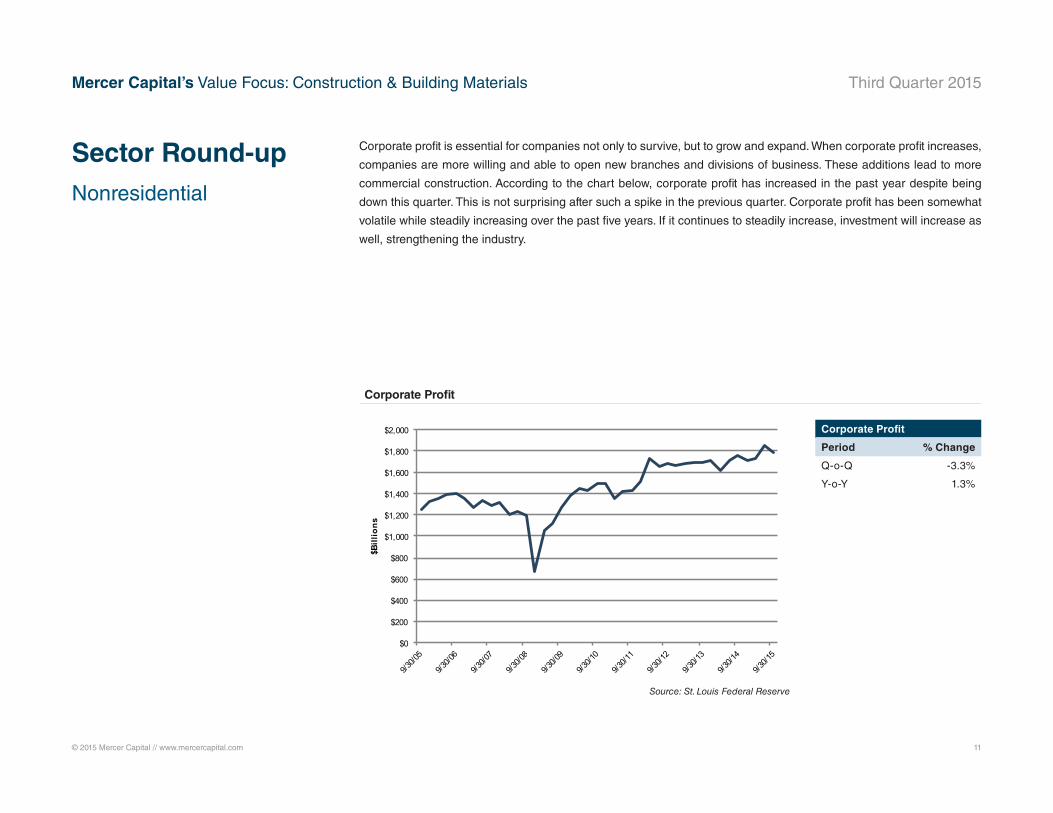
Corporate profit is essential for companies not only to survive, but to grow and expand. When corporate profit increases,
companies are more willing and able to open new branches and divisions of business. These additions lead to more
commercial construction. According to the chart below, corporate profit has increased in the past year despite being
down this quarter. This is not surprising after such a spike in the previous quarter. Corporate profit has been somewhat
volatile while steadily increasing over the past five years. If it continues to steadily increase, investment will increase as
well, strengthening the industry.
$0
$200
$400
$600
$800
$1,000
$1,200
$1,400
$1,600
$1,800
$2,000
$Billions
Sector Round-upNonresidential
Corporate Profit
Corporate Profit
Period % Change
Q-o-Q -3.3%
Y-o-Y 1.3%
Source: St. Louis Federal Reserve

© 2015 Mercer Capital // www.mercercapital.com 12
Mercer Capital’s Value Focus: Construction & Building Materials Third Quarter 2015
Announce
Date
Industry
Subsector Target/Issuer Buyers/Investors Seller Description
September 25Building
MaterialsCemex, Inc., Gypsum Wallboard
U.S. LBM Holdings,
LLCCEMEX, Inc.
Divestiture of division comprising a cement
manufacturing plant in the U.S.
August 28Building
Materials
E&A Materials, Inc.,
Select AssetsU.S. Concrete, Inc.
E & A Materials
Inc.
Divestiture of some sand and gravel operations in the
U.S.
August 28Building
Materials
Pitts Sand & Gravel, Inc.,
Select AssetsU.S. Concrete, Inc.
Pitts Sand &
Gravel, Inc.Divestiture of 2 sand and gravel operations in the U.S.
August 26 Nonresidential Moll's Utility Services, LLC Dycom Industries Provides construction services based in Hammond, WI.
August 25 Nonresidential TelCom Construction Inc. Dycom Industries Provides utility contractor services across the U.S.
August 18 NonresidentialAecon Group Inc., Atlantic Buildings
Divisions's Construction ActivitiesPomerleau Inc. Aecon Group Inc.
Divestiture of division that provides construction and
engineering services.
August 4Building
Materials
Martin Marietta Materials, Inc.,
California Cement Business Assets
CalPortland
Company, Inc.
Martin Marietta
Materials, Inc.
Divestiture of division business operations in California
manufacturing cement.
August 4Building
Materials
3 aggregates facilities and 7 ready mixed-
concrete operations in AZ and NM
Vulcan Materials
Company Not Stated
Aggregate and ready-mix concrete operations in NM and
AZ.
July 21 Home BuildingCharlotte, Raleigh, and Chicago
Operations and Homebuliding Assets
Taylor Morrison
Home Corporation
Orleans
Homebuilders, Inc.
Divestiture of certain operations and homebuilding
assets in Charlotte, Raleigh, and Chicago.
July 13 Nonresidential AECOM., Quality Programs BusinessSystem One Holdings,
LLCAECOM
Divestiture of division comprising workforce solutions,
quality engineering, product assurance, asset integrity, etc.
Source: Capital IQ
Mergers and Acquisitions
In recent M&A news, U.S. Concrete acquired sand and gravel operations again this quarter, Vulcan Materials added
aggregate and ready-mix facilities, and Martin Marietta sold their California cement business to CalPortland Com-
pany. The big move in building materials, however, was the close of the LafargeHolcim merger. They put the finishing
touches on their deal on July 10th after spending the last quarter announcing divestitures of certain assets to avoid
anti-trust regulation issues. Both sides called it a merger of equals, though the exchange favored Holcim with nine
of their shares going for 10 Lafarge shares. The headquarters of the new company will also be based in Switzerland,
Holcim’s native country. The giant corporation now services 90 countries, has combined net sales of €27 billion, and
can manufacture 368.5 million tons annually.

© 2015 Mercer Capital // www.mercercapital.com 13
Mercer Capital’s Value Focus: Construction & Building Materials Third Quarter 2015
Ticker Exchange
Stock Price at 9/30/15
LTM Price Range
Enterprise Value
LTMLTM
Margin EBITDA/
Rev.
LTM MultipleForward Multiples
High Low Rev. EBITDA EV/Rev. EV/EBITDAEV/
EBITDA
Residential
Beazer Homes USA Inc. BZH NYSE $13.33 $21.19 $13.01 $1,699.23 $1,627.41 $49.13 3% 1.2x 36.8x 12.6x
Comstock Holding Companies, Inc. CHCI Nasdaq 3.54 8.84 2.45 62.96 45.01 (2.06) -5% 1.2x NM 0.0x
DR Horton Inc. DHI NYSE 29.36 33.06 19.29 13,225.31 10,824.00 1,229.20 11% 1.4x 12.3x 10.9x
Hovnanian Enterprises Inc. HOV NYSE 1.77 4.42 1.37 2,363.35 2,153.67 34.93 2% 1.1x 57.1x 16.3x
KB Home KBH NYSE 13.55 18.10 11.76 3,524.61 2,842.29 151.27 5% 1.2x 23.0x 18.4x
Lennar Corporation LEN NYSE 48.13 56.04 37.50 16,466.65 9,112.38 1,135.29 12% 1.8x 13.1x 11.8x
LGI Homes, Inc. LGIH Nasdaq 27.19 30.17 12.21 752.66 561.89 72.22 13% 1.5x 12.3x 9.4x
MDC Holdings Inc. MDC NYSE 26.18 31.23 23.67 2,010.89 1,835.80 107.50 6% 1.1x 19.0x 11.9x
NVR, Inc. NVR NYSE 1,525.22 1,610.00 1,050.95 6,417.56 4,940.67 591.68 12% 1.3x 11.5x 10.6x
PulteGroup, Inc. PHM NYSE 18.87 23.36 16.56 8,176.66 5,742.89 754.20 13% 1.4x 10.1x 9.2x
Toll Brothers Inc. TOL NYSE 34.24 42.19 28.92 8,957.97 4,084.74 484.84 12% 2.2x 17.7x 15.6x
Median $26.18 $30.17 $16.56 $3,524.61 $2,842.29 $151.27 11% 1.3x 15.4x 11.8x
Average $158.31 $170.78 $110.70 $5,787.08 $3,979.16 $418.93 8% 1.4x 21.3x 11.5x
All figures reported in millions, except per share data
Source: Capital IQ
Bellwether Stocks & Industry Participants
© 2015 Mercer Capital // www.mercercapital.com 14
Mercer Capital’s Value Focus: Construction & Building Materials Third Quarter 2015
Ticker Exchange
Stock Price at 9/30/15
LTM Price Range
Enterprise Value
LTMLTM
Margin EBITDA/
Rev.
LTM MultipleForward Multiples
High Low Rev. EBITDA EV/Rev. EV/EBITDAEV/
EBITDA
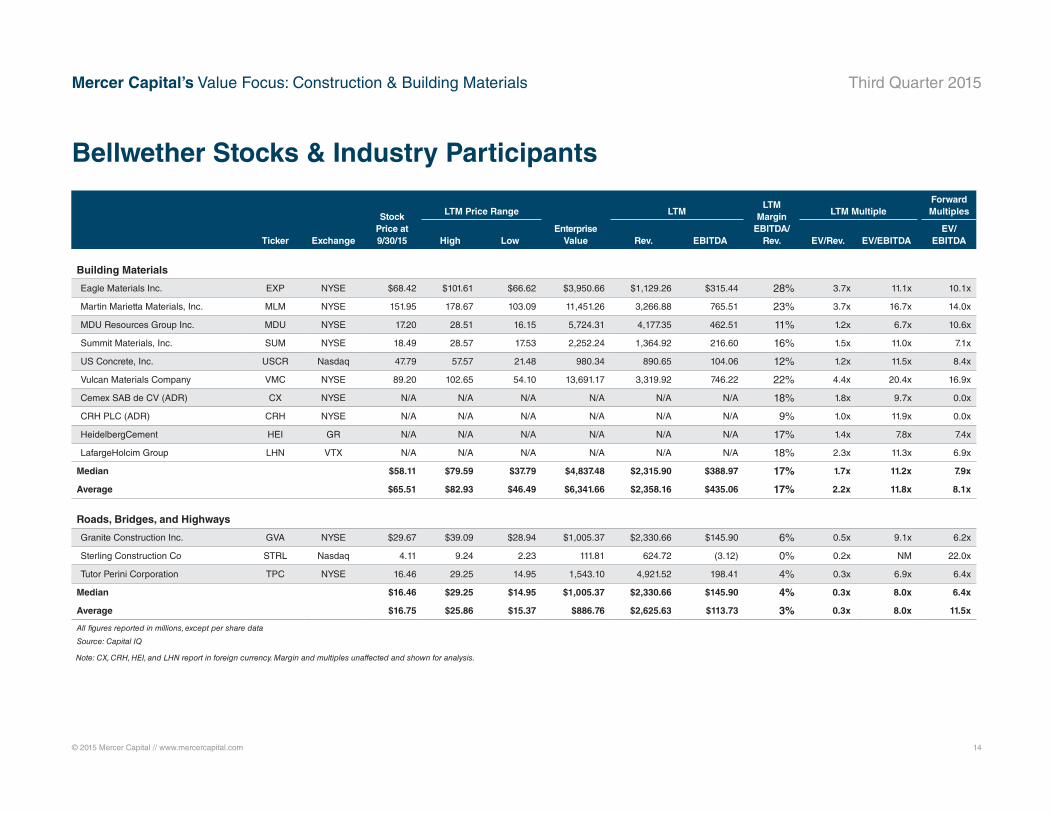
Building Materials
Eagle Materials Inc. EXP NYSE $68.42 $101.61 $66.62 $3,950.66 $1,129.26 $315.44 28% 3.7x 11.1x 10.1x
Martin Marietta Materials, Inc. MLM NYSE 151.95 178.67 103.09 11,451.26 3,266.88 765.51 23% 3.7x 16.7x 14.0x
MDU Resources Group Inc. MDU NYSE 17.20 28.51 16.15 5,724.31 4,177.35 462.51 11% 1.2x 6.7x 10.6x
Summit Materials, Inc. SUM NYSE 18.49 28.57 17.53 2,252.24 1,364.92 216.60 16% 1.5x 11.0x 7.1x
US Concrete, Inc. USCR Nasdaq 47.79 57.57 21.48 980.34 890.65 104.06 12% 1.2x 11.5x 8.4x
Vulcan Materials Company VMC NYSE 89.20 102.65 54.10 13,691.17 3,319.92 746.22 22% 4.4x 20.4x 16.9x
Cemex SAB de CV (ADR) CX NYSE N/A N/A N/A N/A N/A N/A 18% 1.8x 9.7x 0.0x
CRH PLC (ADR) CRH NYSE N/A N/A N/A N/A N/A N/A 9% 1.0x 11.9x 0.0x
HeidelbergCement HEI GR N/A N/A N/A N/A N/A N/A 17% 1.4x 7.8x 7.4x
LafargeHolcim Group LHN VTX N/A N/A N/A N/A N/A N/A 18% 2.3x 11.3x 6.9x
Median $58.11 $79.59 $37.79 $4,837.48 $2,315.90 $388.97 17% 1.7x 11.2x 7.9x
Average $65.51 $82.93 $46.49 $6,341.66 $2,358.16 $435.06 17% 2.2x 11.8x 8.1x
Roads, Bridges, and Highways
Granite Construction Inc. GVA NYSE $29.67 $39.09 $28.94 $1,005.37 $2,330.66 $145.90 6% 0.5x 9.1x 6.2x
Sterling Construction Co STRL Nasdaq 4.11 9.24 2.23 111.81 624.72 (3.12) 0% 0.2x NM 22.0x
Tutor Perini Corporation TPC NYSE 16.46 29.25 14.95 1,543.10 4,921.52 198.41 4% 0.3x 6.9x 6.4x
Median $16.46 $29.25 $14.95 $1,005.37 $2,330.66 $145.90 4% 0.3x 8.0x 6.4x
Average $16.75 $25.86 $15.37 $886.76 $2,625.63 $113.73 3% 0.3x 8.0x 11.5x
All figures reported in millions, except per share data
Source: Capital IQ
Bellwether Stocks & Industry Participants
Note: CX, CRH, HEI, and LHN report in foreign currency. Margin and multiples unaffected and shown for analysis.
© 2015 Mercer Capital // www.mercercapital.com 15
Mercer Capital’s Value Focus: Construction & Building Materials Third Quarter 2015
Ticker Exchange
Stock Price at 9/30/15
LTM Price Range
Enterprise Value
LTMLTM
Margin EBITDA/
Rev.
LTM MultipleForward Multiples
High Low Rev. EBITDA EV/Rev. EV/EBITDAEV/
EBITDA
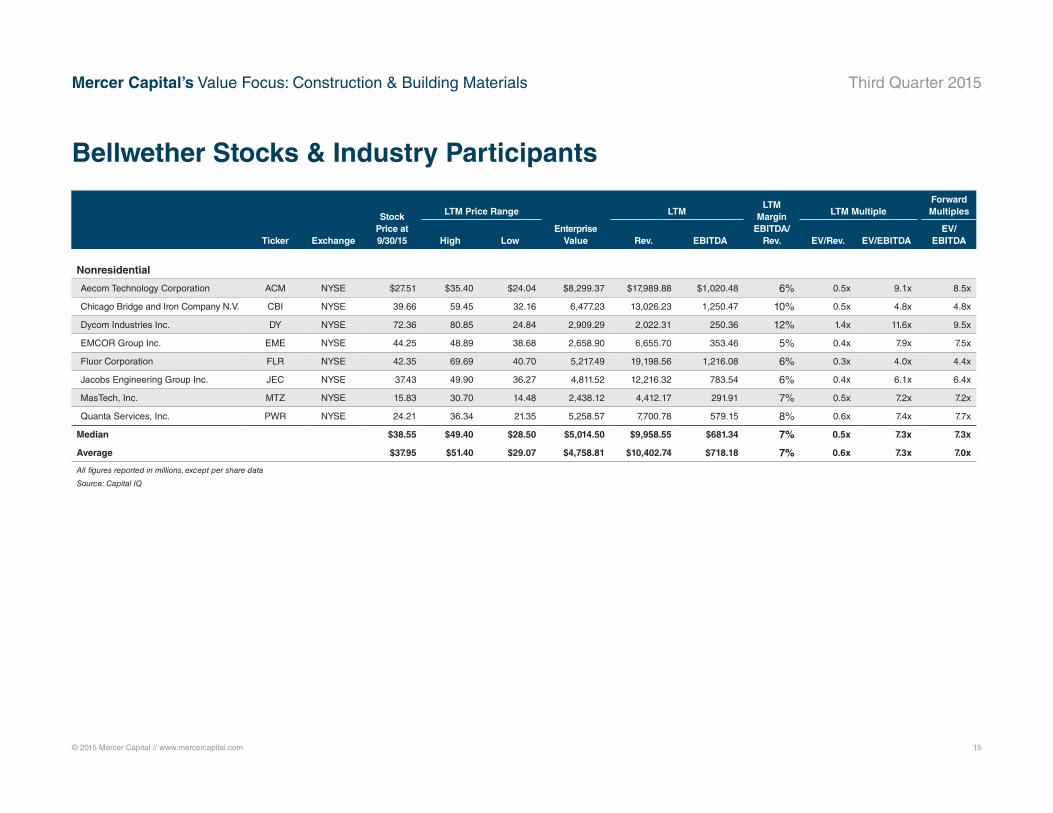
Nonresidential
Aecom Technology Corporation ACM NYSE $27.51 $35.40 $24.04 $8,299.37 $17,989.88 $1,020.48 6% 0.5x 9.1x 8.5x
Chicago Bridge and Iron Company N.V. CBI NYSE 39.66 59.45 32.16 6,477.23 13,026.23 1,250.47 10% 0.5x 4.8x 4.8x
Dycom Industries Inc. DY NYSE 72.36 80.85 24.84 2,909.29 2,022.31 250.36 12% 1.4x 11.6x 9.5x
EMCOR Group Inc. EME NYSE 44.25 48.89 38.68 2,658.90 6,655.70 353.46 5% 0.4x 7.9x 7.5x
Fluor Corporation FLR NYSE 42.35 69.69 40.70 5,217.49 19,198.56 1,216.08 6% 0.3x 4.0x 4.4x
Jacobs Engineering Group Inc. JEC NYSE 37.43 49.90 36.27 4,811.52 12,216.32 783.54 6% 0.4x 6.1x 6.4x
MasTech, Inc. MTZ NYSE 15.83 30.70 14.48 2,438.12 4,412.17 291.91 7% 0.5x 7.2x 7.2x
Quanta Services, Inc. PWR NYSE 24.21 36.34 21.35 5,258.57 7,700.78 579.15 8% 0.6x 7.4x 7.7x
Median $38.55 $49.40 $28.50 $5,014.50 $9,958.55 $681.34 7% 0.5x 7.3x 7.3x
Average $37.95 $51.40 $29.07 $4,758.81 $10,402.74 $718.18 7% 0.6x 7.3x 7.0x
All figures reported in millions, except per share data
Source: Capital IQ
Bellwether Stocks & Industry Participants

Mercer CapitalConstruction & Building Materials Industry Services
Contact Us
Copyright © 2015 Mercer Capital Management, Inc. All rights reserved. It is illegal under Federal law to reproduce this publication or any portion of its contents without the publisher’s permission. Media quotations with source attribution are encouraged.
Reporters requesting additional information or editorial comment should contact Barbara Walters Price at 901.685.2120. Mercer Capital’s Industry Focus is published quarterly and does not constitute legal or financial consulting advice. It is offered as an
information service to our clients and friends. Those interested in specific guidance for legal or accounting matters should seek competent professional advice. Inquiries to discuss specific valuation matters are welcomed. To add your name to our mailing list
to receive this complimentary publication, visit our web site at www.mercercapital.com.
Mercer Capital provides valuation and transaction advisory services to the construction and building materials industries.
Industry Segments
Mercer Capital serves construction industry segments from to commercial and civil to residential. We also serve the
building materials sector from aluminum and steel to brick, glass, and lumber.
Mercer Capital Experience
• Family and management succession planning
• Buy-side and sell-side transaction advisory assistance
• Conflict resolution and litigation support
• Trust and estate planning
• Buy-sell agreement valuation, design, and funding advisory
Contact a Mercer Capital professional to discuss your needs in confidence.
Timothy R. Lee, ASA
901.322.9740
Nicholas J. Heinz
901.685.2120
MERCER CAPITAL
Memphis
5100 Poplar Avenue, Suite 2600
Memphis, Tennessee 38137
901.685.2120
Dallas
12201 Merit Drive, Suite 480
Dallas, Texas 75251
214.468.8400
Nashville
102 Woodmont Blvd., Suite 231
Nashville, Tennessee 37205
615.345.0350
www.mercercapital.com
BUSINESS VALUATION & FINANCIAL ADVISORY SERVICES