mercer capital's value focus: fintech industry | second quarter 2016
TRANSCRIPT

VALUE FOCUS
BUSINESS VALUATION & FINANCIAL ADVISORY SERVICES
FinTech Industry
www.mercercapital.com
About Mercer Capital 1
Three Reasons to Consider a Valuation of Your FinTech Company 2
FinTech Industry Overview Public Market Indicators 5Mercer Capital FinTech Indices vs. S&P 500 5Median Total Return 5Valuation Multiples 6FinTech Margins 6FinTech Revenue Multiples 6FinTech EBITDA Multiples 6
FinTech IPO Watch 7
FinTech M&A 1H16 vs. 1H15 81H16 Largest FinTech M&A Overview 9
FinTech Venture Capital Activity Overview 10
Venture Capital Case Study: FutureAdvisor 15
Publicly Traded FinTech Companies 18Payments 18Solutions 20Technology 22
Second Quarter 2016
Mercer CapitalFinancial Technology Industry Services
Contact Us
Copyright © 2016 Mercer Capital Management, Inc. All rights reserved. It is illegal under Federal law to reproduce this publication or any portion of its contents without the publisher’s permission. Media quotations with source attribution are encouraged. Reporters
requesting additional information or editorial comment should contact Barbara Walters Price at 901.685.2120. Mercer Capital’s Industry Focus is published quarterly and does not constitute legal or financial consulting advice. It is offered as an information service to
our clients and friends. Those interested in specific guidance for legal or accounting matters should seek competent professional advice. Inquiries to discuss specific valuation matters are welcomed. To add your name to our mailing list to receive this complimentary
publication, visit our web site at www.mercercapital.com.
Mercer Capital provides financial technology companies with valuation, financial advisory, and consulting services.
BUSINESS VALUATION & FINANCIAL ADVISORY SERVICES
Mercer Capital provides valuations for a variety of purposes including, corporate/strategic planning, transactions (fairness opinion
and M&A), equity compensation (409A compliance, ESOPs, and stock option programs), and financial statement reporting
(purchase price allocations, impairment testing, equity compensation). Additionally, Mercer Capital provides related financial
advisory and consulting services for companies across the corporate lifecycle — from start-ups to more mature companies.
Services Provided
• Valuation of financial technology companies
• Financial advisory/valuations for acquisitions and divestitures
• Valuations for purchase accounting and impairment testing
• Fairness and solvency opinions
• Litigation support for economic damages and valuation and shareholder disputes
• Consulting and board presentations for corporate and strategic planning
Contact a Mercer Capital professional to discuss your needs in confidence.
Jay D. Wilson, CFA, ASA, CBA
901.322.9725
Matthew R. Crow, CFA, ASA
901.685.2120
Jeff K. Davis, CFA
615.345.0350
Follow Mercer Capital on Social Media
@MercerFinTech @MercerCapital Mercer Capital
www.mercercapital.com
Memphis | Dallas | Nashville

View past issues and subscribe for future updates to the quarterly FinTech newsletter at mer.cr/1holYIf© 2016 Mercer Capital // Business Valuation & Financial Advisory Services // www.mercercapital.com
2
Mercer Capital’s Value Focus: FinTech IndustrySecond Quarter 2016
@MercerFinTech
Three Reasons to Consider a Valuation of Your FinTech Company by Jay D. Wilson, Jr., CFA, ASA, CBA
“Nowadays people know the price of everything and the value of nothing.”
– Oscar Wilde, The Picture of Dorian Gray
The above quote seems especially apt in the FinTech industry because the implied
values of high-profile, private FinTech companies are often mistakenly reported by
the media based on the share price paid by investors in a recently completed funding
round. The problem with applying the pricing of the most recent raise to all shares is
that the media rarely knows about investor preferences attributable to each funding.
As a result, the value of the company is most likely overstated. Capital structures and
shareholder preferences matter. Pari passu is not a given although it is often implicitly
implied in media reports.
Consider the following example. Investors in a late-stage funding invest $100 million in
return for 100,000 convertible preferred shares that represent 10% of the company’s post-
raise fully diluted shares. The investors also get certain economic, control rights and other
preferences with their preferred shares that earlier investors did not obtain. The headline
notes that a new FinTech Unicorn has arrived because the implied value is $1 billion based
upon the $100 million investment for the 10% interest; however, this simple calculation
typically will overstate the Company’s value because the majority of the shares do not have
the same rights and preferences as those purchased in the most recent financing round.
Valuing companies with limited if any operating history that involves a new technology
is inherently difficult. The challenge increases when the subject has a complex capital
structure. Nevertheless, valuations—whether reasonable or unreasonable—have
very real economic consequences for investors, employees and other stakeholders,
especially when new capital is injected into the equation. We are biased, but we believe
private FinTech companies will be well served over the long-run to obtain periodic
valuations from independent third parties. Reasons to do so include the following.
1. To Measure Value Creation Over Time
One of the best performance scorecard metrics to measure is value creation over extended
time periods. For public companies, it is a simple process. Measure a company’s total
return (percentage change in share price plus the return from reinvested dividends) and
compare it to other benchmark measures such as the broader market, industry, and/
or peers. For example, a publicly traded payments company whose shareholders have
achieved a one-year total return of 10.0% can note on their scorecard that their performance
has outpaced the returns from the S&P 500 and Mercer Capital’s FinTech Payments Index,
which rose 4.0% and 4.6%, respectively, in the twelve months ended June 30, 2016.
For private companies, annual or more frequent valuations have to be obtained to
create a realistic scorecard. Rules-of-thumb exist in every industry, but they are at
best approximations and often haphazard guesses that do not take into account the
key value drivers of earning power (or cash flow generation), growth, and risk. Some
privately held financial services companies like banks may be able to proxy value
creation without annual valuations by tracking growth in book value, ROE, and dividend
payments, but even for homogenous entities such as banks these metrics say nothing
about an institution’s risk profile. FinTech companies with little homogeneity among
View past issues and subscribe for future updates to the quarterly FinTech newsletter at mer.cr/1holYIf© 2016 Mercer Capital // Business Valuation & Financial Advisory Services // www.mercercapital.com
3
Mercer Capital’s Value Focus: FinTech IndustrySecond Quarter 2016
@MercerFinTech
business models are poorly suited to measure value based upon rules-of-thumbs that
are applied to revenues or even EBITDA. Every company is unique, and markets in
which companies are valued are not static.
Also, there may be a tendency to overlook balance sheets beyond cash because FinTech
balance sheets typically do not “drive” earning power as intangible assets, such as
customer databases, intellectual property, patents, and the like, are not recorded unless
there has been an acquisition. While understandable, ignoring the balance sheet can
be a mistake because sometimes there are aspects to it that will impact value.
Additionally, dividends (the other element of shareholder return) and dividend paying capacity
should be an important value consideration, even though FinTech companies often do not or
cannot pay dividends in order to reinvest internally generated capital to fund future growth.
Another benefit of the valuation process might be insight that suggests the board should shift
to distributions from reinvestment because incremental returns are too low to justify.
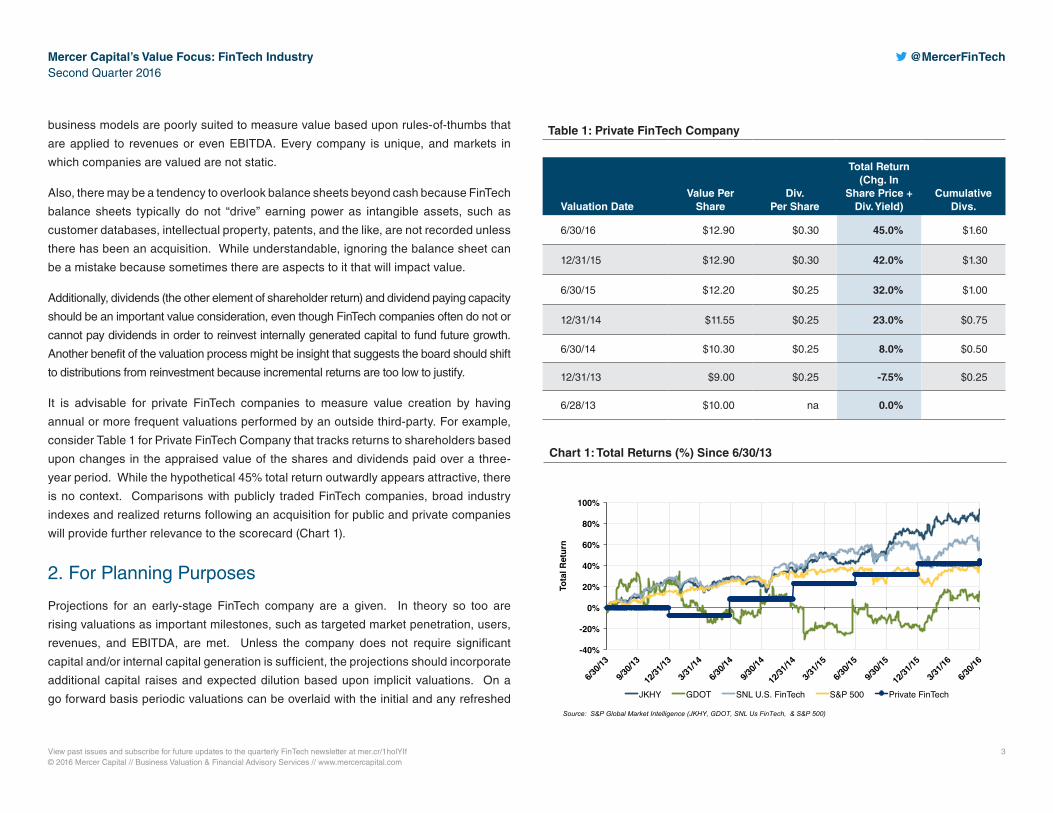
It is advisable for private FinTech companies to measure value creation by having
annual or more frequent valuations performed by an outside third-party. For example,
consider Table 1 for Private FinTech Company that tracks returns to shareholders based
upon changes in the appraised value of the shares and dividends paid over a three-
year period. While the hypothetical 45% total return outwardly appears attractive, there
is no context. Comparisons with publicly traded FinTech companies, broad industry
indexes and realized returns following an acquisition for public and private companies
will provide further relevance to the scorecard (Chart 1).
2. For Planning Purposes
Projections for an early-stage FinTech company are a given. In theory so too are
rising valuations as important milestones, such as targeted market penetration, users,
revenues, and EBITDA, are met. Unless the company does not require significant
capital and/or internal capital generation is sufficient, the projections should incorporate
additional capital raises and expected dilution based upon implicit valuations. On a
go forward basis periodic valuations can be overlaid with the initial and any refreshed
Table 1: Private FinTech Company
Valuation DateValue Per
ShareDiv.
Per Share
Total Return (Chg. In
Share Price + Div. Yield)
Cumulative Divs.
6/30/16 $12.90 $0.30 45.0% $1.60
12/31/15 $12.90 $0.30 42.0% $1.30
6/30/15 $12.20 $0.25 32.0% $1.00
12/31/14 $11.55 $0.25 23.0% $0.75
6/30/14 $10.30 $0.25 8.0% $0.50
12/31/13 $9.00 $0.25 -7.5% $0.25
6/28/13 $10.00 na 0.0%
Chart 1: Total Returns (%) Since 6/30/13
-40%!
-20%!
0%!
20%!
40%!
60%!
80%!
100%!
6/30/1
3!
9/30/1
3!
12/31
/13!
3/31/1
4!
6/30/1
4!
9/30/1
4!
12/31
/14!
3/31/1
5!
6/30/1
5!
9/30/1
5!
12/31
/15!
3/31/1
6!
6/30/1
6!
Tota
l Ret
urn!
JKHY! GDOT! SNL U.S. FinTech! S&P 500! Private FinTech!
Source: S&P Global Market Intelligence (JKHY, GDOT, SNL Us FinTech, & S&P 500)

View past issues and subscribe for future updates to the quarterly FinTech newsletter at mer.cr/1holYIf© 2016 Mercer Capital // Business Valuation & Financial Advisory Services // www.mercercapital.com
4
Mercer Capital’s Value Focus: FinTech IndustrySecond Quarter 2016
@MercerFinTech
forecasts to measure how the company is progressing in terms of value creation relative
to plan and to alternatives (e.g., a strategy pivot to a collaborative partnership from
disruptor). The key is to measure and compare in order to have a contextual perspective
to facilitate decision making.
3. For Employee Ownership Plans
FinTech companies usually attract talent by offering stock ownership so that employees
share in the upside should the company’s valuation improve over time. Plus, stock-
based compensation lessens a company’s cash needs all else equal. Complex capital
structures with private equity investors that have preferences vis-a-vie employees
create another potential valuation wrinkle. Returns to the two groups usually will
differ. Well documented, periodic valuations are critical. There have been examples
where employees have lost money by paying taxes based upon valuations higher than
the company realized in a sale. While downside exposure to a company’s faltering
performance and/or market conditions is the risk that comes with the potential upside of
equity ownership, it is important to have a formalized valuation process to demonstrate
compliance with tax and financial reporting regulations. Certainly, scrutiny from auditors,
the SEC, and/or the IRS are likely at some point, but very real tax issues also can result
from poorly structured or administered equity compensation plans for employees.
Conclusion
If you are interested in discussing the valuation needs for your FinTech company,
please contact us. Depending upon how it is defined FinTech is a relatively new industry
“vertical.” Mercer Capital has been providing valuation and transaction advisory services
to a wide swath of financial services companies for over 30 years that runs the gamut
from banks to FinTech. Financials are our largest practice vertical. We have a deep
bench and would be delighted to assist.
Jay D. Wilson, Jr., CFA, ASA, CBA
[email protected] | 901.322.9725
What We’re Reading
FinTech Poses No. 1 Threat to Community Banks, Execs Tell FDIC
In a recent meeting with the FDIC, many community bankers voiced their fears
about the potential disruption that FinTech could have on their business models.
Cost-Conscious Small Businesses Want Better Bank Tech
American Banker examines small businesses’ calls for their banks to adopt more
up to date technology.
FinTech Startup Craves More Regulation
Digital payment FinTech companies are beginning to explore special purpose
charters from the OCC that would subject them to some of the same regulatory
scrutiny as banks.
(subscription required)
FinTech and Financial Inclusion
In a blog post from the Wall Street Journal, FinTech is hailed as a vehicle of
financial inclusion in underbanked emerging markets.
(subscription required)
FINTECH NEWSLETTER: ARTICLES
Each quarter, the FinTech newsletter features an article on a valuation or financial advisory topic. Past articles include: “Preferences and FinTech Valuations” and “How to Value FinTech Venture Capital Portfolio Investments.”
View Past Issues or Subscribe
View past issues and subscribe for future updates to the quarterly FinTech newsletter at mer.cr/1holYIf© 2016 Mercer Capital // Business Valuation & Financial Advisory Services // www.mercercapital.com
5
Mercer Capital’s Value Focus: FinTech IndustrySecond Quarter 2016
@MercerFinTech
80 !
85 !
90 !
95 !
100 !
105 !
110 !
115 !
120 !
6/30/1
5!
7/31/1
5!
8/31/1
5!
9/30/1
5!
10/31
/15!
11/30
/15!
12/31
/15!
1/31/1
6!
2/29/1
6!
3/31/1
6!
4/30/1
6!
5/31/1
6!
June
30,
201
5 =
100!
MCM FinTech Indices vs. S&P 500 for LTM Period
S&P 500! FinTech - Solutions!FinTech - Payments! FinTech - Technology!
Median Total Returnas of June 30, 2016
Segment
Month-to-
Date YTD 16 LTM 6/16
FinTech - Pay- -4.2% -2.8% 4.6%
FinTech - Solutions 0.7% 12.7% 16.1%
FinTech - Tech- 1.9% 7.8% 8.2%
S&P 500 0.3% 3.8% 4.0%
Source: S&P Global Market Intelligence
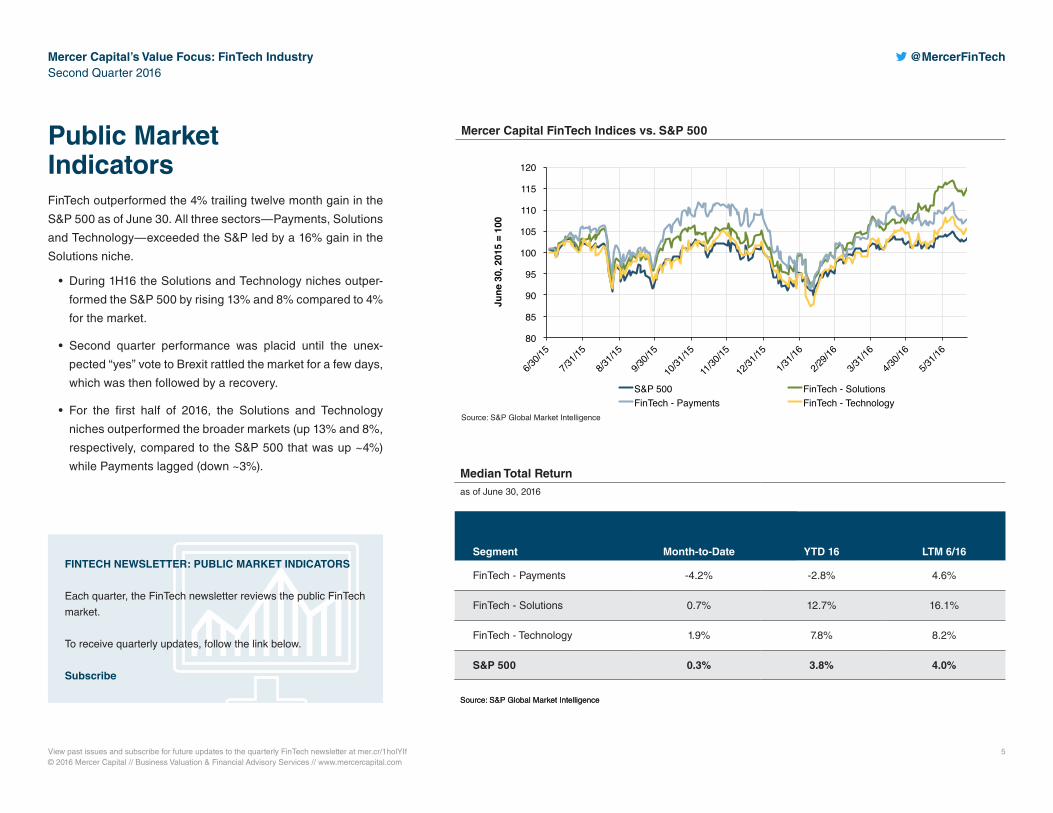
Public Market IndicatorsFinTech outperformed the 4% trailing twelve month gain in the
S&P 500 as of June 30. All three sectors—Payments, Solutions
and Technology—exceeded the S&P led by a 16% gain in the
Solutions niche.
• During 1H16 the Solutions and Technology niches outper-
formed the S&P 500 by rising 13% and 8% compared to 4%
for the market.
• Second quarter performance was placid until the unex-
pected “yes” vote to Brexit rattled the market for a few days,
which was then followed by a recovery.
• For the first half of 2016, the Solutions and Technology
niches outperformed the broader markets (up 13% and 8%,
respectively, compared to the S&P 500 that was up ~4%)
while Payments lagged (down ~3%).
Mercer Capital FinTech Indices vs. S&P 500
Source: S&P Global Market Intelligence
Median Total Returnas of June 30, 2016
Segment Month-to-Date YTD 16 LTM 6/16
FinTech - Payments -4.2% -2.8% 4.6%
FinTech - Solutions 0.7% 12.7% 16.1%
FinTech - Technology 1.9% 7.8% 8.2%
S&P 500 0.3% 3.8% 4.0%
Source: S&P Global Market Intelligence
FINTECH NEWSLETTER: PUBLIC MARKET INDICATORS
Each quarter, the FinTech newsletter reviews the public FinTech market.
To receive quarterly updates, follow the link below.
Subscribe

View past issues and subscribe for future updates to the quarterly FinTech newsletter at mer.cr/1holYIf© 2016 Mercer Capital // Business Valuation & Financial Advisory Services // www.mercercapital.com
6
Mercer Capital’s Value Focus: FinTech IndustrySecond Quarter 2016
@MercerFinTech
Valuation Multiples
as of June 30, 2016
Segment
Price /
LTM EPS
Price /
2016 (E) EPS
Price /
2017 (E) EPS
Ent'p Value /
LTM EBITDA
Ent'p Value /
FY16 (E) EBITDA
Ent'p Value /
FY17 (E) EBITDA
Ent’p Value /
LTM Revenue
FinTech - Payments 28.4 18.0 16.2 14.7 10.9 9.9 2.8
FinTech - Solutions 36.5 24.6 21.8 16.6 12.4 11.3 3.4
FinTech - Technology 39.6 27.4 23.3 16.9 13.2 12.1 3.9
Source: S&P Global Market Intelligence
• Consistent with superior historical growth and mostly favorable near-term outlooks, FinTech companies remain priced at a premium to the broader market with the S&P 500
trading at 16.4x estimated forward earnings at 7/1/16 (per FactSet).
• FinTech generally has been viewed as a long-term growth sector in a low-growth world, which enhances its investor appeal.
• Investor interest in FinTech remains high, in our view. However, investors continue to weigh competitive threats from incumbents as well as other startups, continuing
technological change, and regulatory/business model risk.
FinTech MarginsEBITDA Margin (LTM)
FinTech Revenue MultiplesEV / Revenue (LTM)
FinTech EBITDA MultiplesEV / EBITDA (LTM)
0.00 !
5.00 !
10.00 !
15.00 !
20.00 !
25.00 !
Proces
sors!
Software
/Hardware
!
Bank T
ech!
Ins./H
ealth
care
Tech!
Invt't T
ech!
Outsou
rced!
Payrol
l/Adm
inistra
tive!
Conten
t!0.00 !
1.00 !
2.00 !
3.00 !
4.00 !
5.00 !
6.00 !
Proces
sors!
Software
/Hardware
!
Bank T
ech!
Ins./H
ealth
care
Tech!
Invt't T
ech!
Outsou
rced!
Payrol
l/Adm
inistra
tive!
Conten
t!0.0%!
5.0%!
10.0%!
15.0%!
20.0%!
25.0%!
30.0%!
Proces
sors!
Software
/Hardware
!
Bank T
ech!
Ins./H
ealth
care
Tech!
Invt't T
ech!
Outsou
rced!
Payrol
l/Adm
inistra
tive!
Conten
t!
Source: S&P Global Market Intelligence Source: S&P Global Market Intelligence Source: S&P Global Market Intelligence
Payments Technology Solutions Payments Technology Solutions Payments Technology Solutions

Source: S&P Global Market Intelligence View past issues and subscribe for future updates to the quarterly FinTech newsletter at mer.cr/1holYIf© 2016 Mercer Capital // Business Valuation & Financial Advisory Services // www.mercercapital.com
7
Mercer Capital’s Value Focus: FinTech IndustrySecond Quarter 2016
@MercerFinTech
• IPO activity slowed sharply in late 2015 and early 2016 as concerns about future Fed rate hikes,
widening credit spreads, sharp deterioration in the once booming U.S. energy sector, Brexit, and
other factors weighed on markets in the form of lower valuations across sectors.
• Whether IPO investors were on strike or PE-backed firms were not willing to accept lower IPO valua-
tions, there were no FinTech IPOs during 1H16 compared to eight in 2015 and 16 in 2014.
• Another factor weighing on activity is poor performance with three of the eight IPOs in 2015 reporting
a share price decline greater than 30% from the IPO.
• Declines for some notwithstanding, the median increase for the recent IPO group was 7%.
• Three FinTech IPOs occurred in 4Q15, including payments companies Square and First Data.
FinTech IPO Watch
IPO Date
Gross Proceeds
($M)
% Return Since IPO
6/30/16 Price
6/30/16 Mkt Cap ($M)
6/30/16 Ent Val
($M)
LTM
Ticker NameIPO
Price Rev ($M)
EBITDA ($M) FinTech Niche Description
INOV Inovalon Holdings, Inc. $27.00 2/11/15 $685 -33.3% $18.01 2,744 2,274 453 111 Insurance/Healthcare Solutions
Provides cloud-based data analytics systems to the healthcare industry
BKFSBlack Knight Financial Services, Inc.
$24.50 5/19/15 $507 53.5% $37.60 2,598 5,223 969 340 OutsourcingProvider of integrated technology, data and analytics solutions
EVH Evolent Health, Inc. $17.00 6/4/15 $225 12.9% $19.20 1,154 1,252 192 (46)Insurance/Healthcare Solutions
Partners with health systems to provide value-based care transformation
TRU TransUnion $22.50 6/24/15 $764 48.6% $33.44 6,108 8,514 1,607 511 Financial Media & Content
Risk and information solutions provider to busi-nesses and consumers
XTLY Xactly Corporation $8.00 6/25/15 $65 60.1% $12.81 386 355 81 (17)Payroll & Administrative Solutions
Provider of cloud-based, incentive compensation solutions
PMTS CPI Card Group, Inc. $10.00 10/8/15 $173 -49.9% $5.01 283 562 361 73 Payment ProcessorsProvider of payment card production and related services, offering a single source for financial and prepaid debit cards
FDC First Data Corporation $16.00 10/14/15 $2,817 -30.8% $11.07 10,046 31,922 7,842 2,378 Payment ProcessorsGlobal payment processor and commerce-enabling technology and solutions provider
SQ Square, Inc. $9.00 11/18/15 $279 0.6% $9.05 3,035 2,631 1,524 (91) Payment ProcessorsPoint-of sale payment service and solutions provider
Median $393 6.7% 2,671 2,453 711 92
2015 & 1H16 FinTech IPOs
Source: S&P Global Market Intelligence View past issues and subscribe for future updates to the quarterly FinTech newsletter at mer.cr/1holYIf© 2016 Mercer Capital // Business Valuation & Financial Advisory Services // www.mercercapital.com
8
Mercer Capital’s Value Focus: FinTech IndustrySecond Quarter 2016
@MercerFinTech
FinTech M&A
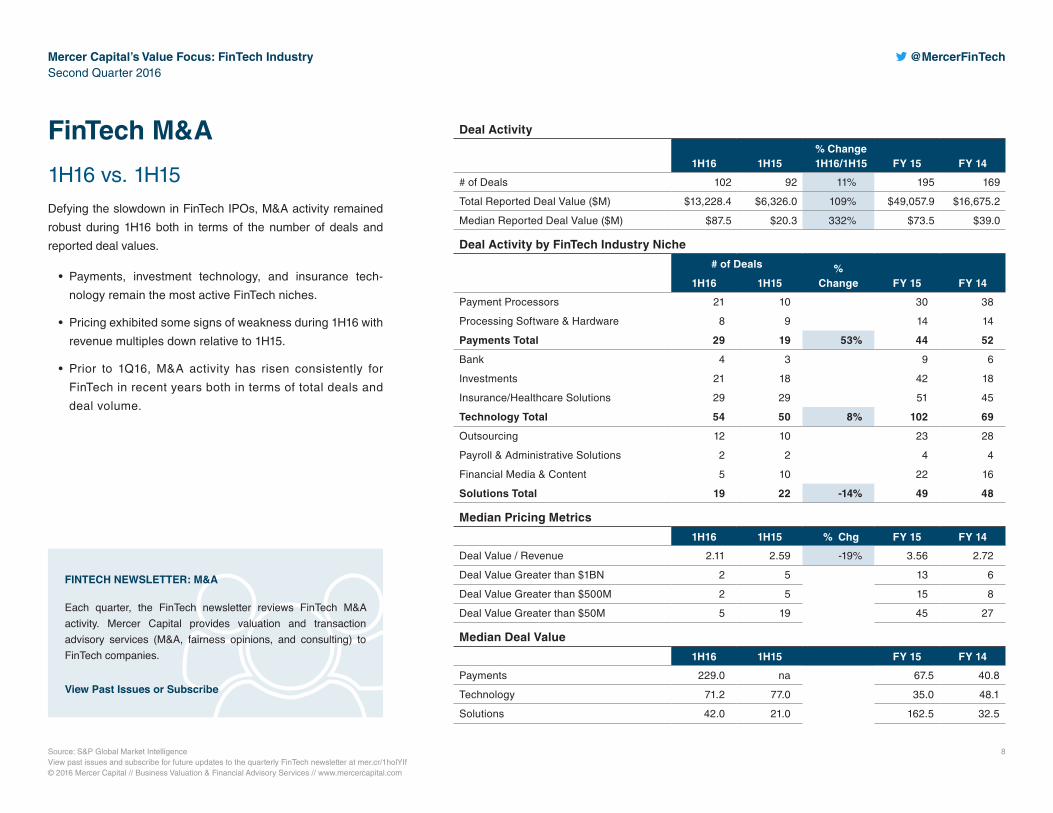
1H16 vs. 1H15Defying the slowdown in FinTech IPOs, M&A activity remained
robust during 1H16 both in terms of the number of deals and
reported deal values.
• Payments, investment technology, and insurance tech-
nology remain the most active FinTech niches.
• Pricing exhibited some signs of weakness during 1H16 with
revenue multiples down relative to 1H15.
• Prior to 1Q16, M&A activity has risen consistently for
FinTech in recent years both in terms of total deals and
deal volume.
Deal Activity
1H16 1H15% Change1H16/1H15 FY 15 FY 14
# of Deals 102 92 11% 195 169
Total Reported Deal Value ($M) $13,228.4 $6,326.0 109% $49,057.9 $16,675.2
Median Reported Deal Value ($M) $87.5 $20.3 332% $73.5 $39.0
Deal Activity by FinTech Industry Niche
# of Deals %Change FY 15 FY 141H16 1H15
Payment Processors 21 10 30 38
Processing Software & Hardware 8 9 14 14
Payments Total 29 19 53% 44 52
Bank 4 3 9 6
Investments 21 18 42 18
Insurance/Healthcare Solutions 29 29 51 45
Technology Total 54 50 8% 102 69
Outsourcing 12 10 23 28
Payroll & Administrative Solutions 2 2 4 4
Financial Media & Content 5 10 22 16
Solutions Total 19 22 -14% 49 48
Median Pricing Metrics
1H16 1H15 % Chg FY 15 FY 14
Deal Value / Revenue 2.11 2.59 -19% 3.56 2.72
Deal Value Greater than $1BN 2 5 13 6
Deal Value Greater than $500M 2 5 15 8
Deal Value Greater than $50M 5 19 45 27
Median Deal Value
1H16 1H15 FY 15 FY 14
Payments 229.0 na 67.5 40.8
Technology 71.2 77.0 35.0 48.1
Solutions 42.0 21.0 162.5 32.5
FINTECH NEWSLETTER: M&A
Each quarter, the FinTech newsletter reviews FinTech M&A activity. Mercer Capital provides valuation and transaction advisory services (M&A, fairness opinions, and consulting) to FinTech companies.
View Past Issues or Subscribe

View past issues and subscribe for future updates to the quarterly FinTech newsletter at mer.cr/1holYIf© 2016 Mercer Capital // Business Valuation & Financial Advisory Services // www.mercercapital.com
9
Mercer Capital’s Value Focus: FinTech IndustrySecond Quarter 2016
@MercerFinTech
FinTech M&A 1H16 Largest FinTech M&A Overview
Deal Value (Reported)
$M
Deal Value, Including Debt Assumption (Reported)
$M
Valuation Multiples Total Enterprise Value
(i.e., including net debt) Buyer Name/ Target Name
Announce Date / Revenue / EBITDA Target Niche Target Description
Quintiles Transnational Holdings, Inc./ IMS Health Holdings, Inc.
5/3/16 9,002 13,539 4.42 NA Insurance/Healthcare Solutions
In a merger of equals, Danbury, Conn.-based IMS Health Holdings Inc. will merge with Durham, N.C.-based Quintiles Transnational Holdings Inc., with Quintiles continuing as the surviving corporation following the merger. Quintiles is a provider of support services for pharmaceutical, biotech, and medical companies and individuals while IMS Health Holdings is a leading provider of information and technology services to clients in the healthcare industry
Total System Services, Inc./ TransFirst Holdings Corp.
1/26/16 2,350 3,483 2.26 NA Payment Processors
Provides merchant solutions to more than 235,000 small and medium-sized businesses in the U.S. through its proprietary technology, end-to-end customized and multi-channel products and superior customer service
Wipro Limited/ HealthPlan Services
2/11/16 460 460 2.06 NA Insurance/Healthcare Solutions
Provides sales, benefits administration, retention, and technology solutions to the insurance and managed care industries
FinTech Acquisition Corp./ FTS Holding Corporation
3/7/16 350 412 3.42 NA Payment Processors
Provides payment processing and technology solutions
Blackboard Inc./ Higher One Holdings, Inc.
6/30/16 258 287 1.79 NA Payment Processors
Provider of financial services and data analytics services to colleges and universities
Fiserv, Inc./ Community Financial Services Business
1/20/16 200 NA 2.11 NA Processing Software & Hardware
Community financial services business from ACI Worldwide Inc. which provides financial institutions with a suite of digital banking and electronic payments solutions including Architect Banking, which supports online, mobile, and tablet banking for retail banks and small business customers on a single platform
Asset International, Inc./ Market Metrics, LLC
5/23/16 175 175 NA NA Financial Media & Content
Target was market research business focusing exclusively on advisor-sold investments and insurance world-wide that originated from Norwalk, Conn.-based FactSet Research Systems Inc., a market research firm
Median 304 412 2.09 NA
Source: SNL Financial

View past issues and subscribe for future updates to the quarterly FinTech newsletter at mer.cr/1holYIf© 2016 Mercer Capital // Business Valuation & Financial Advisory Services // www.mercercapital.com
10
Mercer Capital’s Value Focus: FinTech IndustrySecond Quarter 2016
@MercerFinTech
FinTech Venture Capital Activity OverviewLarger Fundings During 2Q16
CompanyAmount
$M Company Description FinTech Niche Country
ANT Financial $4,500 Secure online payments provider Payments China
Mosaic $200 Marketplace lender for residential solar projects
Alternative LendingU.S. Oakland, CA
Avant $188 Online alternative lender free of origination fees
Alternative LendingU.S. Chicago, IL
Clover Health $160 Health insurance plan using advanced data and analytics to improve results and lower costs
Insurance TechU.S. San Francisco, CA
Weidai $153 Peer-to-peer lending service that uses vehicles as collateral
Alternative Lending China
XP Investimentos
$130
Provides individuals with wide range of financial education, also includes asset management company
Broker and Asset Management
Brazil
SocietyOne $125 Peer-to-peer lending platform Alternative Lending Australia
Affirm $100 Offers installment loans to consumers at point of sale
Alternative LendingU.S. San Francisco, CA
Bright Health $80 Tech-based consumer health insurance
Insurance TechU.S. Minnesota City, MN
Personal Capital $75 Digital wealth management firm Asset ManagementU.S. Redwood City, CA
Nubank $56 Mobile credit service and digital finance service
Bank Technology Brazil
A summary of selected FinTech venture capital financing activity in the second quarter of 2016. Covers selected financing rounds larger than $10 million.Source: Finovate Emails which cite a number of sources including: themselves, Crunchbase, FT Partners, and The Wall Street Journal & Company Websites
FINTECH NEWSLETTER: VC
Each quarter, the FinTech newsletter reviews FinTech venture capital funding.
To receive quarterly updates, follow the link below.
Subscribe

View past issues and subscribe for future updates to the quarterly FinTech newsletter at mer.cr/1holYIf© 2016 Mercer Capital // Business Valuation & Financial Advisory Services // www.mercercapital.com
11
Mercer Capital’s Value Focus: FinTech IndustrySecond Quarter 2016
@MercerFinTech
FinTech Venture Capital Activity OverviewLarger Fundings During 2Q16 (cont.)
CompanyAmount
$M Company Description FinTech Niche Country
VTS $55 Commercial real estate platform Asset Management U.S. New York, NY
Mobikwik $50 Mobile wallet app in India Payments India
Omni Prime $46 Offers loans to underbanked customers through mobile app
Alternative Lending China
Intacct $40 Cloud-based financial and accounting management for businesses
Tech Solutions Provider
U.S. San Jose, CA
SigFig $40 Digital financial advisory and wealth management firm
Asset Management U.S. San Francisco, CA
Remitly $39 International payment service allowing customers to make international transfers from U.S.
PaymentsU.S. Seattle, WA
Simplee $38 Software platform for healthcare payments and billing
PaymentsU.S. Palo Alto, CA
EZBob $36 Fully automated smart lending platform for small businesses
Alternative Lending United Kingdom
Kueski $35 Online lender providing loans to Middle Classes of Mexico and Central America
Alternative Lending Mexico
Bridge2 Solutions
$35 Online incentives and rewards system for financial institutions
Tech Solutions Provider
U.S. Daytona Beach, FL
Carson Group $35 Online investment and wealth management platform
Asset ManagementU.S. Omaha, NE
Chedai.com $34 Chinese automobile lending platform
Alternative Lending China
A summary of selected FinTech venture capital financing activity in the second quarter of 2016. Covers selected financing rounds larger than $10 million.Source: Finovate Emails which cite a number of sources including: themselves, Crunchbase, FT Partners, and The Wall Street Journal & Company Websites

View past issues and subscribe for future updates to the quarterly FinTech newsletter at mer.cr/1holYIf© 2016 Mercer Capital // Business Valuation & Financial Advisory Services // www.mercercapital.com
12
Mercer Capital’s Value Focus: FinTech IndustrySecond Quarter 2016
@MercerFinTech
FinTech Venture Capital Activity OverviewLarger Fundings During 2Q16 (cont.)
CompanyAmount
$M Company Description FinTech Niche Country
Forter $32 Fraud prevention service offering real time decisions as a safeguard
Tech Solutions Providers
U.S. San Francisco, CA
Transactis $30 SaaS based billing and payment service exclusively targeting resellers
PaymentsU.S. New York, NY
Persado $30
Content generator for marketers driven by data to create optimal combination of words, phrases and images
AnalyticsU.S. New York, NY
Acorns $30 App that gives consumer option to automatically reinvest spare change into diversified fund
Asset ManagementU.S. Newport Beach, CA
Vestmark $30
Wealth management and financial advisory firm providing guidance and solutions through advanced technological platform
Asset ManagementU.S. Wakefield, MA
Nvest $30 Online platform providing investors with crowdsourced information
Tech Solutions Provider
Canada
Lend Street Financial
$28 Online refinancing service that helps consumers reduce debt and improve credit
Alternative LendingU.S. Oakland, CA
bitFlyer $27 Bitcoin exchange and market-place based in Japan
Payments Japan
Trov $26 Insurance service that allows consumers to choose things to protect through use of mobile app
Insurance TechU.S. Danville, CA
TransferWise $26 International fund transfer network Payments United Kingdom
A summary of selected FinTech venture capital financing activity in the second quarter of 2016. Covers selected financing rounds larger than $10 million.Source: Finovate Emails which cite a number of sources including: themselves, Crunchbase, FT Partners, and The Wall Street Journal & Company Websites

View past issues and subscribe for future updates to the quarterly FinTech newsletter at mer.cr/1holYIf© 2016 Mercer Capital // Business Valuation & Financial Advisory Services // www.mercercapital.com
13
Mercer Capital’s Value Focus: FinTech IndustrySecond Quarter 2016
@MercerFinTech
CompanyAmount
$M Company Description FinTech Niche Country
Eligible $25 Application program interface that helps to identify medical eligibility, claims and payments
Insurance TechU.S. Brooklyn, NY
Capital Float $25 Online platform providing working capital to small businesses in India
Alternative Lending India
Zooz $24 Payments platform specializing in management of digital payments
Payments Israel
Viva Republica $23 Peer-to-peer lending app that brings together consumers through app called "Toss"
Alternative Lending South Korea
Tuliu.com $23 Comprehensive online platform to facilitate land transfers
Online Broker China
Orderbird $23 Provider of iPad POS systems for the hospitality industry
Payments Georgia
Dashlane $23 Password management and secure digital wallet provider
PaymentsU.S. New York, NY
Invest.com $20 Online alternative investment platform
Asset Management Cyprus
Sunfunder $17
Crowdfunding platform that connects investors to communities around the world to invest in solar panels
Crowdfunding U.S. San Francisco, CA
AutoFi $17 Online lender providing point of sale auto financing
Alternative LendingU.S. San Francisco, CA
EuroCCP $16 Equity trading clearing service
Tech Solutions Providers
The Netherlands
A summary of selected FinTech venture capital financing activity in the second quarter of 2016. Covers selected financing rounds larger than $10 million.Source: Finovate Emails which cite a number of sources including: themselves, Crunchbase, FT Partners, and The Wall Street Journal & Company Websites
FinTech Venture Capital Activity OverviewLarger Fundings During 2Q16 (cont.)
View past issues and subscribe for future updates to the quarterly FinTech newsletter at mer.cr/1holYIf© 2016 Mercer Capital // Business Valuation & Financial Advisory Services // www.mercercapital.com
14
Mercer Capital’s Value Focus: FinTech IndustrySecond Quarter 2016
@MercerFinTech
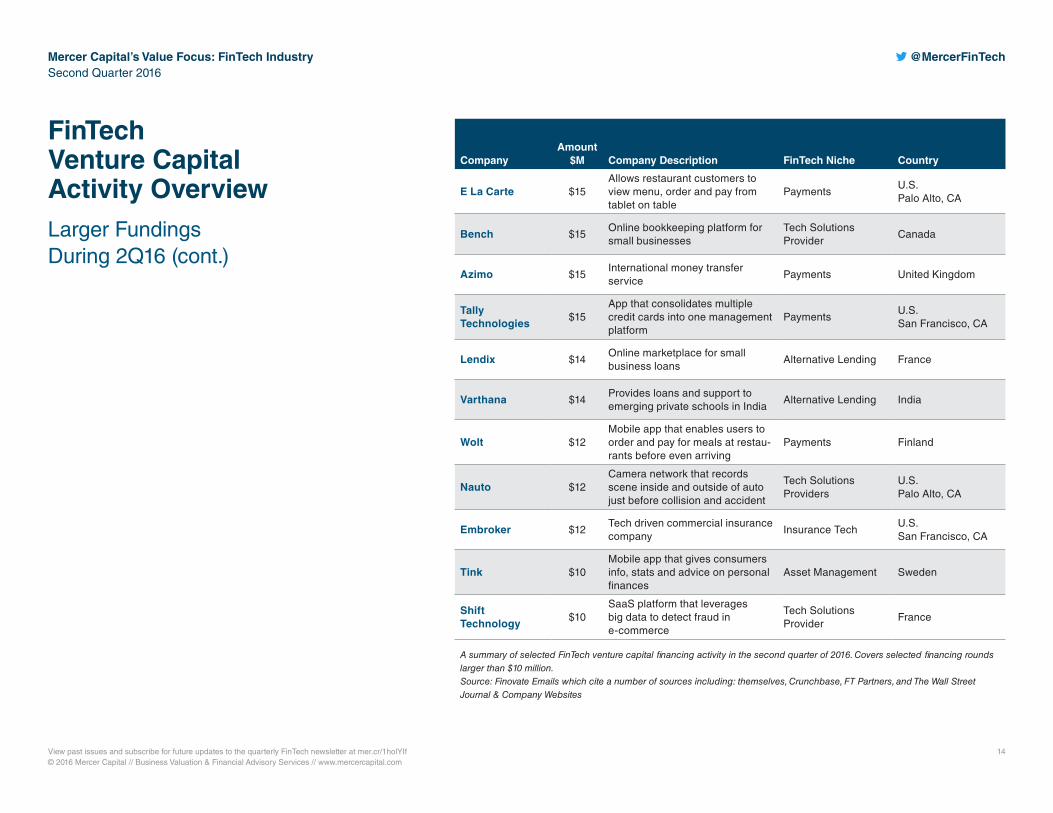
CompanyAmount
$M Company Description FinTech Niche Country
E La Carte $15 Allows restaurant customers to view menu, order and pay from tablet on table
PaymentsU.S. Palo Alto, CA
Bench $15 Online bookkeeping platform for small businesses
Tech Solutions Provider
Canada
Azimo $15 International money transfer service
Payments United Kingdom
Tally Technologies
$15 App that consolidates multiple credit cards into one management platform
PaymentsU.S. San Francisco, CA
Lendix $14 Online marketplace for small business loans
Alternative Lending France
Varthana $14 Provides loans and support to emerging private schools in India
Alternative Lending India
Wolt $12 Mobile app that enables users to order and pay for meals at restau-rants before even arriving
Payments Finland
Nauto $12 Camera network that records scene inside and outside of auto just before collision and accident
Tech Solutions Providers
U.S. Palo Alto, CA
Embroker $12 Tech driven commercial insurance company
Insurance TechU.S. San Francisco, CA
Tink $10 Mobile app that gives consumers info, stats and advice on personal finances
Asset Management Sweden
Shift Technology
$10 SaaS platform that leverages big data to detect fraud in e-commerce
Tech Solutions Provider
France
A summary of selected FinTech venture capital financing activity in the second quarter of 2016. Covers selected financing rounds larger than $10 million.Source: Finovate Emails which cite a number of sources including: themselves, Crunchbase, FT Partners, and The Wall Street Journal & Company Websites
FinTech Venture Capital Activity OverviewLarger Fundings During 2Q16 (cont.)

View past issues and subscribe for future updates to the quarterly FinTech newsletter at mer.cr/1holYIf© 2016 Mercer Capital // Business Valuation & Financial Advisory Services // www.mercercapital.com
15
Mercer Capital’s Value Focus: FinTech IndustrySecond Quarter 2016
@MercerFinTech
Venture Capital Case Study
“Over the next several years, no matter what you think
about digital advice, you would be pressed to argue that
it won’t be more popular versus less popular five to ten
years from now.”
– Rob Goldstein
Head of Blackrock’s Tech Division
“This (acquisition of FutureAdvisor by BlackRock) is
actually a really big watershed moment, not just for
us as an entity but for the broader financial services
industry as a whole.”
– Bo Lu
Co-Founder of FutureAdvisor
“More Americans are responsible for investing for the
important life goals, whether that is retirement, education,
etc. We think that a broad cross section of that market
may be slightly under-served. We believe that is the mass-
affluent or those who don’t want to seek out a traditional
advice model.”
– Frank Porcelli
Head of BlackRock’s U.S. Wealth Advisory Business

View past issues and subscribe for future updates to the quarterly FinTech newsletter at mer.cr/1holYIf© 2016 Mercer Capital // Business Valuation & Financial Advisory Services // www.mercercapital.com
16
Mercer Capital’s Value Focus: FinTech IndustrySecond Quarter 2016
@MercerFinTech
Venture Capital Case StudyFutureAdvisor
FutureAdvisor provides investors with a low cost index investing
service that diversifies the portfolio in a personalized and holistic
manner based on the investor’s age, needs, and risk tolerance. A
series of algorithms automatically rebalance investors’ accounts,
constantly look for tax savings and manage multiple accounts
for investors. Assets are held by Fidelity or TD Ameritrade in the
investor’s name, to assuage investors’ fears concerning safety
and accessibility of funds.
In 2015, it was announced that FutureAdvisor would be acquired
by BlackRock.
Year Significant Corporate Events
2010FutureAdvisor founded by Microsoft employees Jon Xu and Bo Lu
First round of seed funding ($1M)
2012-2015
Second round of seed funding (undisclosed amount)
Raised $5M in a Series A issue
Raised $15.5M in a Series B issue
Announces intent to be acquired by BlackRock for $152 million in August 2015
2016
Partners with BBVA Compass to offer low cost investment advice to bank’s
clients
Partners with Royal Bank of Canada
Partners with LPL Financial
Timeline
Sources for Case Study:CrunchbaseForbes.com, “BlackRock To Buy FutureAdvisor, Signaling Robo-Advice Is Here To Stay”FutureAdvisor.comFinancialadvising.com, “Jon Xu Interview”.Forbes.com, “BlackRock To Buy FutureAdvisor, Signaling Robo-Advice Is Here To Stay”.Financial-planning.com, “FutureAdvisor co-founder: Risk, robos and ‘hyperpersonalization”
FINTECH NEWSLETTER: CASE STUDY
Each quarter, the FinTech newsletter features a case study, typically covering companies with notable VC funding rounds. Past VC case studies include TradeKing and Stripe.
Learn More
View past issues and subscribe for future updates to the quarterly FinTech newsletter at mer.cr/1holYIf© 2016 Mercer Capital // Business Valuation & Financial Advisory Services // www.mercercapital.com
17
Mercer Capital’s Value Focus: FinTech IndustrySecond Quarter 2016
@MercerFinTech
Venture Capital Case StudyFutureAdvisor
Key Takeaways
1. The acquisition of FutureAdvisor signaled BlackRock’s intent to stay ahead of the robo-advice curve
and confirmed the increased staying power of automated investment advice, as Blackrock is the
world’s largest asset manager.
2. The low-cost and low-fee structure of FutureAdvisor can extend previously inaccessible financial
advice to a broader scope of consumers given the totally automated allocation and management
process.
3. After the acquisition, FutureAdvisor was able to evolve into a “startup within a huge company,”
according to founder Jon Xu. The company still held on to the creative culture and environment of
a tech startup, but now had the resources and tools of asset management giant BlackRock at its
disposal.
4. The acquisition also reinforced the trend of wealth management and financial advising moving
forward towards a model based on convenience for the consumer, rooted in the automated
processes. The crux of the evolution of financial advising and wealth management will eventually
become whether or not the explanation and personal attention of a human can add enough value to
outweigh the benefits of convenience fostered by automation.
5. Since being acquired by BlackRock, FutureAdvisor has in the past six months partnered with LPL,
BBVA Compass and RBC in business-to-business partnerships in efforts to provide the banks’
clients with more affordable and accessible investment advice. This has prompted other banks to
follow suit, including UBS’ partnership with FinTech startup SigFig and MorganStanley’s effort to
build its own robo-advisor.

Source: S&P Global Market Intelligence View past issues and subscribe for future updates to the quarterly FinTech newsletter at mer.cr/1holYIf© 2016 Mercer Capital // Business Valuation & Financial Advisory Services // www.mercercapital.com
18
Mercer Capital’s Value Focus: FinTech IndustrySecond Quarter 2016
@MercerFinTech
Publicly Traded Payments Companies
Ticker Name6/30/16Price
Market Cap ($M)
Ent’p Val ($M)
Price / Earnings Ent’p Value / EBITDA EV / LTM LTM Total LTM Margins
LTM FY16E FY17E LTM FY16E FY17E RevenueRevenue
($M)EBITDA
($M) EBITDA Net Inc.
Payment Processors
ADS Alliance Data Systems Corporation 195.92 11,547 28,813 22.1 11.7 10.4 18.8 13.9 12.6 4.4 6,763 1,552 23% 9%
HAWK Blackhawk Network Holdings, Inc. 33.49 1,880 2,149 50.4 13.3 12.0 14.0 10.8 9.1 1.2 1,867 149 8% 1%
CATM Cardtronics plc 39.81 1,800 2,272 27.0 - - 8.2 7.2 7.3 1.9 1,242 290 23% 6%
PMTS CPI Card Group, Inc. 5.01 283 562 22.3 10.1 6.3 6.4 - - 1.5 361 73 20% 5%
DLX Deluxe Corp. 66.37 3,246 3,792 14.4 13.5 12.7 9.1 8.0 7.7 2.1 1,813 422 23% 13%
EEFT Euronet Worldwide, Inc. 69.19 3,601 3,546 31.1 18.0 15.6 12.4 10.2 8.9 2.0 1,867 302 16% 8%
EVRI Everi Holdings Inc. 1.15 76 1,114 NM 1.9 1.4 5.9 5.7 5.4 1.3 833 181 22% -14%
EVTC EVERTEC, Inc. 15.54 1,165 1,789 13.8 9.5 9.0 12.1 9.8 9.4 4.7 382 145 38% 23%
FDC First Data Corporation 11.07 10,046 31,922 NM 8.5 7.3 12.3 11.0 10.4 4.1 7,842 2,378 30% -16%
FLT FleetCor Technologies, Inc. 143.13 13,247 15,586 35.6 21.5 18.5 19.8 16.3 14.2 9.2 1,714 847 49% 23%
GPN Global Payments Inc. 71.38 10,992 14,972 31.2 22.3 18.7 19.6 14.1 11.7 4.3 2,898 664 23% 9%
GDOT Green Dot Corporation 22.99 1,105 598 40.0 16.2 13.4 4.5 2.7 2.4 0.6 699 91 13% 5%
MA MasterCard Incorporated 88.06 96,752 93,643 26.5 24.9 21.3 16.8 15.6 13.8 9.5 10,187 5,765 57% 37%
MGI Moneygram International Inc. 6.85 368 1,343 NM 7.7 6.6 7.4 5.0 4.7 0.9 1,487 226 15% 0%
PLPM Planet Payment, Inc. 4.49 244 243 26.3 28.1 21.6 29.1 15.6 12.9 4.2 55 7 14% 18%
SQ Square, Inc. 9.05 3,035 2,631 NM NM NM NM - - 1.9 1,524 (91) -6% -15%
TSS Total System Services, Inc. 53.11 9,752 12,959 26.1 18.8 16.7 14.8 10.4 9.2 3.8 3,316 769 23% 11%
JTPY JetPay Corporation 2.28 38 86 NM NM NM 23.5 27.7 17.6 1.9 44 4 8% -4%
VNTV Vantiv, Inc. 56.60 8,849 11,997 52.9 21.4 19.1 16.2 13.5 12.3 3.7 3,378 783 23% 6%
PAY VeriFone Systems, Inc. 18.54 2,050 2,881 28.4 9.9 8.5 10.3 7.4 7.8 1.4 2,064 281 14% 4%
V Visa Inc. 74.17 176,889 189,733 25.9 26.1 21.7 18.0 16.2 14.0 12.1 14,392 9,811 68% 39%
WU The Western Union Company 19.18 9,420 11,467 12.0 11.7 11.0 8.3 8.5 8.3 2.1 5,453 1,391 26% 15%
WEX WEX Inc. 88.67 3,431 4,384 33.6 21.2 18.1 14.7 12.7 11.0 4.8 879 279 32% 10%
Median 3,246 3,546 26.8 13.5 12.7 13.2 10.4 9.2 2.1 1,813 290 23% 8%

Source: S&P Global Market Intelligence View past issues and subscribe for future updates to the quarterly FinTech newsletter at mer.cr/1holYIf© 2016 Mercer Capital // Business Valuation & Financial Advisory Services // www.mercercapital.com
19
Mercer Capital’s Value Focus: FinTech IndustrySecond Quarter 2016
@MercerFinTech
Publicly Traded Payments Companies
Ticker Name6/30/16Price
Market Cap ($M)
Ent’p Val ($M)
Price / Earnings Ent’p Value / EBITDA EV / LTM LTM Total LTM Margins
LTM FY16E FY17E LTM FY16E FY17E RevenueRevenue
($M)EBITDA
($M) EBITDA Net Inc.
Payment Software/Hardware
ADP Automatic Data Processing, Inc. 91.87 41,850 40,643 29.0 26.5 22.9 16.9 15.8 14.0 3.6 11,668 2,537 22% 13%
CVG Convergys Corporation 25.00 2,412 2,467 15.1 13.2 12.4 6.5 6.5 6.2 0.9 2,908 387 13% 6%
NSP Insperity, Inc. 77.23 1,652 1,483 31.7 22.0 18.6 13.0 10.0 8.4 0.5 2,786 113 4% 2%
PAYX Paychex, Inc. 59.50 21,427 21,075 28.5 28.1 25.8 16.7 16.1 14.9 7.1 2,952 1,262 43% 26%
WDAY Workday, Inc. 74.67 14,710 13,144 NM NM 236.0 NM 98.4 58.9 10.5 1,257 (194) -15% -25%
PAYC Paycom Software, Inc. 43.21 2,589 2,538 76.8 64.6 50.2 41.7 34.0 26.0 9.8 284 67 24% 13%
PCTY Paylocity Holding Corporation 43.20 2,204 2,117 NM 168.1 111.6 NM 73.7 52.8 10.0 231 10 4% -2%
TNET TriNet Group, Inc. 20.79 1,470 1,776 55.0 17.8 14.9 15.4 10.0 8.8 0.6 2,872 131 5% 1%
UPLD Upland Software, Inc. 7.62 131 151 NM 29.9 24.1 88.4 14.3 12.4 2.1 71 4 5% -22%
Median 2,412 2,467 30.3 27.3 24.1 16.7 15.8 14.0 3.6 2,786 113 5% 2%
Overall Payments Median 2,812 2,756 28.4 18.0 16.2 14.7 10.9 9.9 2.8 1,840 280 22% 6%

Source: S&P Global Market Intelligence View past issues and subscribe for future updates to the quarterly FinTech newsletter at mer.cr/1holYIf© 2016 Mercer Capital // Business Valuation & Financial Advisory Services // www.mercercapital.com
20
Mercer Capital’s Value Focus: FinTech IndustrySecond Quarter 2016
@MercerFinTech
Publicly Traded Solutions Companies
Ticker Name6/30/16Price
Market Cap ($M)
Ent’p Val ($M)
Price / Earnings Ent’p Value / EBITDA EV / LTM LTM Total LTM Margins
LTM FY16E FY17E LTM FY16E FY17E RevenueRevenue
($M)EBITDA
($M) EBITDA Net Inc.
Outsourced
ACXM Acxiom Corporation 21.99 1,711 1,743 NM 38.6 33.7 21.6 11.8 10.4 2.0 868 85 10% 1%
CSC Computer Sciences Corporation 49.65 6,914 8,321 115.9 18.6 14.8 8.6 6.7 6.1 1.2 7,106 970 14% 4%
CSGS CSG Systems International Inc. 40.31 1,308 1,441 18.1 15.2 14.1 9.4 8.1 7.9 2.0 761 164 22% 10%
EFX Equifax Inc. 128.40 15,281 18,173 35.0 24.7 22.1 19.8 16.8 15.0 6.7 2,873 977 34% 16%
EXLS Exlservice Holdings, Inc. 52.41 1,754 1,599 32.2 22.5 19.9 15.8 13.1 11.3 2.5 667 104 16% 9%
FICO Fair Isaac Corporation 113.01 3,523 4,006 38.3 24.6 20.9 20.5 20.3 18.0 4.8 878 213 24% 13%
FIS Fidelity National Information Services, Inc. 73.68 24,053 34,528 38.0 19.4 16.8 19.9 12.1 11.2 4.8 7,939 2,000 25% 6%
FISV Fiserv, Inc. 108.73 24,174 28,465 30.9 24.6 21.8 15.6 14.8 13.7 5.3 5,375 1,670 31% 17%
IL IntraLinks Holdings, Inc. 6.50 375 416 NM 46.4 28.6 37.7 8.7 7.4 1.5 285 14 5% -9%
INTU Intuit Inc. 111.61 28,558 27,945 40.5 28.7 24.9 19.8 15.7 13.5 6.0 4,636 1,413 30% 22%
PRGX PRGX Global, Inc. 5.22 114 99 34.8 30.7 20.9 8.4 5.5 4.9 0.7 135 10 8% -2%
BKFS Black Knight Financial Services, Inc. 37.60 2,598 5,223 77.5 33.6 29.6 15.7 11.2 10.2 5.4 969 340 35% 4%
SSNC SS&C Technologies Holdings, Inc. 28.08 5,566 8,072 235.6 17.5 14.5 22.4 13.1 11.4 7.3 1,279 406 32% 1%
Median 3,523 5,223 38.0 24.6 20.9 19.8 12.1 11.2 4.8 969 340 24% 6%

Source: S&P Global Market Intelligence View past issues and subscribe for future updates to the quarterly FinTech newsletter at mer.cr/1holYIf© 2016 Mercer Capital // Business Valuation & Financial Advisory Services // www.mercercapital.com
21
Mercer Capital’s Value Focus: FinTech IndustrySecond Quarter 2016
@MercerFinTech
Publicly Traded Solutions Companies
Ticker Name6/30/16Price
Market Cap ($M)
Ent’p Val ($M)
Price / Earnings Ent’p Value / EBITDA EV / LTM LTM Total LTM Margins
LTM FY16E FY17E LTM FY16E FY17E RevenueRevenue
($M)EBITDA
($M) EBITDA Net Inc.
Payroll/Administration
ACIW ACI Worldwide, Inc. 19.51 2,275 2,958 13.3 36.7 31.9 19.4 11.5 10.6 2.8 993 104 10% 13%
EPAY Bottomline Technologies (de), Inc. 21.53 881 901 NM 16.4 14.9 19.9 12.4 11.8 2.6 341 45 13% -10%
BR Broadridge Financial Solutions, Inc. 65.20 7,708 8,002 26.1 23.0 20.1 13.6 12.4 11.0 2.9 2,897 611 21% 11%
CDK CDK Global, Inc. 55.49 8,620 9,634 40.0 28.4 22.4 20.4 15.6 12.6 4.5 2,115 490 23% 11%
DBD Diebold, Incorporated 24.83 1,618 3,592 19.2 16.3 11.4 10.8 7.6 5.8 0.8 2,290 168 7% 9%
NCR NCR Corporation 27.77 3,441 7,403 NM 9.5 8.7 16.4 6.9 6.8 1.2 6,357 895 14% 4%
NTWK NetSol Technologies, Inc. 5.84 62 69 101.2 12.2 - 6.0 - - 1.1 61 11 19% 1%
PEGA Pegasystems Inc. 26.95 2,057 1,919 55.0 28.1 23.6 20.5 14.8 12.2 2.6 735 94 13% 5%
XTLY Xactly Corporation 12.81 386 355 NM NM NM NM NM NM 4.4 81 (17) -21% -30%
WK Workiva Inc. 13.66 560 531 NM NM NM NM NM NM 3.4 164 (45) -28% -30%
Median 1,837 2,438 33.0 19.7 17.5 17.9 11.9 10.8 2.7 864 99 13% 5%
Content
RATE Bankrate, Inc. 7.48 676 848 51.8 13.9 8.4 7.5 7.2 4.5 2.0 384 89 23% -15%
CLGX CoreLogic, Inc. 38.48 3,419 4,962 27.3 17.8 16.0 13.3 9.6 8.8 2.8 1,731 361 21% 8%
CSGP CoStar Group Inc. 218.66 7,118 6,989 NM 53.5 39.6 56.7 28.7 21.6 9.3 789 171 22% 6%
DNB The Dun & Bradstreet Corporation 121.84 4,418 5,787 22.8 16.6 15.6 13.9 11.6 11.0 3.5 1,679 394 23% 11%
FDS FactSet Research Systems Inc. 161.42 6,570 6,659 26.2 23.7 22.0 17.4 16.2 14.8 6.0 1,102 384 35% 23%
TRU TransUnion 33.44 6,108 8,514 231.7 24.9 22.4 17.0 14.1 12.8 5.5 1,607 511 32% 3%
FORR Forrester Research Inc. 36.86 657 531 49.8 30.5 25.8 16.2 14.3 12.4 1.7 321 34 11% 5%
IT Gartner Inc. 97.41 8,036 8,438 43.7 34.8 30.1 22.7 18.3 15.9 3.8 2,311 385 17% 8%
MORN Morningstar Inc. 81.78 3,509 3,338 27.3 26.7 24.3 13.1 13.0 12.1 4.2 787 250 32% 17%
VRSK Verisk Analytics, Inc. 81.08 13,635 15,710 26.7 26.2 23.6 16.6 16.1 15.0 7.6 2,246 1,018 45% 27%
Median 5,263 6,223 27.3 25.6 23.0 16.4 14.2 12.6 4.0 1,354 372 23% 8%
Overall Solutions Median 3,441 4,962 36.5 24.6 21.8 16.6 12.4 11.3 3.4 993 250 21% 6%

Source: S&P Global Market Intelligence View past issues and subscribe for future updates to the quarterly FinTech newsletter at mer.cr/1holYIf© 2016 Mercer Capital // Business Valuation & Financial Advisory Services // www.mercercapital.com
22
Mercer Capital’s Value Focus: FinTech IndustrySecond Quarter 2016
@MercerFinTech
Publicly Traded Technology Companies
Ticker Name6/30/16Price
Market Cap ($M)
Ent’p Val ($M)
Price / Earnings Ent’p Value / EBITDA EV / LTM LTM Total LTM Margins
LTM FY16E FY17E LTM FY16E FY17E RevenueRevenue
($M)EBITDA
($M) EBITDA Net Inc.
Banking Technology
ELLI Ellie Mae, Inc. 91.65 2,749 2,660 135.0 47.6 35.3 56.6 28.0 19.4 9.8 298 54 18% 8%
EPIQ Epiq Systems, Inc. 14.60 554 933 NM 16.4 14.6 11.8 8.3 7.8 1.8 530 87 16% -3%
QTWO Q2 Holdings, Inc. 28.02 1,099 1,004 NM NM NM NM NM 135.0 8.4 128 (21) -16% -27%
JKHY Jack Henry & Associates Inc. 87.27 6,884 6,930 31.0 29.4 27.1 15.1 14.4 13.3 5.2 1,321 460 35% 17%
PFMT Performant Financial Corporation 1.62 81 94 31.6 162.0 46.3 4.6 6.2 6.3 0.6 156 23 15% 2%
Median 1,099 1,004 31.6 38.5 31.2 13.5 11.3 13.3 5.2 298 54 16% 2%
Insurance/Healthcare Technology
ATHN athenahealth, Inc. 138.01 5,419 5,579 251.0 76.8 60.9 70.9 23.8 19.4 5.8 1,012 85 8% 1%
CRVL CorVel Corporation 43.18 847 810 30.2 - - 12.3 - - 1.6 505 67 13% 6%
CRD.B Crawford & Company 8.49 470 654 NM 13.3 10.4 6.5 5.5 4.9 0.5 1,138 104 9% -3%
EBIX Ebix Inc. 47.90 1,569 1,732 19.6 18.5 17.8 17.0 14.9 13.6 6.3 281 105 37% 31%
GWRE Guidewire Software, Inc. 61.76 4,479 3,900 NM 81.9 66.4 171.8 45.1 34.3 9.5 409 23 6% 3%
HMSY HMS Holdings Corp. 17.61 1,482 1,492 60.5 27.4 23.4 17.0 12.9 11.3 3.2 490 94 19% 6%
MGLN Magellan Health, Inc. 65.77 1,619 1,864 45.0 23.2 18.9 8.4 6.6 6.0 0.4 4,740 209 4% 1%
CSLT Castlight Health, Inc. 3.96 403 277 NM NM NM NM NM NM 3.4 87 (72) -82% -88%
CNXR Connecture, Inc. 2.26 50 116 NM NM 34.8 28.6 11.1 5.6 1.1 88 (1) -1% -17%
HQY HealthEquity, Inc. 30.39 1,765 1,632 91.9 62.7 47.9 39.6 27.4 21.4 11.6 141 41 29% 14%
IMPR Imprivata, Inc. 14.00 355 308 NM NM NM NM NM NM 2.4 131 (18) -14% -18%
IMS IMS Health Holdings, Inc. 25.36 8,366 12,509 52.1 15.9 14.4 16.9 13.1 12.1 4.1 3,123 763 24% 4%
INOV Inovalon Holdings, Inc. 18.01 2,744 2,274 49.4 32.1 25.5 18.3 13.4 10.8 5.1 453 111 24% 10%
EVH Evolent Health, Inc. 19.20 1,154 1,252 5.1 NM NM NM NM NM 8.6 192 (46) -24% -77%
Median 1,526 1,562 49.4 25.3 23.4 17.0 13.1 11.3 3.8 431 76 9% 2%

Source: S&P Global Market Intelligence View past issues and subscribe for future updates to the quarterly FinTech newsletter at mer.cr/1holYIf© 2016 Mercer Capital // Business Valuation & Financial Advisory Services // www.mercercapital.com
23
Mercer Capital’s Value Focus: FinTech IndustrySecond Quarter 2016
@MercerFinTech
Publicly Traded Technology Companies
Ticker Name6/30/16Price
Market Cap ($M)
Ent’p Val ($M)
Price / Earnings Ent’p Value / EBITDA EV / LTM LTM Total LTM Margins
LTM FY16E FY17E LTM FY16E FY17E RevenueRevenue
($M)EBITDA
($M) EBITDA Net Inc.
Investment Technology
DST DST Systems Inc. 116.43 3,863 4,523 13.4 17.4 15.7 10.3 10.3 9.7 1.6 2,877 414 14% 9%
ENV Envestnet, Inc. 33.31 1,422 1,675 NM 32.6 23.2 37.8 16.5 12.2 3.7 495 44 9% -4%
MSCI MSCI Inc. 77.12 7,442 8,618 34.3 26.8 22.5 16.9 15.6 14.1 7.9 1,111 535 48% 23%
Median 3,863 4,523 23.9 26.8 22.5 16.9 15.6 12.2 3.7 1,111 414 14% 9%
Overall Technology Median 1,526 1,653 39.6 27.4 23.3 16.9 13.2 12.1 3.9 471 76 14% 2%