introduction to water and soil (816.335) lecture …dept. water, soil & atmosphere university of...
TRANSCRIPT

Dept. Water, Soil & AtmosphereUniversity of Natural Resources
and Life Sciences Vienna
Introduction to Water and Soil (816.335)
Lecture Series in Water, Soil and Atmosphere (315.340)
Unit 1
Willibald LoiskadlHubert Holzmann
Thomas Ertl
1

Organisation
Vortragende / Lecturers:Univ.-Prof. DI Dr. Willibald LoiskandlEmail: [email protected] hours:
Ao.Univ.-Prof. Dipl.Ing. Dr. Hubert HolzmannEmail: [email protected] hours: Tuesday and Thursday 10:00 – 12:00h
Doc. DI Dr. Thomas ErtlEmail: thomas.ertl(@boku.ac.atOffice hours:
Registration of Participants:All participating students have to register to the BOKU-Online system. Herewith all required personal information is available to the lecturer.
Please make the registration even if you already registered by email!
Lecture Room:Lecture room MUG3-SR13 (alternativly HS XXI)Time: Friday 14:00 – 16:30h
2

Introduction
Introduction of the studentsName, Nationality, Study program, Thematic Background, Language, Motivation
3

Introduction
Introduction of the studentsName, Nationality, Study program, Thematic Background, Language, Motivation
4

Organisation
Schedule and Content
Date Lecturer ContentBasic level (introduction to water and soil)
4. 11.2011 LoiskandlErtl Holzmann
H: Organisation and administrationH: Water balance and scale issuesProcessesMonitoring and Observation of water balance components Interaction Soil / Vegetation / AtmosphereWater quality and index class
11.11. Loiskandl Soil (Genesis, Type, Properties)soil – plant interactionevaporation / transpiration
18.11. Holzmann Runoff formationRainfall excess, methods
25.11. Holzmann Runoff processes (drought, flood)Model overviewLegislation
2.12. Loiskandl Argriculture and its impact to soil and soil waterSoil erosion
The courses of this template achieve the requirements for the course introduction to water and soil (816.335)5
Organisation
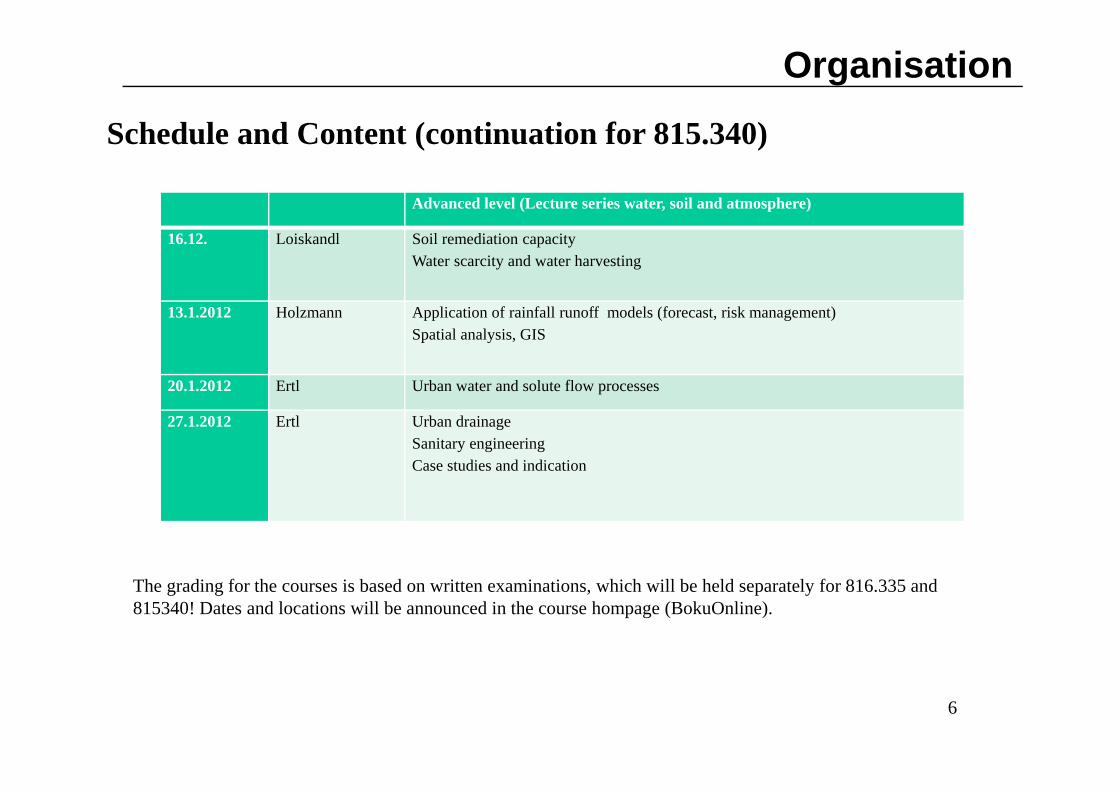
Schedule and Content (continuation for 815.340)
Advanced level (Lecture series water, soil and atmosphere)
16.12. Loiskandl Soil remediation capacityWater scarcity and water harvesting
13.1.2012 Holzmann Application of rainfall runoff models (forecast, risk management)Spatial analysis, GIS
20.1.2012 Ertl Urban water and solute flow processes
27.1.2012 Ertl Urban drainageSanitary engineeringCase studies and indication
The grading for the courses is based on written examinations, which will be held separately for 816.335 and 815340! Dates and locations will be announced in the course hompage (BokuOnline).
6

Objectives and Outcomes
Aim of courseProviding an overview of the relevant processes of the water cycle in the surface and subsurface environment and its interaction with atmosphere, plants and soils. The course introduces methods of meteorological, hydrological and soil physical measurements and refers to computational methods for the modelling of water transport. Also soil functions and soil processes are addressed. Water quality and quality impact will be considered with respect to surface and subsurface water bodies. The objective of the course is to provide a basic knowledge for follow up courses.
OutcomeWith respect to the Bologna Study Principles the outcome of the particular courses has to be defined.
These outcomes will explicitly be addressed for the specific course units.
7

Outcome of Unit 1
Outcomes
Gaining knowledge in• Global and continental water balance components.
• Water circulation / transport and its sub processes.
• Concept of infiltration and surface runoff formation
• Monitoring and observation of water balance components (rainfall, interception, evaporation, runoff).
• Computation methods of evaporation
8

Materials and information
International Glossary of Hydrology (from UNESCO)http://webworld.unesco.org/water/ihp/db/glossary/glu/aglu.htm
Course Materials by Internet:http://www.boku.ac.at/iwhw/LVA816335/
Glossary of Soil Science Terms (from SSS of America)https://www.soils.org/publications/soils-glossary/
9

Introduction
Courses of WMEE with relevance for water, soil and atmosphere • Water Supply and Wastewater Treatment•Integrated Flood Risk Management•Institutions and Policies of the EU (Introduction to the Law and Politics of the European Union) •Soil Properties and Processes for Ecological Engineering•Water Resources Planning and Management•Sediment Regime and River Morphology•Applied Soil Physics•Simulation in Vadose Soil Environment•In-situ Treatment of Polluted Soils and Sediments: Phytoremediation, in-situ Fixation and Natural Attenuation Techniques•Decision Support Systems for Water Resources Management•Possible Impacts of Climate Change on Water Resources •Soil- bioengineering techniques (slopes & gullies) •Computer Based Modelling of Running Waters•Soil Conservation and Soil Protection•Soil erosion models and their application•Application of GIS in Hydrology and Water Management•Environmental protection in mountain areas•Flood warning systems and flood prevention
10

Water Balance
Der globale Wasserkreislauf / The Global Water Balance
(from Dt. Klimarechenzentrum modified)
VapourPrecipitation
Evaporation (Lakes) Evap. (Land) Evap. (Sea)
Precipitation
Seepage Water Lake
River
Groundwater Flux
Recharge
Melt Water
11

Water BalancePhysical Processes involved in Runoff
Generation
From http://snobear.colorado.edu/IntroHydro/geog_hydro.html
Q = P – ET ΔS
Where Q … StreamflowP … PrecipitationET …EvapotranspirationS … Storage
12

Process understanding
Environmental processes can be considered in different spatial and temporal scales. Processes reflect specific systems which are linked and interrelated with their boundaries. The key elements of process analysis are
• Monitoring and observation of physical properties• Perception of process concepts• Design of models to mimic the process• Verify the model concept by means of real world data (calibration)• Simulate state scenarios (impact studies)
13

Niederschlag
020
50
01/01/1990 05/27/1991 10/19/1992 03/14/1994 08/07/1995 12/30/1996
Verdunstung
02
4
01/01/1990 05/27/1991 10/19/1992 03/14/1994 08/07/1995 12/30/1996
Bodenfeuchte
5015
0
01/01/1990 05/27/1991 10/19/1992 03/14/1994 08/07/1995 12/30/1996
Abfluss
010
20
01/01/1990 05/27/1991 10/19/1992 03/14/1994 08/07/1995 12/30/1996
Water Balance Components/ Precipitation
/ Evaporation
/ Soil Moisture Content
/ Specific Discharge
14
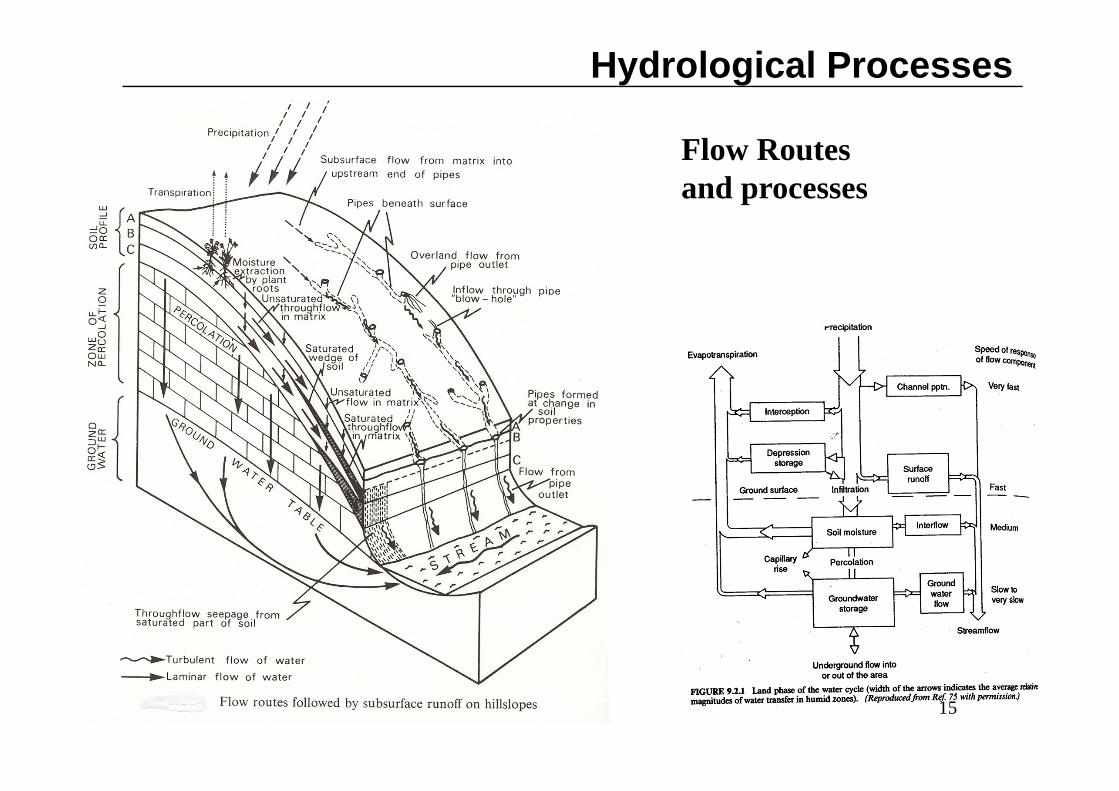
Hydrological Processes
Flow Routesand processes
15

Introduction
Characteristics and dependencies of Water Balance Components
- Precipitationareal distributed / high temporal variation
- Interceptionseasonal dependence, precipitation intensity and duration
- Surface Runoff and surface (depression) storageSlope, vegetation, erosion, permeability of soil
- Infiltration permeability of soil, precipitation intensity, moisture content of soil
- Transpiration / Evaporationpotential climate conditions, actual soil moisture content, vegetation species
- Percolation and soil water transport (upwards - downwards)vertical soil moisture gradient, (un)saturated conductivity, groundwater level
- Groundwater recharge and capillary riselower boundary condition, boundary type (e.g. full drainage)
16

Runoff Formation
Hillslope
Rainfall R
Infiltration INF
Surface Runoff Q
Temporal sequence of infiltration and surface runoff Zeitliche Abfolgevon Infiltration und Oberflächenabfluss
INF = R:- Initial phase of rainfall event- mean to high conductivity- high rate of subsurface drainage
R ≥ INF ≥ Q:- mean phase of rainfall event- mean conductivity- mean rate of subsurface drainage
R ≥ Q ≥ INF:- Final phase of rainfall event- mean to low conductivity- mean rate of subsurface drainage
R = Q :- Final phase of extreme rainfall event- low conductivity or impermeable- restricted subsurface drainage- saturation of soils
17

Runoff Formation
Hillslope
Rainfall R
Infiltration INF
Surface Runoff Q
Temporal sequence of infiltration and surface runoff Zeitliche Abfolgevon Infiltration und Oberflächenabfluss
INF = R:- Initial phase of rainfall event- mean to high conductivity- high rate of subsurface drainage
R ≥ INF ≥ Q:- mean phase of rainfall event- mean conductivity- mean rate of subsurface drainage
R ≥ Q ≥ INF:- Final phase of rainfall event- mean to low conductivity- mean rate of subsurface drainage
R = Q :- Final phase of extreme rainfall event- low conductivity or impermeable- restricted subsurface drainage- saturation of soils
18

Runoff Formation
Schematic of Rainfall Excess Components. (From Environmental Ecology) 19

Observation of Balance Components
Precipitation:In Austria precipitation is operationally observed by the Hydrological Survey (part of Ministry of Environment). The data are partly collected by the Federal Hydrographic Services, collected and published by the Hydrological Survey (Hydrological Yearbook). Digital data (time series) can be ordered free of charge according to the Austrian Hydrographic Law. In addition the National Weather Service Agency (Central Institute for Meteorology and Geodynamics ZAMG) is measuring and collecting meteorological data. They provide the weather forecast service and the synoptic assessments. Data from the ZAMG are charged.
Discharge:Discharge is also observed by the Hydrological Survey and the connected Federal Institutions of the Federal Governments. Additional discharge gauges are operated by regional hydro power plants and energy dispatchers (Verbund, TIWAG, etc.).
Evaporation / Soil MoistureEvaporation is observed by the Hydrological Survey and by ZAMG. Several lysimeter applications are maintained by research institutions (BOKU, Joanneum Research, RC Seibersdorf, etc.)
20

Anzahl der Messeinrichtungen (Österreich)Number of observation gauges in Austria
Observation of Balance Components
Niederschlag / Precipitation…………………...1250Abfluss / Discharge………………………..….. 545Verdunstung / Evaporation……………………. 53Lufttemperatur / Air temperature………….… 787Wasserstand / Water level……………………. 764Wassertemperatur / Water temperature…….… 213Grundwasserstand / Groundwater level….… 2889Grundwassertemperatur / GW temperature….. 354Quellschüttung / Spring discharge………………23
Summe / Total……………………………...….7800
21

Niederschlagsstationen in ÖsterreichPrecipitation gauges in Austria
22

PRECIPITATIONAt climatological and synoptic stations worldwide, it is standard procedure to measure rainfall at each scheduled hour, then calculate the total rainfall during the previous six-hour and twelve-hour period.
Regular rainfall measurement is also an essential requirement in many aspects of hydrology, water management, agriculture, forestry, industry, education and other activities. Rainfall is rarely uniform in intensity or duration across a wide area, so continuous data on local conditions is of particular importance to farmers and those concerned with irrigation, scientists researching into crop performance and soil erosion, and to water and river authorities in respect of runoff forecasts, reservoir supplies and ground water feeding into rivers. Accurate measurement is also essential for calculating evaporation.
The rain gauge is the standard method of collection. This has to be sited in a location, which is representative of the rainfall area to be measured. Often a network of sites will be integrated to cover average rainfall over a large area. Rainfall at any one place against time is expressed in terms of the depth to which it would cover the surface locally, assuming there was no loss by evaporation or run-off. The rain gauge is often used in conjunction with other instruments for a full picture of local climatic conditions.
Observation of Balance Components
23

Precipitation
Graduated Cylinder Rain Gauge
Measures the accumulation (height) of precipitation in an open topped cylindrical container. Operator records the accumulation and empties the cylinder. Normally it has a funnel shaped accumulator at the top to gather precipitation from a greater area than the cylinder area.
Advantages: SimpleDisadvantages: Operator intervention required.
Observation of Balance Components
24

Tipping Bucket Rain GaugeThis Gauge can be used with a data logger,
counter or event recorder, so making it idealfor remote monitoring and recording, ornetwork integration. The principle is well-proved and ensures accuracy with unlimitedcapacity. The bucket is divided into two partsand mounted on a tungsten axle and pivots.When one part fills, the bucket tips todischarge the water to the ground and alsoactivates a pair of switches. The other part ofthe bucket then fills and the cycle is repeated,as long as rain is falling. A wire mesh filterprevents the ingress of debris or insects.Other features include a levelling adjustmentwith indicator and the option of heating, toprevent ice forming in the bucket assembly,down to a temperature of -6°C. A deep coveroption with the funnel set 127mm below therim to prevent rain bouncing out duringsudden downpours.
Observation of Balance Components
Source: MUNRO homepage: http://www.munro-group.co.uk/rain/week.htmland http://www.pluviograph.com/
25

Regenmesser-Totalisator• Einsatz im Gebirge• Funktion: • Sammelgefäß mit großem Fassungsvermögen• Messung in Zeitabständen von Monaten• Winter: Frostschutzzugabe um
– Gefrieren zu verhindern– rasches Schmelzen des gesamten Schnees zu
ermöglichen• Verringerung des Verdunstungsverlusts:
– Ölschicht aufbringen• Messung des Füllstandes
Observation of Balance Components
Cumulative precipitation gauge - Totalizer• For remote areas (mountains)• Big collector volumes• Observation intervals: months • Oil prevents freezing and evaporation
26

Observation of Balance Components
Sources: http://radar-info.fzk.de/wolken_radar_met/indices/parsivel.htmhttp://www.thiesclima.com/disdrometer.htm
Laser Precipitation Monitor (Distrometer):The optical laser basing measuring principle guarantees a reliable and accurate measurement of all known kinds of precipitation. It is possible to measure the amount, the intensity also as the particle size and the velocity of precipitation. A main advantage of the Distrometer is to measure particles down to 0,16 mm diameter. The Distrometer detects and discriminates the different arts of precipitation as drizzle, rain, hail, snow, snow grains, graupel (small hail / snow pellets), and ice pellets with his reliable maintenance-free Laser optic.
27

Source of measurement errors• Sources
– Systematical errors• Correction required• Adsorption loss, wind effect, evaporation from collector, tilting errors
– Random errors• Data control and maintenance• Change of surrounding environment
– Specific errors• Data control and maintenance• Knowledge of specific functionalities of equipment
• Range of errors– Adsorbtion loss : 0,2-0,3mm / event based– wind effect : 5-50% / event based– Evaporation (heated): 20-40%– Siphon tilting up to 30%– condensation 10%
Precipitation Measurements
28

Gebiets-NiederschlagAreal Precipitation
Interpolation Methods•Polygon (Thiessen)
•Triangular
•Weighted Inverse Distance
•Geostatistical Methods (Kriging )
•Etc.
(aus Holzmann, 1994)
Balance Components
29
Interception
Interception is the process of interrupting the movement of water in the chain of transportation events leading to streams. The interception can take place by vegetal cover or depression storage in puddles and in land formations such as rills and furrows.
When rain first begins, the water striking leaves and other organic materials spreads over the surfaces in a thin layer or it collects at points or edges. When the maximum surface storage capability on the surface of the material is exceeded, the material stores additional water in growing drops along its edges. Eventually the weight of the drops exceed the surface tension and water falls to the ground. Wind and the impact of rain drops can also release the water from the organic material. The water layer on organic surfaces and the drops of water along the edges are also freely exposed to evaporation.
Additionally, interception of water on the ground surface during freezing and sub-freezing conditions can be substantial. The interception of falling snow and ice on vegetation also occurs. The highest level of interception occurs when it snows on conifer forests and hardwood forests that have not yet lost their leaves.
30
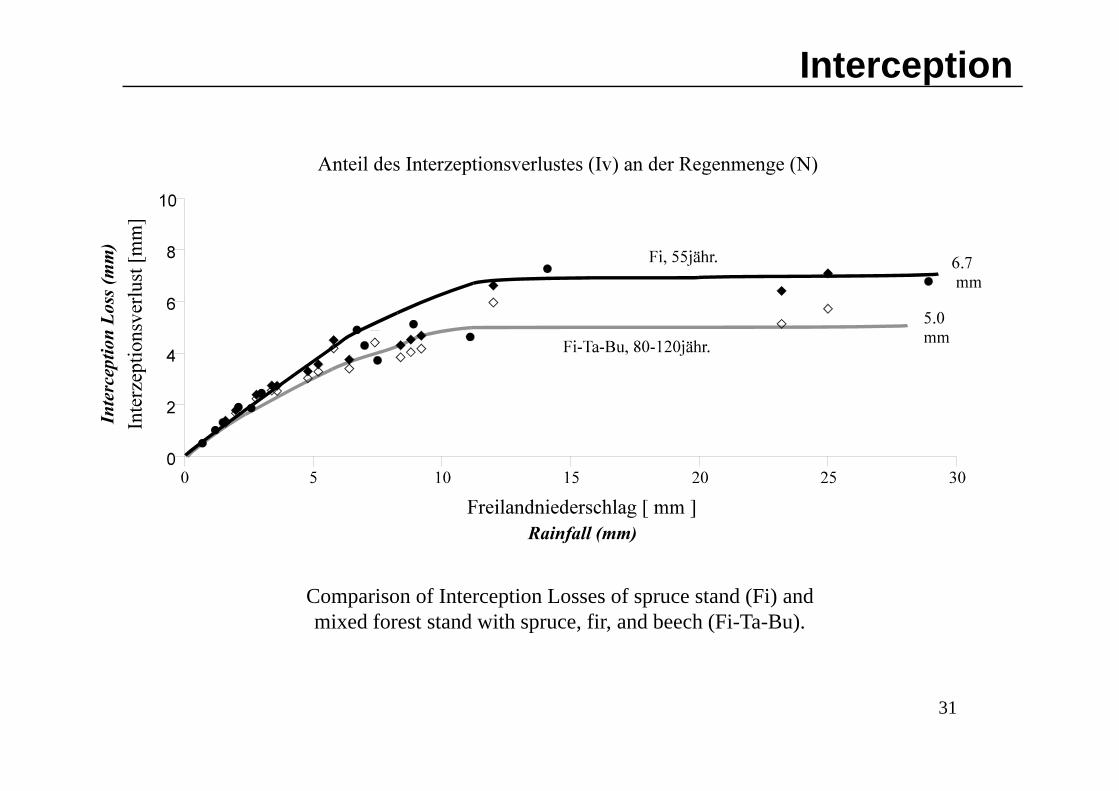
Interception
Comparison of Interception Losses of spruce stand (Fi) and mixed forest stand with spruce, fir, and beech (Fi-Ta-Bu).
Rainfall (mm)
Inte
rcep
tion
Loss
(mm
)
31

Runoff / Discharge
The portion of precipitation that appears in surface streams is called runoff. Runoff is flow from a drainage basin or watershed that appears in surface streams. It generally consists of the flow that is unaffected by artificial diversions, storages or other works that society might have on or in a stream channel. The flow is made up partly of precipitation that falls directly on the stream , surface runoff that flows over the land surface and through channels, subsurface runoff that infiltrates the surface soils and moves laterally towards the stream, and groundwater runoff from deep percolation through the soil horizons. Part of the subsurface flow enters the stream quickly, while the remaining portion may take a longer period before joining the water in the stream. When each of the component flows enter the stream, they form the total runoff. The total runoff in the stream channels is called streamflow and it is generally regarded as direct runoff or/and base flow.
Def. from National Weather Service (http://www.nwrfc.noaa.gov/info/water_cycle/hydrology.cgi)
32

Runoff / Discharge
Measurement of RUNOFF
• Flow velocity = f(rotation frequence)• Discharge = f(water level)
• Relation between water level versus discharge(rating curve / stage-discharge relation)
• Applicable also for big rivers• Temporal measurements of velocities required
Principles:Measurement of vertical distribution of flow velocities(aus Österr. Normungsinstitut, 1999)
(aus Nachtnebel,2001)
Discharge:Volume of water passing a river (or channel) cross-section in unit time.
Cross-Section Rating Curve
33

Wehr / Weir
34

Ermittlung des Wasserstandes
• Lattenpegel / Staff Gauge• Schwimmer / Float• Druckluftpegel / Bubble Gauge• Digitale Drucksonde / Pressure Probe
...........• Am besten in einem Nebenschacht, wo
das Wasser ruhig ist.
Gauging Station
(aus Nachtnebel,2001)
Water depth / Stage
35
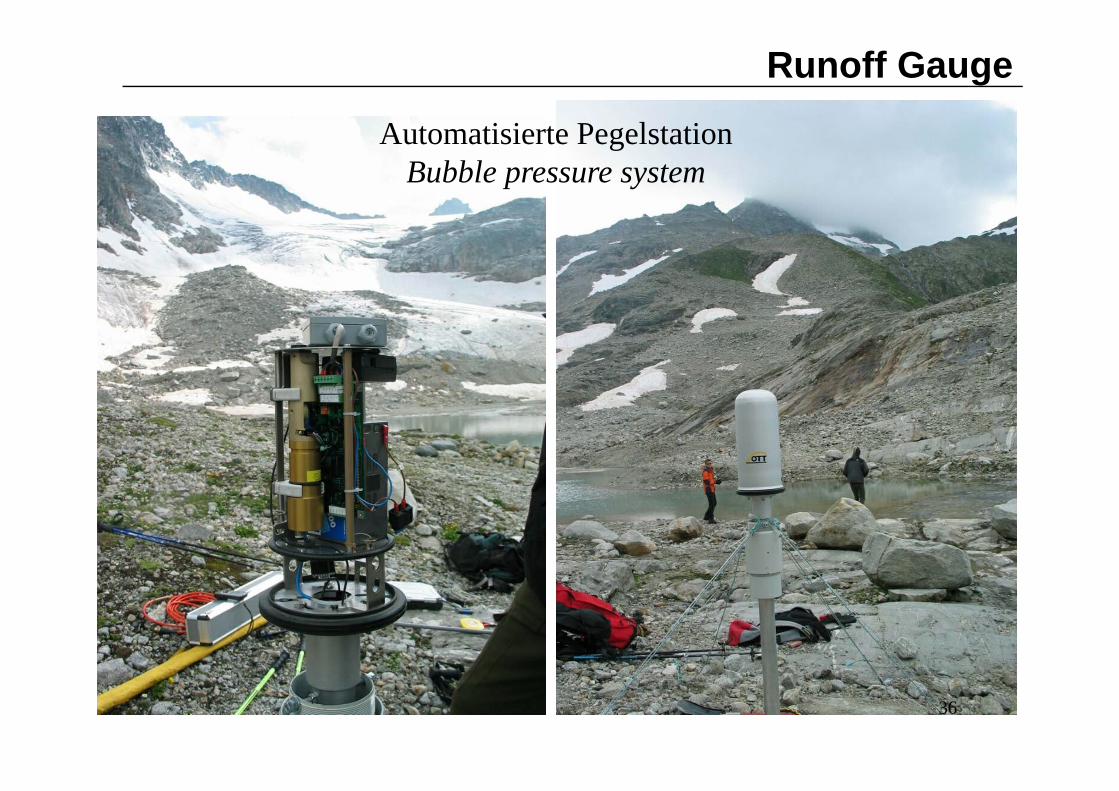
Runoff Gauge
Automatisierte PegelstationBubble pressure system
36

Discharge MeasurementMeßflügel / Propeller Velocimeter
37

Discharge Measurement
Induktives Messgerät / Velocimeter
Leitfähigkeitsmessung / Salt dilution methodElectric conductivity
38

Discharge Measurement
Pegelschlüssel / Rating CurveGoldbergbach (Sonnblick)
0
200
400
600
800
1000
1200
1400
1600
1800
0 0,05 0,1 0,15 0,2 0,25 0,3 0,35 0,4 0,45
Pegelstand [m] (schwarz=2002; rot=2003; blau=2004; grün=2005; orange=2006)
Abflu
ss [
l/s]
39
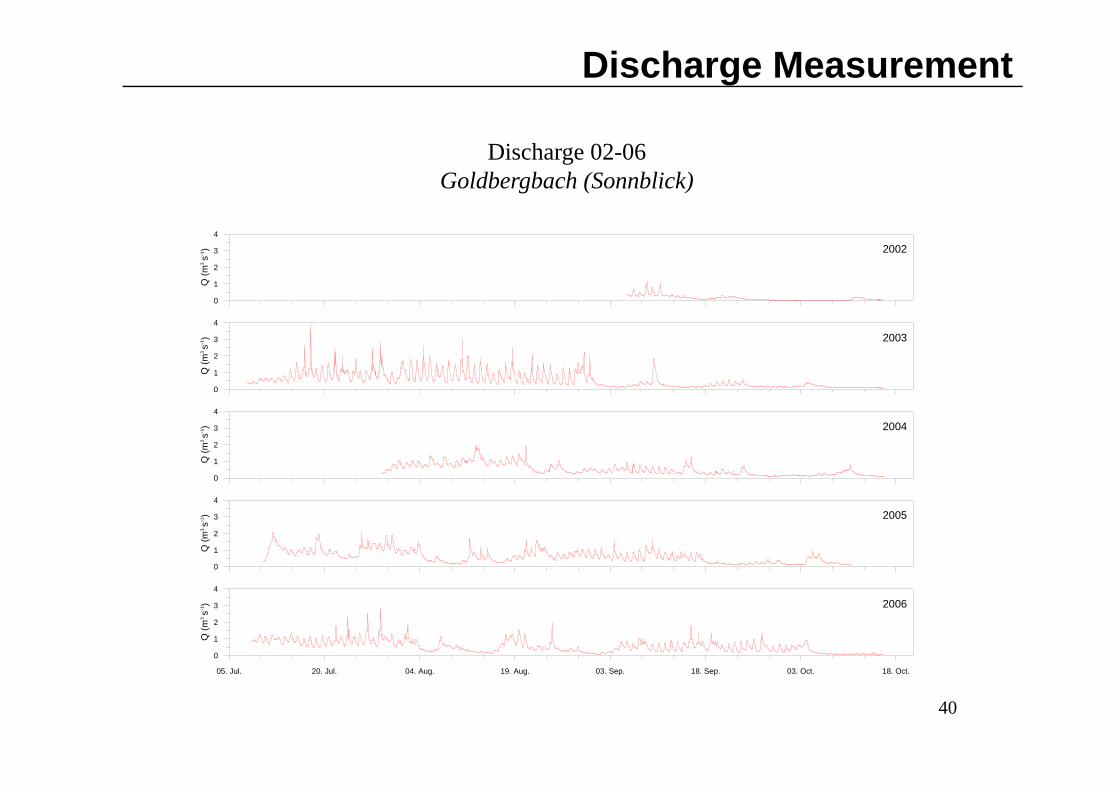
Discharge Measurement
Discharge 02-06Goldbergbach (Sonnblick)
0
1
2
3
4
Q (m
3 s-1
)
0
1
2
3
4
Q (m
3 s-1
)
0
1
2
3
4
Q (m
3 s-1
)
05. Jul. 20. Jul. 04. Aug. 19. Aug. 03. Sep. 18. Sep. 03. Oct. 18. Oct.
0
1
2
3
4
Q (m
3 s-1
)
0
1
2
3
4
Q (m
3 s-1
) 2002
2003
2004
2005
2006
40

References
Course Materials by Internet:http://www.boku.ac.at/iwhw/LVA816335/
International Glossary of Hydrology (from UNESCO)http://webworld.unesco.org/water/ihp/db/glossary/glu/aglu.htm
Glossary of Soil Science Terms (from SSS of America)https://www.soils.org/publications/soils-glossary/
US Weather Service - River Forecast Centerhttp://www.nwrfc.noaa.gov/info/water_cycle/hydrology.cgi
Page 41